
The Daily Shot: 06-Apr-22
• The United States
• The United Kingdom
• The Eurozone
• Asia – Pacific
• China
• Emerging Markets
• Cryptocurrency
• Commodities
• Energy
• Equities
• Credit
• Rates
• Food for Thought
The United States
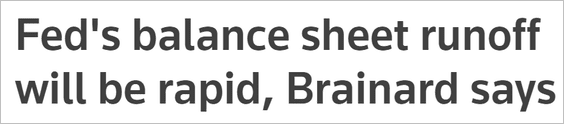
1. Fed Governor Lael Brainard said the central bank could start the balance sheet roll-off as soon as May and move at “a rapid pace.” She also seems to be on board with 50 bps rate hikes.
 Source: Reuters Read full article
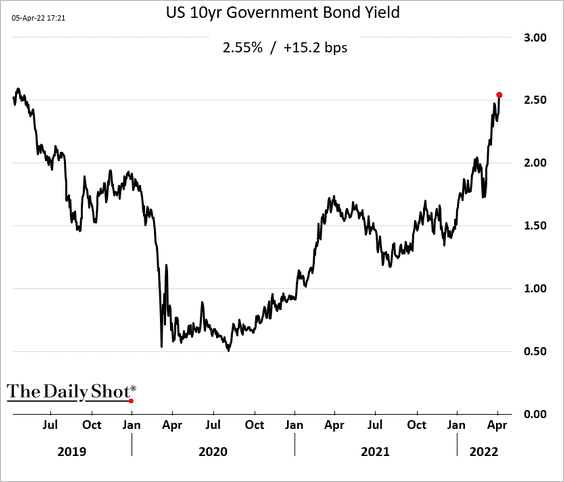
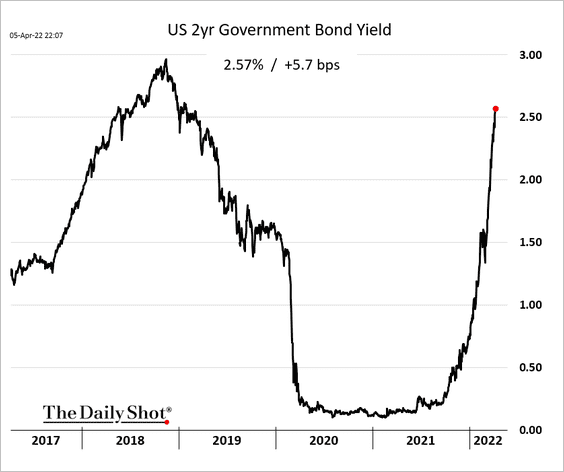
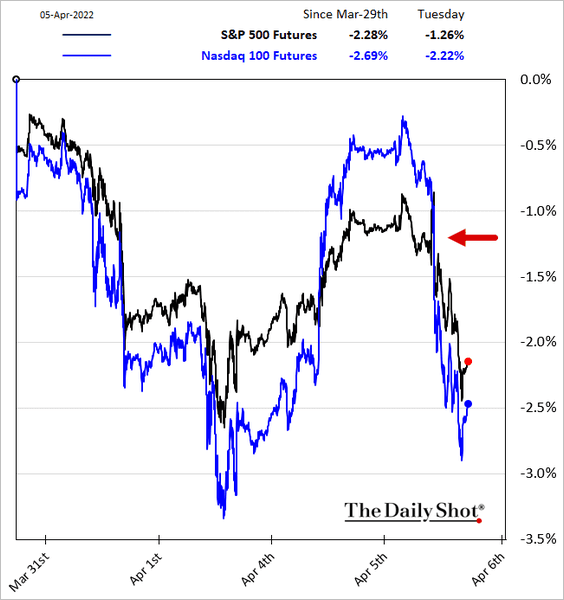
Since the markets view Brainard as a dove, these comments were particularly impactful. The goal here is to tighten financial conditions quickly, as the Fed plays catch-up on the inflation front. Treasury yields surged.
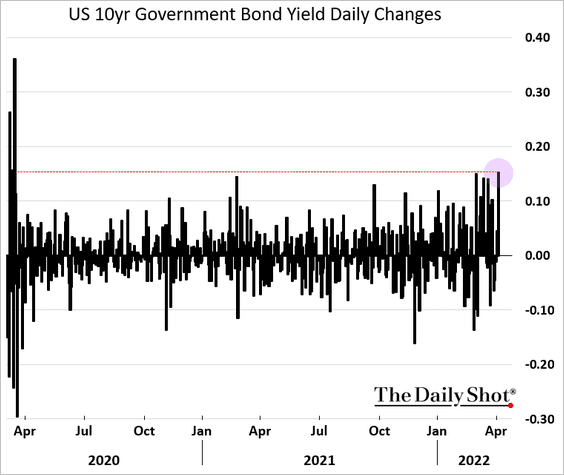
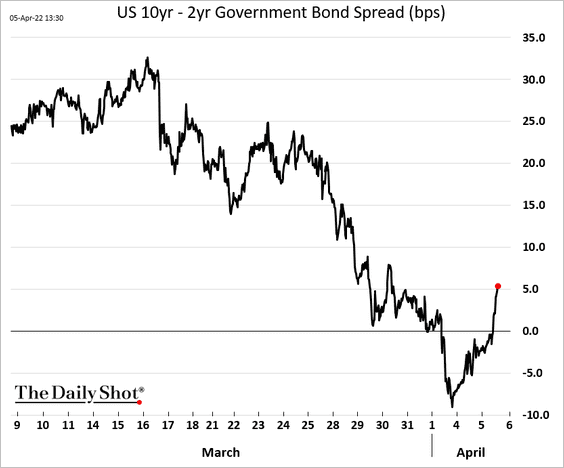
• News of faster quantitative tightening hit longer-dated bonds hard. It was certainly one way to pry the yield curve out of inversion.
• Treasury yields advanced further this morning, with the 2yr note blasting past 2.5%.
• Real yields jumped as well, …
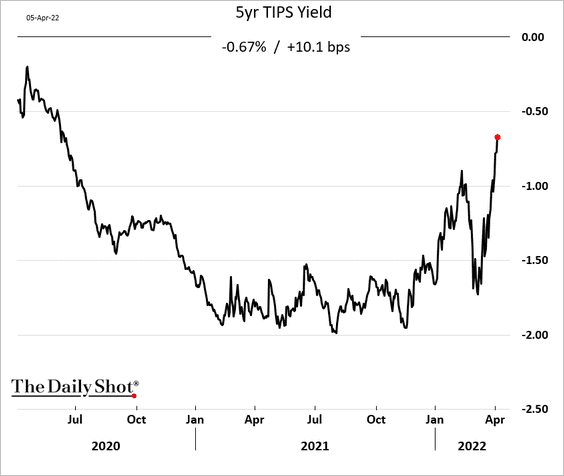
… which the stock market could no longer ignore.
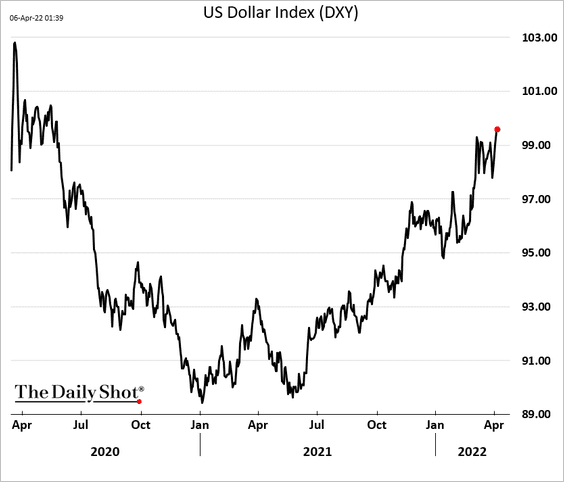
• The dollar climbed in response to hawkish comments from the Fed, with the DXY index approaching 2-year highs.
 Source: Reuters Read full article
——————–
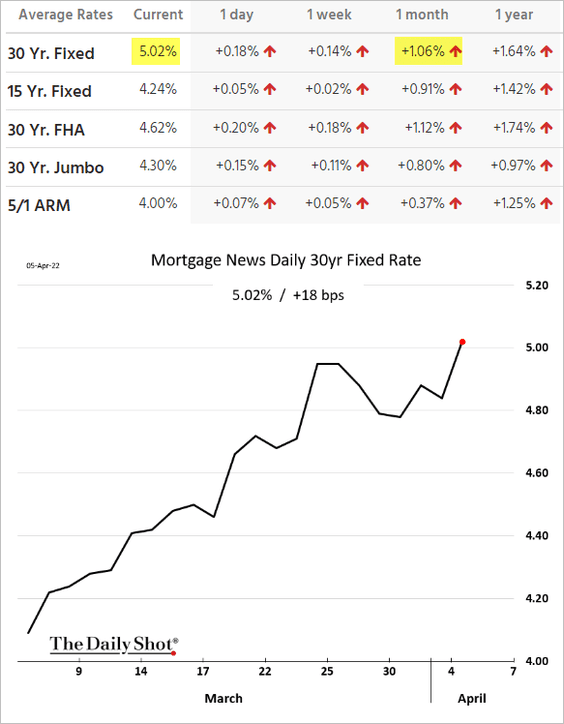
2. According to Mortgage News Daily, the 30-year mortgage rate hit 5%.
 Source: Mortgage News Daily Read full article
Mortgage rates have risen by over 100 basis points in a month.
 Source: Mortgage News Daily
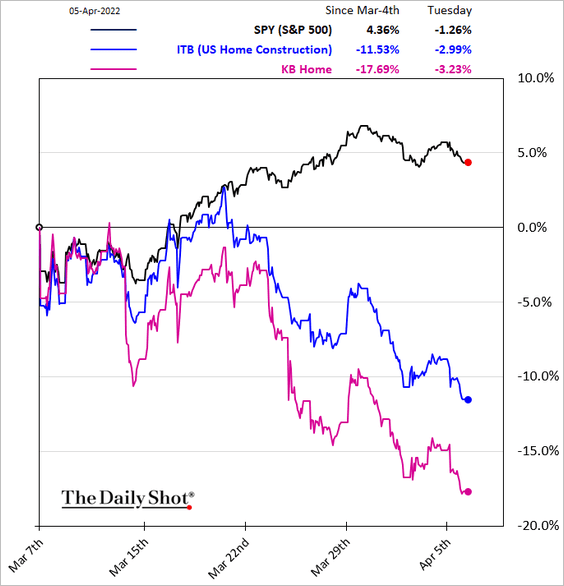
Housing-related shares tumbled.
——————–
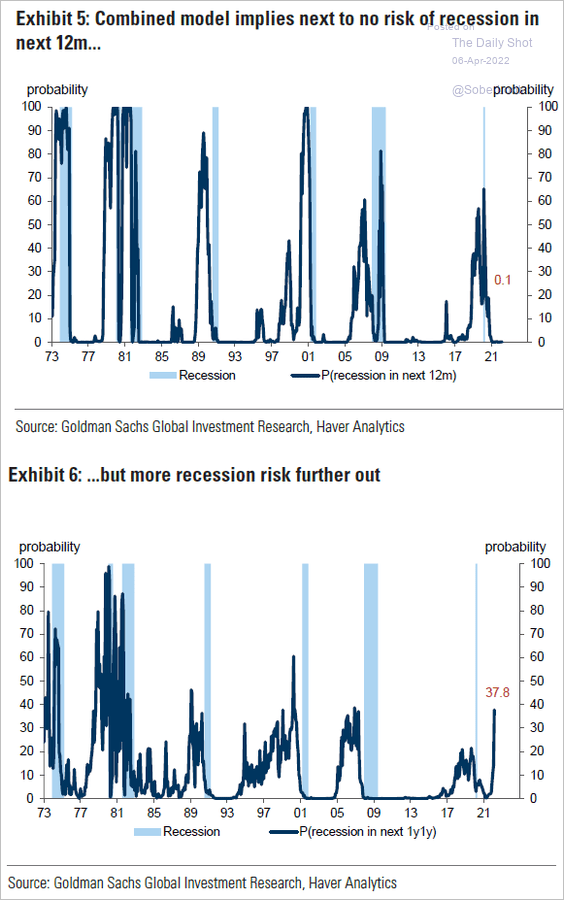
3. The probability of a recession within the next 12 months remains low. But the odds are much higher 2-3 years out.
 Source: Goldman Sachs; @patrick_saner
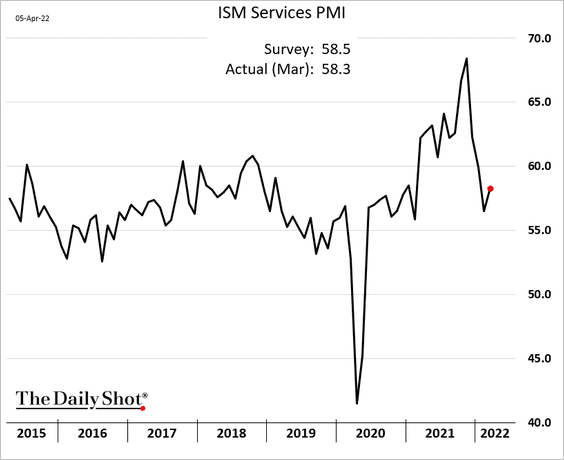
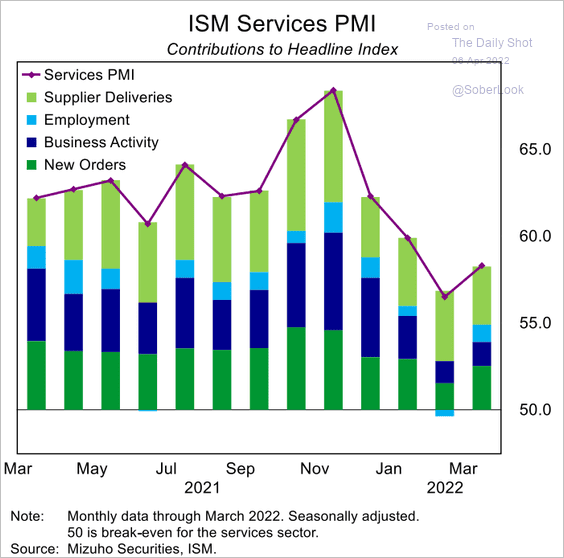
4. The ISM Services PMI was in line with expectations as service firms saw a post-omicron bounce.
 Source: Mizuho Securities USA
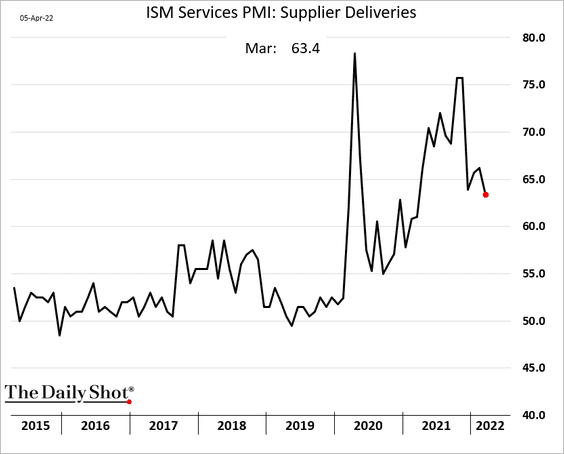
Supply bottlenecks are starting to moderate.
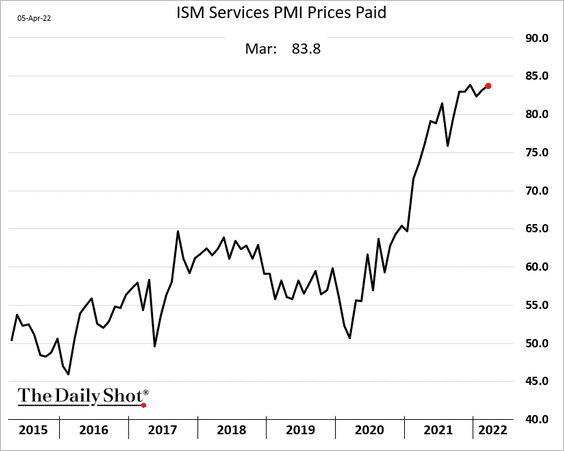
Price pressures, however, remain extreme.
——————–
5. The trade deficit held steady (at January’s record), …
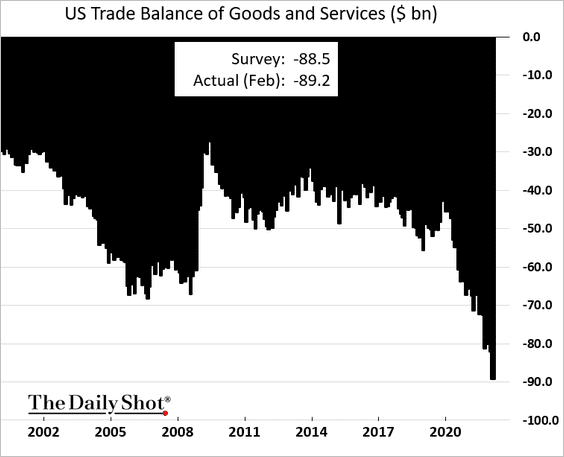
… as imports continue to outpace exports.
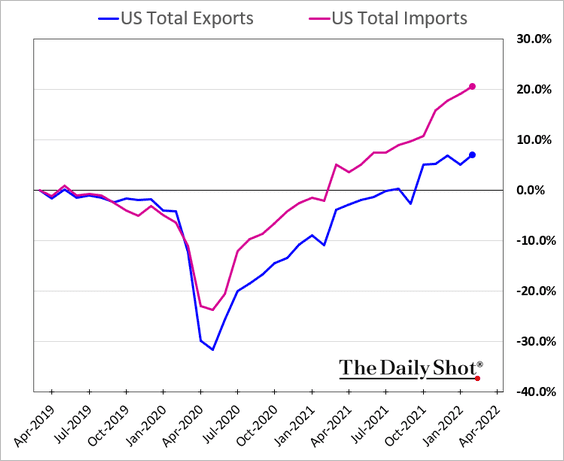
Here are the inflation-adjusted trends.
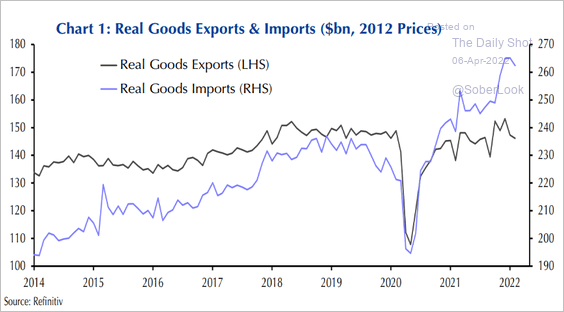 Source: Capital Economics
——————–
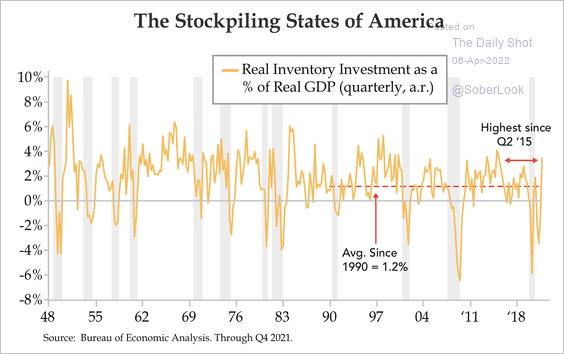
6. The recent inventory build has been substantial as businesses tried to overcome supply shortages. Will we see an inventory overhang if consumption slows substantially?
 Source: Quill Intelligence
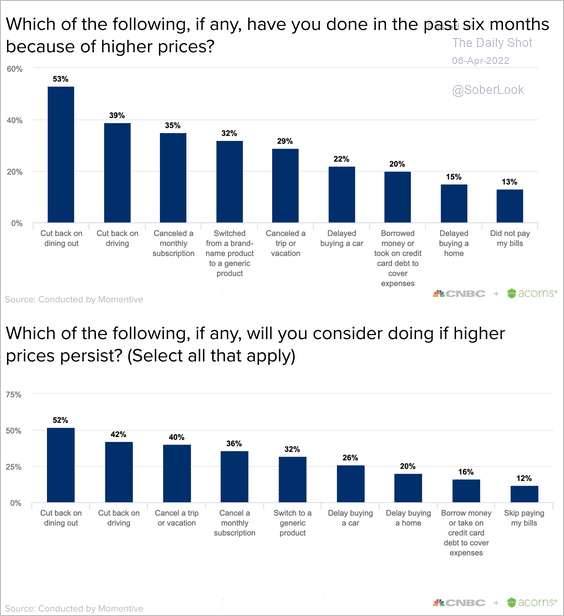
• Indeed, some consumers are becoming more cautious.
 Source: CNBC Read full article
• For now, strong household balance sheets are expected to be a tailwind for spending (2 charts).
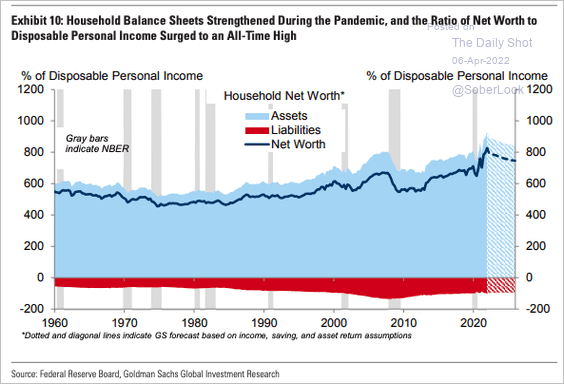 Source: Goldman Sachs; @SamRo
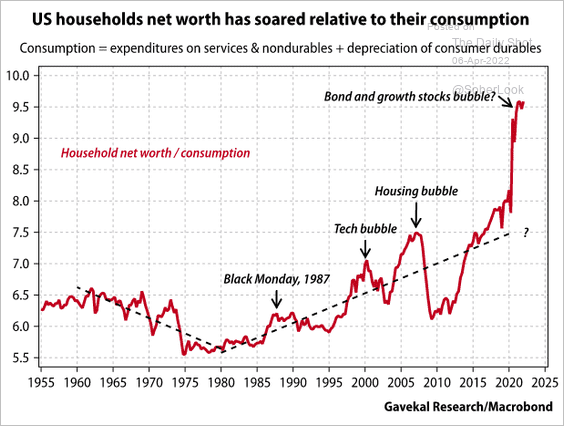 Source: Gavekal Research
——————–
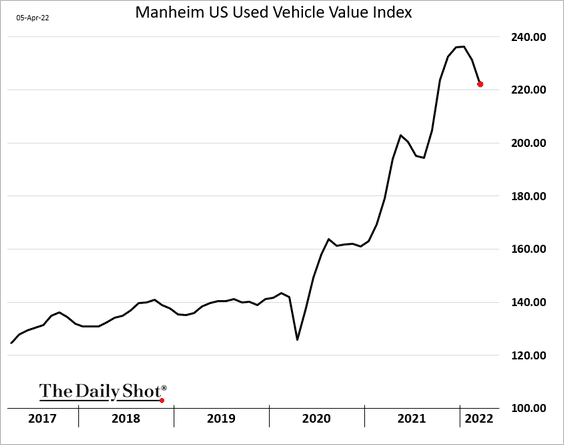
7. Used vehicle prices are starting to retreat.
Back to Index
The United Kingdom
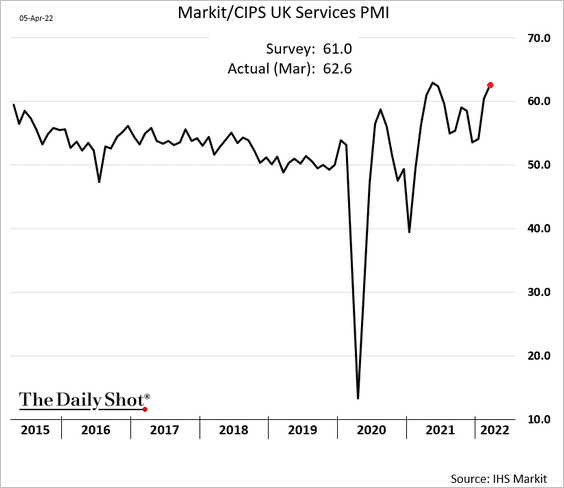
1. The updated March services PMI was even stronger than the earlier report.
2. Manufacturing supply bottlenecks have been easing.
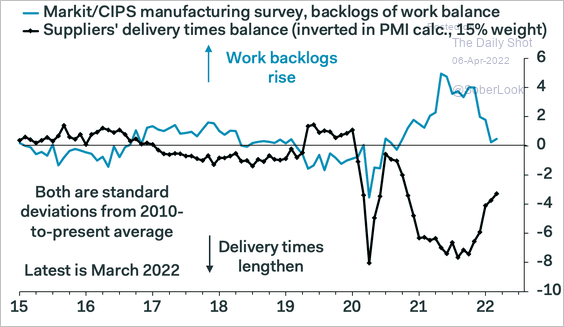 Source: Pantheon Macroeconomics
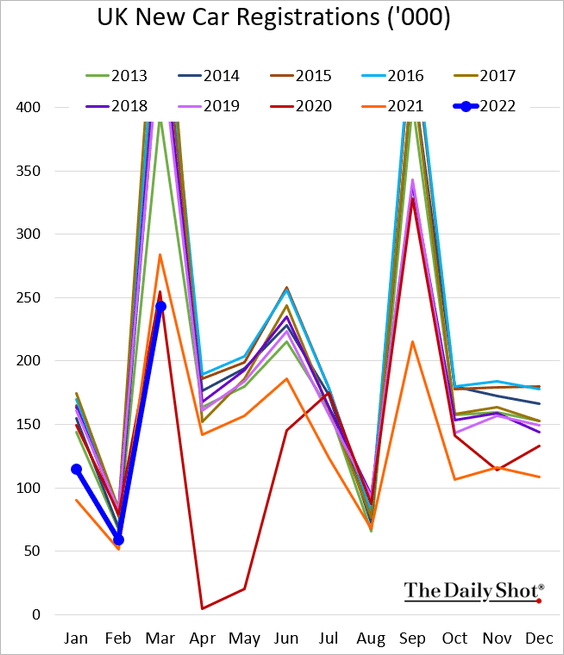
3. Car registrations are at multi-year lows for this time of the year.
Back to Index
The Eurozone
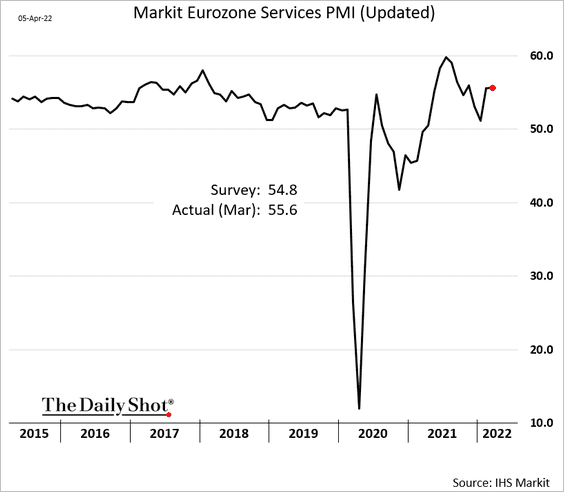
1. Service-sector activity was resilient last month, with the March PMI revised higher.
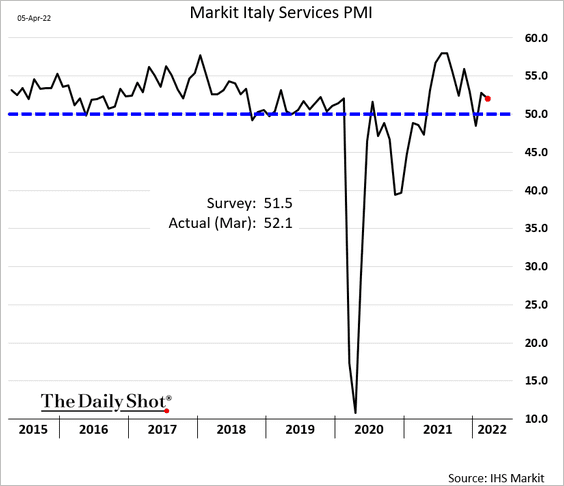
Here is Italy’s services PMI.
——————–
2. Next, we have some updates on France.
• The headline services PMI has been very strong, but the outlook is less upbeat (2nd panel).
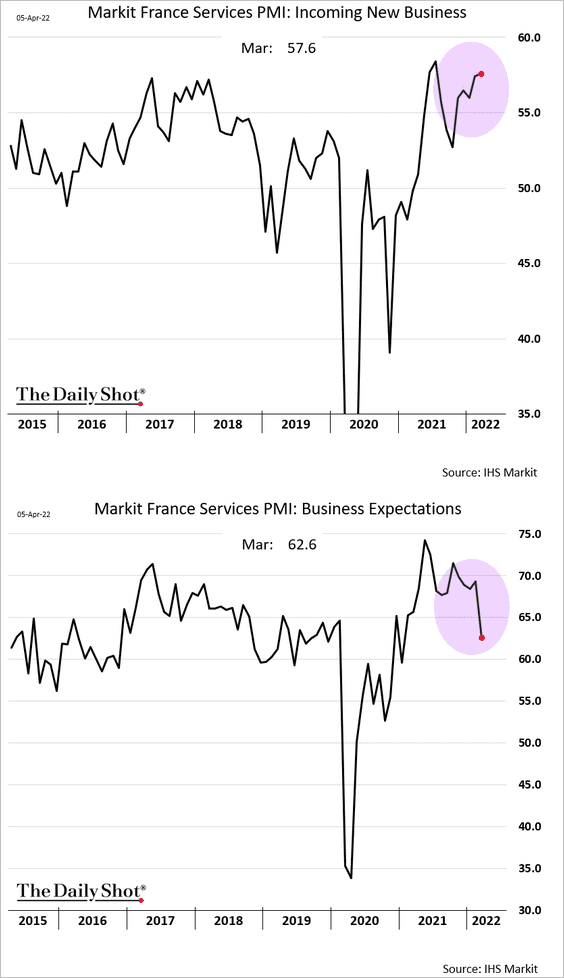
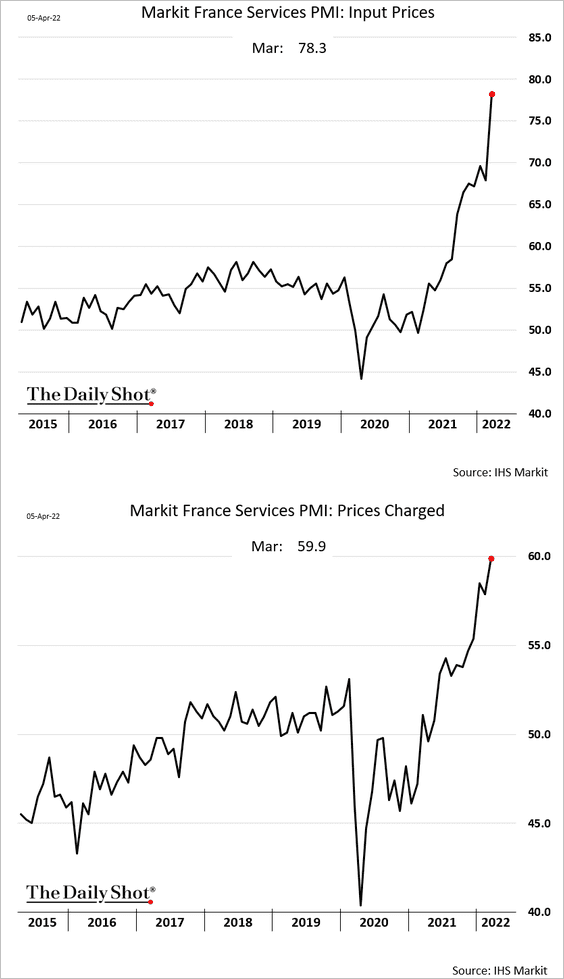
Service-sector price pressures are hitting extreme levels.
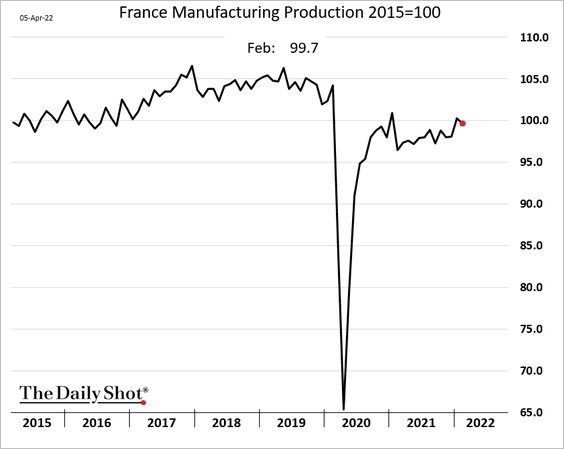
• French manufacturing output ticked lower in February.
• High corporate debt makes French firms more vulnerable to rising rates.
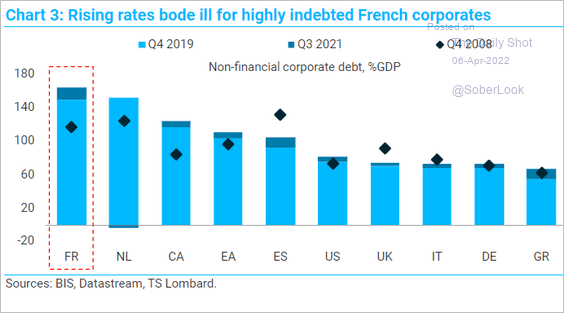 Source: TS Lombard
• Presidential election polls are tightening.
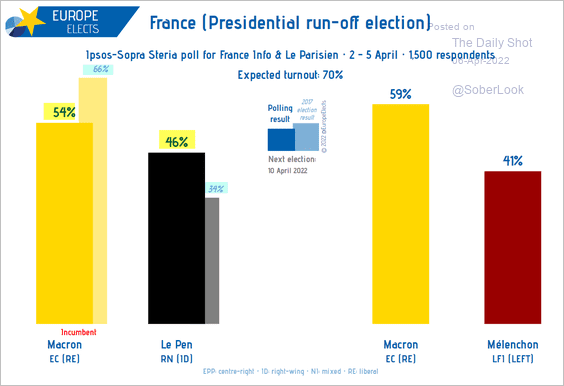 Source: @EuropeElects Read full article
Here are the betting market odds.
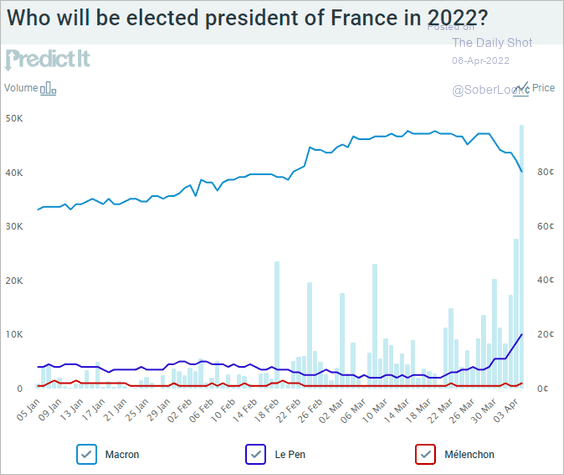 Source: @PredictIt
Below are a couple of charts showing approval ratings.
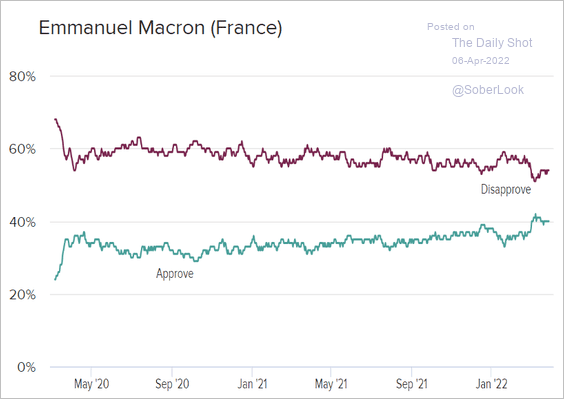 Source: Morning Consult
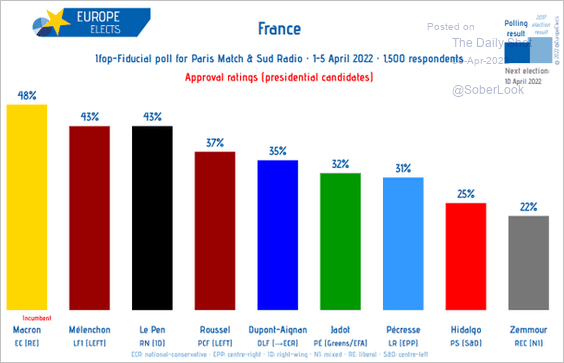 Source: @EuropeElects Read full article
——————–
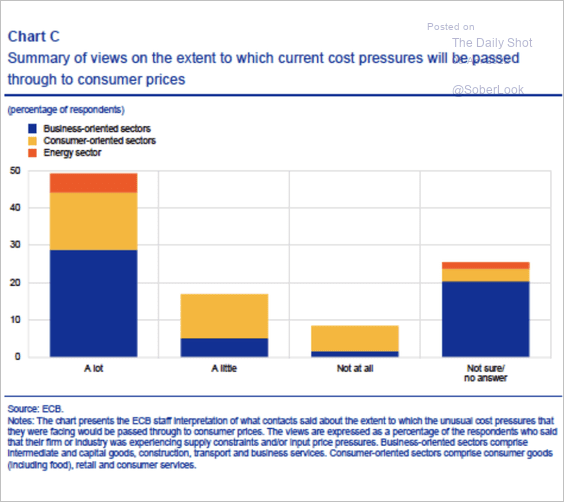
3. Most Eurozone businesses plan to raise prices to reflect higher costs.
 Source: ECB
Back to Index
Asia – Pacific
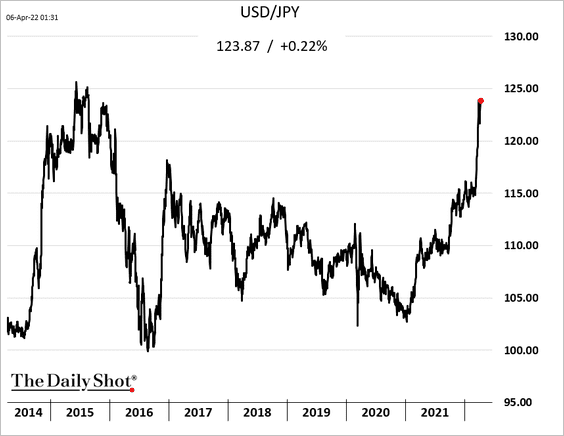
1. Dollar-yen hit another multi-year high after the Fed’s hawkish comments.
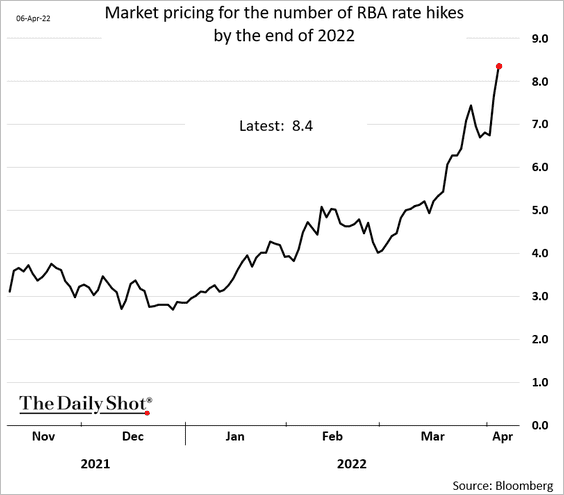
2. The market now expects the RBA to hike rates eight or nine times this year (25 bps hikes).
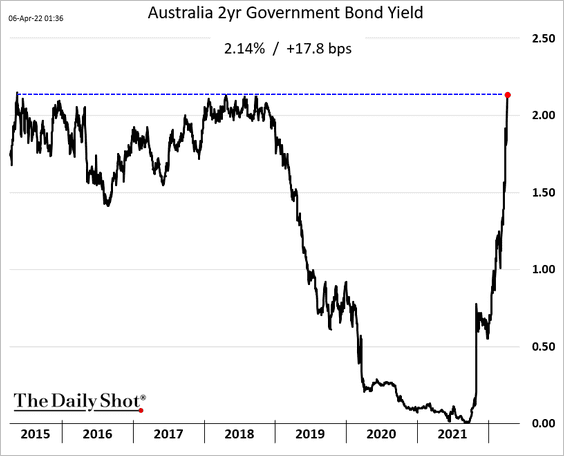
Australia’s 2yr yield hit the highest level since 2015.
Back to Index
China
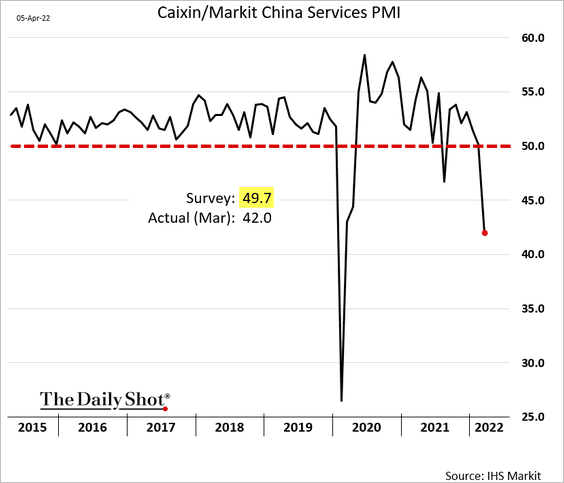
1. Service-sector activity plunged last month amid lockdowns.
Hong Kong’s business activity also tumbled.
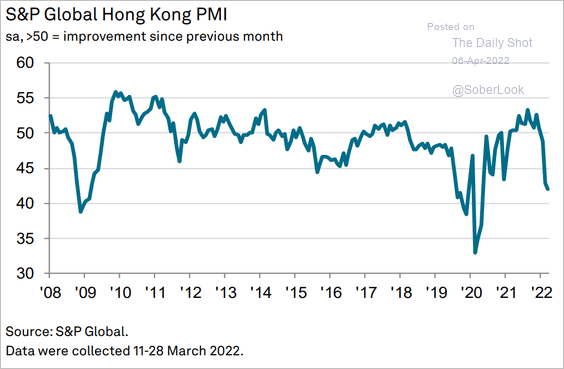 Source: IHS Markit
——————–
2. Fixed asset investment and retail sales continue to lag industrial output.
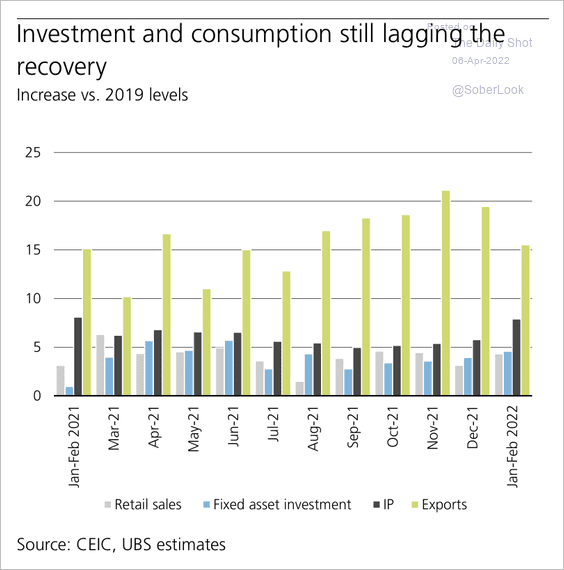 Source: UBS Research
3. Eastern coastal regions have seen a higher share of credit growth.
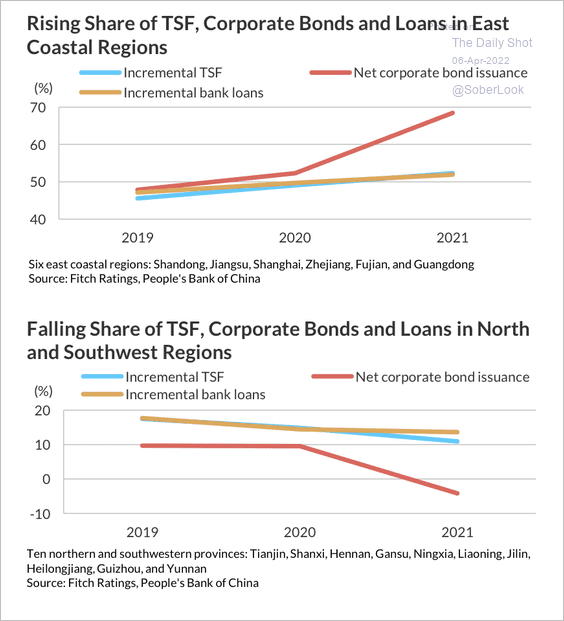 Source: Fitch Ratings
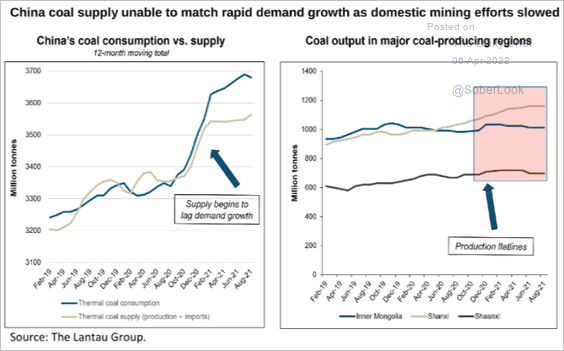
4. Coal demand is increasingly outpacing production.
 Source: Oxford Institute for Energy Studies
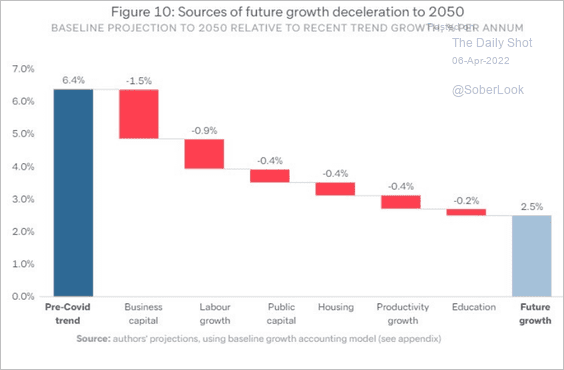
5. What are the drivers of decelerating growth in the decades ahead?
 Source: Lowy Institute
Back to Index
Emerging Markets
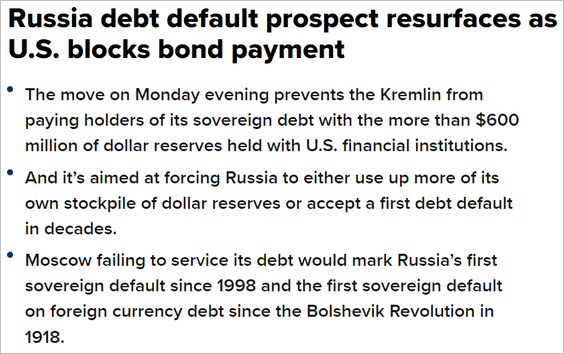
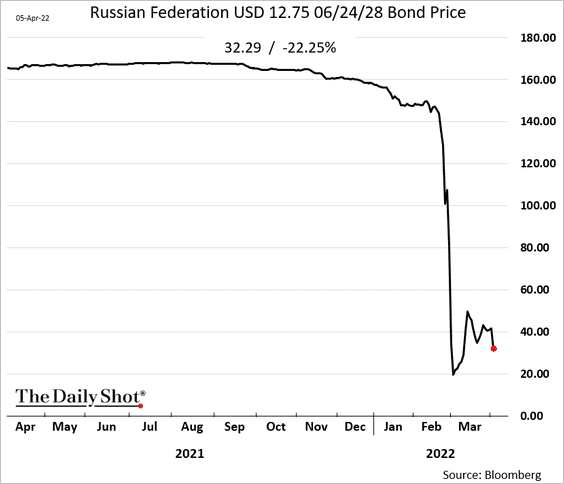
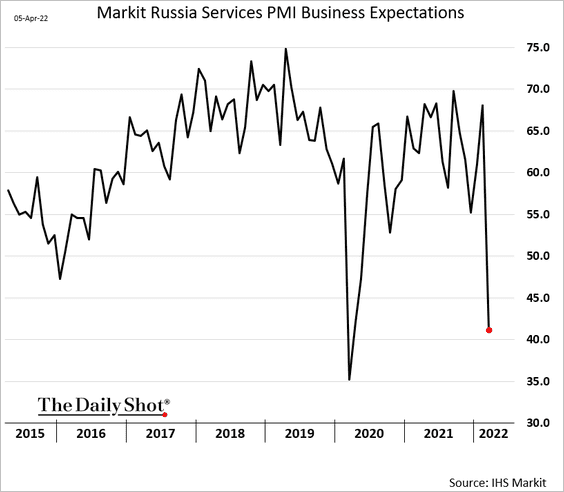
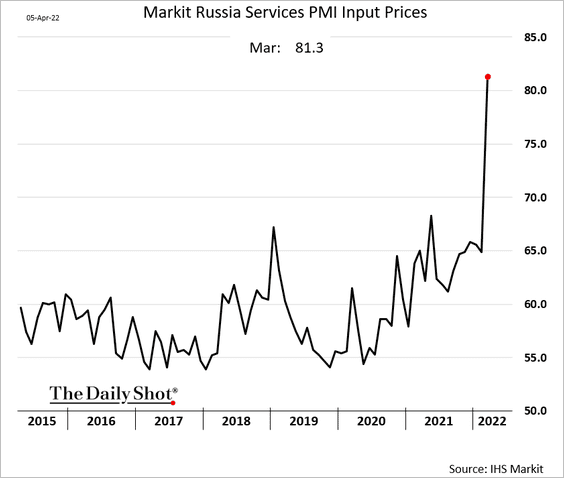
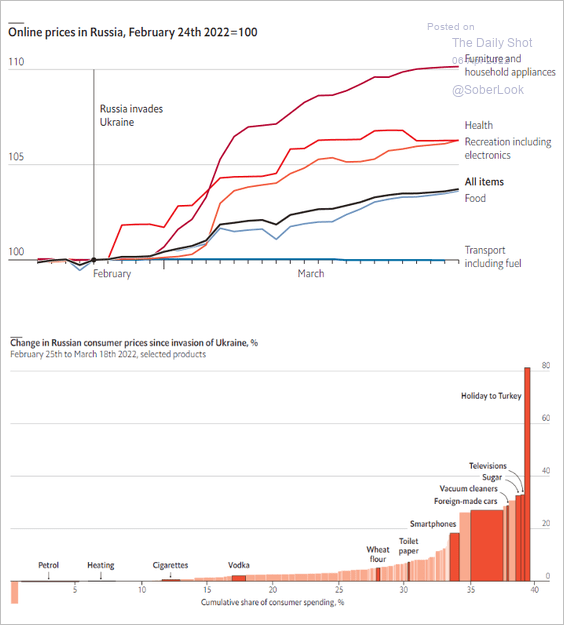
1. Let’s begin with Russia.
• The US Treasury is making it harder for Russia to keep paying on its dollar debt.
 Source: CNBC Read full article
Bond prices dropped.
• Service-sector business activity sank last month, …
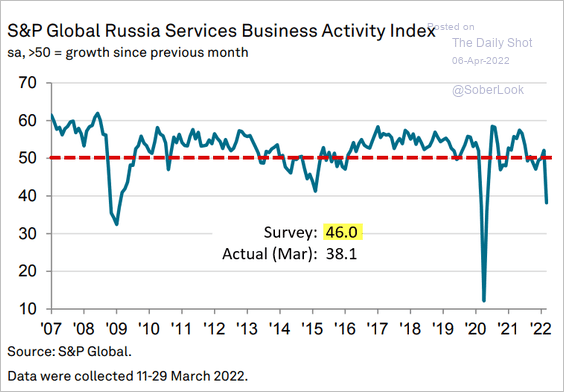 Source: IHS Markit
… with outlook deteriorating sharply.
Price pressures soared.
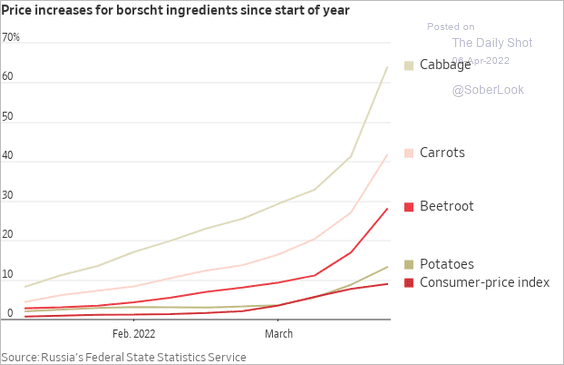
• Consumer prices are climbing across the board.
 Source: The Economist Read full article
 Source: @WSJ Read full article
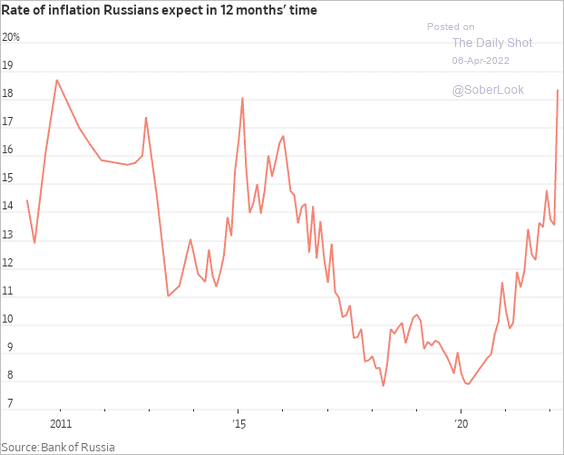
Here is an index of inflation expectations.
 Source: @WSJ Read full article
——————–
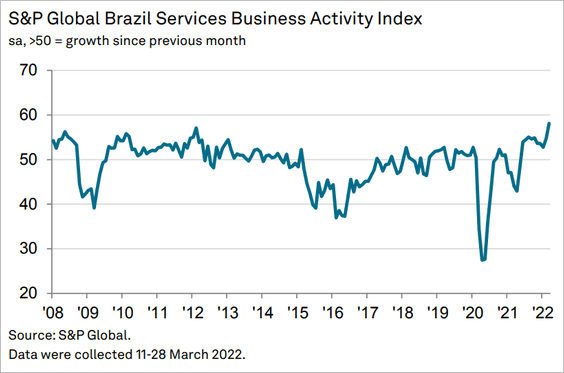
2. Brazil’s service-sector PMI hit a new high.
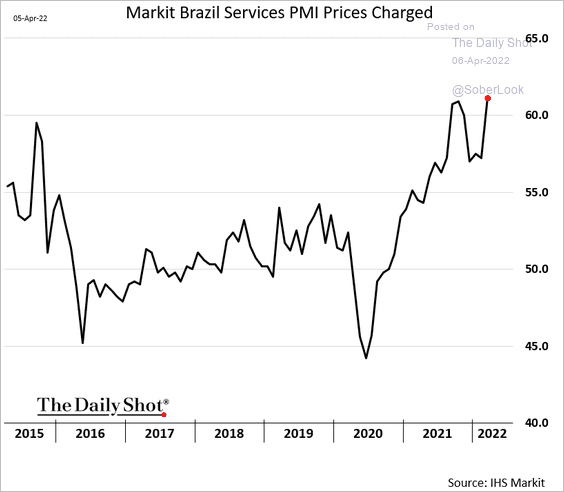
Companies are rapidly boosting prices.
 Source: IHS Markit
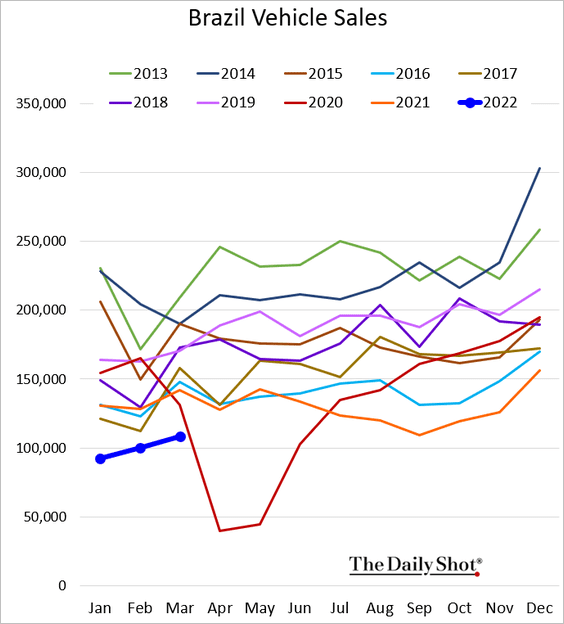
Brazil’s vehicle sales remain soft.
——————–
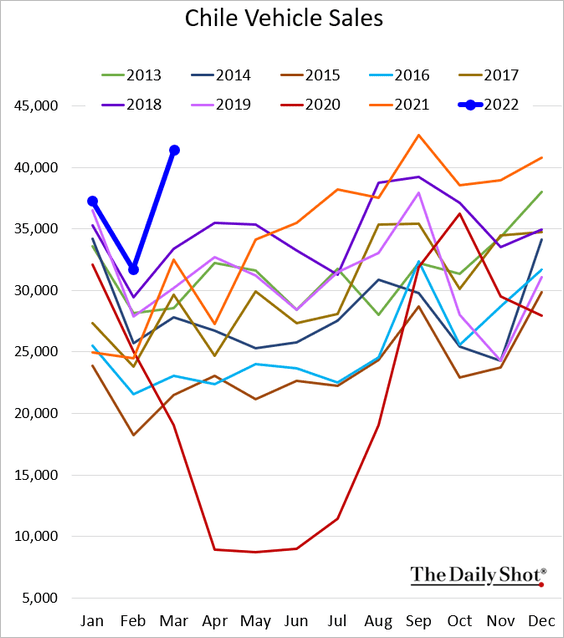
3. Chile’s vehicle sales surged last month.
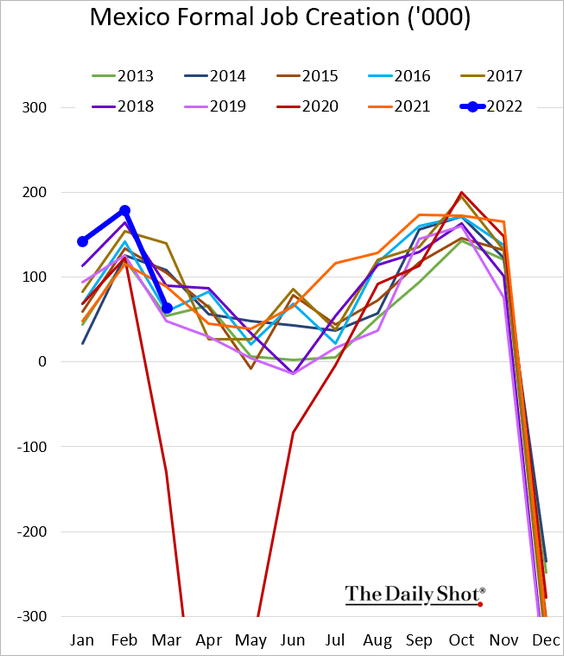
4. Mexico’s formal job creation deteriorated in March.
5. These scatterplots show the risk-reward profile for LatAm assets, according to Numera Analytics.
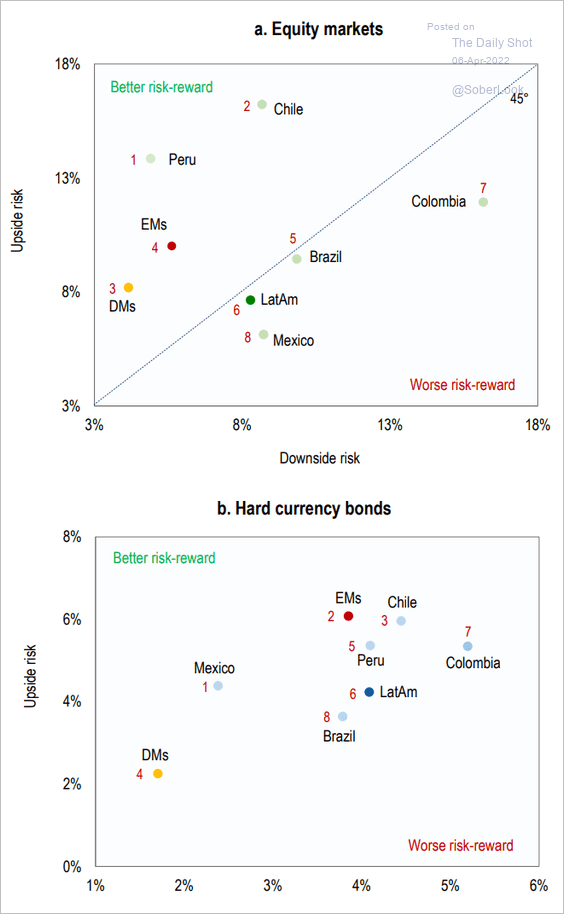 Source: Numera Analytics
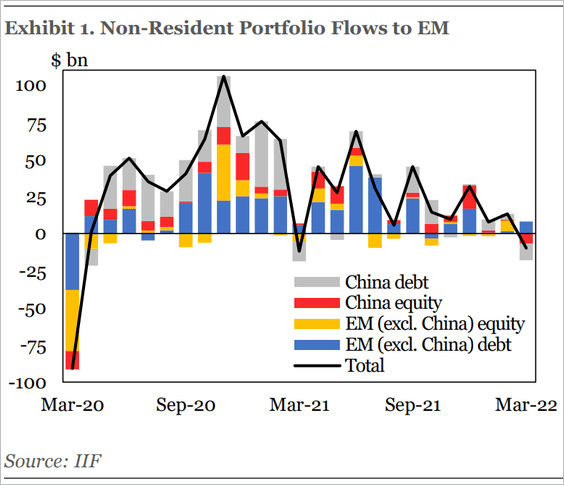
6. EM ex. China portfolio flows were positive last month.
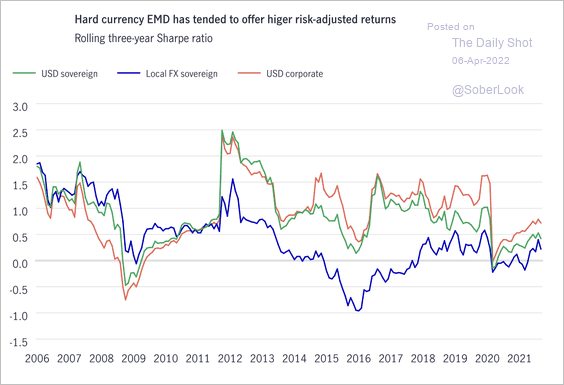
7. Dollar-denominated emerging market bonds have offered better risk/reward profiles over the past decade.
 Source: John Hancock Investment Managemen Read full article
8. Inflation-induced social unrest is spreading.
• Peru:
 Source: Reuters Read full article
• Sri Lanka:
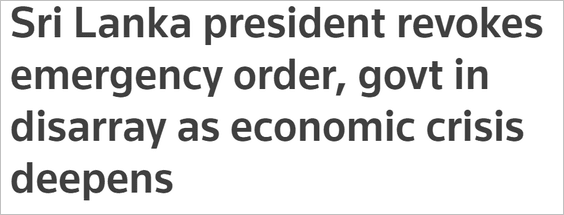 Source: Reuters Read full article
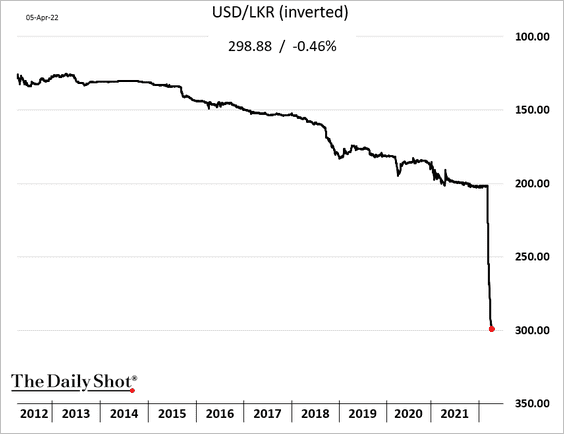
By the way, here is the Sri Lankan rupee.
Back to Index
Cryptocurrency
1. Bitcoin is declining from overbought levels with support at $43K.
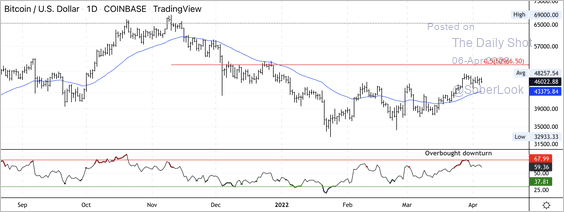 Source: CoinDesk Read full article
2. The average bitcoin funding rate, or the cost to hold long positions in the perpetual futures market, has remained neutral/negative so far this year. That suggests there is a more balanced demand for long and short positions.
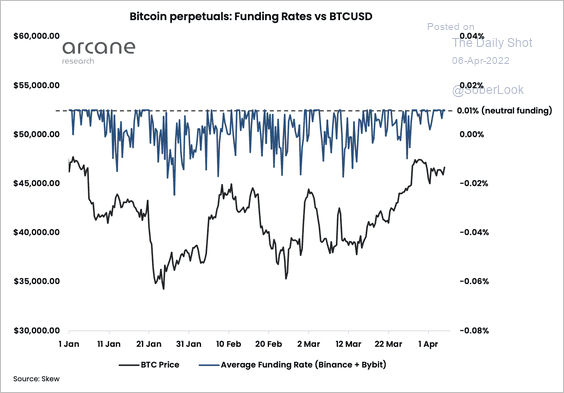 Source: Arcane Research Read full article
3. This chart shows bitcoin futures positioning by investor type.
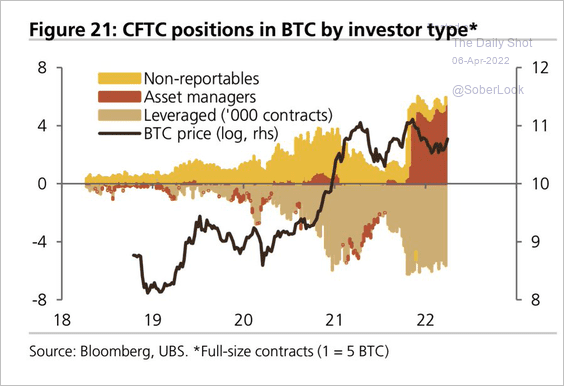 Source: UBS; @WallStJesus
4. The average volume of BTC supply held by long-term holder (whale) addresses has plateaued, which could point to slowing demand.
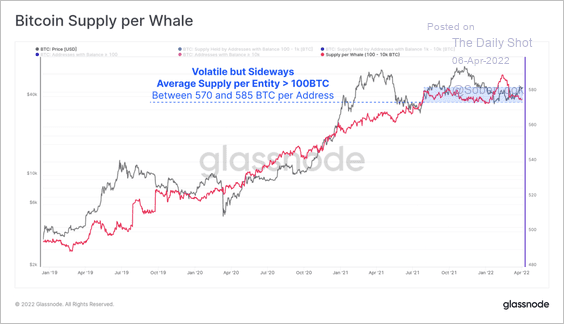 Source: @glassnode
5. Here is an updated look at crypto donations to Ukraine.
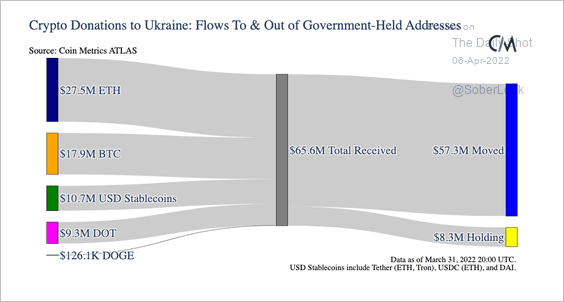 Source: @coinmetrics
Crypto trading volume in Ukrainian markets remains elevated.
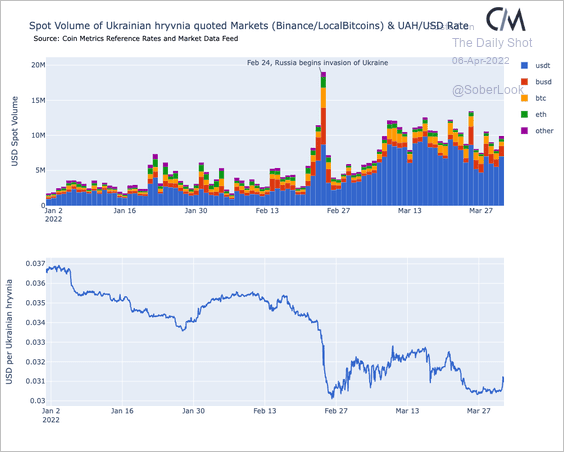 Source: @coinmetrics
——————–
6. Daily sales volumes on OpenSea, the largest NFT marketplace on Ethereum, have started to cool.
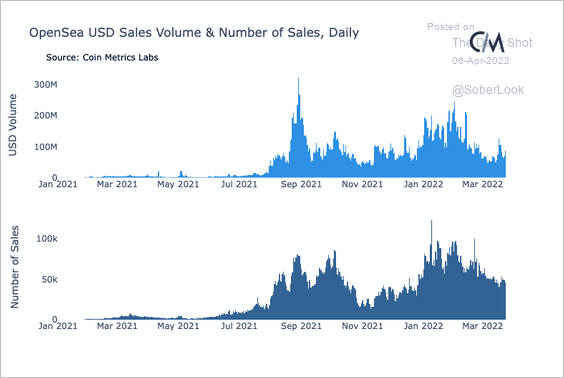 Source: @coinmetrics
Back to Index
Commodities
1. The copper/gold ratio is testing long-term resistance. Will we see a breakout?
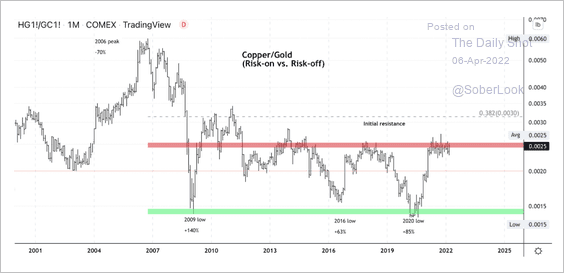 Source: Dantes Outlook
2. Despite surging agricultural commodity prices, US farmers are not happy. They are complaining about higher costs of inputs such as fertilizer.
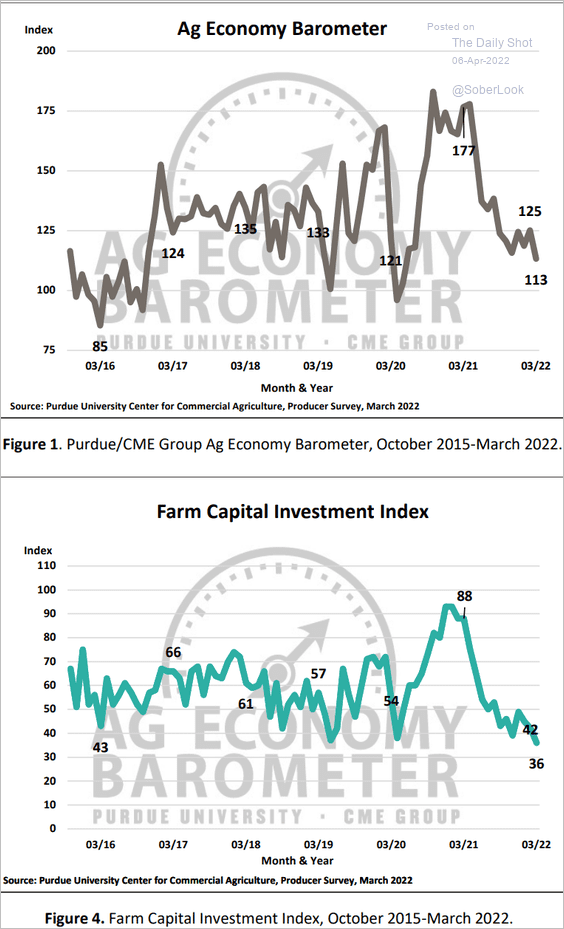 Source: Ag Economy Barometer
Back to Index
Energy
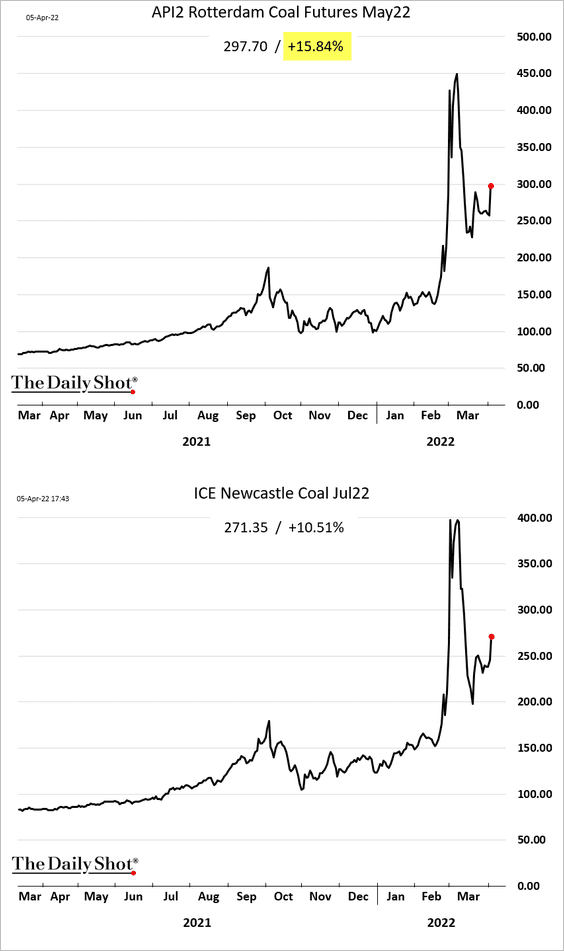
1. The EU is proposing sanctions on Russian coal. Futures rose sharply.
 Source: CNBC Read full article
——————–
2. This map shows existing and planned LNG facilities in Europe.
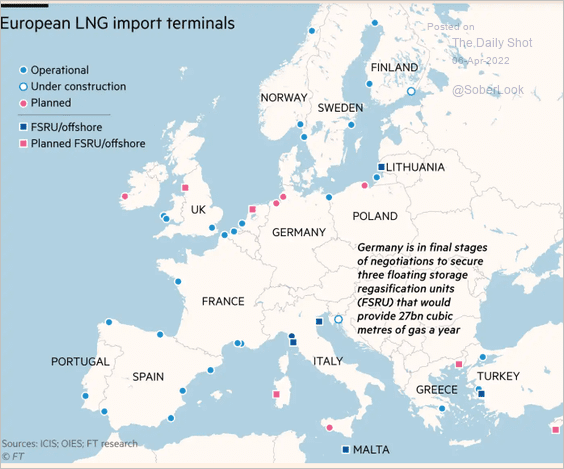 Source: @financialtimes Read full article
Back to Index
Equities
1. Declining ISM manufacturing index and the Fed tightening monetary policy is not a good combination for stocks.
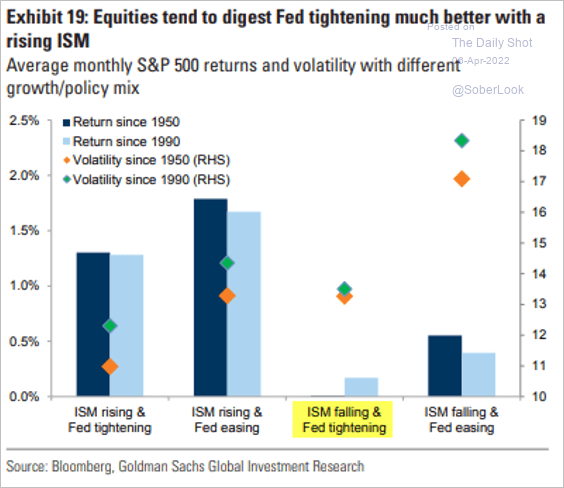 Source: Goldman Sachs; @patrick_saner
2. The S&P 500 full 2022 earnings projections keep getting upgraded.
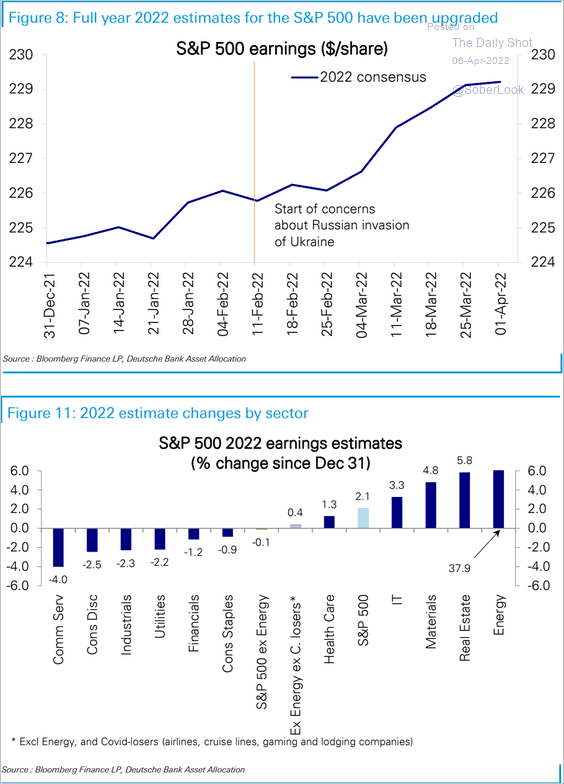 Source: Deutsche Bank Research
3. Companies that benefit from higher inflation have been underperforming over the past few days.
4. How does the stock market respond to turning points in consumer sentiment?
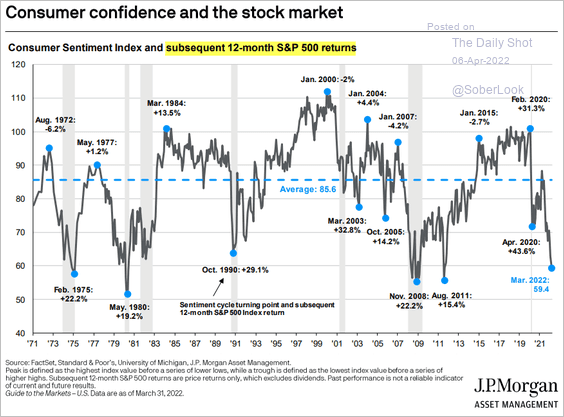 Source: J.P. Morgan Asset Management
5. Stock fund flows relative to bond funds have been very strong recently.
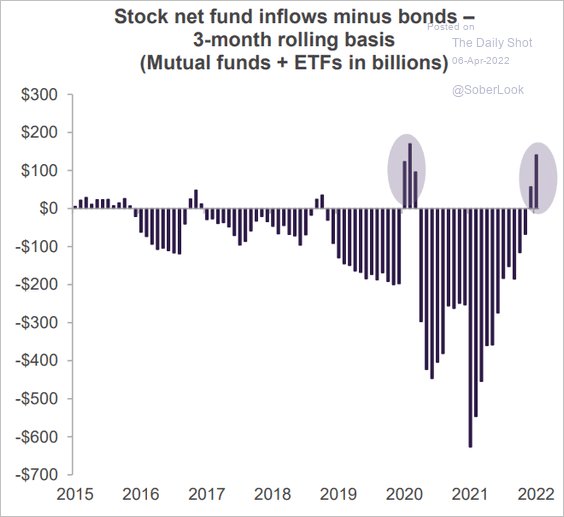 Source: Truist Advisory Services
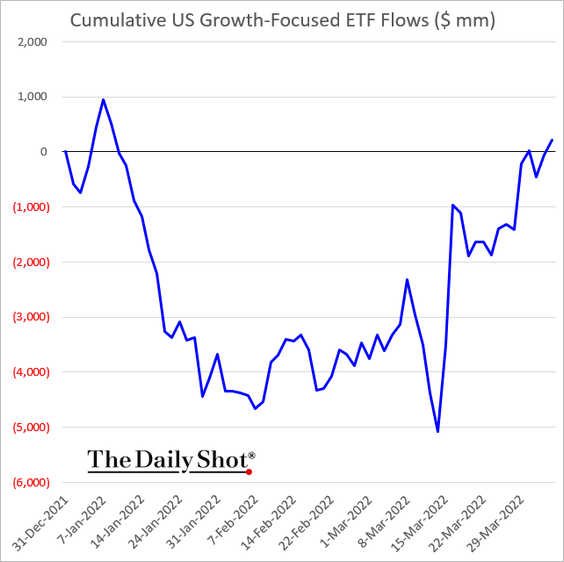
6. Year-to-date (cumulative) growth-focused equity ETF flows have recovered.
Back to Index
Credit
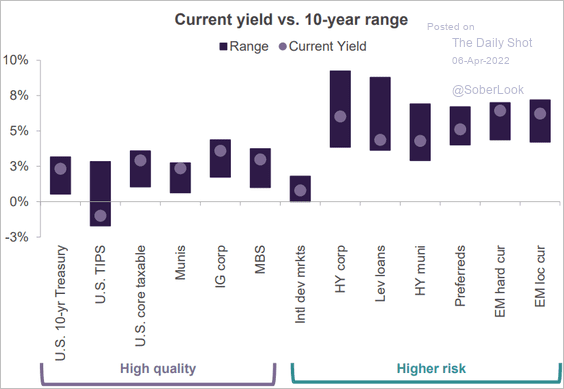
1. This chart shows debt yields relative to their ten-year ranges across fixed-income categories.
 Source: Truist Advisory Services
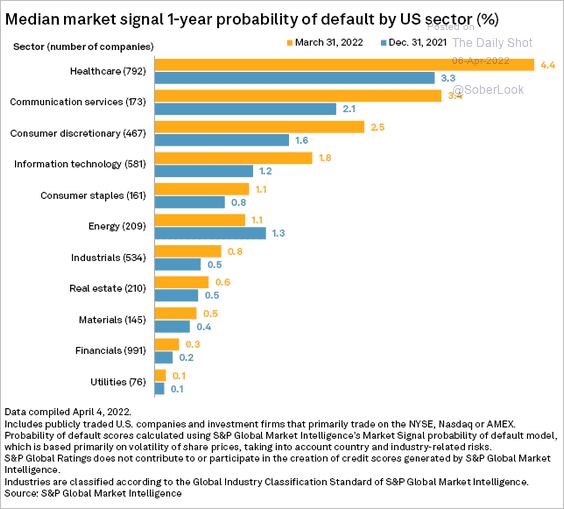
2. Default risk has increased in most sectors this year.
 Source: S&P Global Market Intelligence
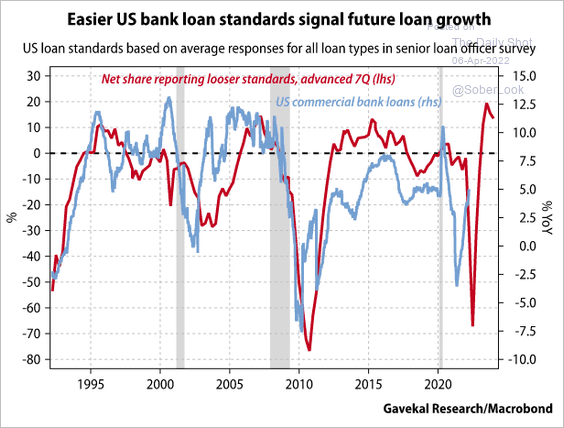
3. Loan growth may strengthen going forward.
 Source: Gavekal Research
4. Single-family rental securitizations surged last year.
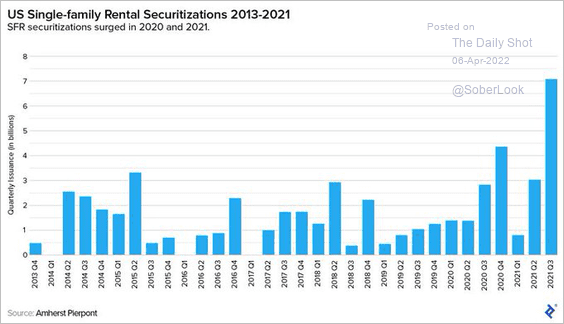 Source: @johnburnsjbrec
Back to Index
Rates
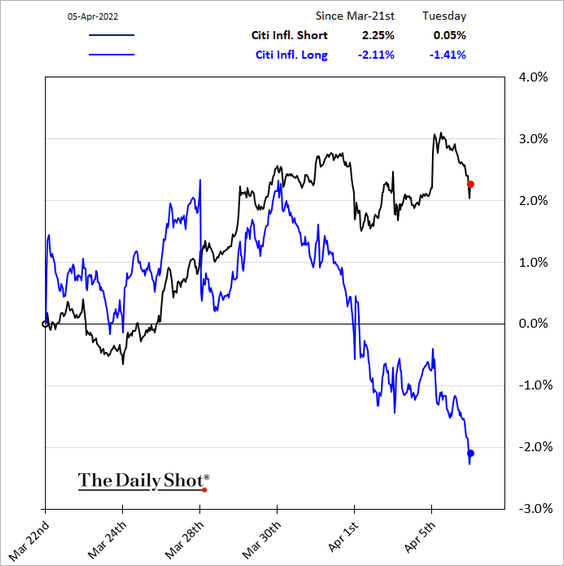
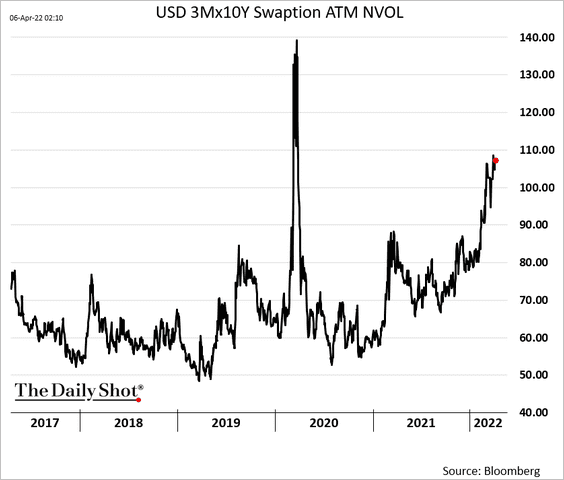
1. Rate markets’ implied volatility keeps climbing as the Fed prepares for rapid quantitative tightening.
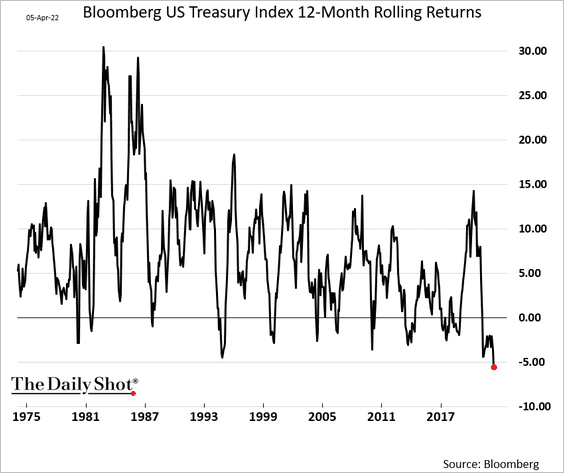
2. It’s been an awful 12 months for Treasuries.
3. Goldman expects more yield curve inversion ahead.
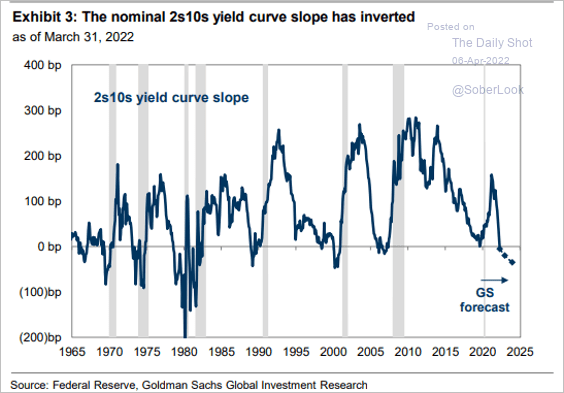 Source: Goldman Sachs; @MikeZaccardi
4. The rise in the 2-year Treasury yield has been faster and higher compared with previous moves ahead of a Fed hike. On average, the 2-year yield does not pause until the Fed’s rate hike cycle is complete.
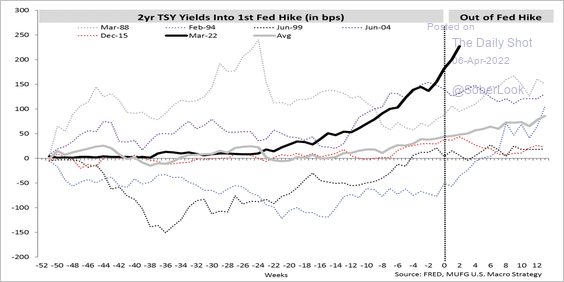 Source: MUFG
The 2-year/10-year Treasury yield spread has flattened faster than in previous cycles.
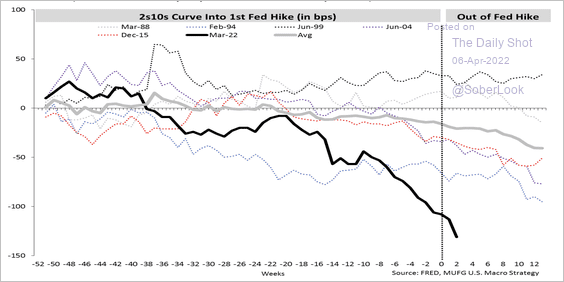 Source: MUFG
——————–
Food for Thought
1. One-person households in the US:
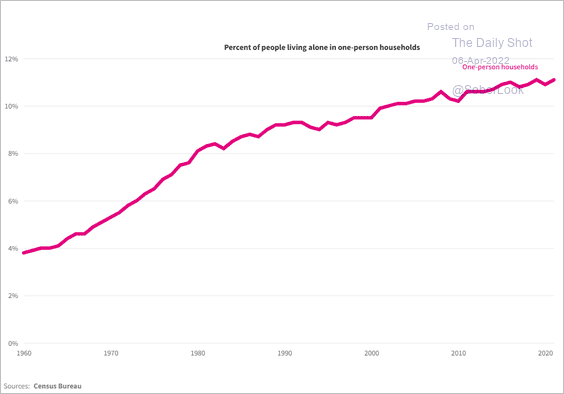 Source: USAFacts Read full article
2. The ratio of hourly earnings to gasoline prices:
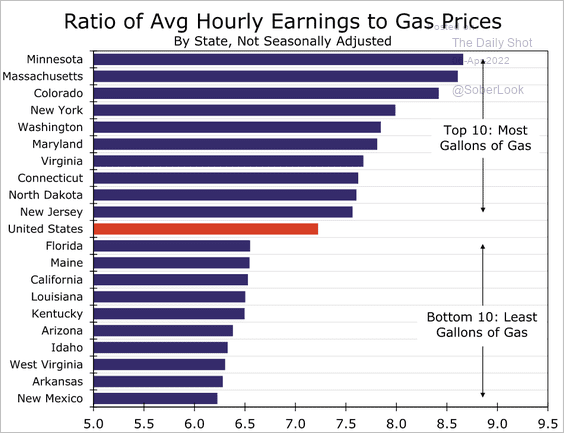 Source: Wells Fargo Securities
3. Least affordable housing markets:
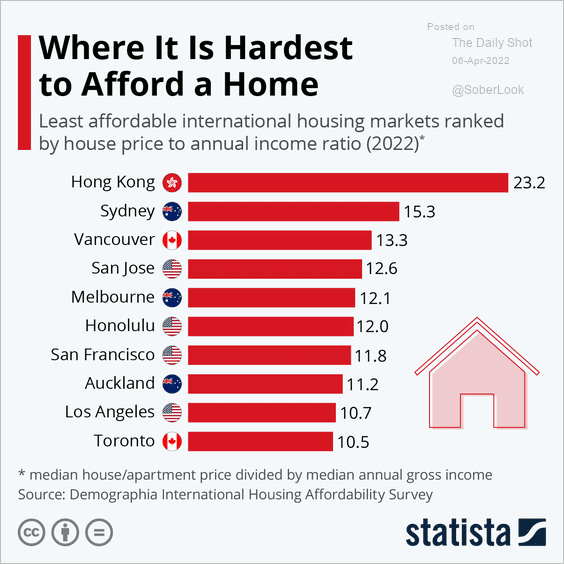 Source: Statista
4. Grocery spending as a share of disposable income:
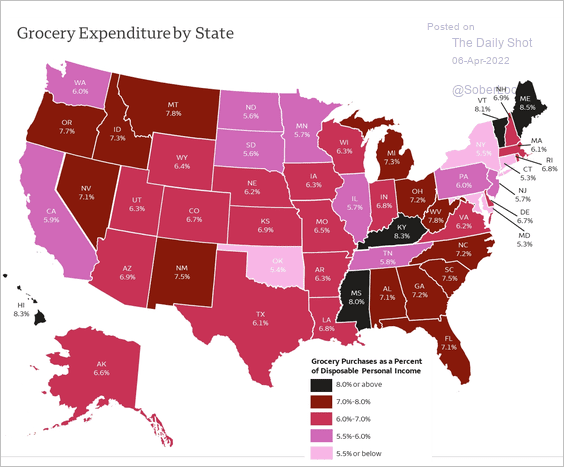 Source: Wells Fargo Securities
5. Price changes in select grocery and household products:
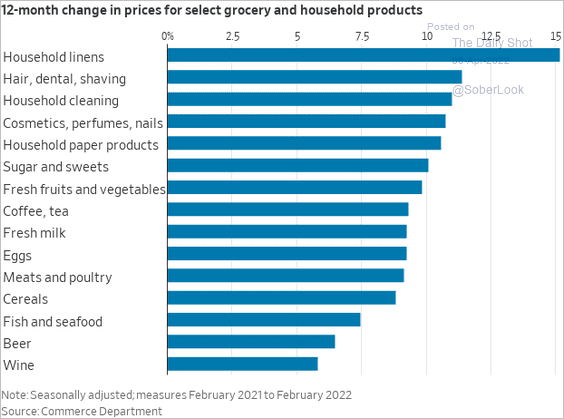 Source: @WSJ Read full article
6. Taiwan’s public stance on political independence:
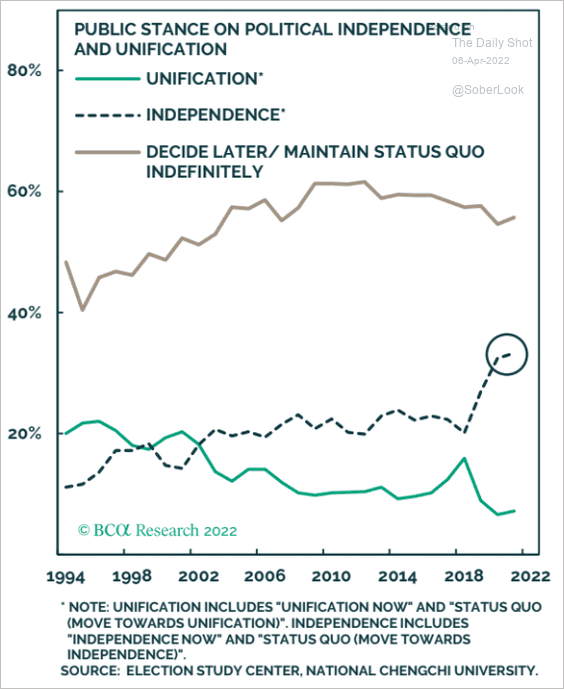 Source: BCA Research
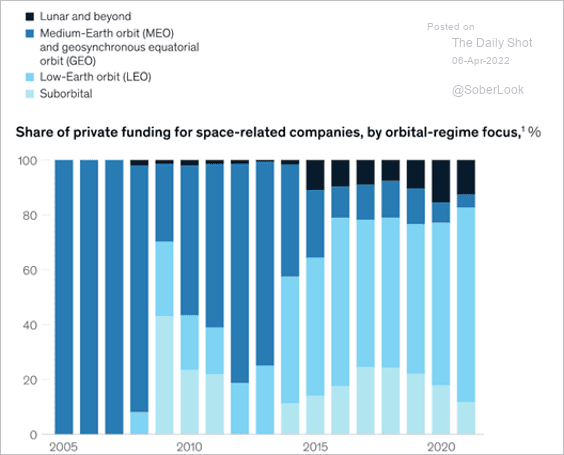
7. Private funding for ventures involving lunar and beyond orbital regimes has risen in recent years.
 Source: McKinsey & Company Read full article
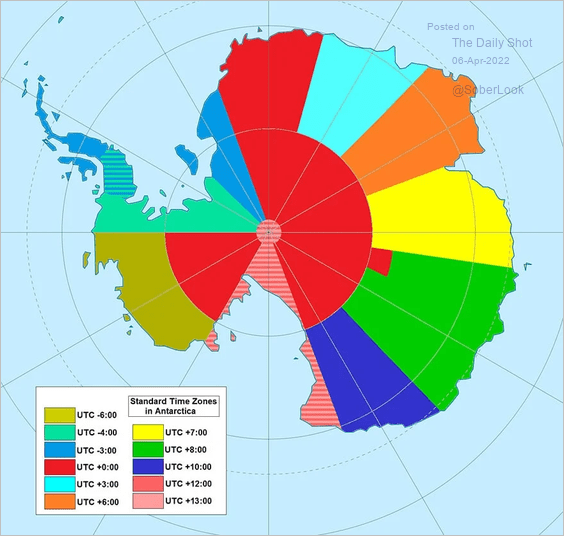
8. Antarctica’s time zones:
 Source: Wikimedia author “Phoenix B 1 of 3”
——————–
Back to Index