
The Daily Shot: 07-Apr-20
• The United States
• Canada
• The United Kingdom
• The Eurozone
• China
• Emerging Markets
• Cryptocurrency
• Commodities
• Energy
• Equities
• Credit
• Global Developments
• Food for Thought
The United States
1. The speed of the Federal Reserve’s securities purchases has been unprecedented. The chart below compares the current quantitative easing (QE) trajectory to previous programs.
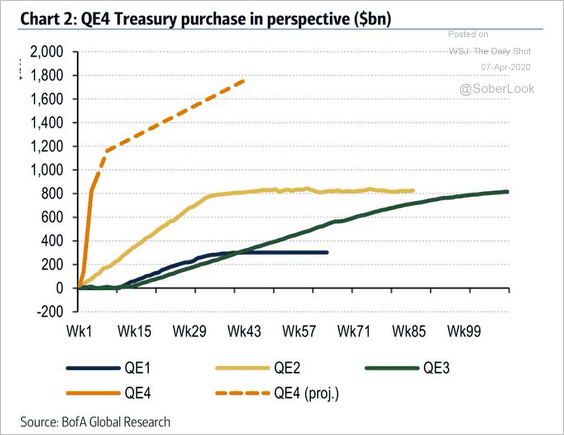 Source: BofA Merrill Lynch Global Research, @TayTayLLP
Will the Fed’s balance sheet reach $9 trillion?
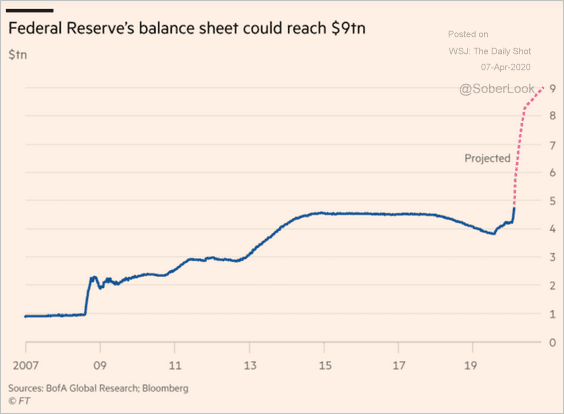 Source: @financialtimes Read full article
According to BofA Global Research, the Fed will fully fund the massive 2020 deficit. It’s the US version of Abenomics.
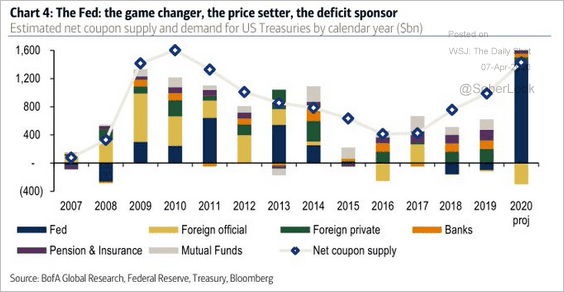 Source: BofA Merrill Lynch Global Research, @TayTayLLP
——————–
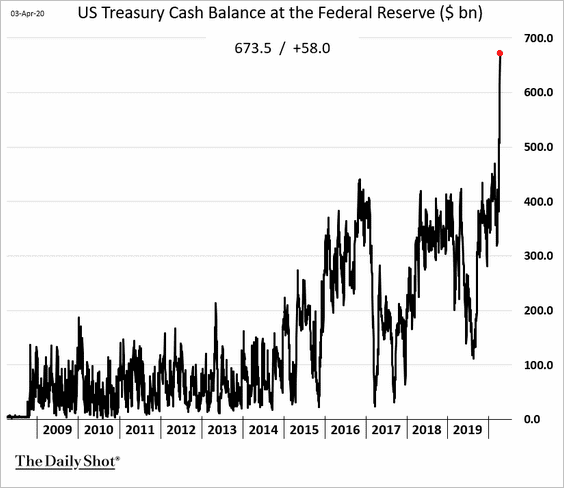
2. The US Treasury’s cash balances swell to record levels as the federal government prepares for a massive liquidity injection into the economy.
Here is how the US fiscal stimulus compares to other countries.
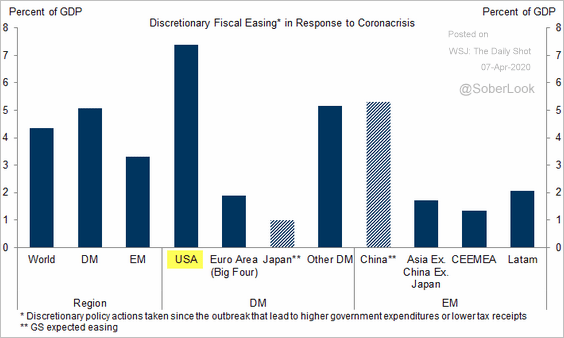 Source: Goldman Sachs
——————–
3. The current quarter’s economic contraction is expected to be unprecedented.
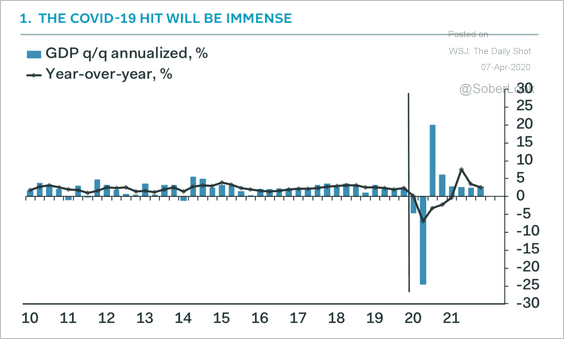 Source: Pantheon Macroeconomics
As bad as some of the macro indicators have been, they are underestimating the hit to the GDP.
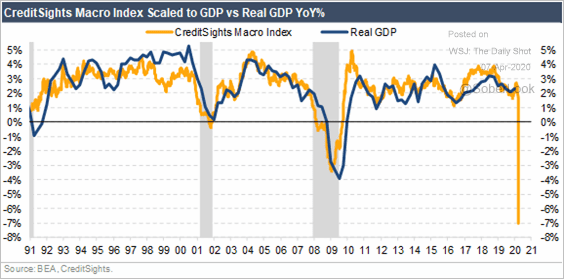 Source: CreditSights
Here is the GDP path comparison to 2008 (from TS Lombard).
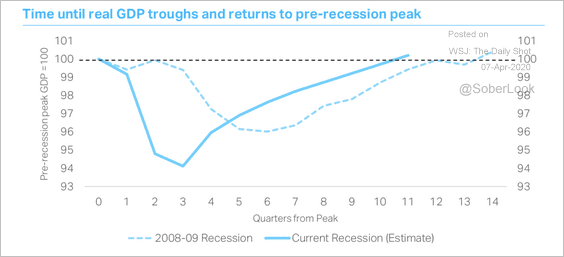 Source: TS Lombard
——————–
4. Will the 2020 unemployment rate exceed the highest levels of the Great Depression?
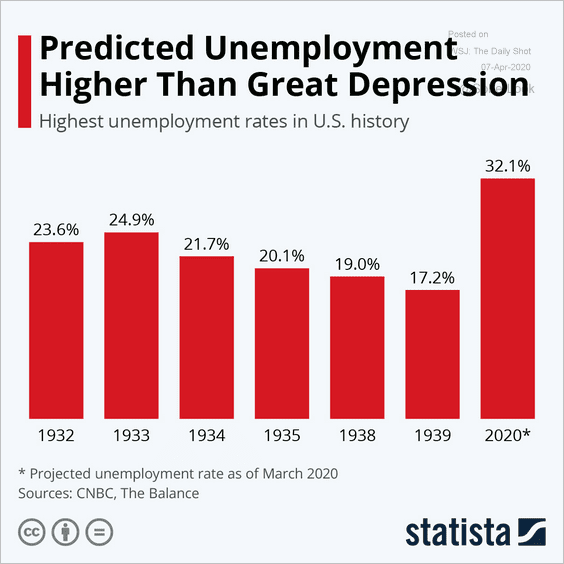 Source: Statista
5. Which states will be impacted the most?
• GDP loss due to lockdowns:
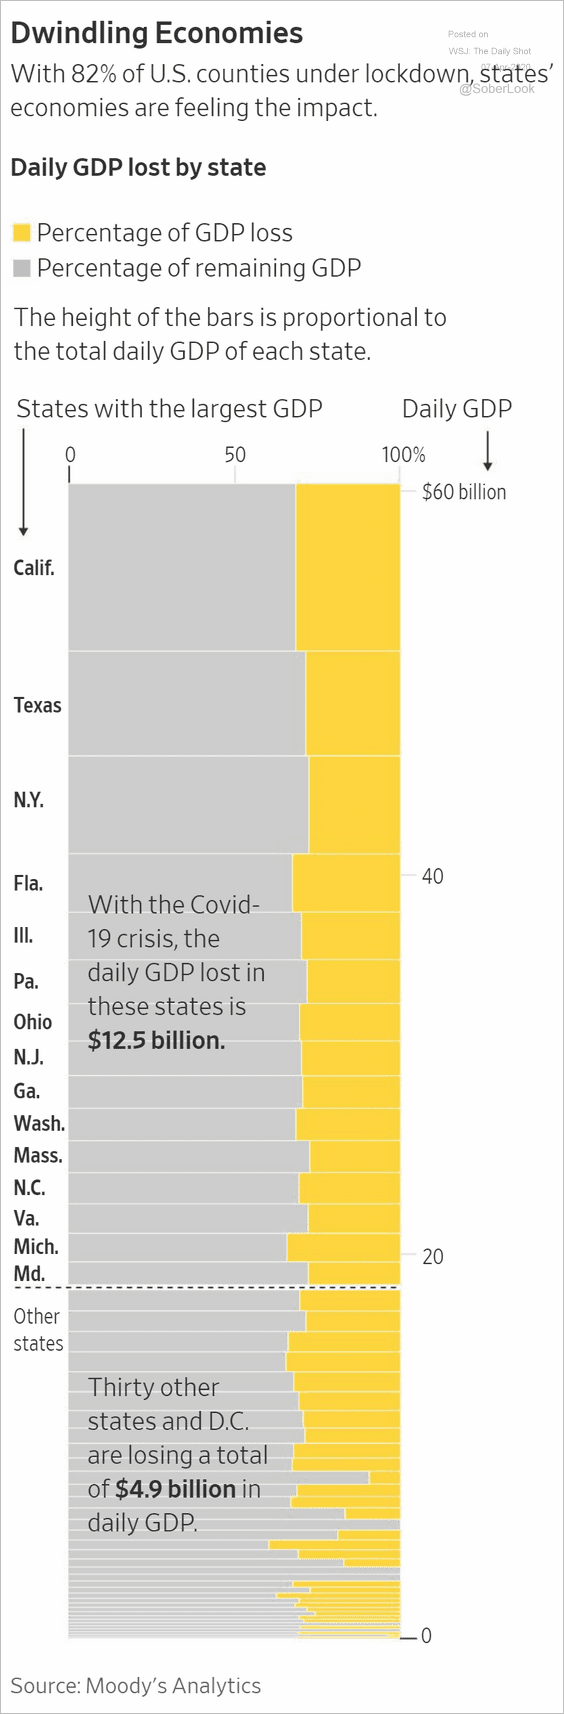 Source: @WSJ Read full article
• Economic vulnerability score (from Oxford Economics):
 Source: Oxford Economics
——————–
6. Which industries have the highest concentration of small business employment?
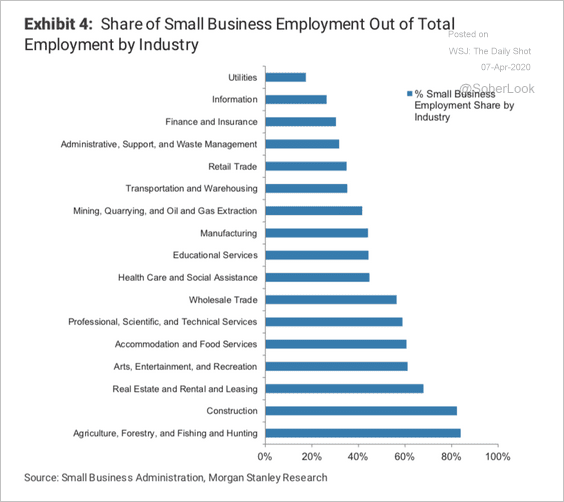 Source: Morgan Stanley Research
7. Online search activity for the phrase “coronavirus symptoms” has peaked.
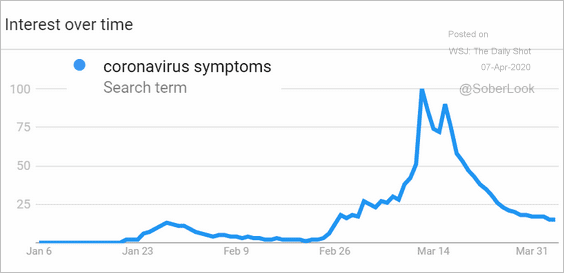 Source: Google Trends
Canada
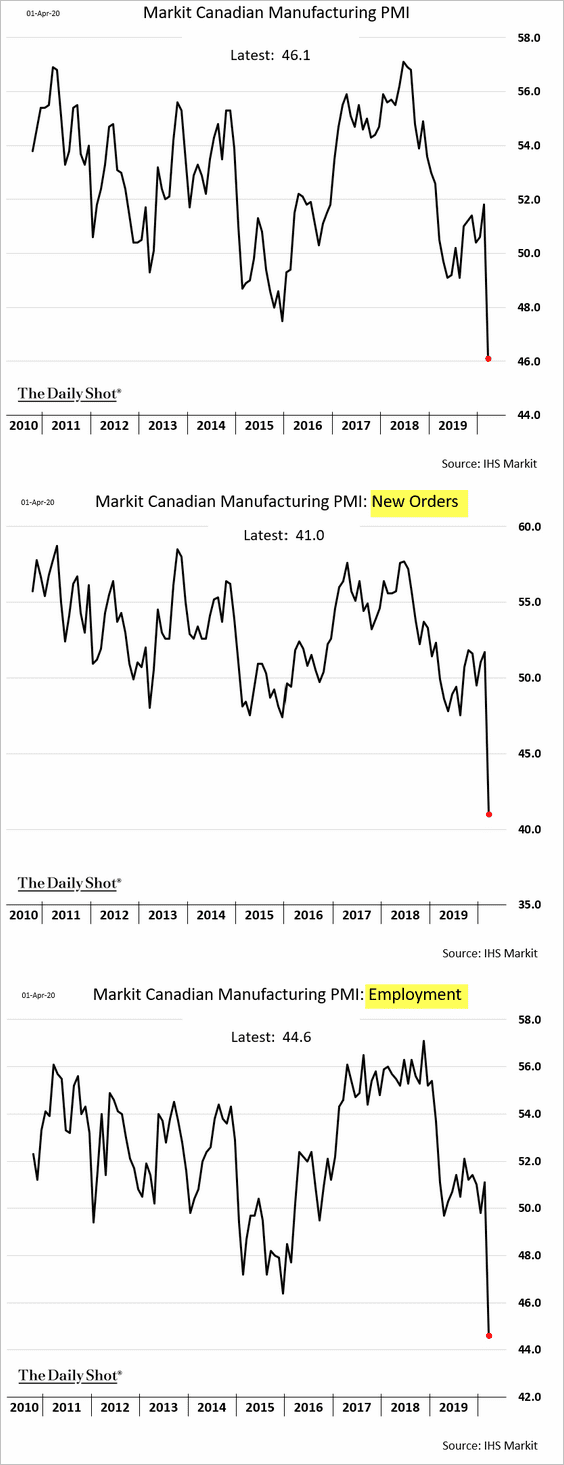
1. Factory activity is collapsing.
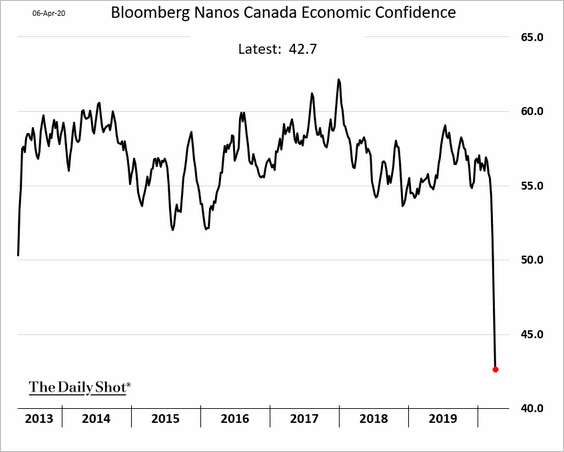
2. Consumer confidence plummeted in recent weeks.
3. Here’s how Canada’s fiscal response compares with the US.
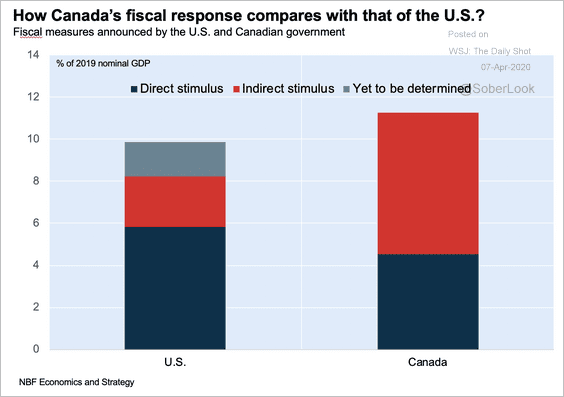 Source: Jocelyn Paquet, National Bank of Canada
4. Weak energy prices will boost insolvencies.
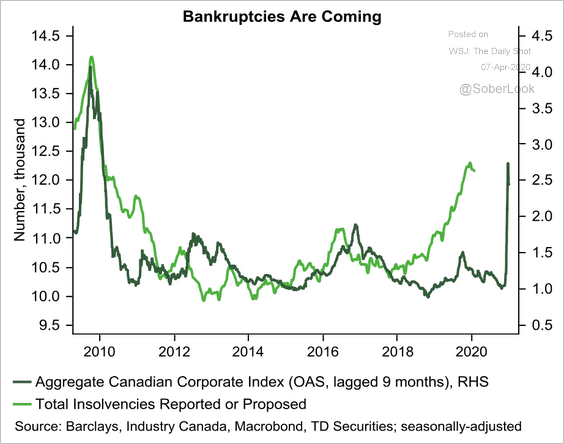 Source: TD Securities
5. Merchandise trade between Canada and China has declined over the past few years.
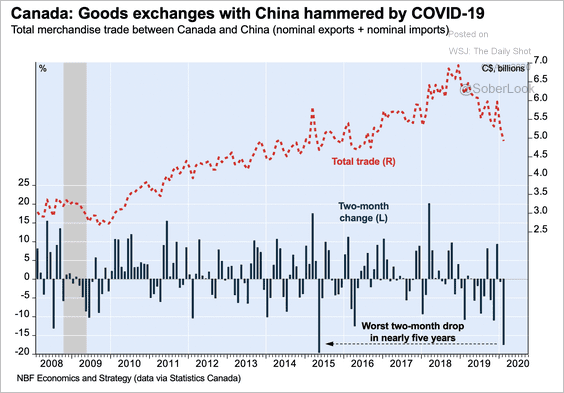 Source: Jocelyn Paquet, National Bank of Canada
The United Kingdom
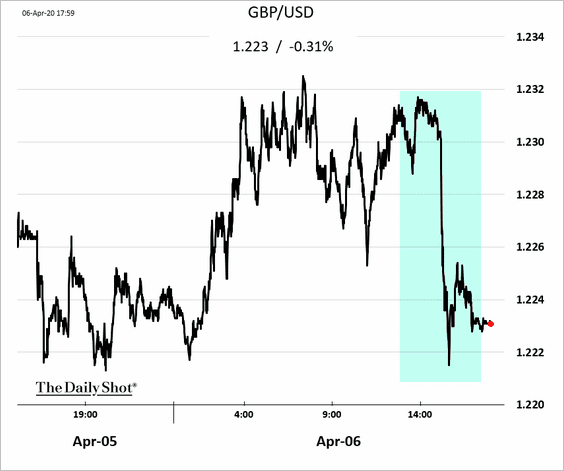
1. The Prime Minister’s health took a turn for the worse, sending the pound lower.
 Source: Sky UK Read full article
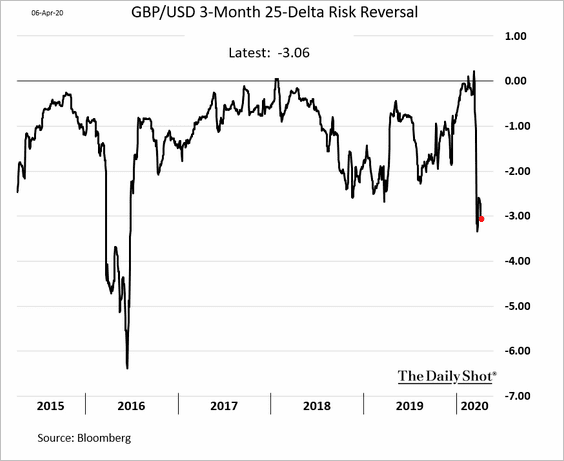
Traders remain glum on the pound’s prospects over the next few months. Here is the 3-month risk reversal.
——————–
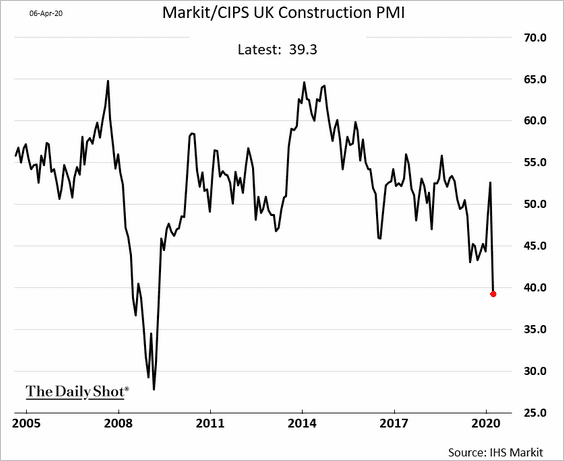
2. Construction activity shrank last month.
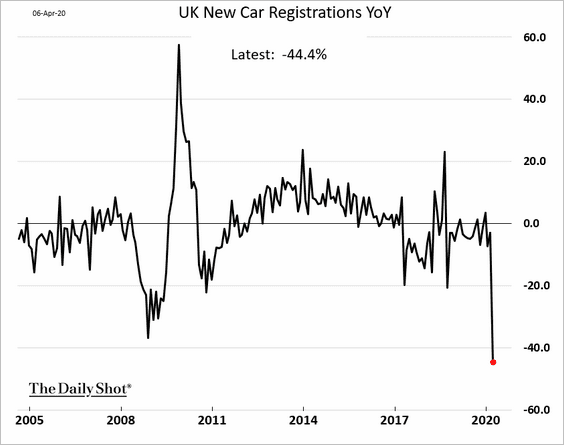
3. New car registrations are down by over 40% from the same time a year ago.
The Eurozone
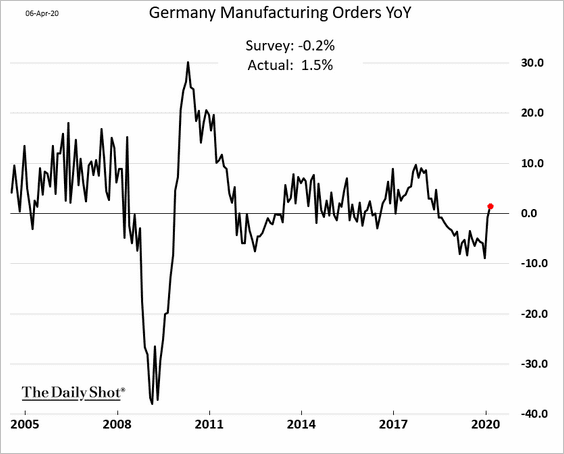
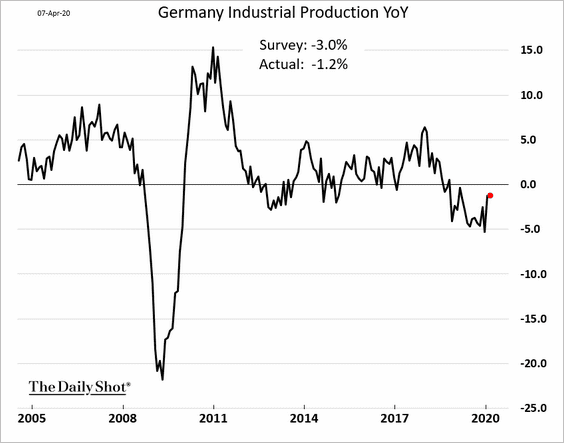
1. Germany’s factory orders and industrial production were recovering before the onset of the epidemic (the charts below are through February).
——————–
2. Next, we have some updates on Italy.
• Power consumption:
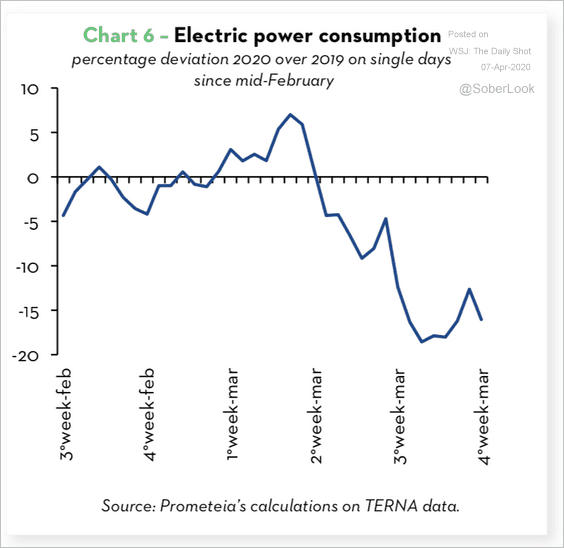 Source: Prometeia
• Regional GDP declines:
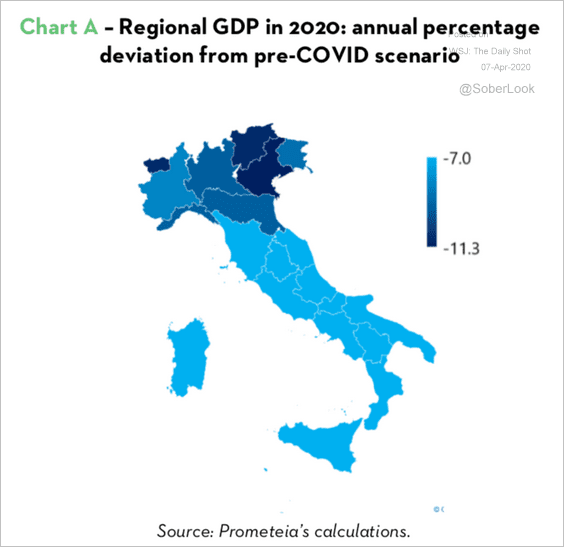 Source: Prometeia
• The number of deaths from COVID-19:
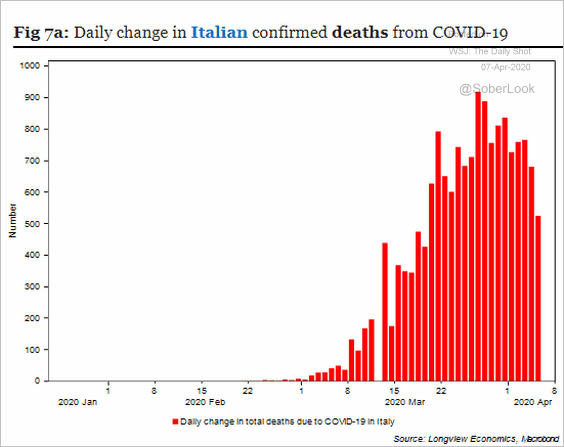 Source: Longview Economics
——————–
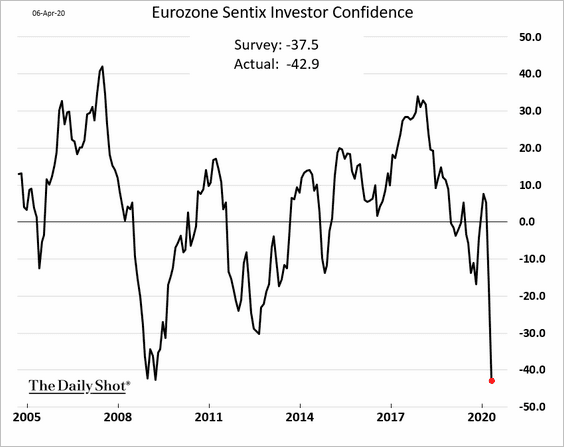
3. The Sentix sentiment index hit a record low.
4. Here is a forecast for the ECB’s (Eurosystem) balance sheet and asset purchases (from Pictet Wealth Management).
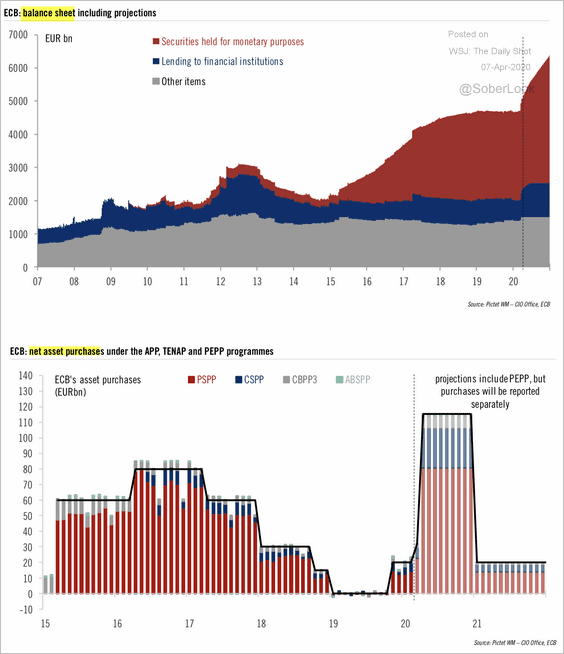 Source: Pictet Wealth Management
5. Below is a summary of fiscal commitments by the euro-area governments.
 Source: Danske Bank
6. Small and medium-sized businesses are very vulnerable. Here is a quote from ANZ.
There were 160.7m people employed in the euro area in February, with 75% of those (120m) in the private sector. On our calculations, if the euro area economy is operating at 50% capacity and half of employees in the idled 50% of the private sector are vulnerable to redundancy or furlough, then 30m jobs are vulnerable. That is almost 20% of pre-coronavirus employment and could be an underestimate. In the EU, there are 13m jobs across tourism-related sectors. Construction, which is being idled, accounts for around 10m jobs. Over half the workforce is employed by small and medium enterprises (SMEs).
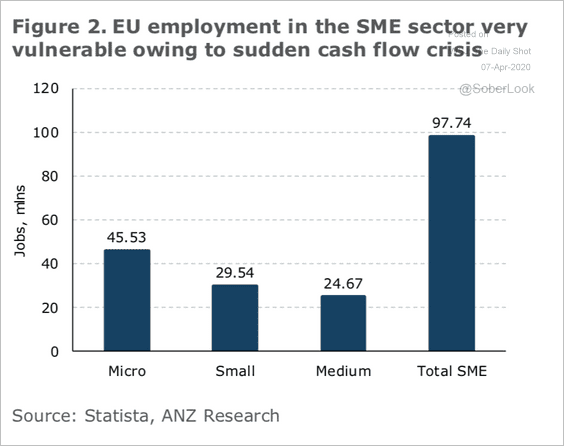 Source: ANZ Research
7. Eurozone banks are trading well below book value.
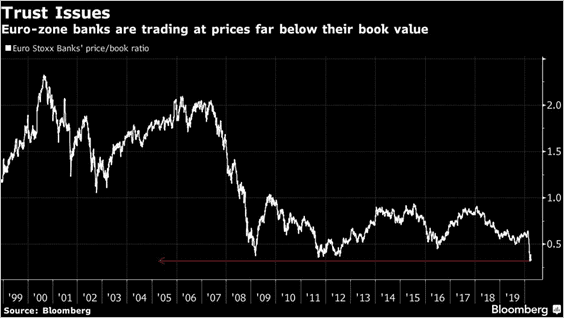 Source: @markets Read full article
China
1. The renminbi has outperformed other EM currencies.
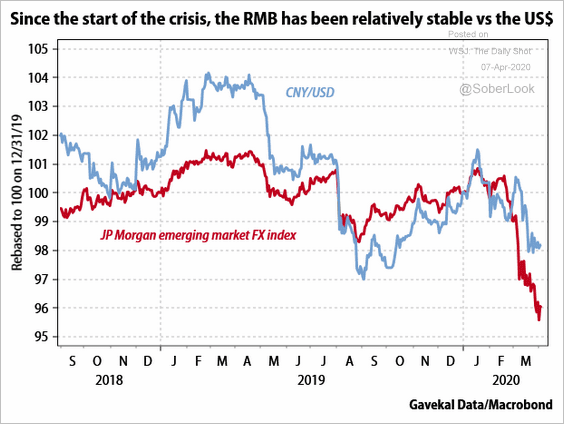 Source: Gavekal
2. China has a long way to go to meet Phase-1 US trade-deal targets.
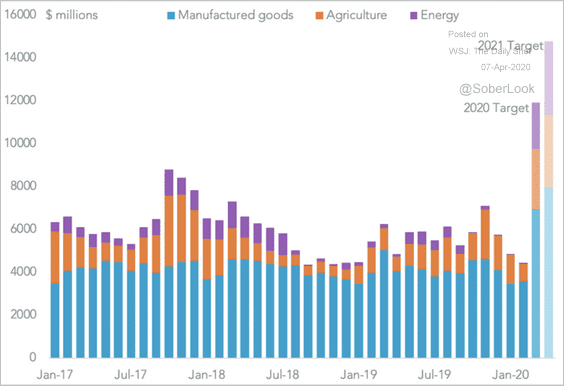 Source: S&P Global Market Intelligence
Emerging Markets
1. EM GDP is expected to contract for the first time in decades.
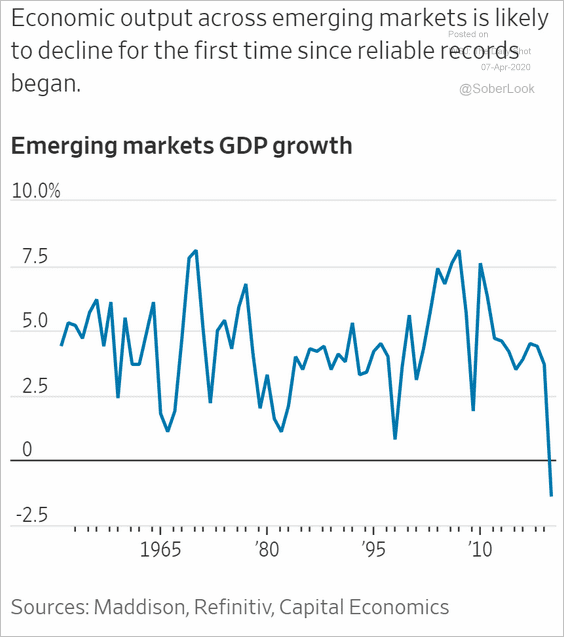 Source: @WSJ Read full article
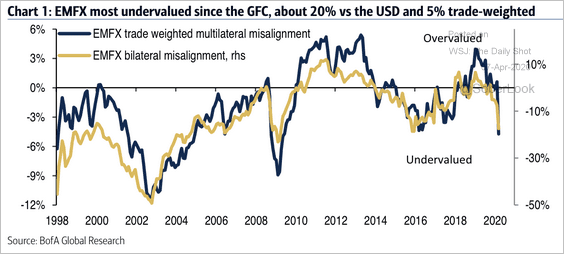
2. EM currencies are most undervalued since 2008, according to BofA.
 Source: BofA Merrill Lynch Global Research
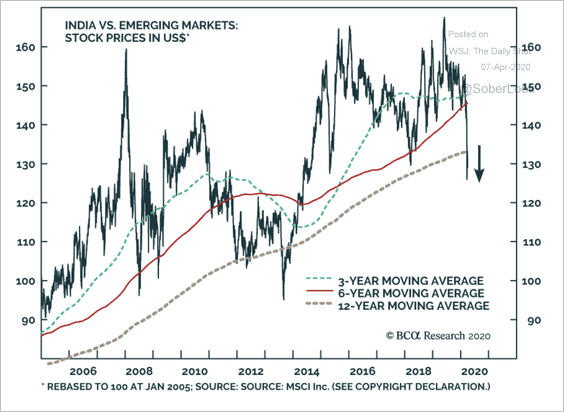
3. Indian stock prices relative to EM are breaking below long-term support (in dollar terms).
 Source: BCA Research
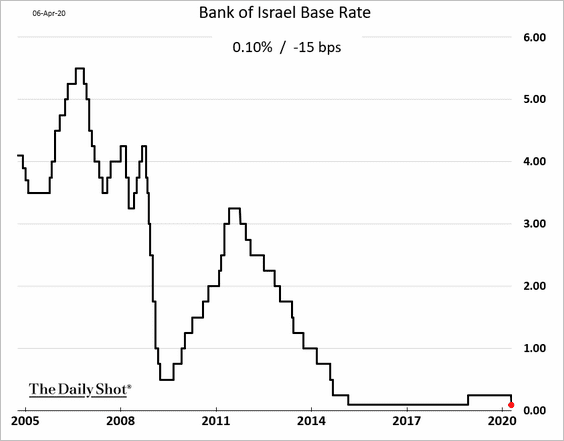
4. Israel’s central bank lowered rates back to 10 bps.
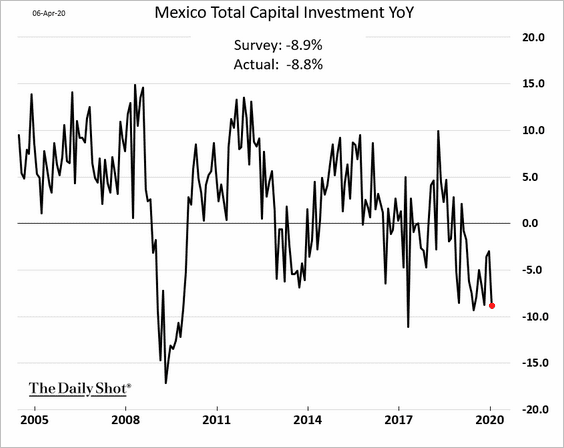
5. Mexico’s business investment was deteriorating before the start of the epidemic (this chart is through January).
Cryptocurrency
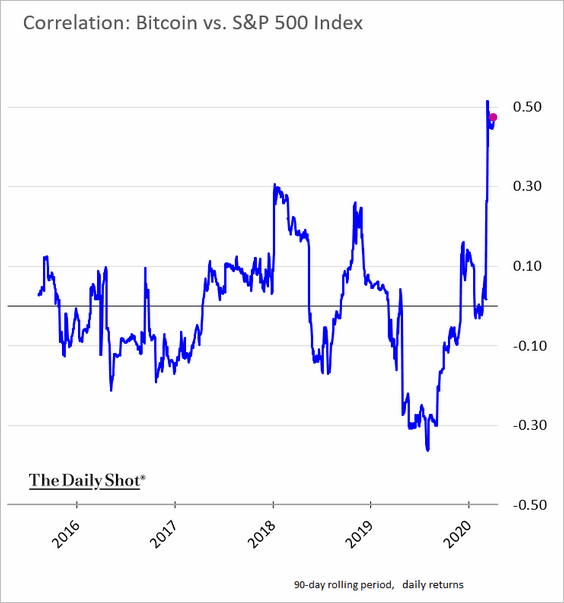
Bitcoin’s correlation with stocks has spiked this year.
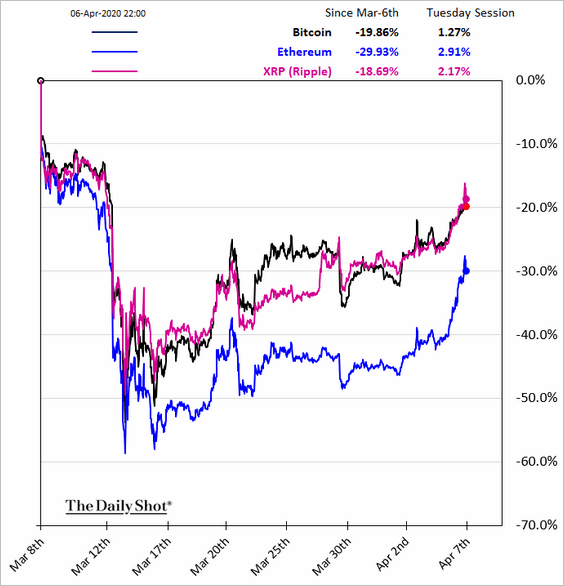
And the stock market bounce is showing up in crypto markets.
Commodities
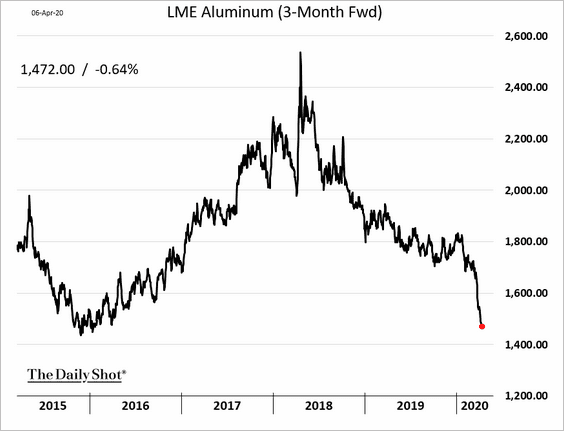
1. Aluminum prices hit a multi-year low.
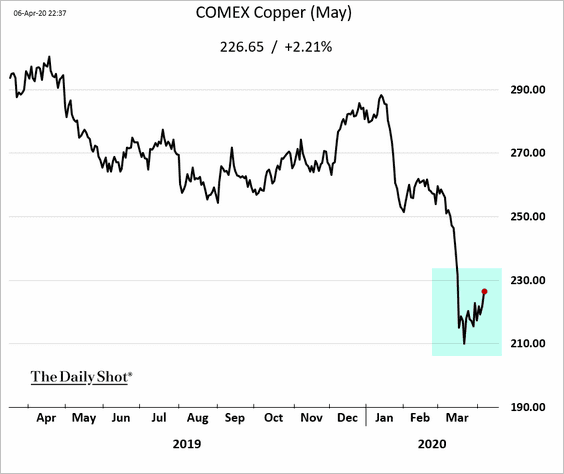
2. Copper appears to have stabilized.
Energy
1. Excess supply became a significant driver of oil prices in mid-2012 and generally dominated price dynamics after mid-2014, according to the NY Fed.
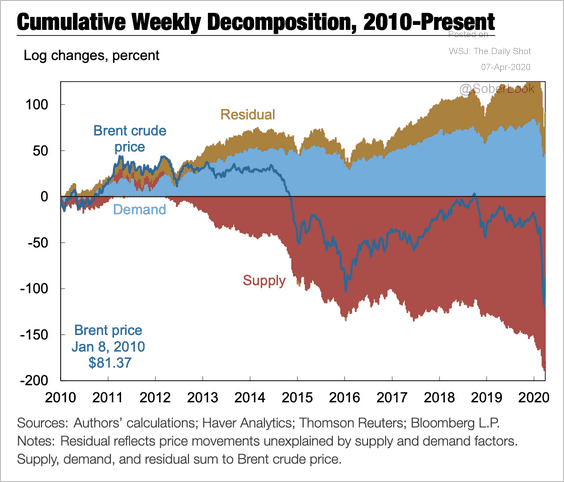 Source: Federal Reserve Bank of New York Read full article
But US crude oil supply is expected to drop substantially next year (see rig count).
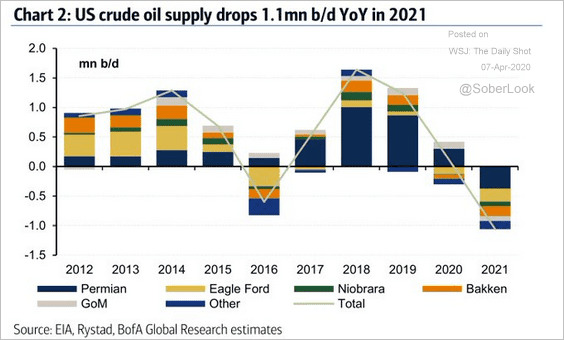 Source: BofA Merrill Lynch Global Research, @TayTayLLP
——————–
2. Price changes in Brent crude explain about 64% of the movements in energy-related currencies.
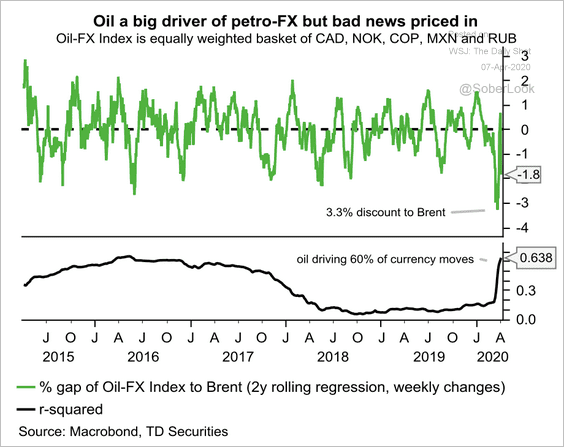 Source: TD Securities
Equities
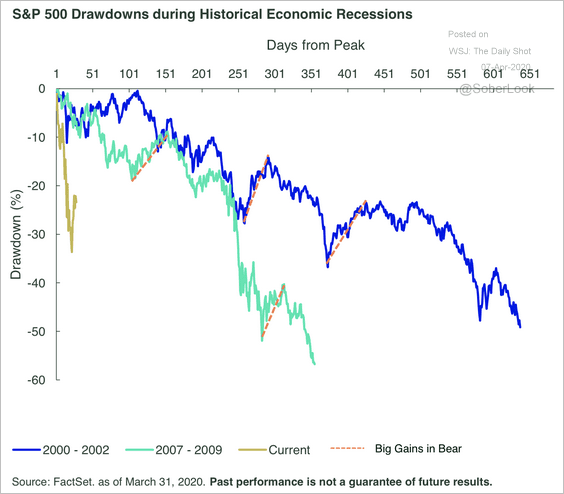
1. Monday was a good day for stocks, as the S&P 500 rose by 7%. But large gains during bear markets are not uncommon.
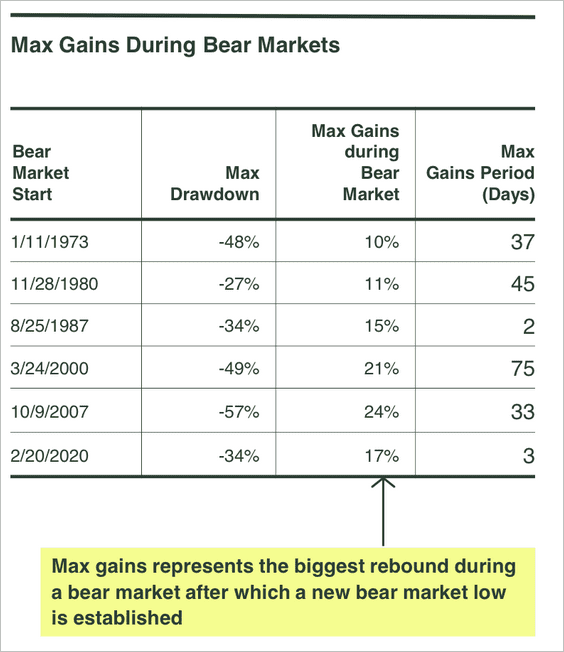 Source: SPDR Americas Research, @mattbartolini
 Source: SPDR Americas Research, @mattbartolini
——————–
2. Here is a comparison to the 1929 crash.
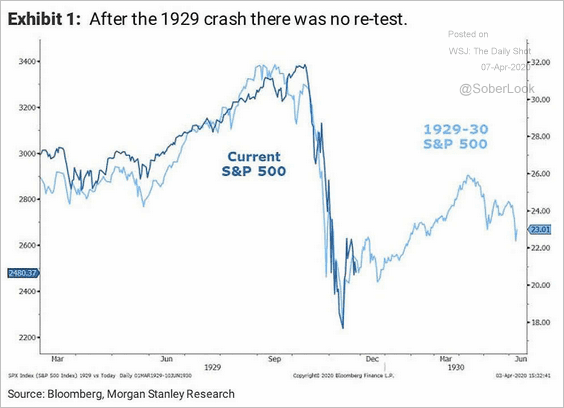 Source: Morgan Stanley Research, @carlquintanilla
3. Share buyback activity, which was a significant driver of returns, is expected to slow sharply.
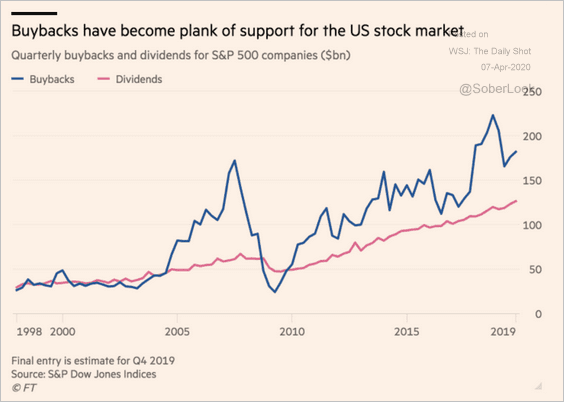 Source: @financialtimes Read full article
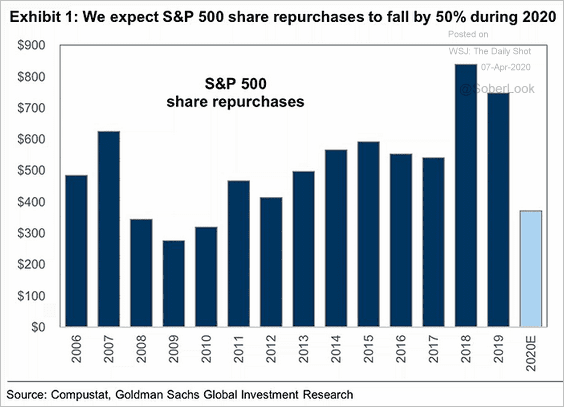 Source: Goldman Sachs, @carlquintanilla
This scatterplot shows the relationship between buybacks and EPS growth.
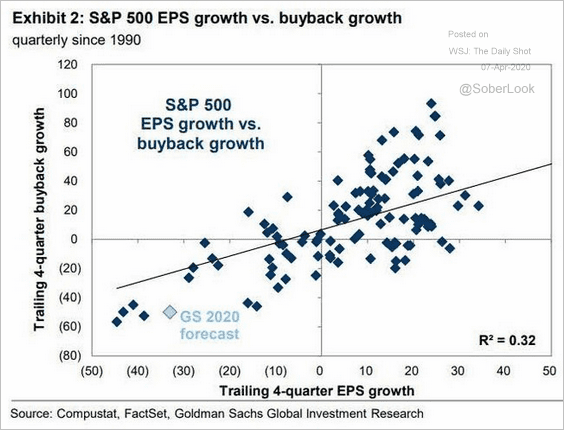 Source: @ISABELNET_SA, @GoldmanSachs
——————–
4. Analysts expect a significant deterioration in dividends per share.
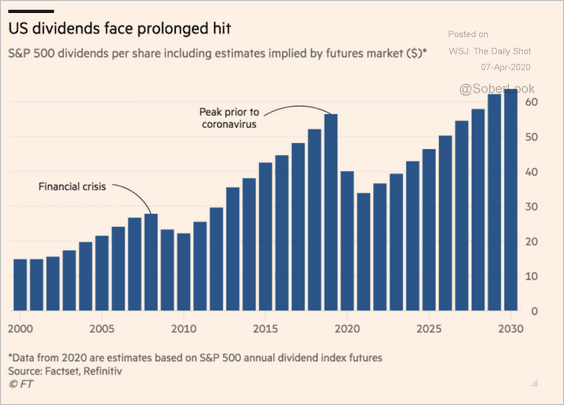 Source: @financialtimes Read full article
5. This chart shows the cyclically adjusted PE ratios for the US, the Eurozone, and emerging markets.
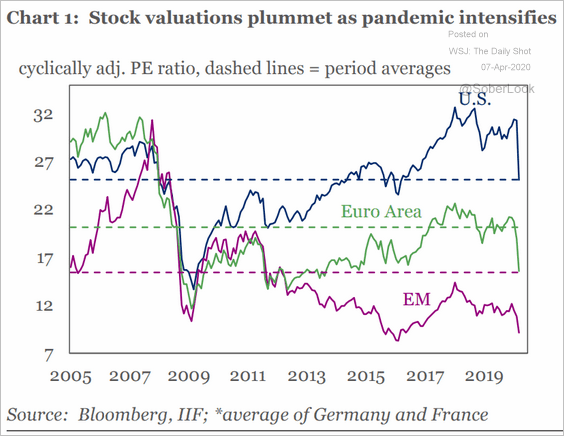 Source: IIF
6. Will other firms follow Macy’s out of the S&P 500 index?
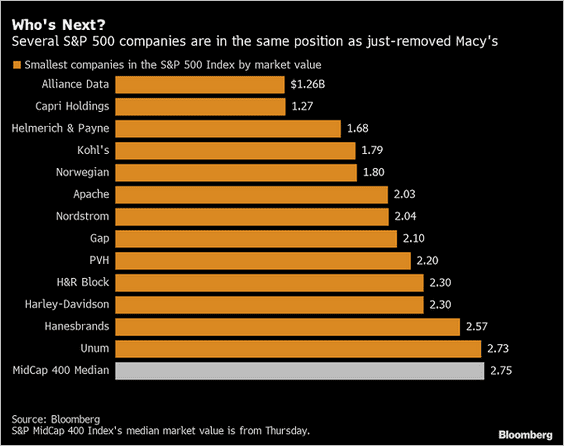 Source: @TheOneDave Read full article
7. US consumers increasingly expect the market to rebound within a year.
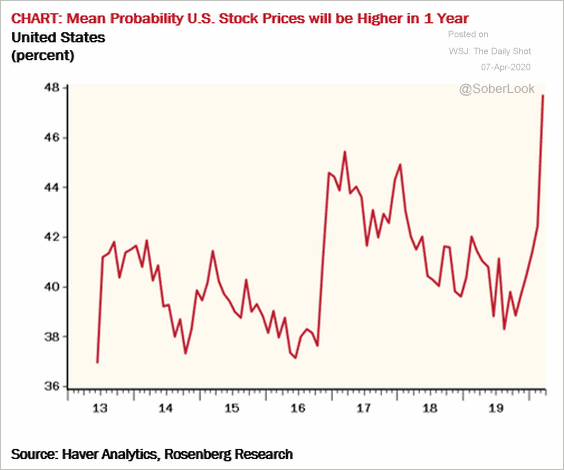 Source: @EconguyRosie
However, individual-investor positioning at Ameritrade points to caution.
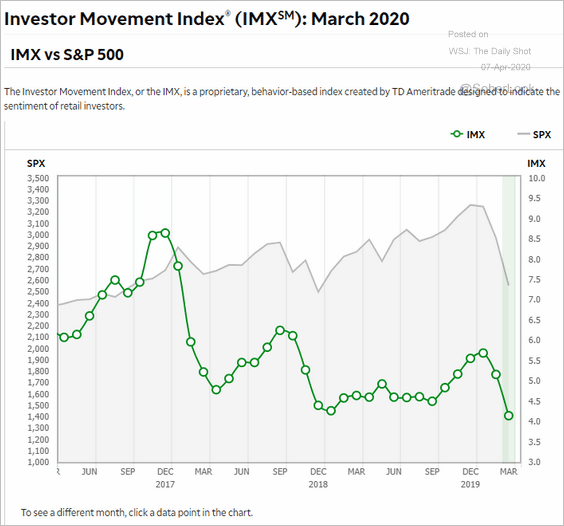 Source: TD Ameritrade
——————–
8. Have value stocks troughed relative to growth (2 charts)?
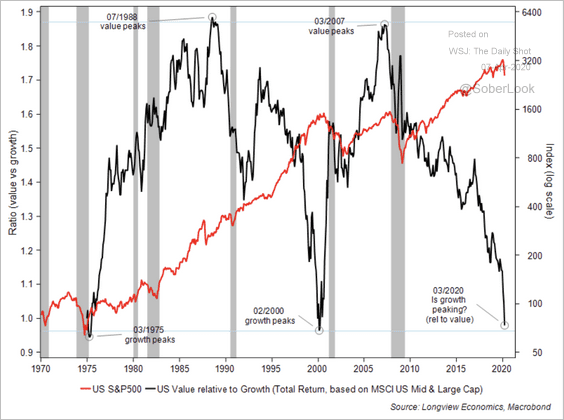 Source: Longview Economics
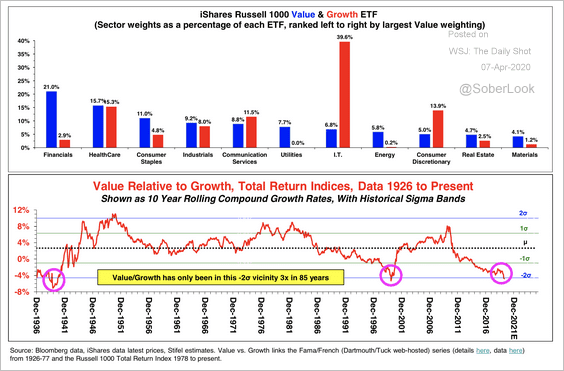 Source: Stifel
For example, the S&P 500 information technology stocks appear stretched relative to financials.
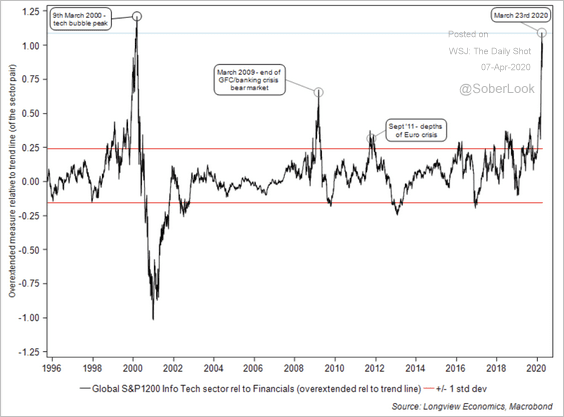 Source: Longview Economics
——————–
9. Bank stocks are at record lows relative to the S&P 500.
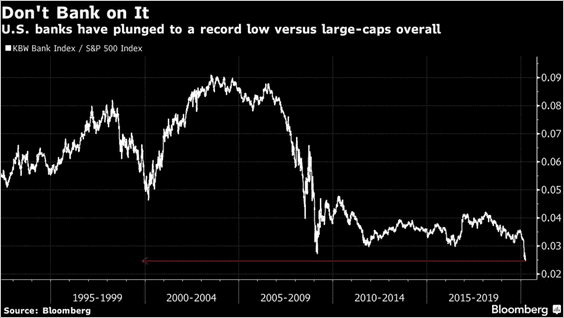 Source: @markets Read full article
10. The energy sector weight in the S&P 500 is near record lows.
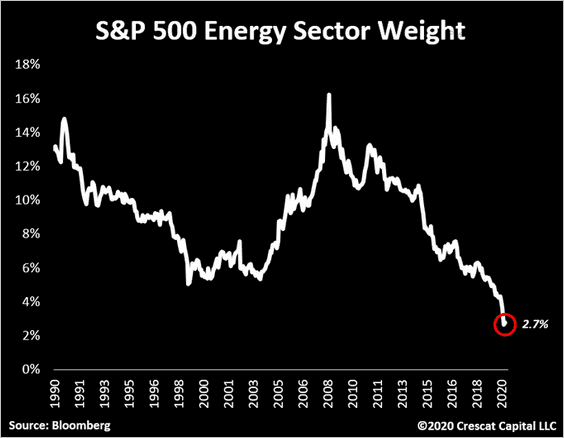 Source: @TaviCosta
Credit
1. Primary collateralized loan obligation (CLO) markets in the US ground to a halt in mid-March with no new-issue, reset, or refi deals pricing. The first two weeks of the month hit the lowest volume reading in three years, according to S&P.
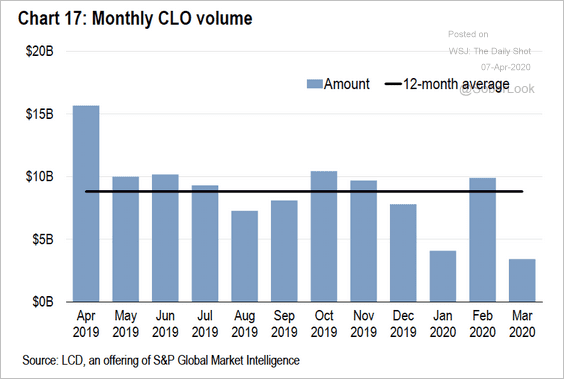 Source: S&P Global Market Intelligence
2. Did information suppression help reduce run on banks during the Great Depression?
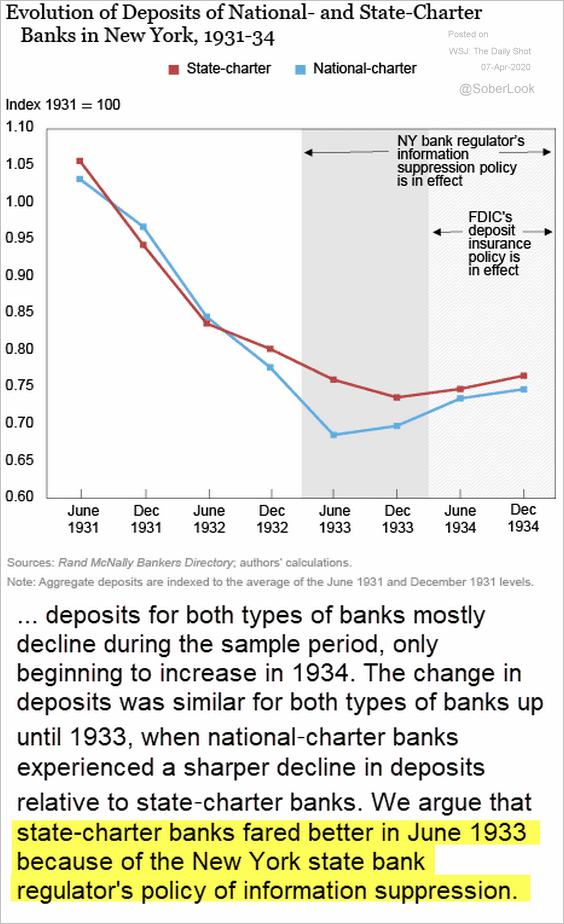 Source: Liberty Street Economics Read full article
3. Next, we have some updates on the muni markets.
• Muni-bond funds and separately managed accounts AUM:
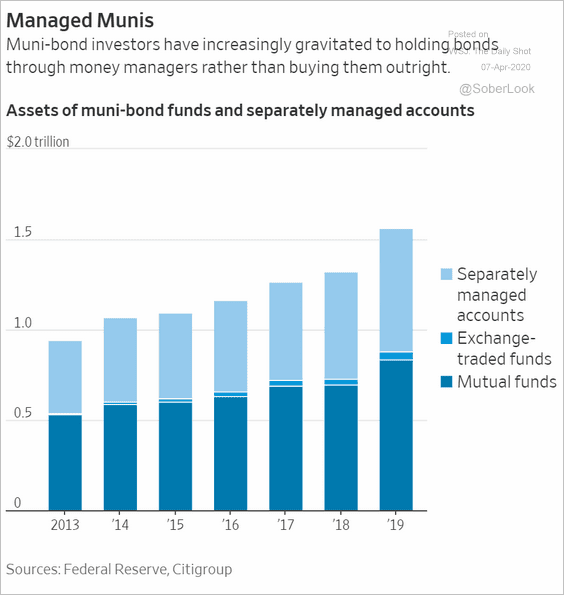 Source: @WSJ Read full article
• The market rebound:
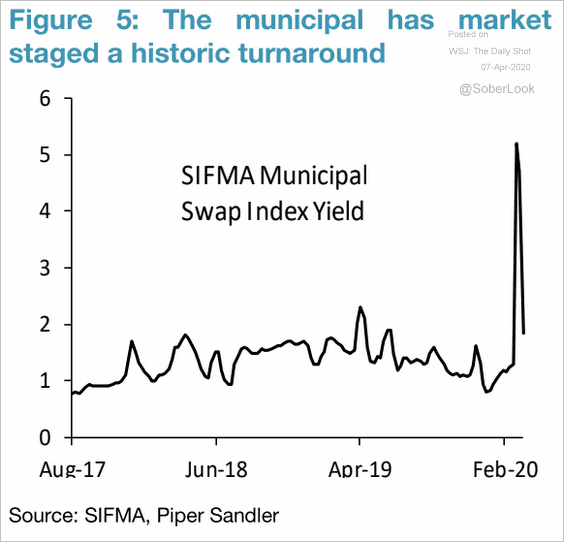 Source: Piper Sandler
• Fund flows:
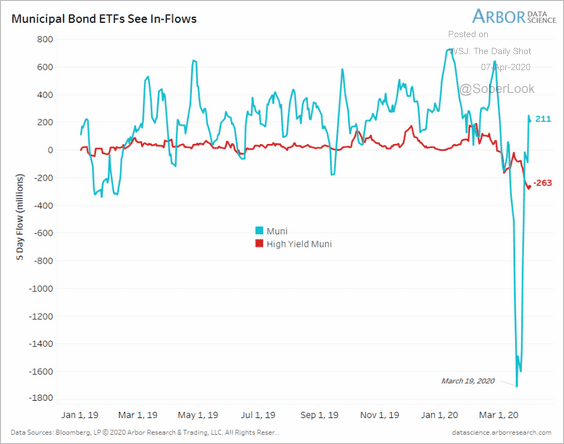 Source: Arbor Research & Trading
Global Developments
1. TD Securities expects a firmer US dollar over the next month or so, similar to what occurred in 2008.
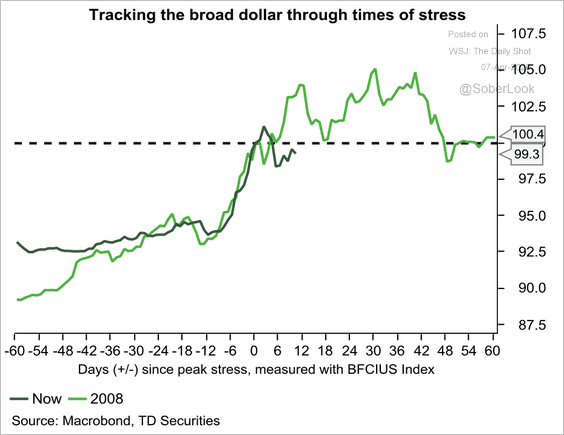 Source: TD Securities
However, collapsing US – foreign yield differentials point to US dollar weakness, according to Stifel.
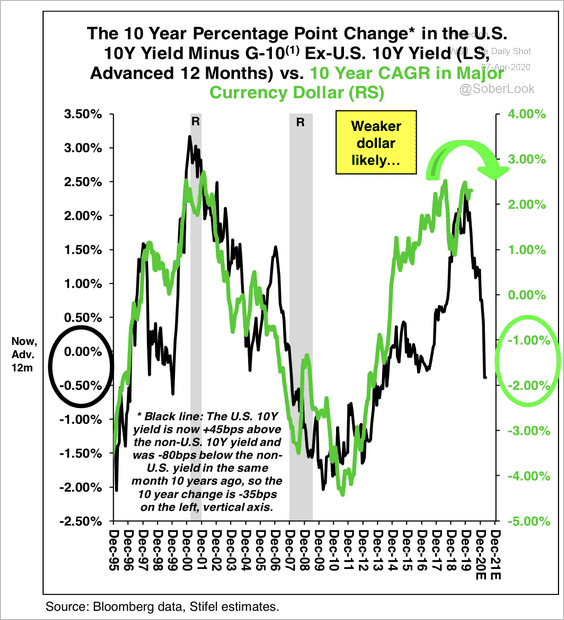 Source: Stifel
——————–
2. Below is the Fed’s dollar swap facility utilization.
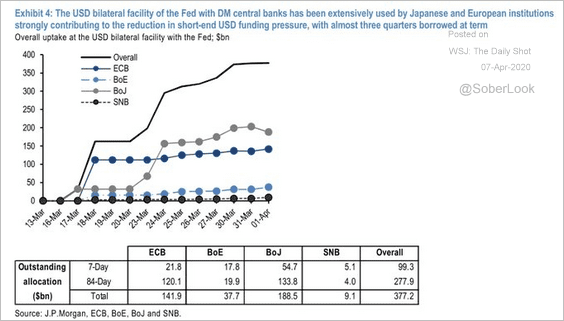 Source: JP Morgan, @TayTayLLP
3. During the March extreme volatility, the S&P 500, Treasuries, and gold became correlated.
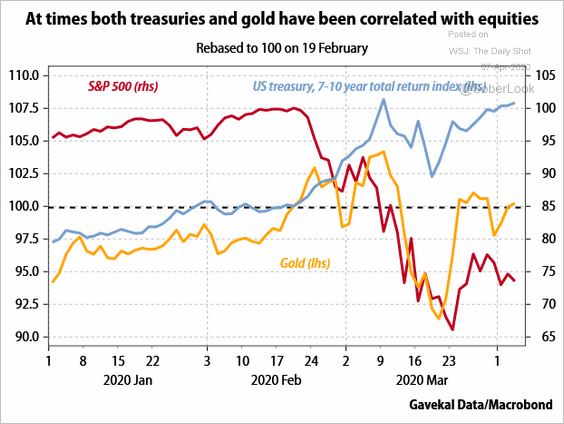 Source: Gavekal
4. Finally, here is Bloomberg’s global GDP tracker.
![]() Source: @markets Read full article
Source: @markets Read full article
——————–
Food for Thought
1. The size of Western European armies:
 Source: The Economist Read full article
2. Homeownership by generation:
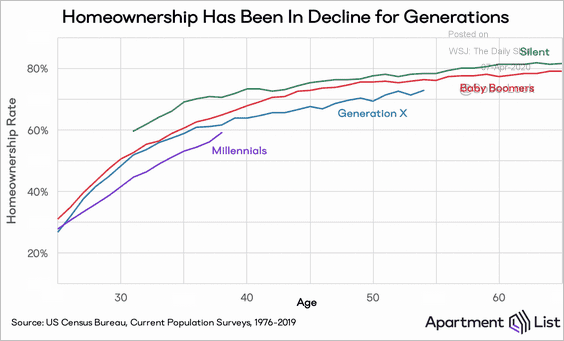 Source: Apartment List Read full article
3. Access to a home computer:
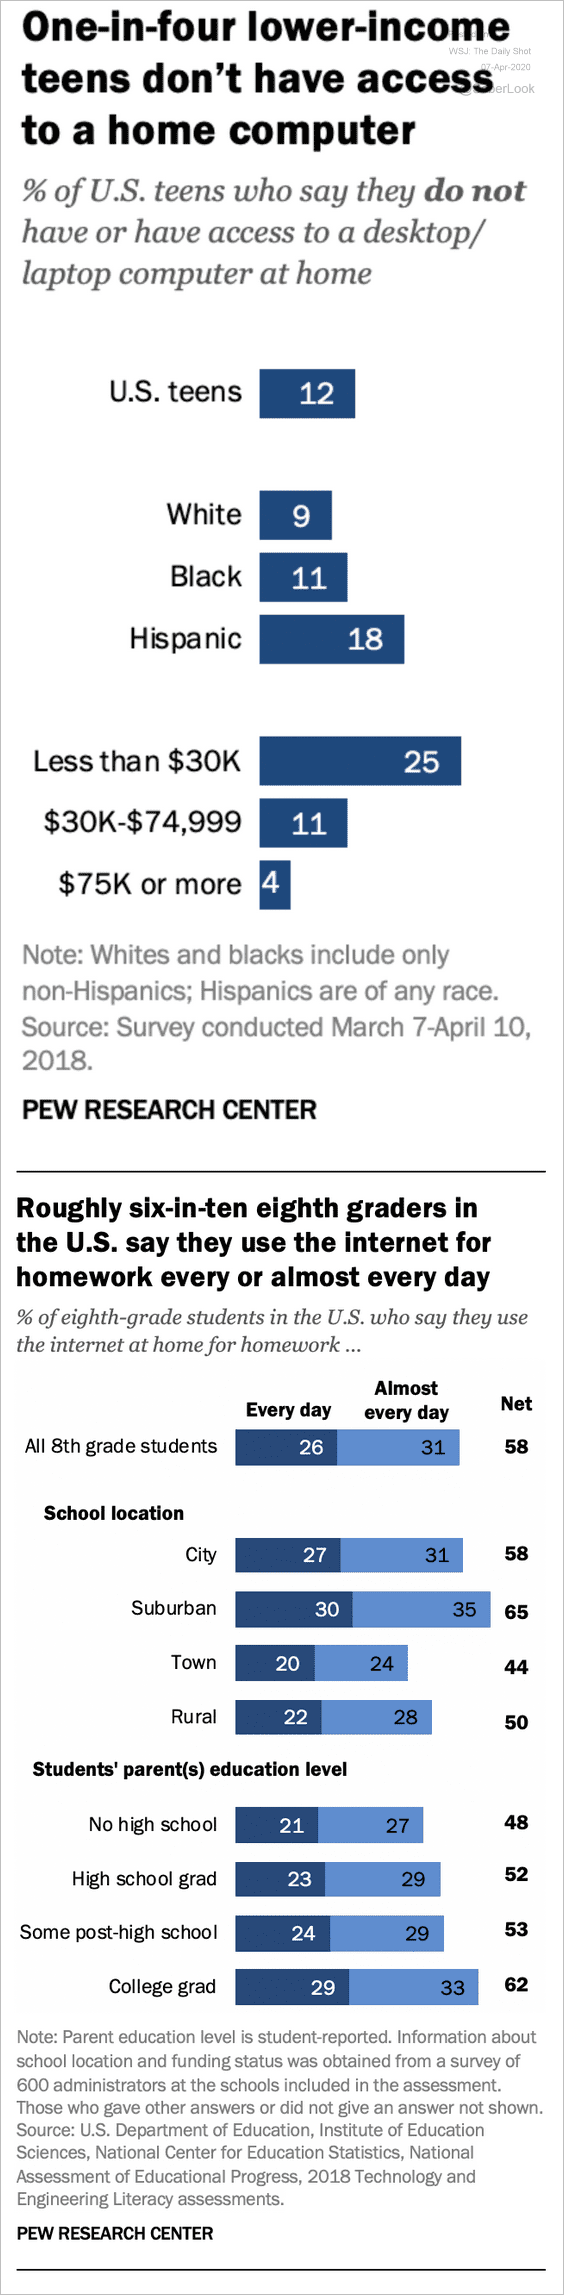 Source: Pew Research Center Read full article
4. The US workforce in 1920 and 2019:
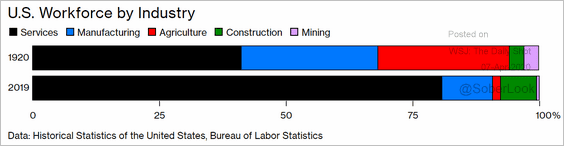 Source: @BW Read full article
5. A poll on Democratic VP performance in the general election:
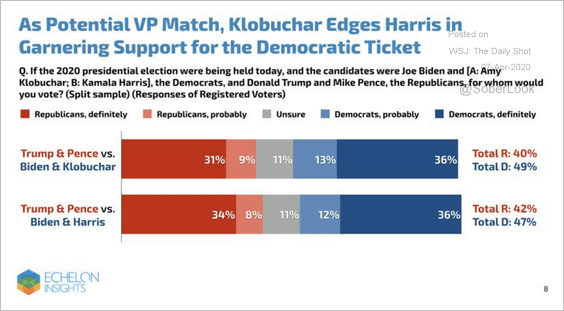 Source: Echelon Insights
6. COVID-19 infections and deaths vs. the temperature zone (hinting at seasonality):
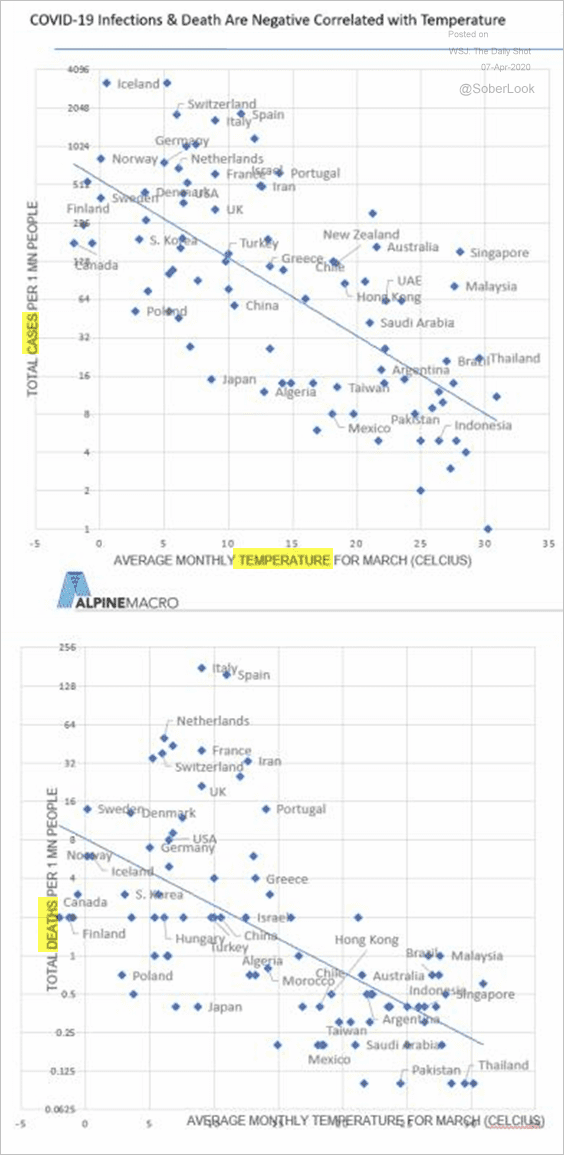 Source: Alpine Macro Read full article
7. The number of infections and deaths relative to each country’s population:
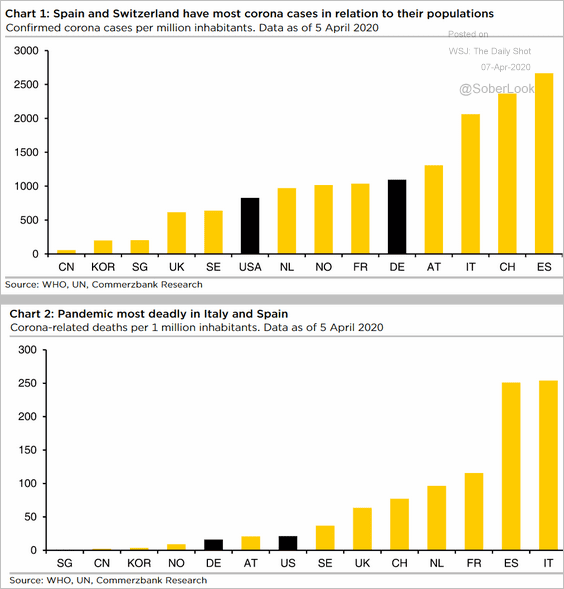 Source: Commerzbank Research
8. Physical activity in the US:
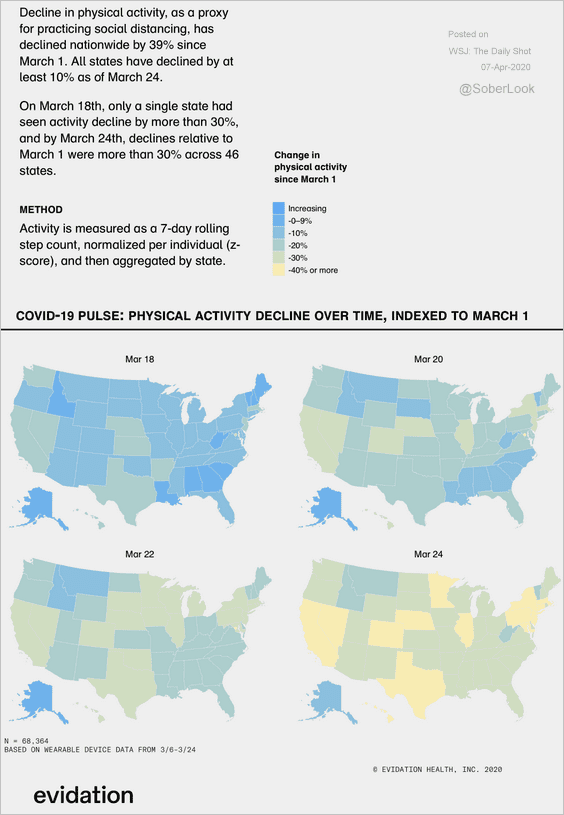 Source: CNBC Read full article
9. Protests around the world:
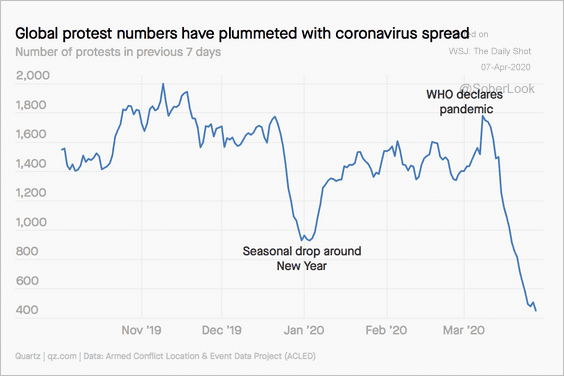 Source: Quartz Read full article
10. Best picture vs. the top-grossing movie that year:
 Source: Statista
——————–