
The Daily Shot: 22-Jun-20
• Equities
• Credit
• Rates
• Commodities
• Energy
• Emerging Markets
• China
• Asia – Pacific
• Europe
• The United Kingdom
• The United States
• Global Developments
• Food for Thought
Equities
1. The tech mega-cap stocks (FAANGM) now represent 24% of the S&P 500 market capitalization.
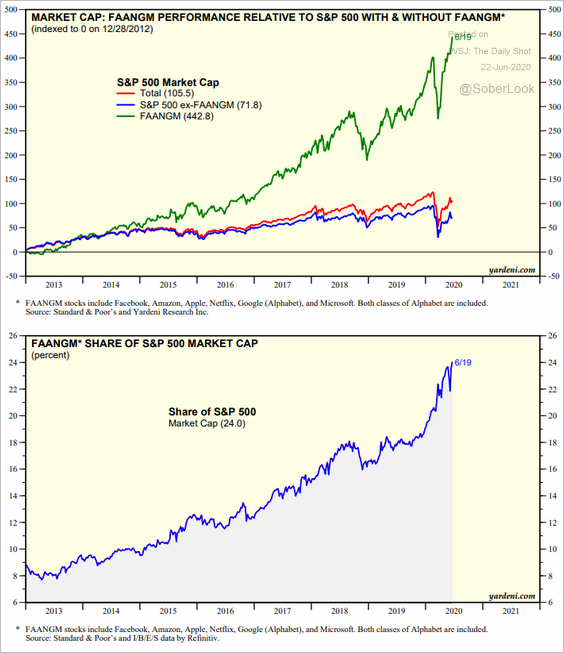 Source: Yardeni Research
The portion of the market’s lofty valuations attributed to FAANGM keeps climbing.
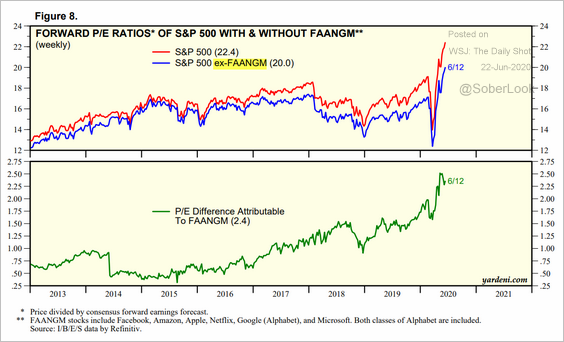 Source: Yardeni Research
——————–
2. Speculative accounts are increasingly short the S&P 500 futures (often as an offset to their long equity portfolios).
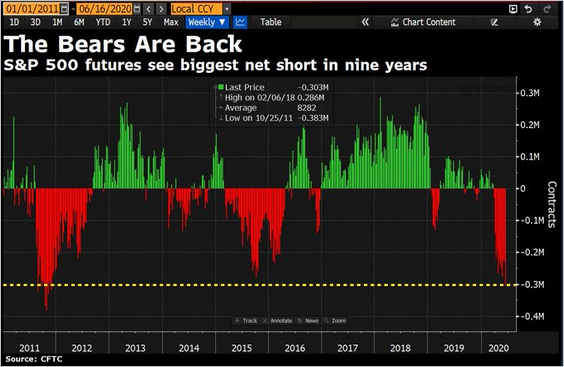 Source: @DavidInglesTV
• CTAs are now net long stock futures but remain relatively cautious.
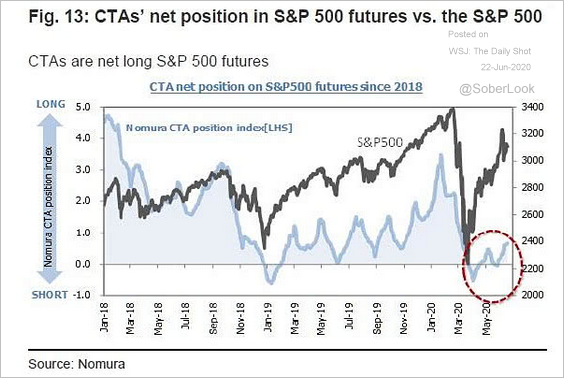 Source: @ISABELNET_SA, @Nomura
• Investment managers are bullish.
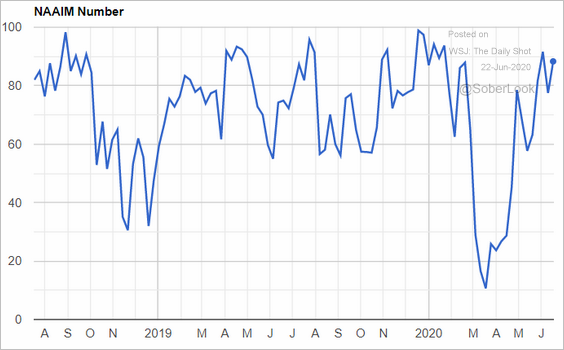 Source: @NAAIM_Official, {ht} @ISABELNET_SA
——————–
3. At current allocations, only a market selloff of 3% or more would prompt selling by vol control funds, according to Deutsche Bank.
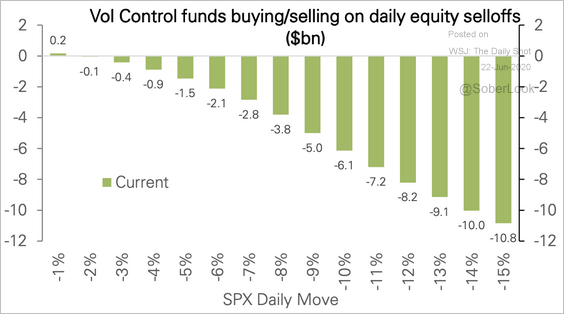 Source: Deutsche Bank Research
4. This chart shows the relative valuations of global value vs. growth shares.
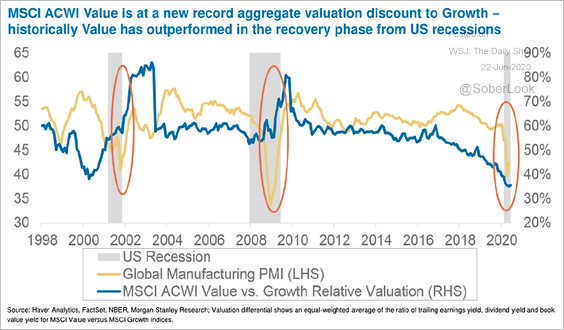 Source: @ISABELNET_SA, @MorganStanley
5. Share prices have diverged from profit margin expectations.
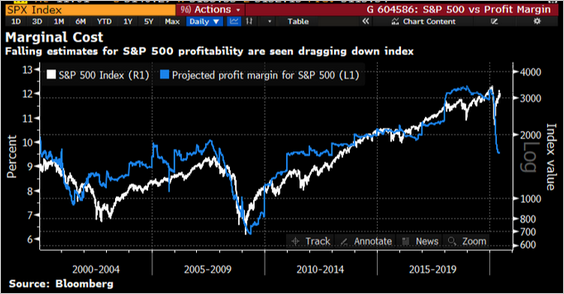 Source: @lisaabramowicz1, @theonedave
6. The market continues to ignore looming political risks, with potential tax hikes putting further pressure on earnings.
 Source: @WSJ Read full article
• The betting markets (2 charts):
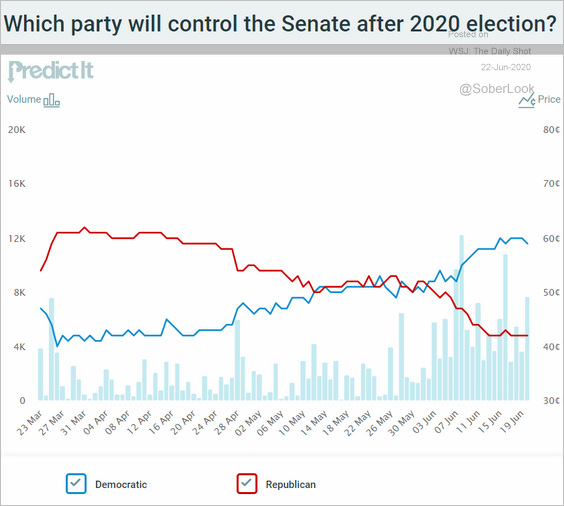 Source: @PredictIt
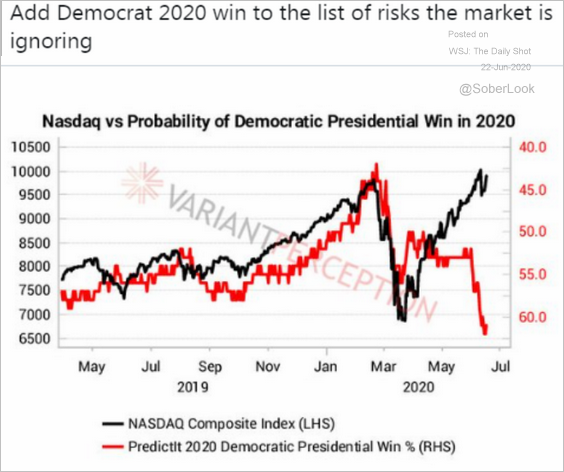 Source: @VrntPerception
• The impact of tax increases on earnings:
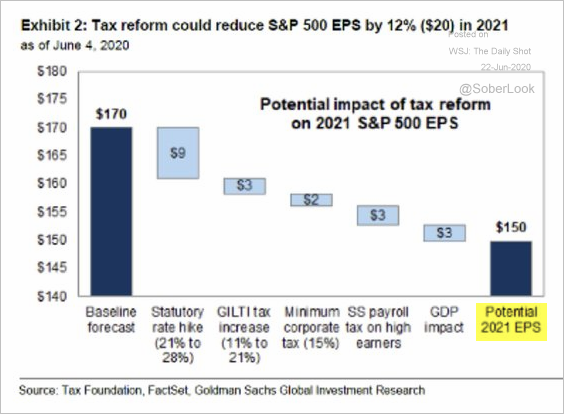 Source: Goldman Sachs, @Callum_Thomas, @westermangroup
——————–
7. Nearly a third of older investors sold all their equity holdings since the start of the crisis.
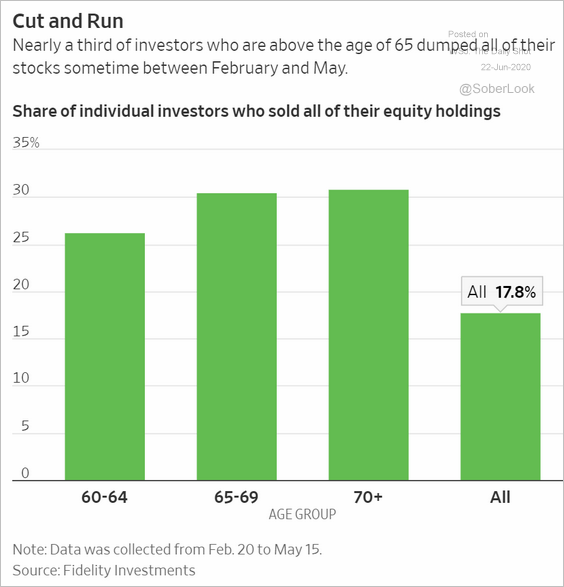 Source: @WSJ Read full article
8. Next, we have some sector updates.
• This chart shows sector dominance over time.
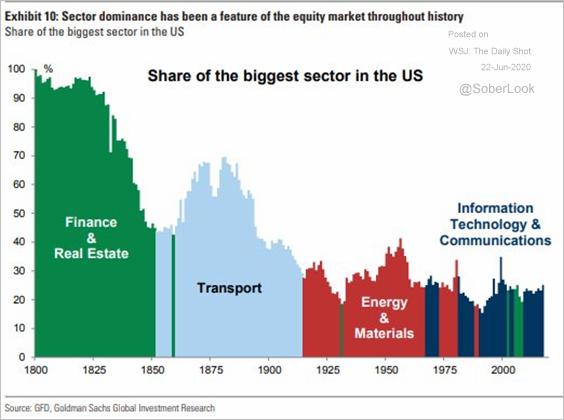 Source: @LizAnnSonders, @GoldmanSachs
• Below are analysts’ buy, hold, and sell ratings by sector.
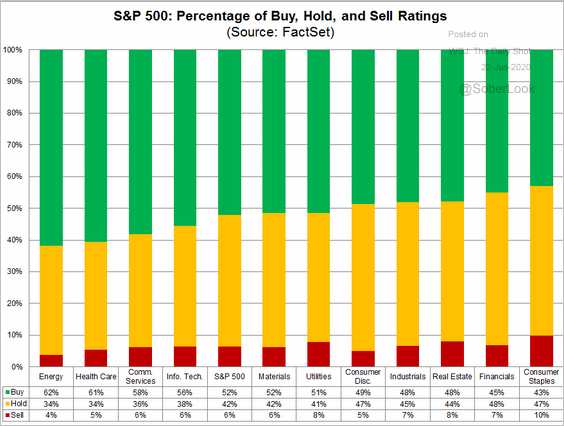 Source: @FactSet Read full article
• Industrials have been sensitive to the US dollar.
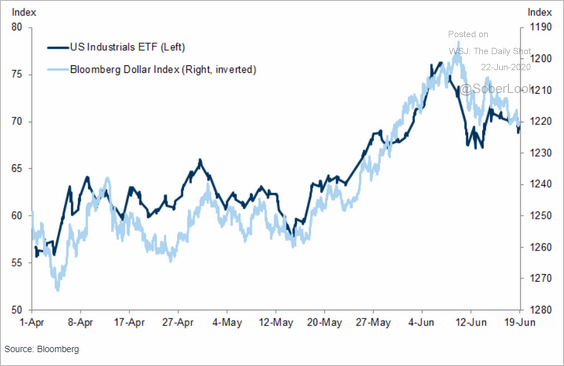 Source: Goldman Sachs
• Tech stocks account for about 17% of the S&P 500’s dividends, but the sector’s yield remains relatively low.
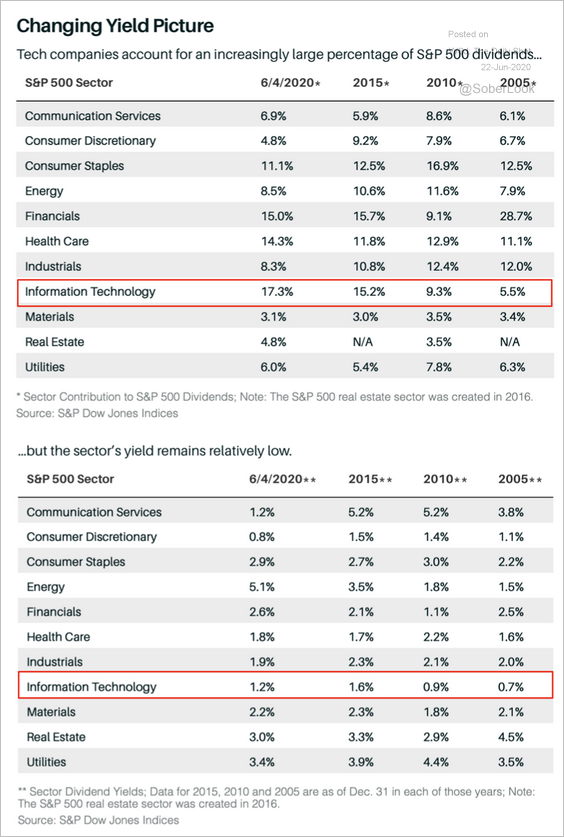 Source: @barronsonline Read full article
• The SPDR metals and mining ETF (XME) has underperformed the S&P 500 for several years and is now at a relative bottom.
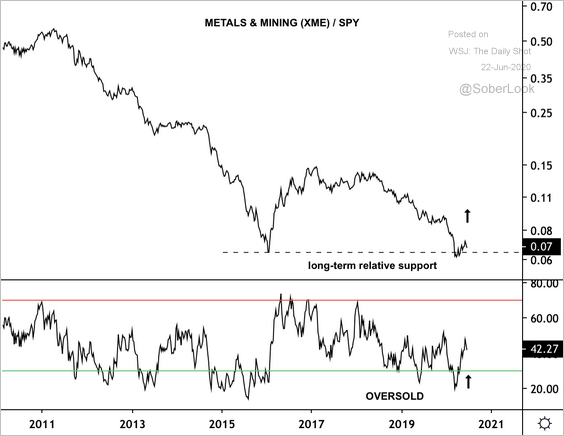 Source: @DantesOutlook Read full article
• Biotech shares have been outperforming.
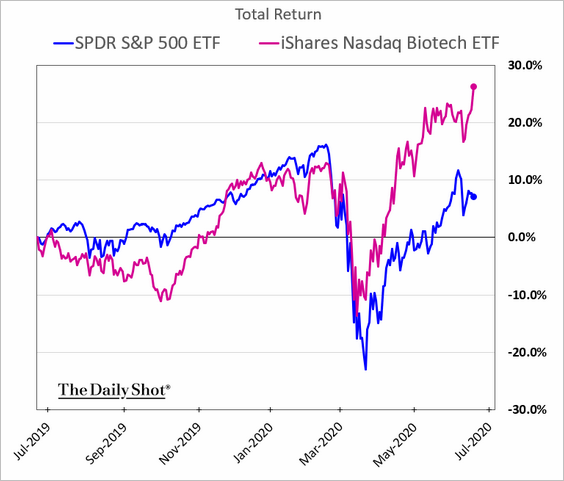 h/t Nancy Moran
But as a whole, healthcare registered substantial outflows recently.
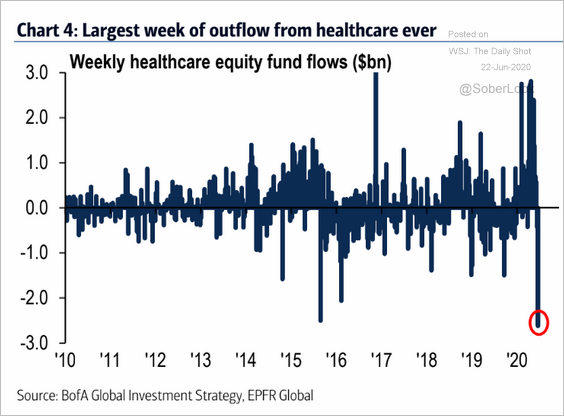 Source: BofA Merrill Lynch Global Research
Credit
1. The cost of debt capital for US investment-grade firms has never been this low.
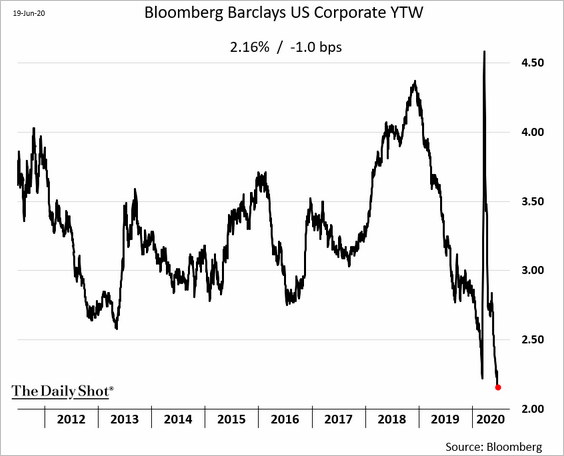
The Fed’s recent actions invited quite a bit of capital into corporate bonds.
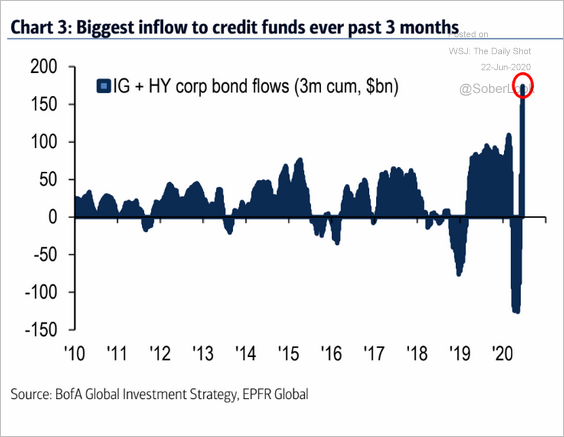 Source: BofA Merrill Lynch Global Research
——————–
2. Sub-investment-grade debt sales have been robust (2 charts).
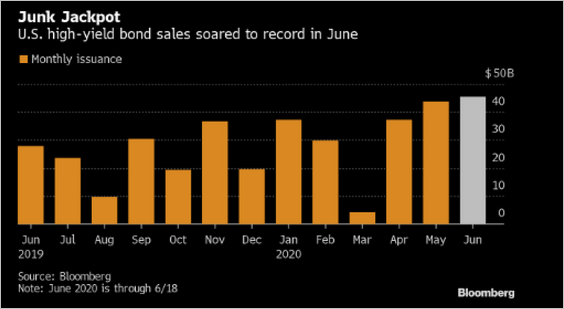 Source: @lisaabramowicz1 Read full article
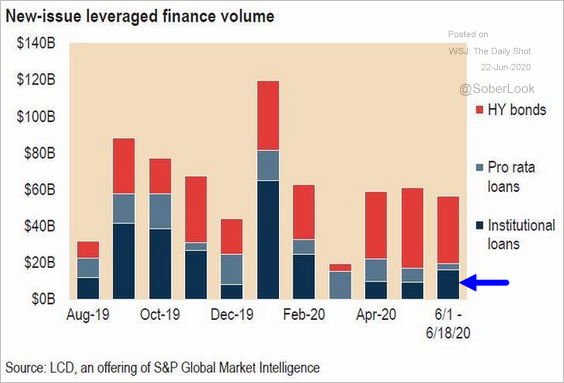 Source: @lcdnews, @JakemaLewis
——————–
3. A substantial amount of investment-grade credit remains at-risk of downgrades (fallen angels).
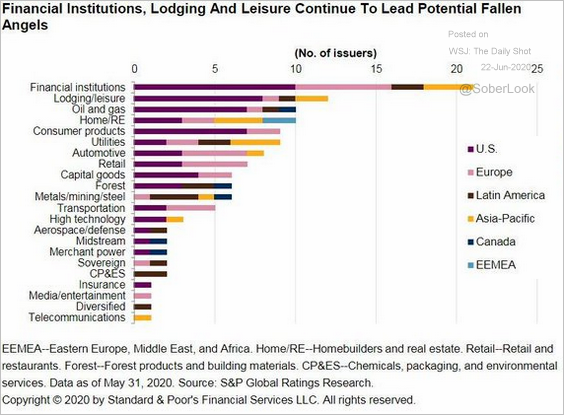 Source: @lcdnews Read full article
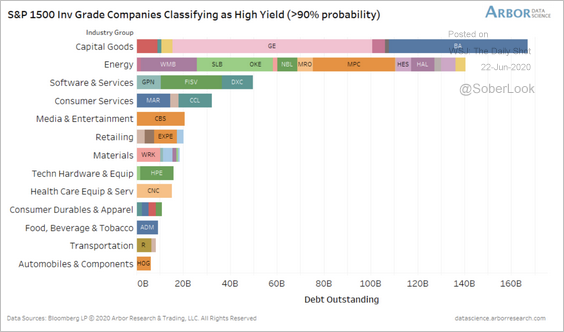 Source: Arbor Research & Trading
——————–
4. Federal Home Loan Banks (FHLBs) raised short-term debt in March to finance their loans to member banks.
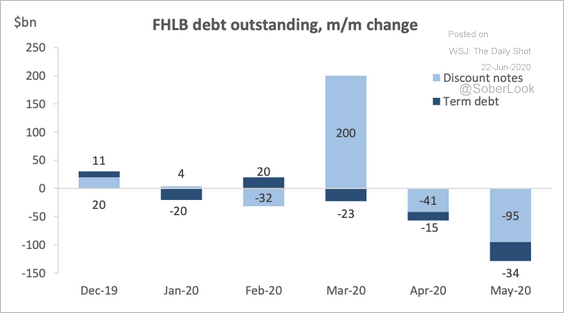 Source: Deutsche Bank Research
FHLBs provided liquidity to US banks during the initial crunch of the financial crisis and the current pandemic.
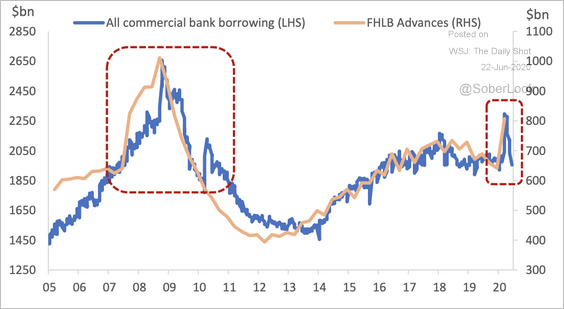 Source: Deutsche Bank Research
Rates
1. Long-term Treasuries have outperformed the S&P 500 by a significant margin.
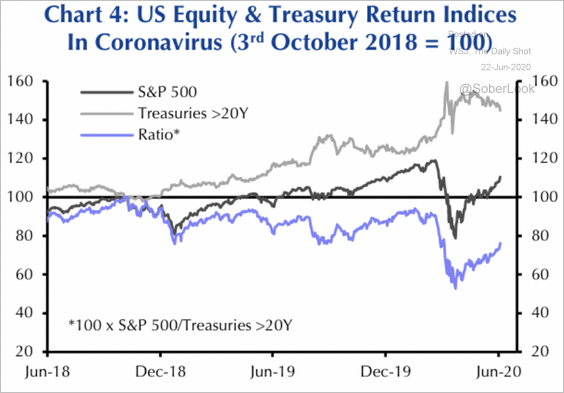 Source: Capital Economics
2. The interest rate currently paid by the US federal government is the lowest on record.
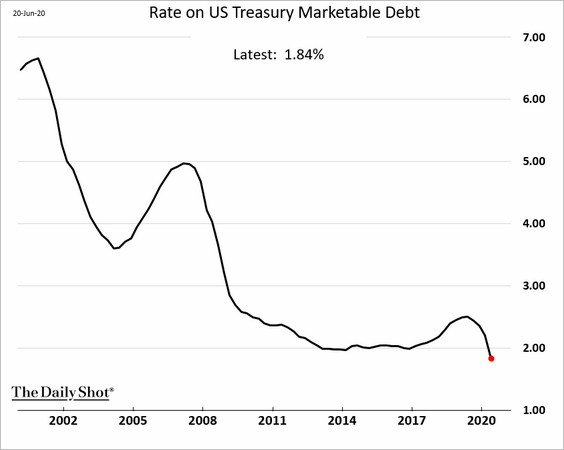 h/t @mccormickliz
3. Demand for the Fed’s liquidity swaps with other central banks has been easing as funding pressures abate.
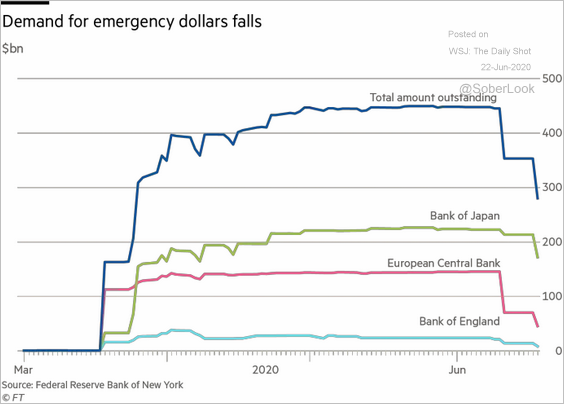 Source: @financialtimes Read full article
Commodities
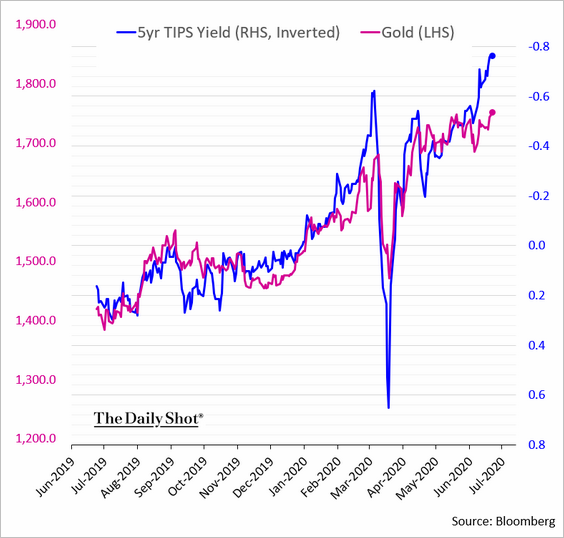
1. With US effective real rates moving deeper into negative territory, …
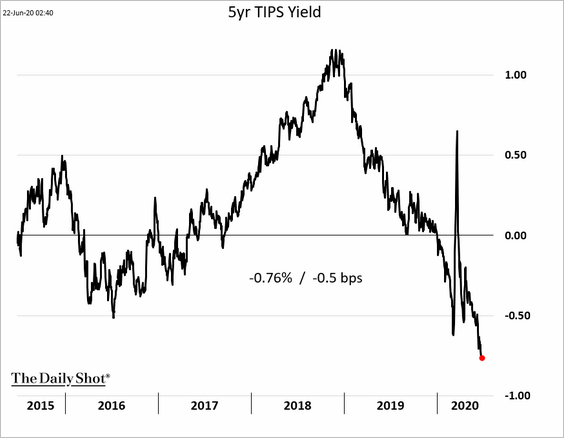
… gold has been rallying (2 charts).
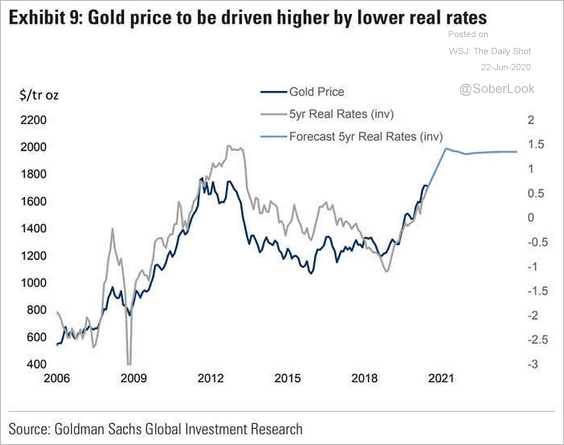 Source: @GoldmanSachs
——————–
2. Silver appears oversold relative to gold.
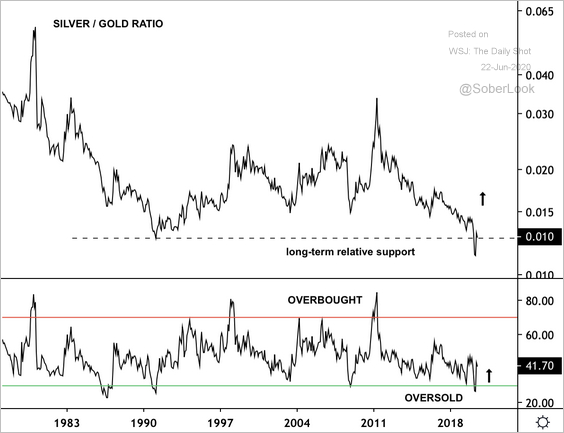 Source: @DantesOutlook Read full article
Energy
1. Brent is starting to move into backwardation.
 h/t Andrew Janes
2. Is the rebound in gasoline demand stalling?
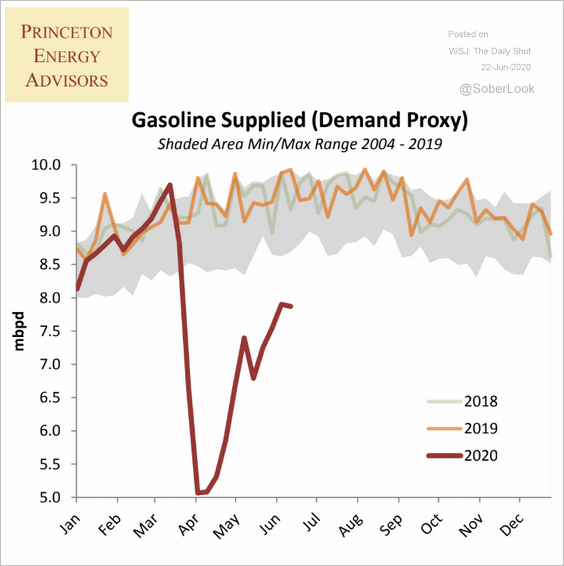 Source: Princeton Energy Advisors
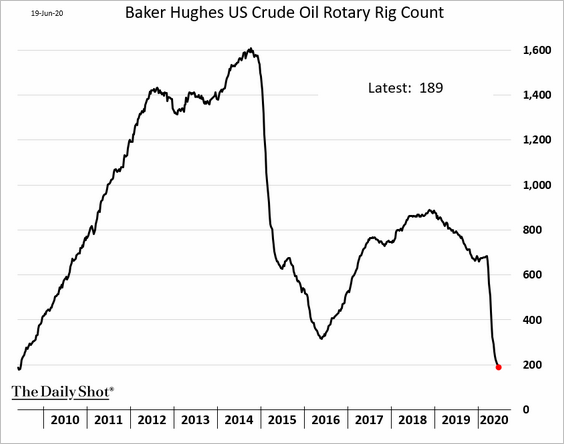
3. The US oil rig count continues to decline, albeit at a slower pace.
Emerging Markets
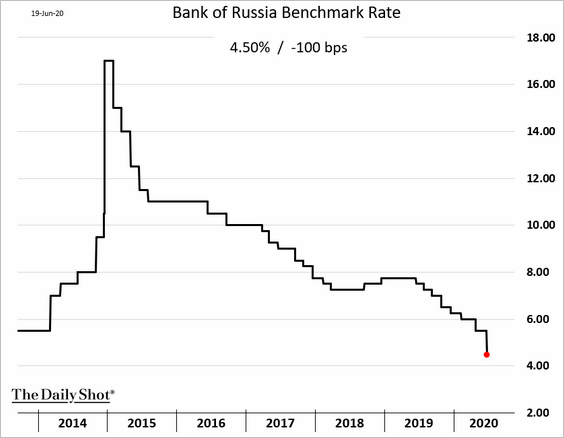
1. Let’s begin with Russia, where the central bank cut rates aggressively in response to a worsening economic situation.
• The benchmark rate:
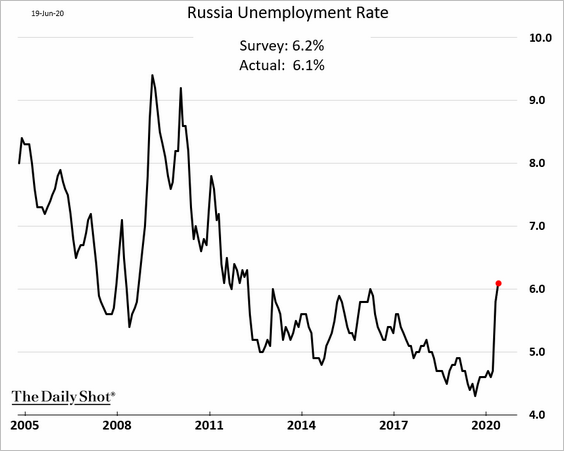
• Unemployment (through May):
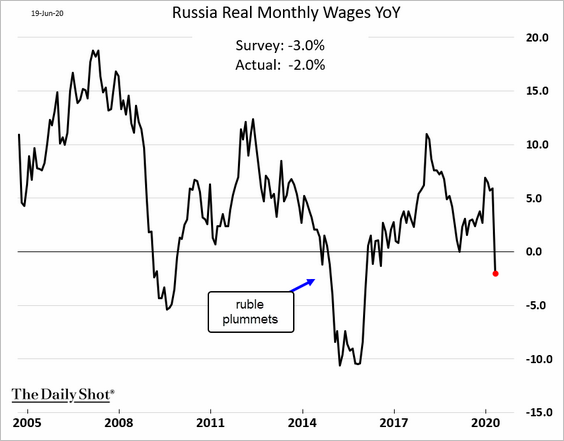
• Wages:
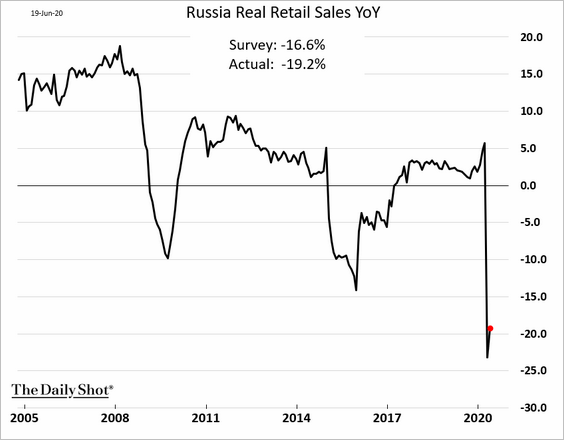
• Retail sales (through May):
——————–
2. Iran’s currency hit a record low against the dollar as the economy deteriorates further.
 Source: @markets Read full article
This chart shows how many Iranian rials it takes to buy one US dollar.
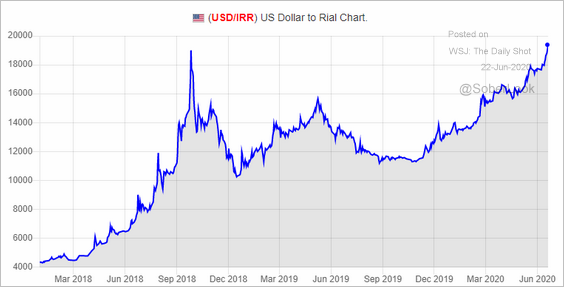 Source: Bonbast.com
——————–
3. The market expects further rate cuts in Mexico as the COVID-19 situation worsens (second chart).
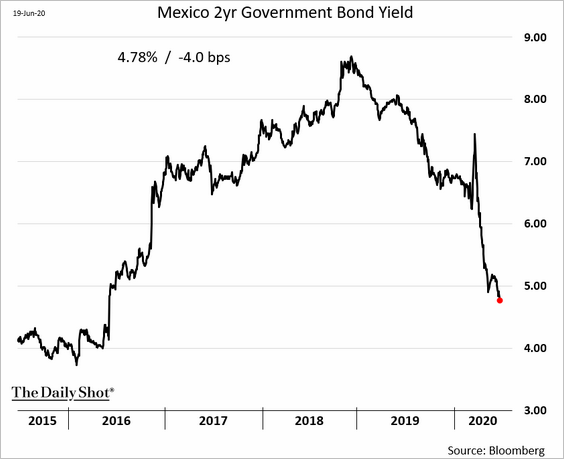
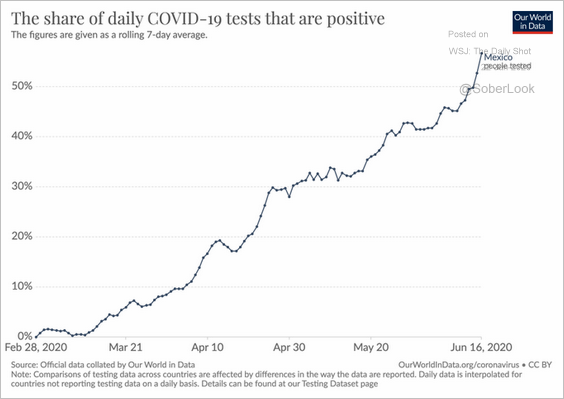 Source: @MaxCRoser Read full article
China
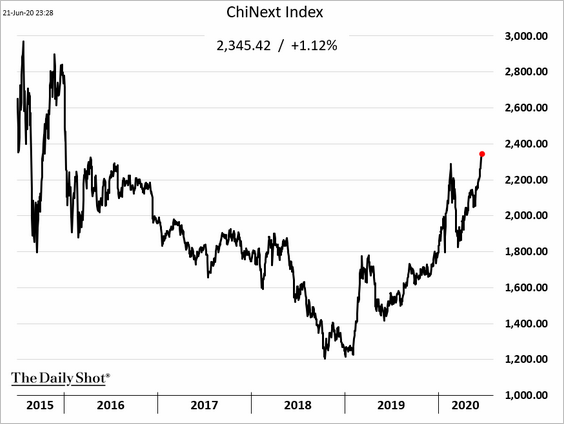
1. The equity rally is occurring amid underwhelming corporate profits, similar to 2014-2015.
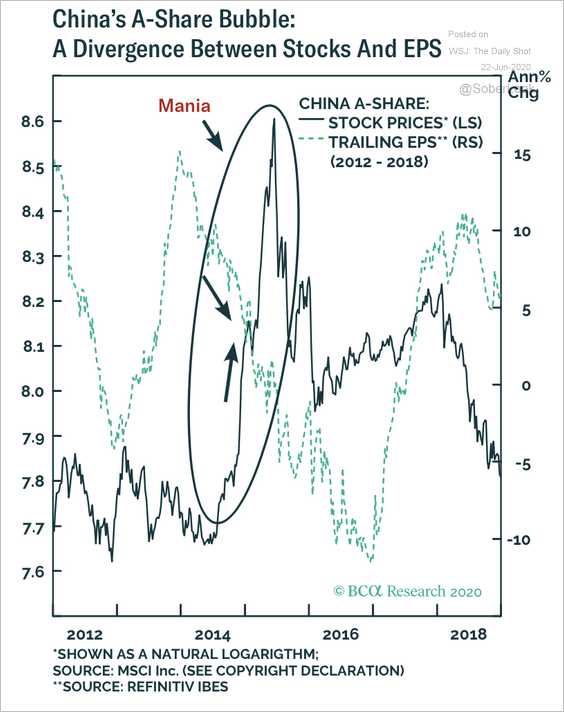 Source: BCA Research
ChiNext, which tracks small growth companies, hit a multi-year high.
——————–
2. Banks trade at the lowest price-to-book ratio in over a decade.
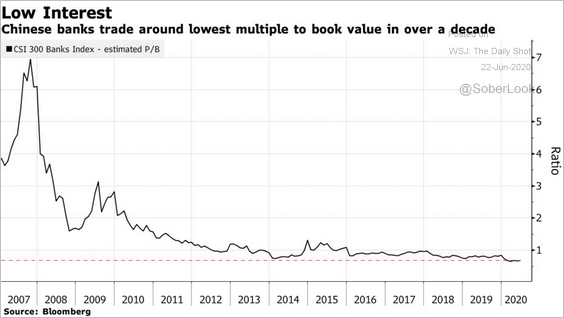 Source: @markets Read full article
3. Car sales and property sales have rebounded.
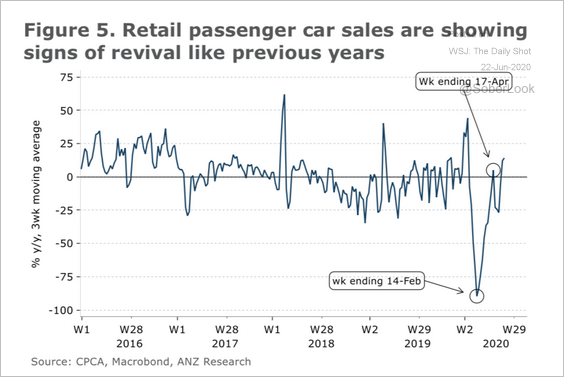 Source: ANZ Research
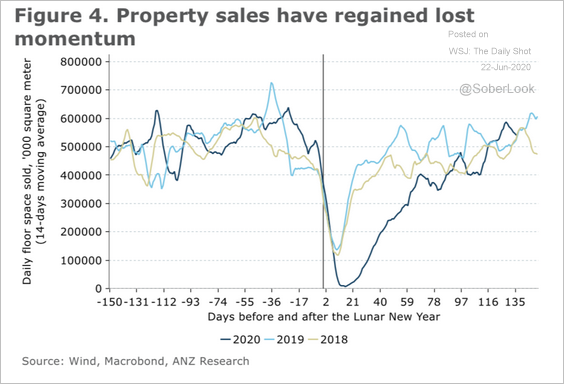 Source: ANZ Research
Asia – Pacific
1. South Korea’s exports bounced from the lows this month (2 charts).
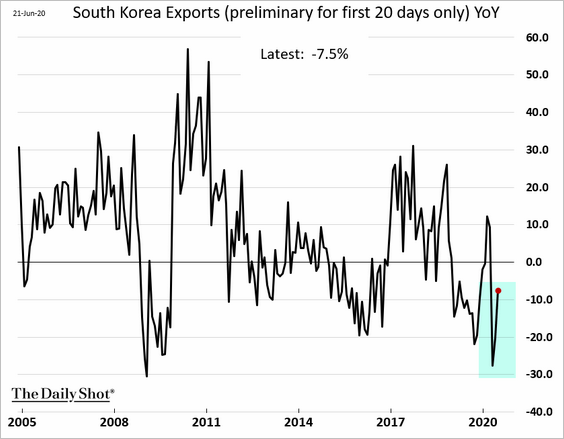
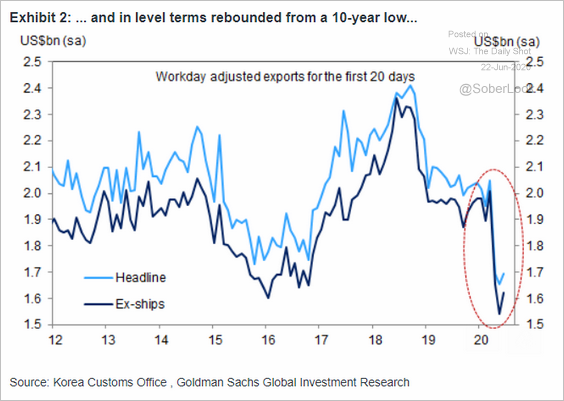 Source: Goldman Sachs
——————–
2. Next, we have some data on Taiwan’s recovery (from ANZ).
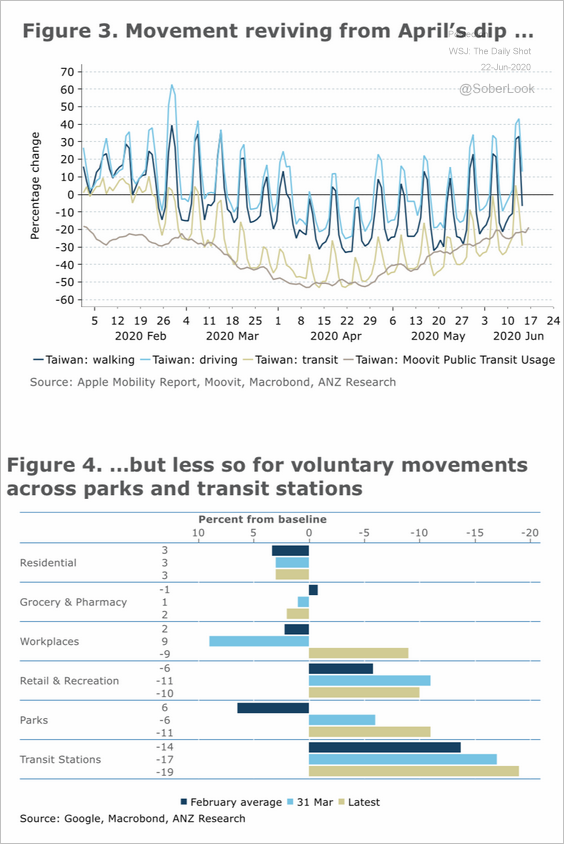 Source: ANZ Research
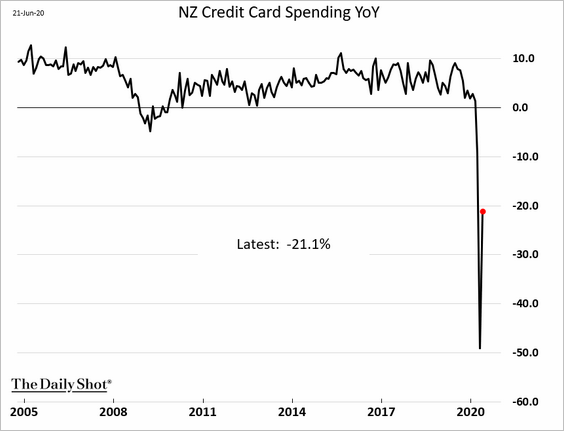
3. New Zealand’s credit card spending improved in May.
5. Analysts are boosting stock price targets.
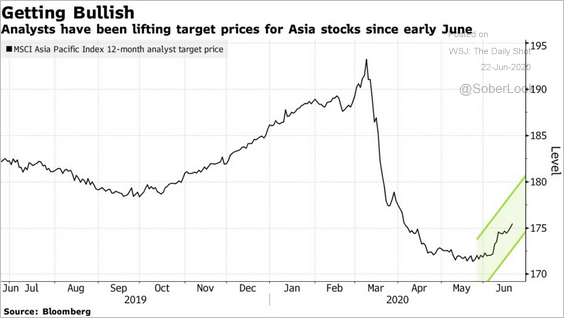 Source: @markets Read full article
Europe
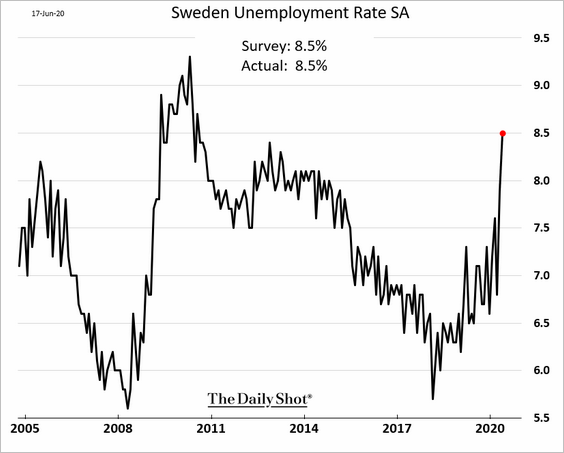
1. Sweden’s unemployment rate rose to the highest level since 2010.
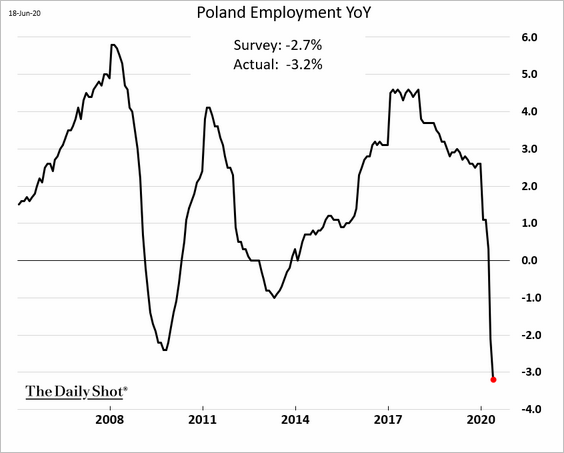
2. Poland’s labor market hit a wall in May.
3. Switzerland’s central bank (SNB) has aggressively intervened in the currency markets to keep the franc from appreciating too much.
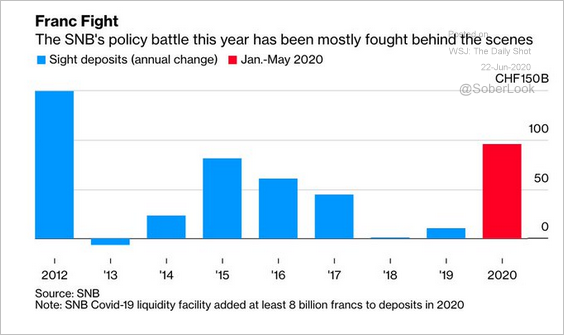 Source: @acemaxx, @economics Read full article
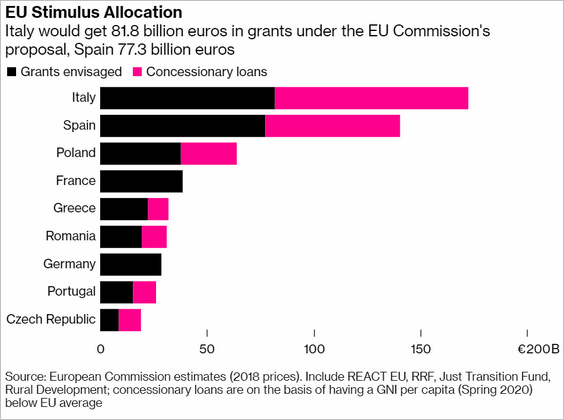
4. How is the EU stimulus allocated?
5. How satisfied are EU citizens with member nations’ solidarity in fighting the pandemic?
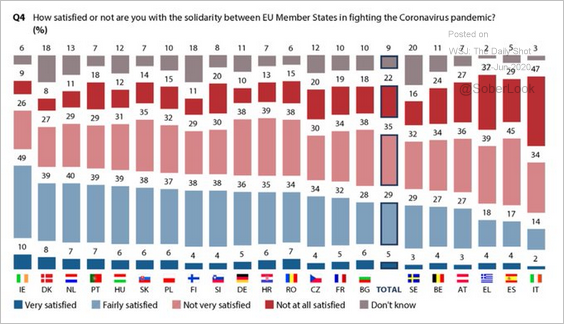 Source: @adam_tooze Read full article
6. The Eurozone’s negotiated wage growth is expected to slow sharply.
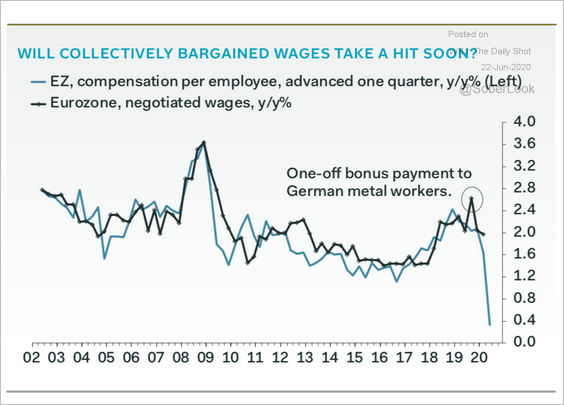 Source: Pantheon Macroeconomics
The United Kingdom
1. Public sector borrowing spiked this year, …
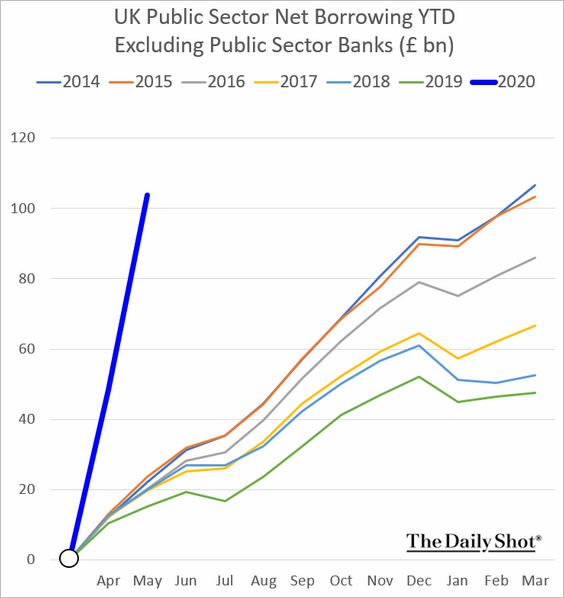
… with the debt-to-GDP ratio exceeding 100%.
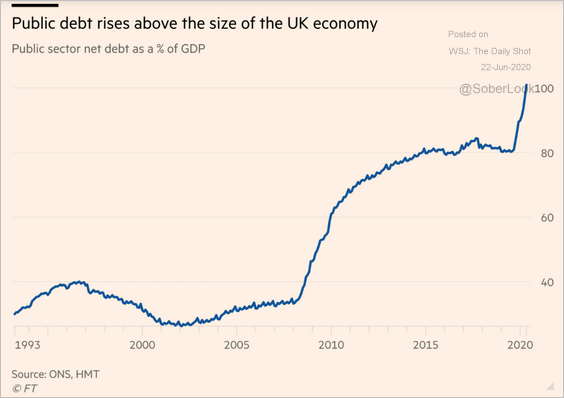 Source: @financialtimes Read full article
And there is much more to come, according to Pantheon Macroeconomics.
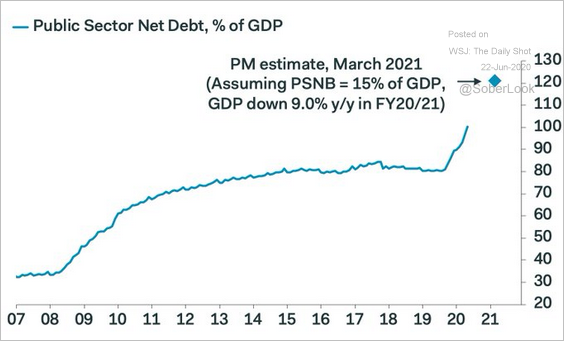 Source: @samueltombs
——————–
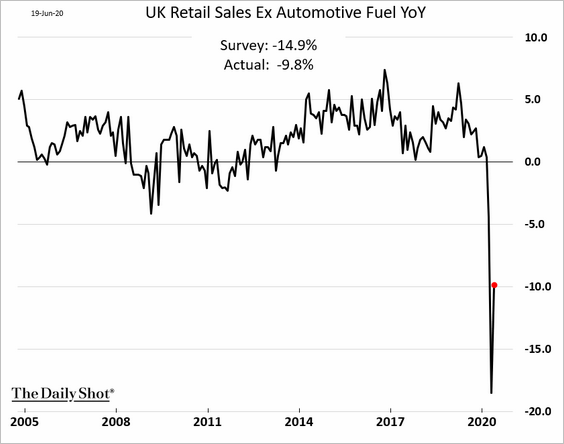
2. The rebound in retail sales last month topped economists’ forecasts.
The United States
1. The World Economics staffing levels index bounced from the lows in June but remains depressed. The US labor market’s recovery has a long way to go.
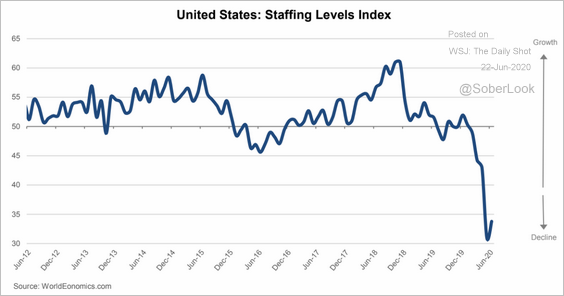 Source: World Economics
2. Mortgage credit has tightened sharply since the start of the crisis.
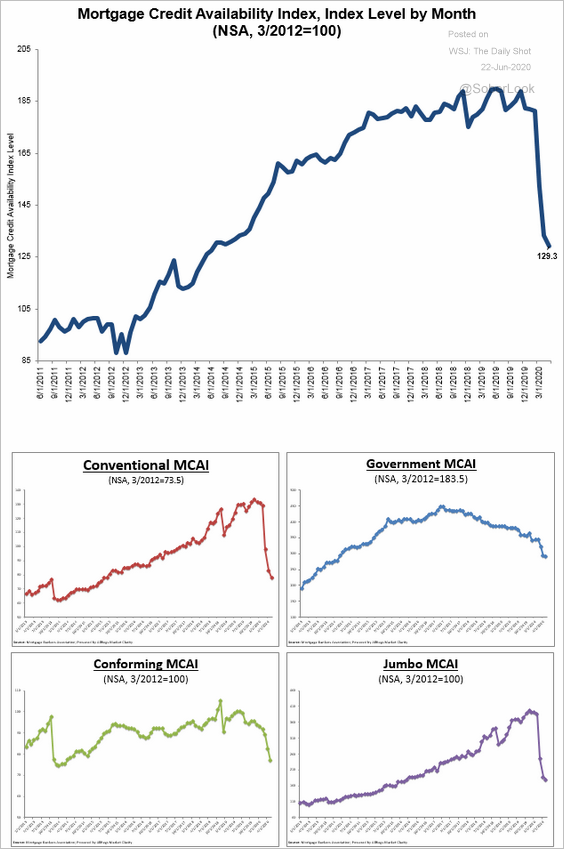 Source: Mortgage Bankers Association
At the same time, searches for inspections and appraisals are rising along with real estate listings.
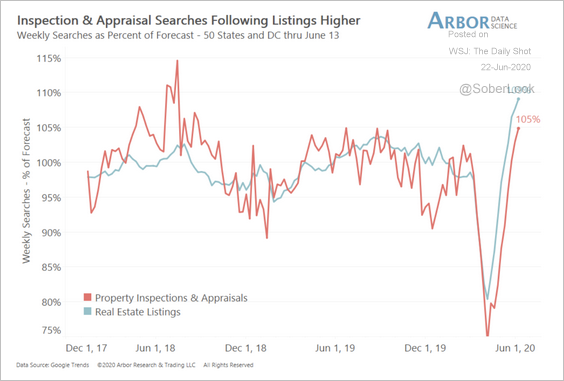 Source: Arbor Research & Trading
And housing inventories continue to fall.
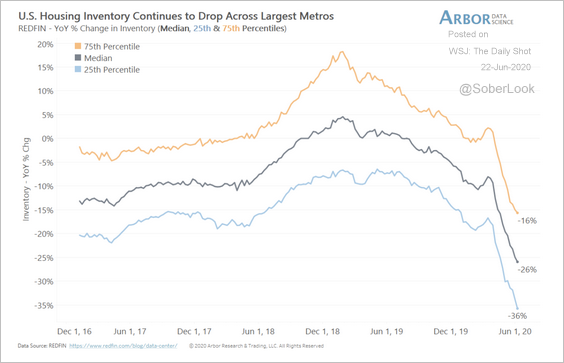 Source: Arbor Research & Trading
——————–
3. CapEx expectations have deteriorated sharply this year, according to Morgan Stanley.
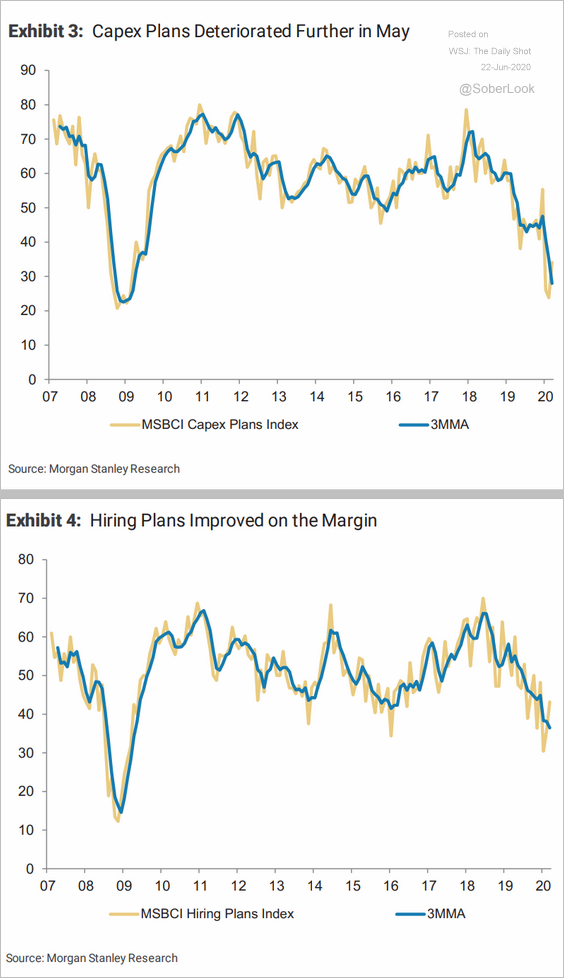 Source: Morgan Stanley Research
By the way, the composition of business investment has changed substantially in recent decades.
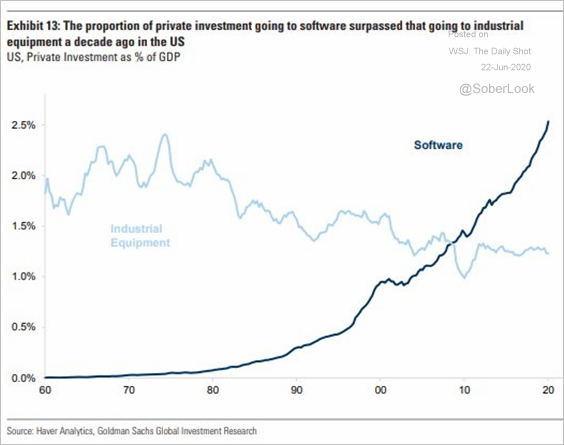 Source: @LizAnnSonders, @GoldmanSachs
——————–
4. The US COVID-19 situation isn’t good. While the economy is “reopening,” consumers will remain extremely cautious. With a trend like this, are Americans ready to send their kids back to school?
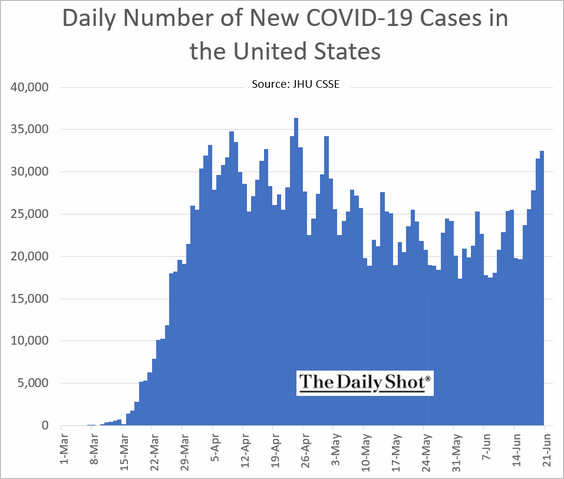
And it’s not about the testing.
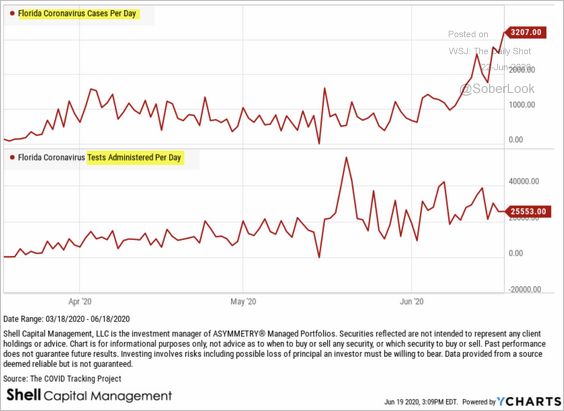 Source: ASYMMETRY Observations Read full article
Global Developments
1. Traders have turned bearish on the US dollar (2 charts).
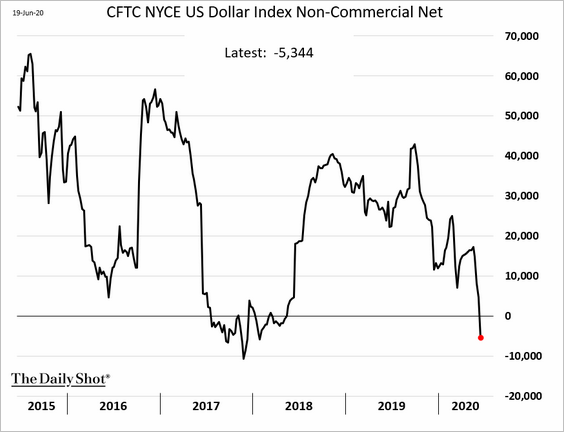
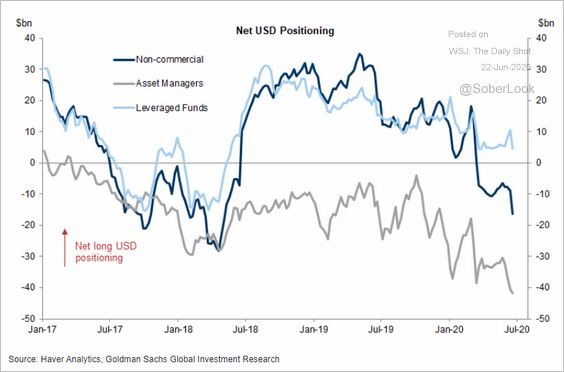 Source: Goldman Sachs
However, retail investors have been placing bullish bets on the dollar.
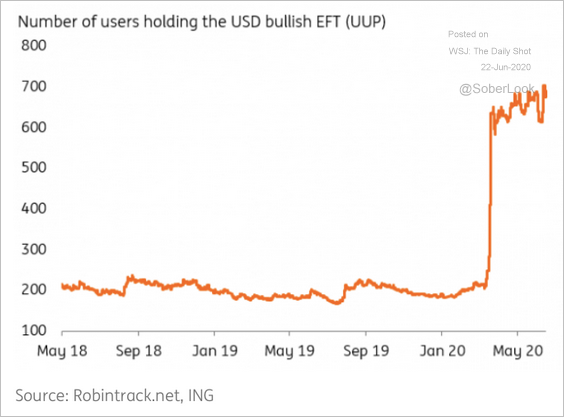 Source: ING
——————–
2. Profitability at European and Japanese banks has been lagging global peers.
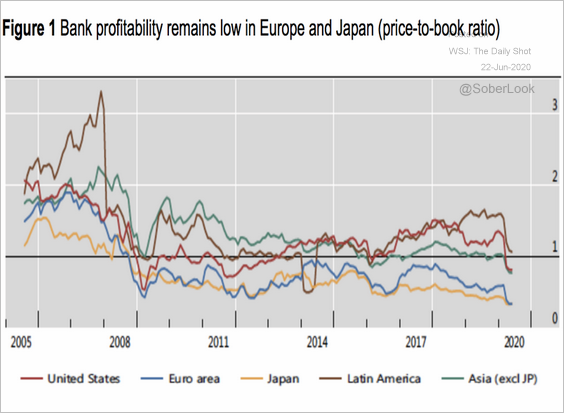 Source: VOX EU Read full article
3. Household savings increased around the world.
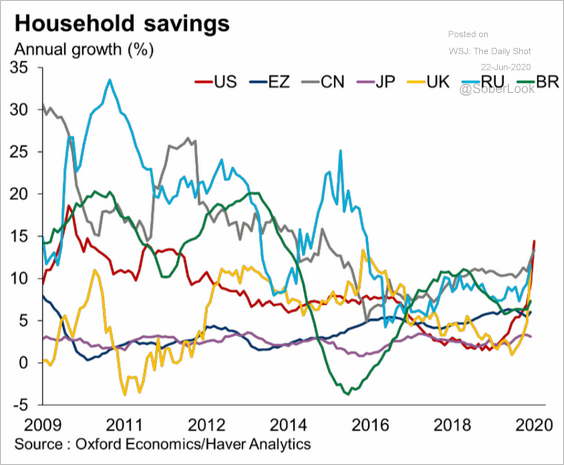 Source: Oxford Economics
——————–
Food for Thought
1. How each generation cut back on expenses (from The Manifest):
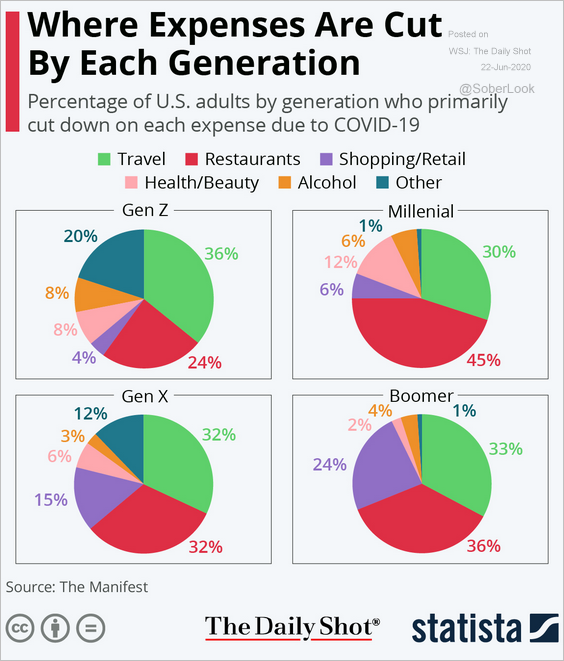 Source: Statista
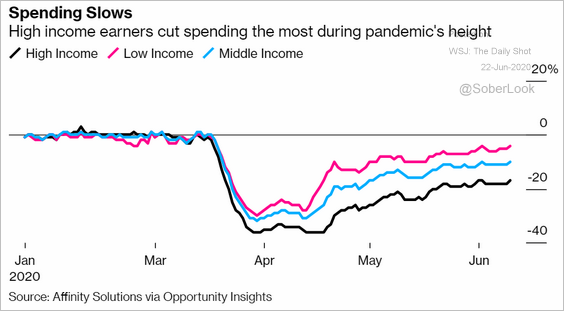
2. Consumer spending by income category:
 Source: @business Read full article
3. Vacation plans:
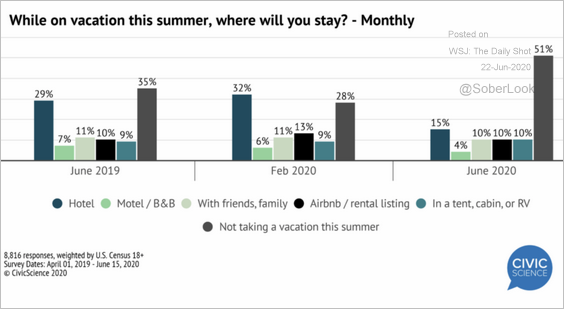 Source: @CivicScience Read full article
4. Key provisions in the US stimulus bill:
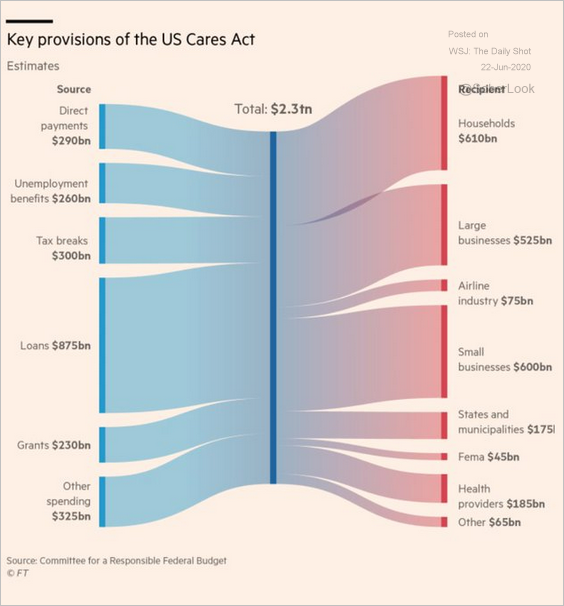 Source: @adam_tooze, @FT Read full article
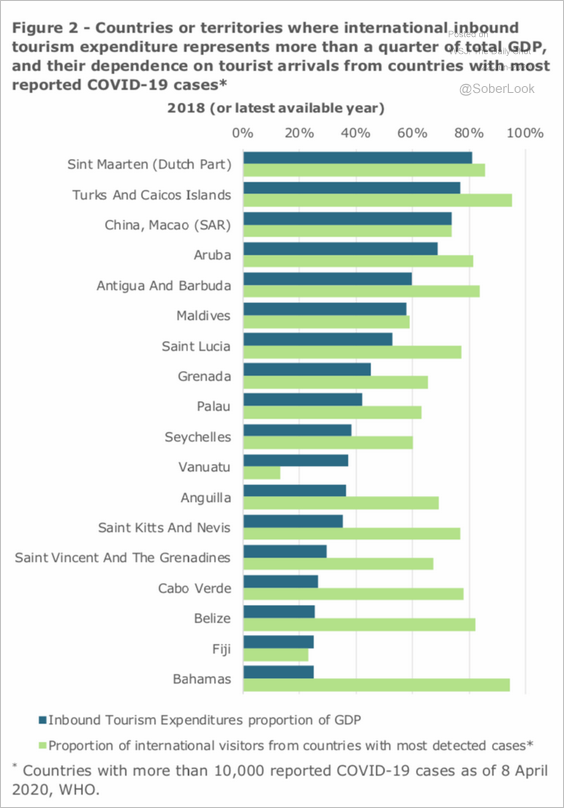
5. Tourism trends (2 charts):
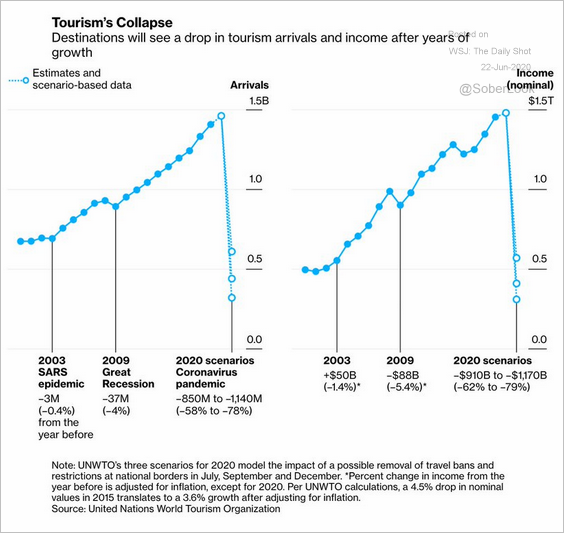 Source: @adam_tooze, @UNWTO, @DPogkas Read full article
 Source: Committee for the Coordination of Statistical Activities Read full article
——————–
6. COVID-19 tests globally:
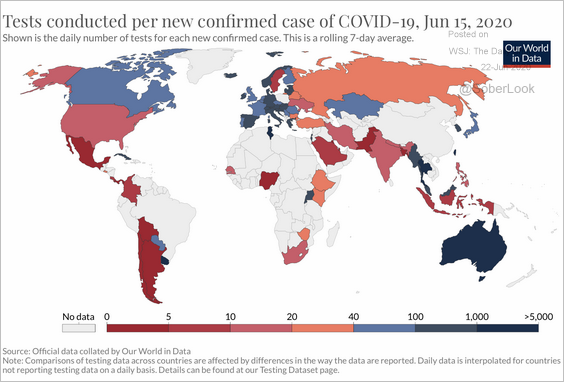 Source: Our World in Data Read full article
7. US R&D spending:
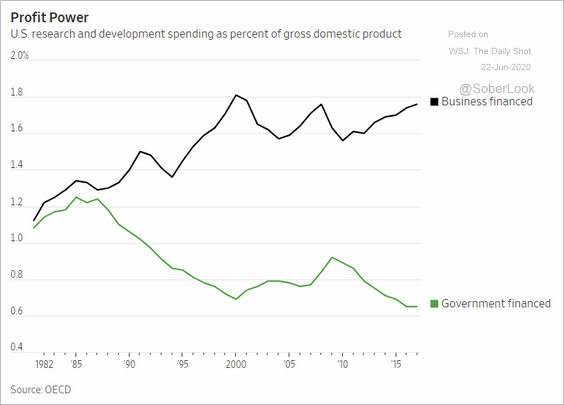 Source: @WSJ Read full article
8. Views on Confederate statues:
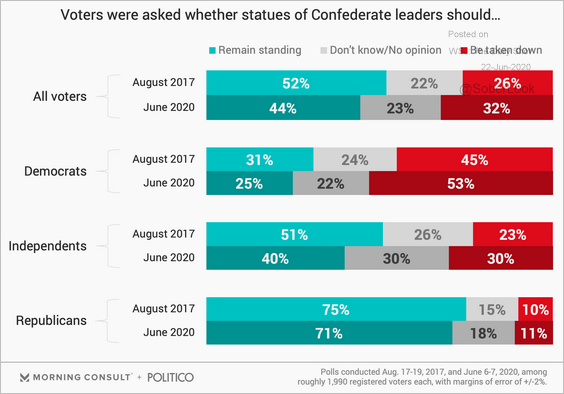 Source: Morning Consult Read full article
9. LASIK surgeries in the US:
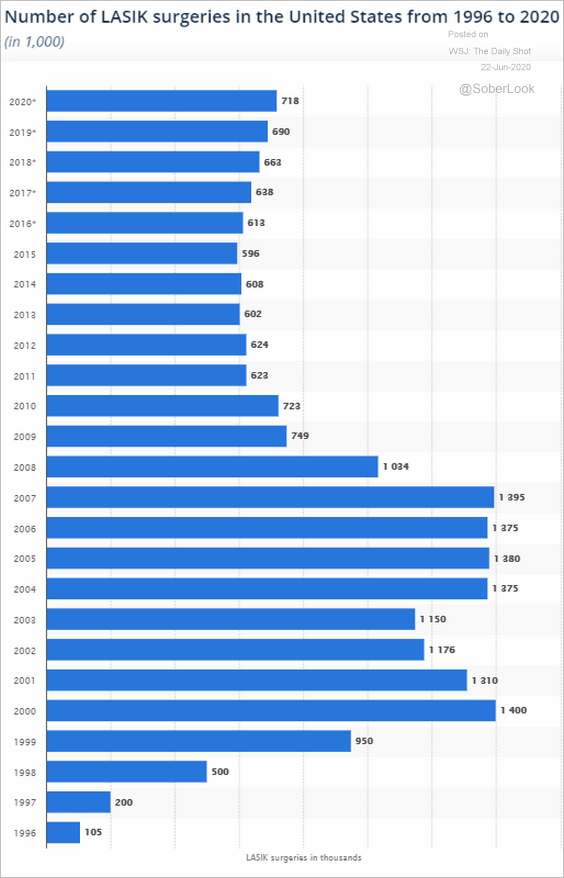 Source: Statista
——————–