
The Daily Shot: 02-Jul-20
• Administrative Update
• The United States
• The United Kingdom
• The Eurozone
• Europe
• Japan
• China
• Emerging Markets
• Commodities
• Energy
• Equities
• Credit
• Global Developments
• Food for Thought
Administrative Update
1. As a reminder, the Daily Shot will not be published on Friday, July 3rd.
2. Please note that Gmail tends to cut off the Daily Shot about two-thirds of the way through the letter. Here are two ways to get around this limitation.
• Click on “View entire message” at the end,

• or click on “View in web browser” at the beginning (recommended).

The United States
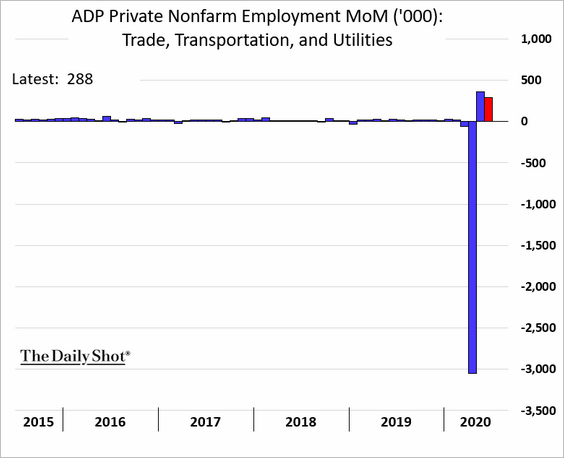
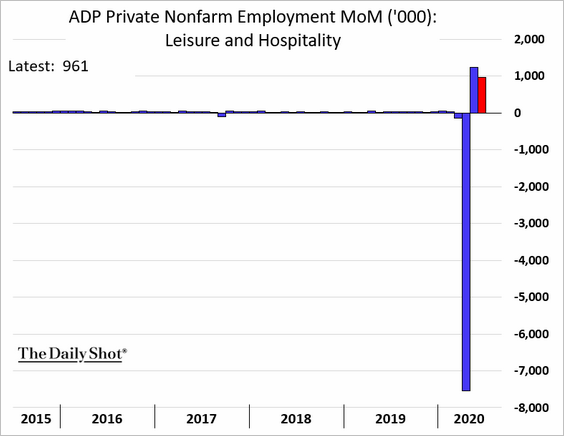
1. The ADP private payrolls report showed continuing rehiring in June, but the pace of job gains was somewhat disappointing.
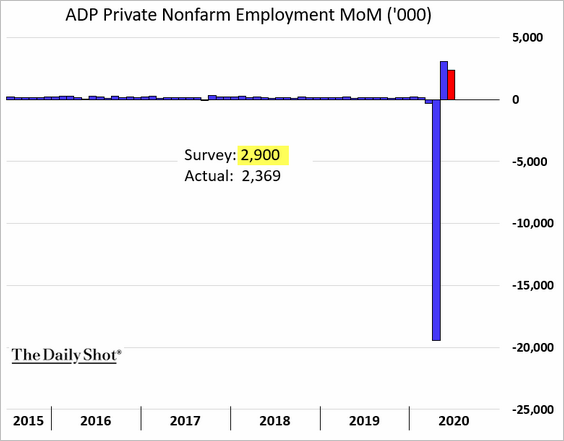
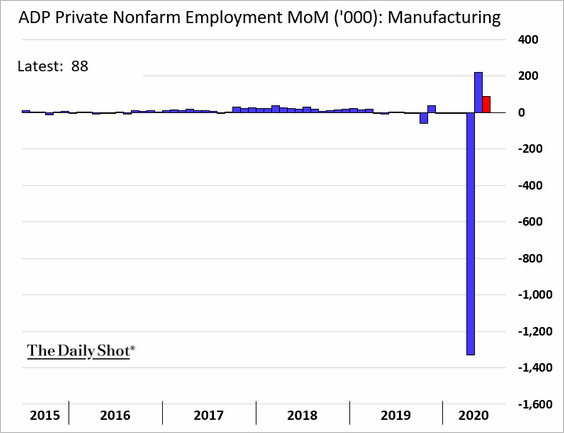
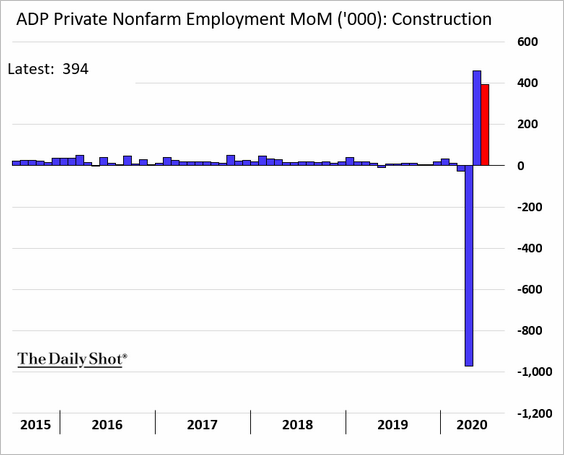
Here are some of the sector trends from the report (month-over-month changes).
• Manufacturing:
• Construction:
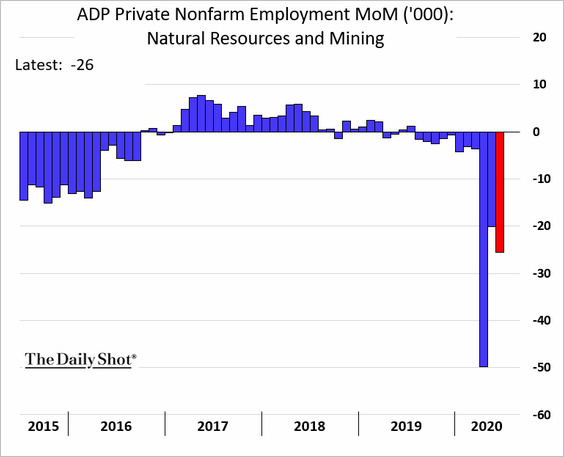
• Natural Resources (mostly oil & gas):
• Trade, Transportation, and Utilities:
• Leisure and Hospitality:
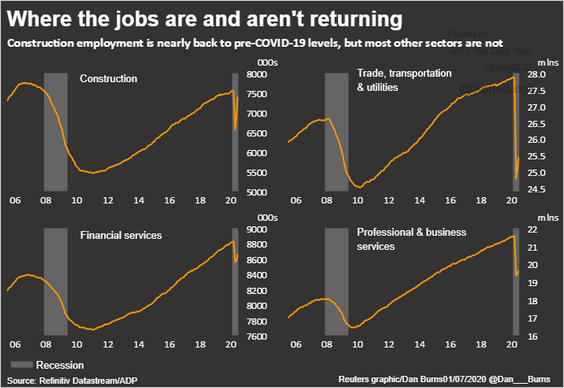
Below are some charts from Reuters that show the level of payrolls (rather than monthly changes).
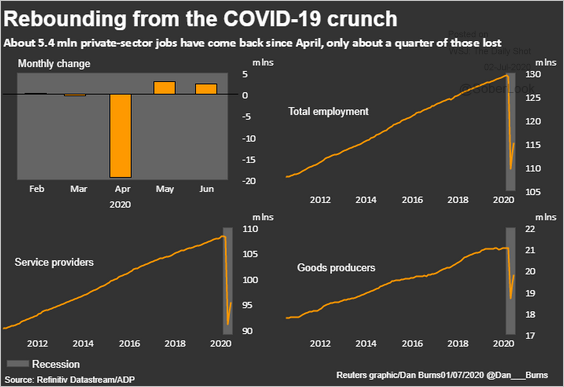 Source: Reuters Read full article
 Source: Reuters Read full article
——————–
2. Next, we have a few other updates on the labor market.
• This chart shows survey-based trends on rehiring through the first half of June.
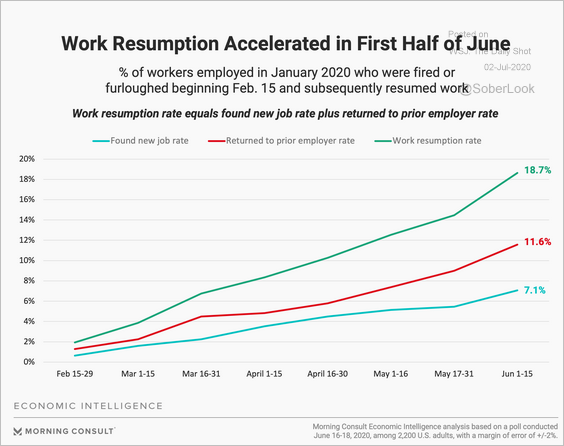 Source: Morning Consult Read full article
• The recovery in small business jobs is expected to stall in July.
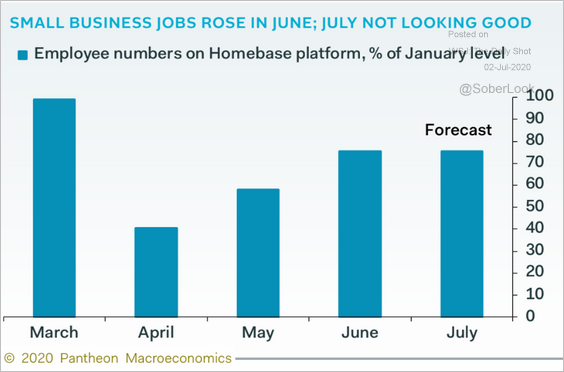 Source: Pantheon Macroeconomics
• Morgan Stanley estimates the June unemployment rate at 11.2%.
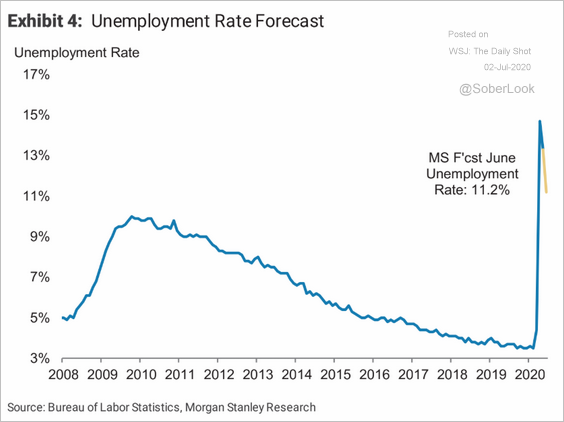 Source: Morgan Stanley Research
——————–
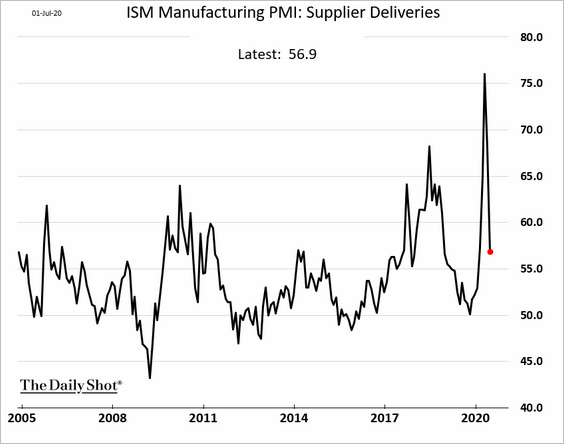
3. The ISM Manufacturing PMI, a closely watched indicator of US factory activity, topped economists’ forecasts. The headline index saw the biggest monthly increase in June since 1980 as manufacturing returns to growth (PMI > 50).
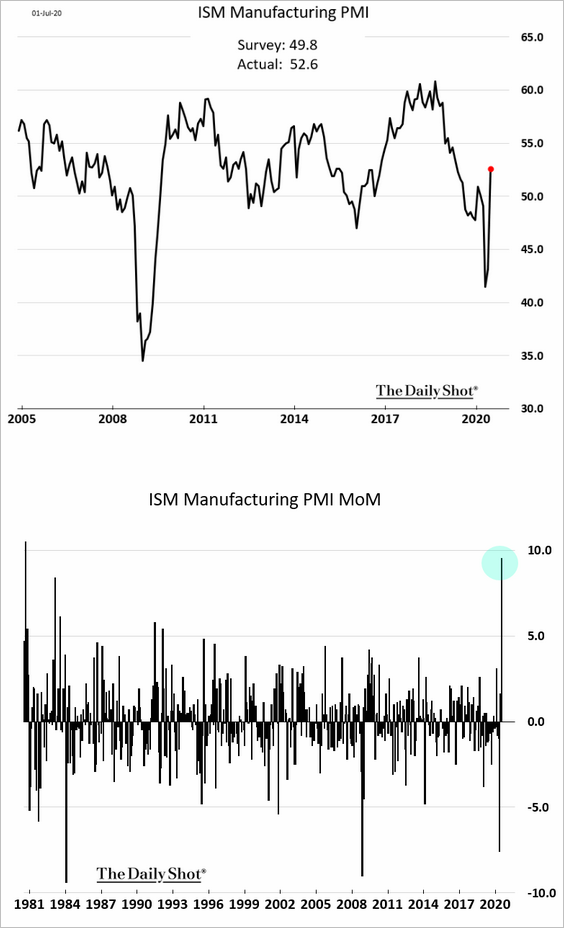
Pandemic-related supplier bottlenecks are easing.
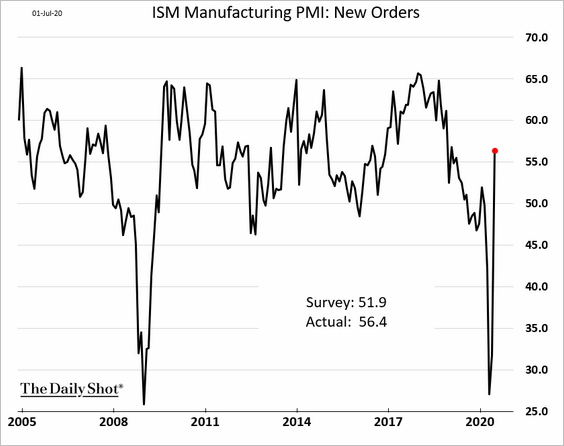
Here are some of the other components of the ISM index.
• New orders:
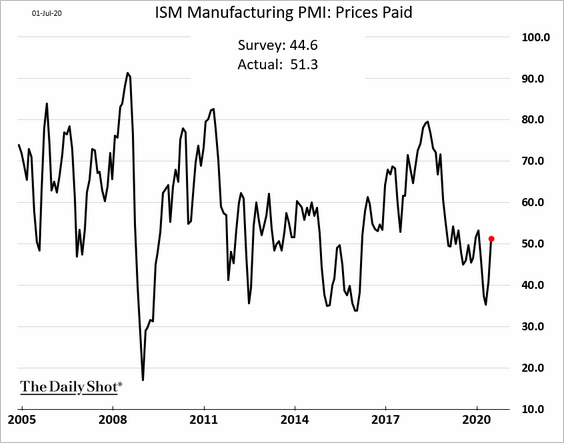
• Prices paid:
• Employment:
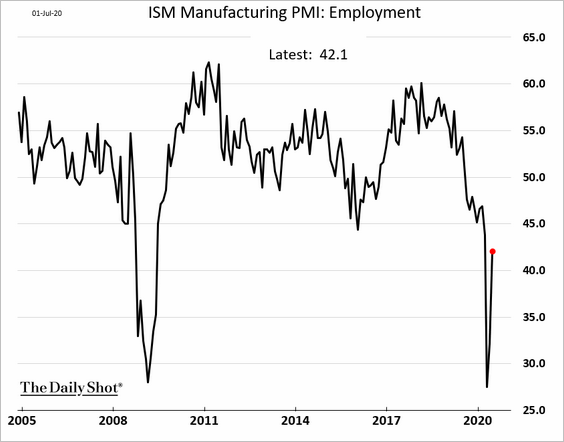
Note that employment gains are lagging production.
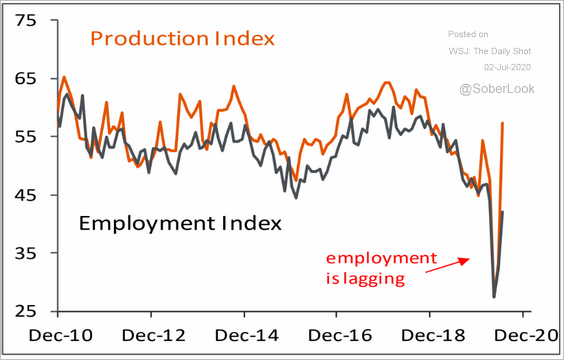 Source: Piper Sandler
It may be some time before we see these ISM gains show up in US manufacturing output figures.
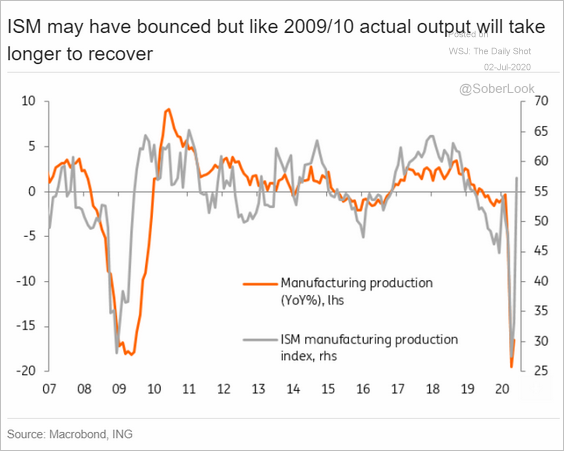 Source: ING
——————–
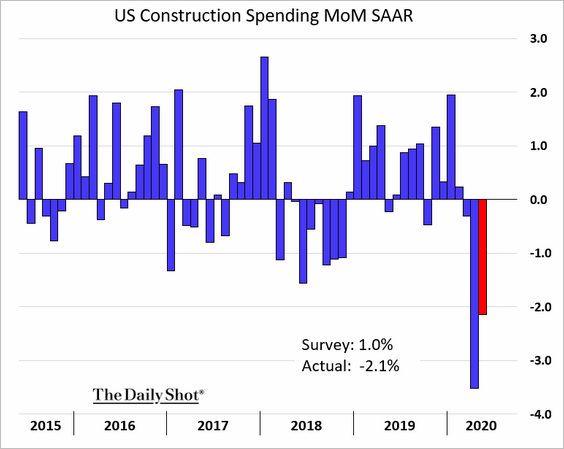
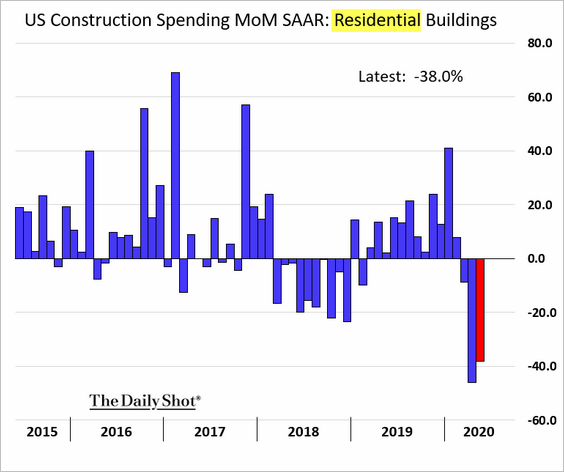
4. Construction spending declined again in May.
——————–
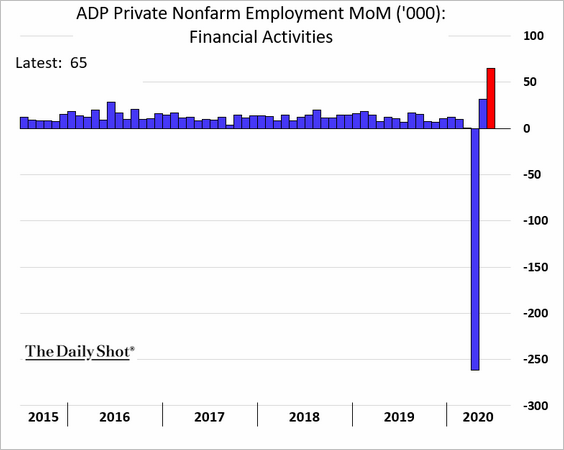
5. Mortgage applications to purchase a home are holding at multi-year highs (for this time of the year).
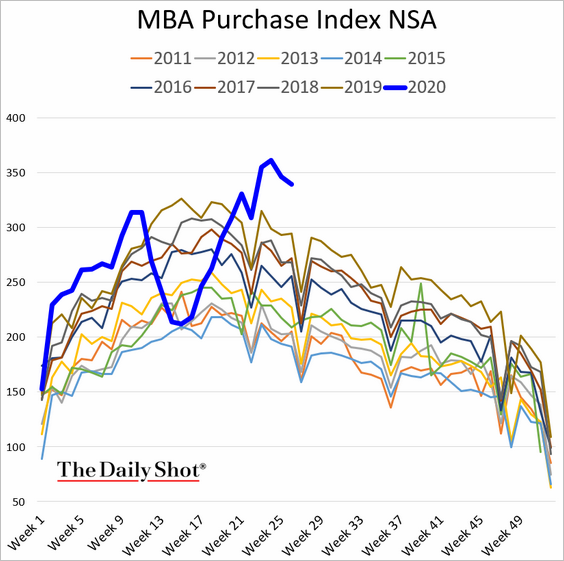
The strength in mortgage applications (including refi) is one of the reasons financial services hiring jumped in June.
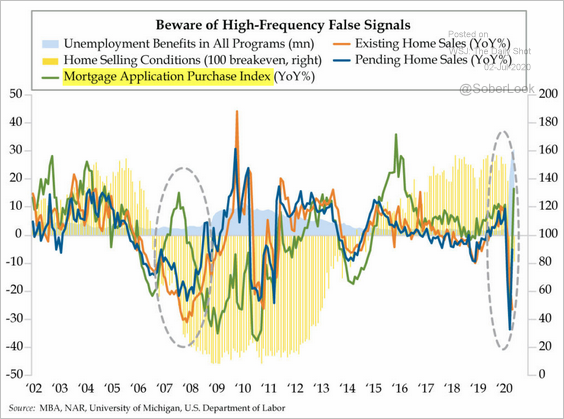
By the way, mortgage applications don’t always translate into housing market strength.
 Source: The Daily Feather
——————–
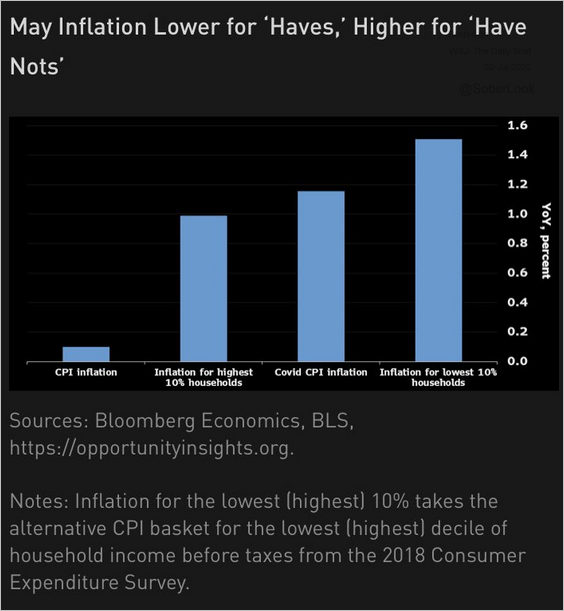
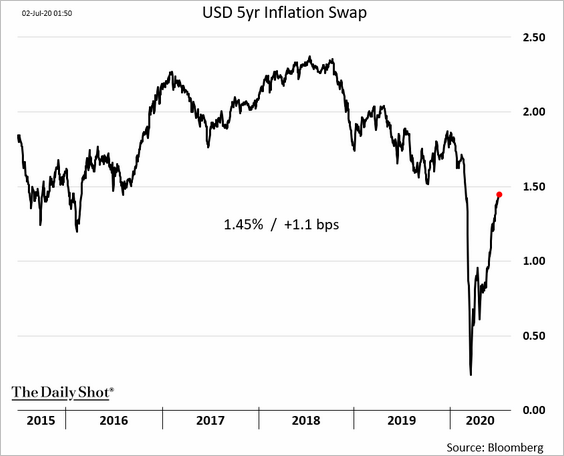
6. How Americans have experienced inflation during the pandemic varies by income.
 Source: @lisaabramowicz1, @economics
Separately, market-based inflation expectations continue to rebound.
——————–
7. Here is the Oxford Economics US recovery tracker.
![]() Source: Oxford Economics
Source: Oxford Economics
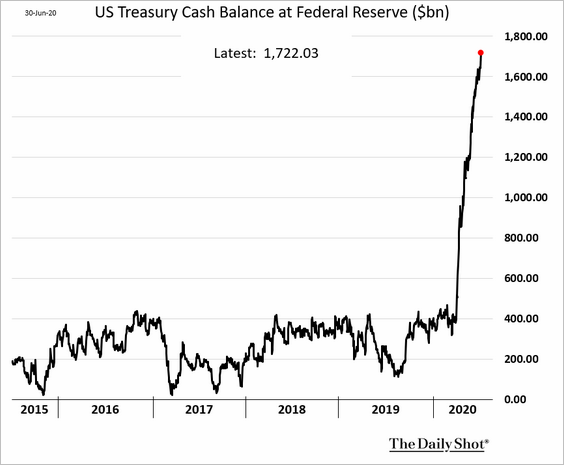
8. Finally, the US Treasury’s cash balance at the Fed is now above $1.7 trillion as the government continues with its accelerated pace of debt issuance.
The United Kingdom
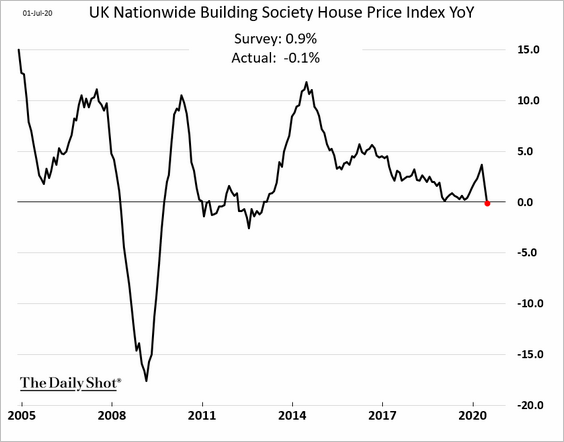
1. Home prices unexpectedly declined in June.
 Source: Reuters Read full article
——————–
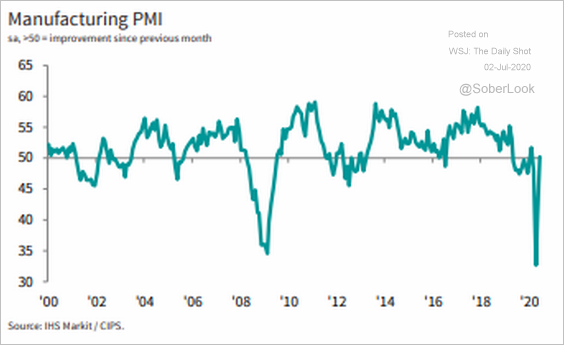
2. The nation’s factory activity stabilized in last month.
 Source: @IHSMarkitPMI Read full article
The Eurozone
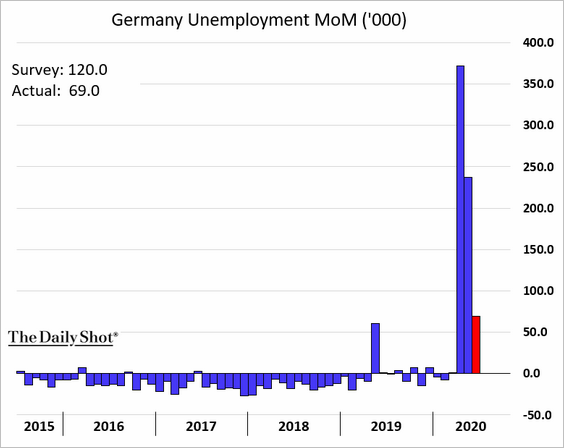
1. Let’s begin with Germany.
• Job losses in June were substantially below the consensus estimate.
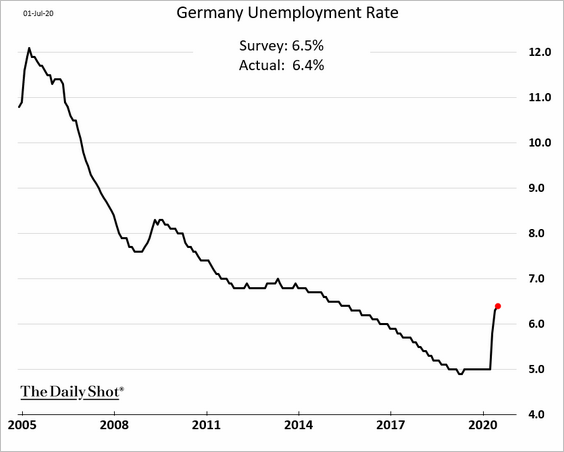
• The unemployment rate ticked higher.
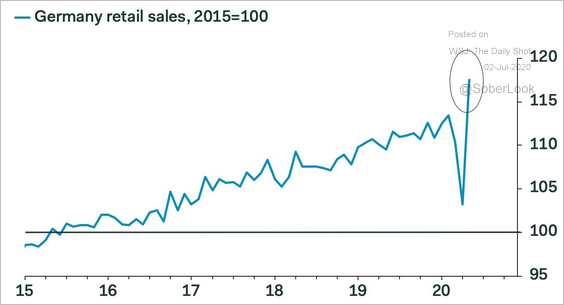
• Here is the retail sales index (as opposed to monthly changes).
 Source: Pantheon Macroeconomics
——————–
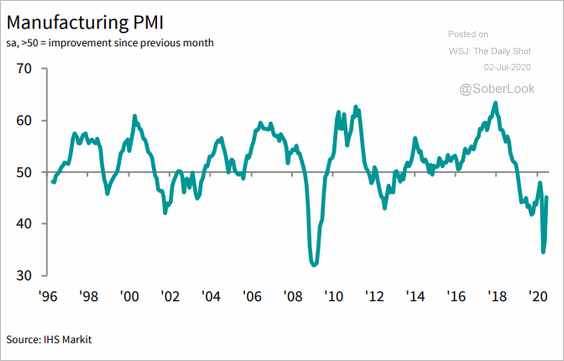
2. Next, we have the euro-area manufacturing PMI trends (note that PMI > 50 means expansion).
• Germany (updated from the flash report earlier this month):
 Source: @IHSMarkitPMI Read full article
• France (updated):
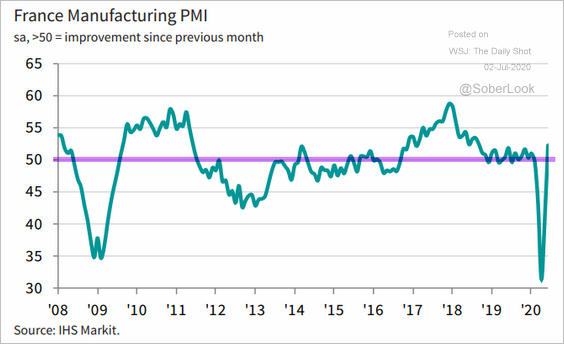 Source: @IHSMarkitPMI Read full article
• Spain:
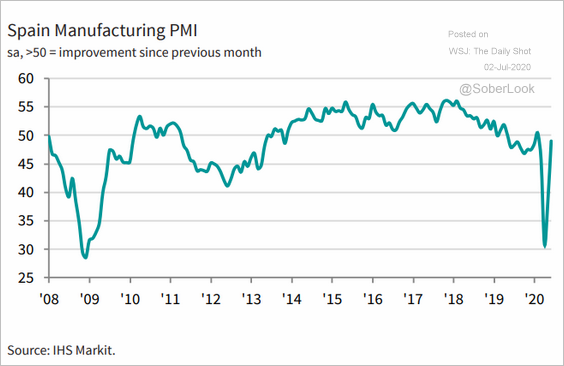 Source: @IHSMarkitPMI Read full article
• Italy:
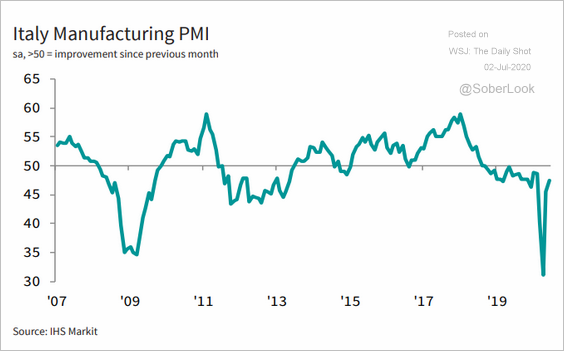 Source: @IHSMarkitPMI Read full article
——————–
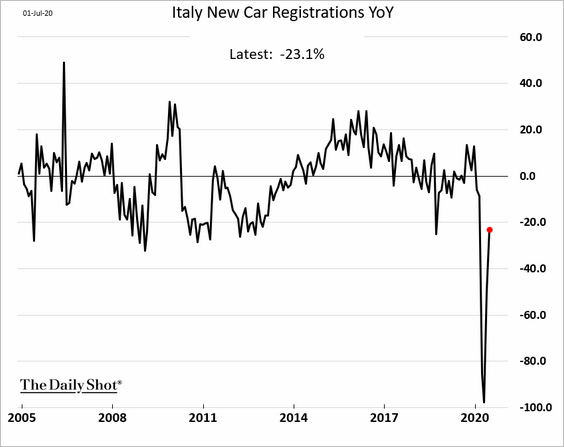
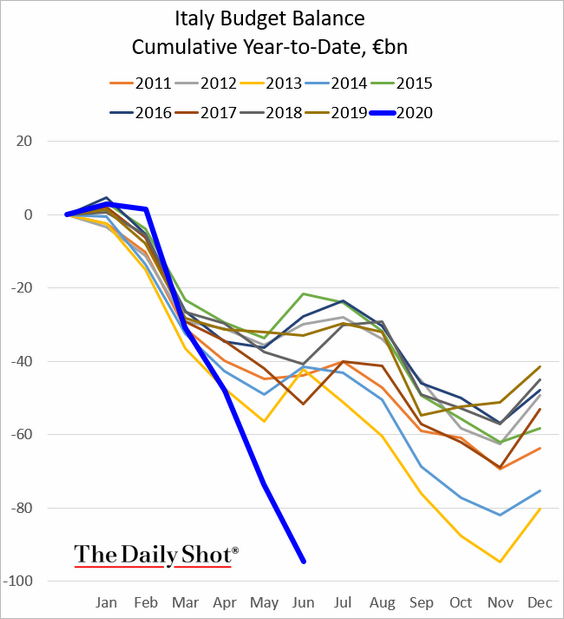
3. Below are some additional updates on Italy.
• Car registrations (year-over-year):
• Government budget:
• Who owns Italian bonds?
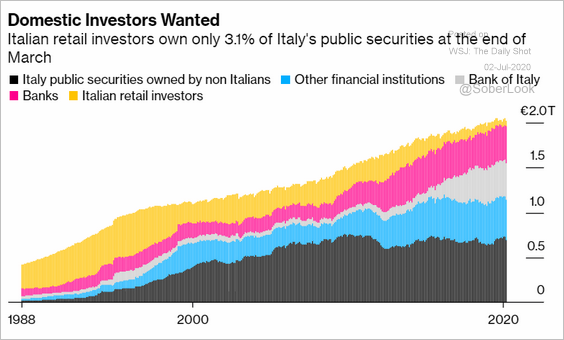 Source: @bpolitics Read full article
——————–
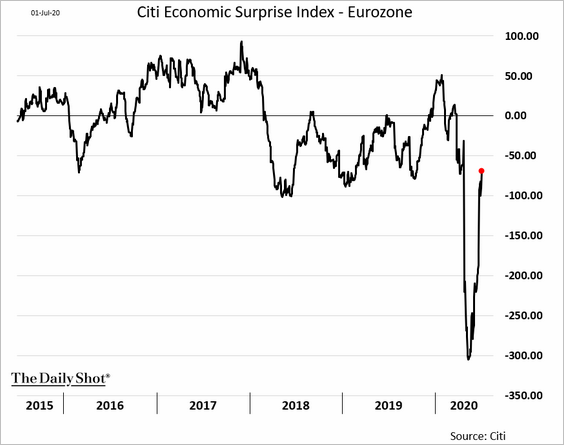
4. The Citi Economic Surprise Index continues to recover.
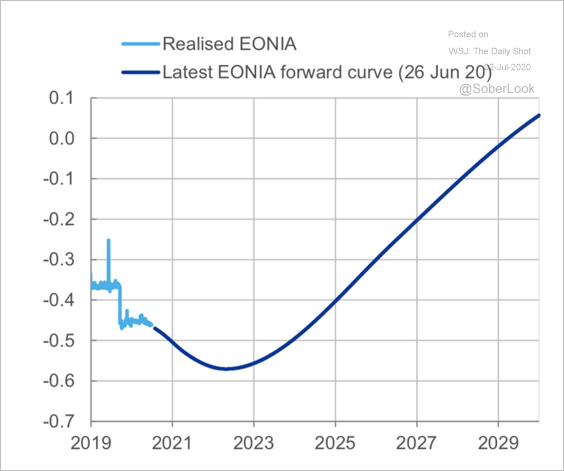
5. The market is pricing further ECB rate cuts (deeper into negative territory).
 Source: ECB Read full article
Europe
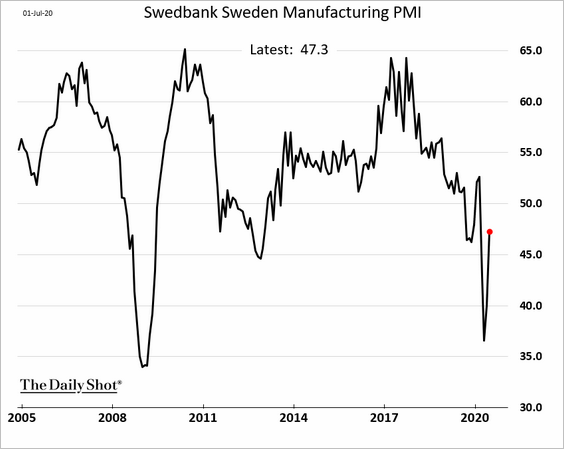
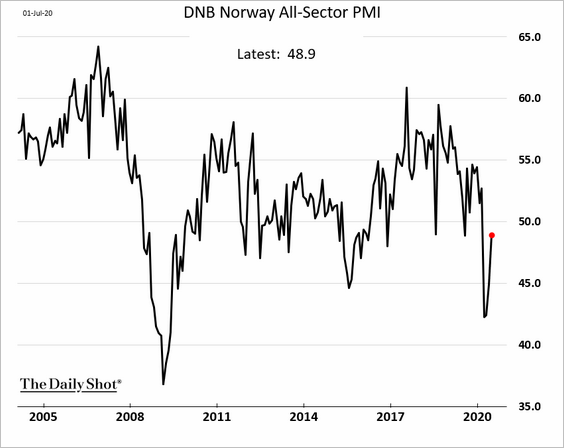
1. Let’s run through some PMI reports.
• Sweden (manufacturing):
• Norway (all-sectors):
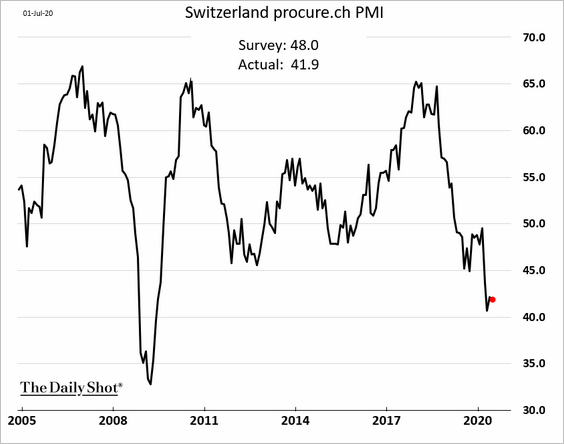
• No signs of recovery in Swiss manufacturing activity:
• Central Europe:
– Poland:
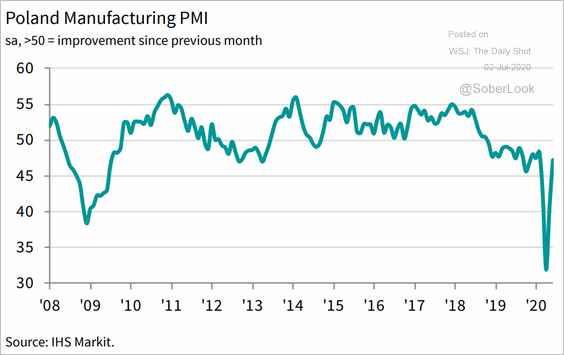 Source: IHS Markit Read full article
– The Czech Republic:
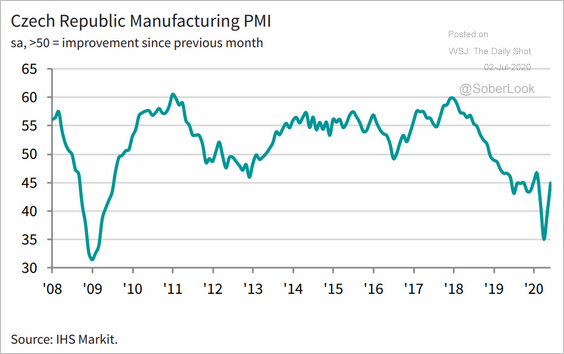 Source: IHS Markit Read full article
——————–
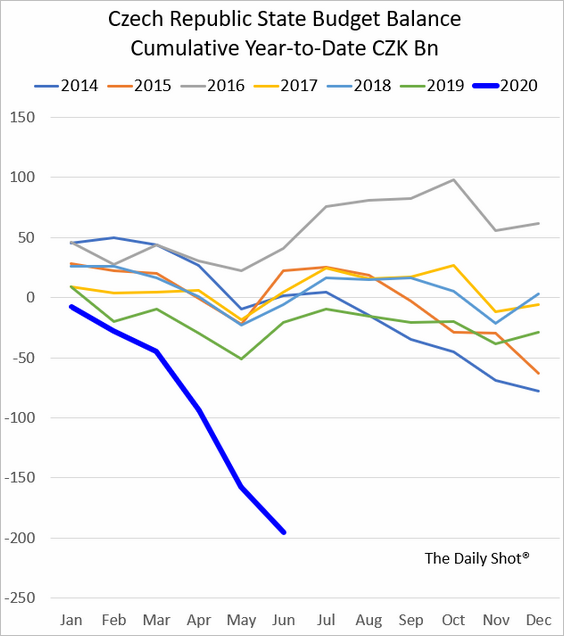
2. Here is the Czech Republic’s government budget.
Japan
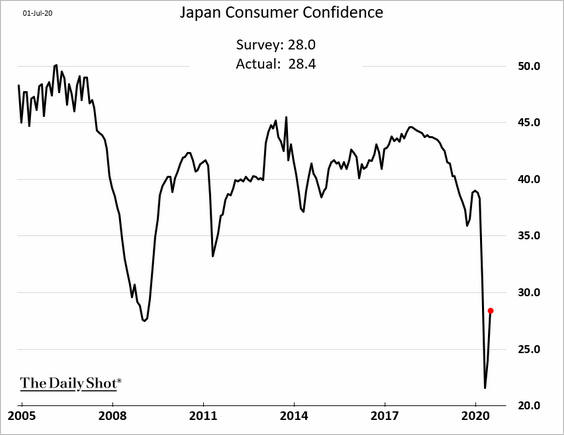
1. Consumer confidence improved in June but remains weak.
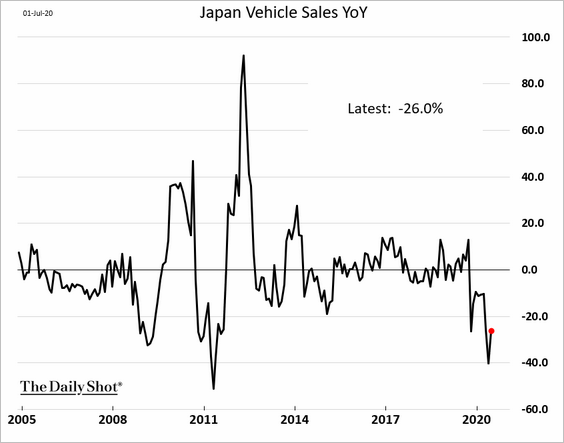
2. June vehicle sales were still 26% below last year’s levels.
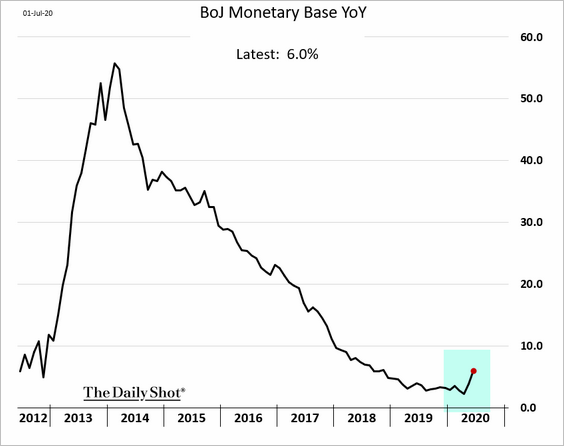
3. The growth in Japan’s monetary base is accelerating again as the BoJ boosts stimulus.
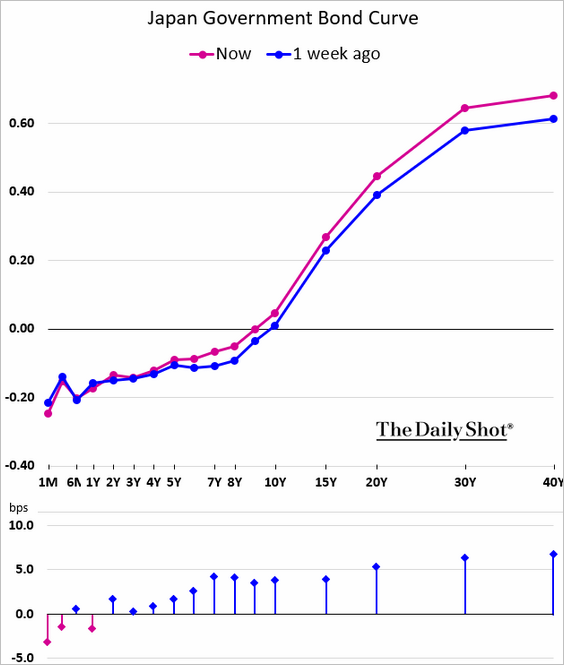
4. The market is starting to take notice of increased JGB issuance (see story). The yield curve is steepening.
Here is the spread between the 30yr and the 5yr JGB yields.
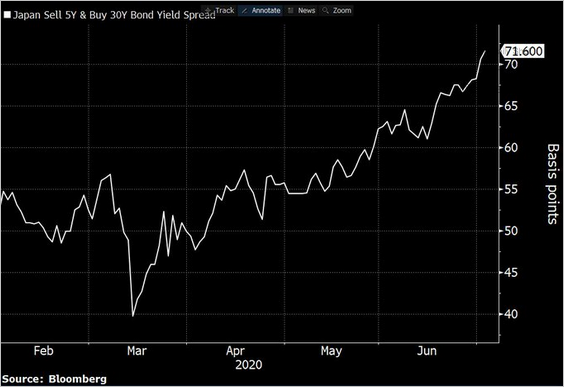 Source: @StephenSpratt
China
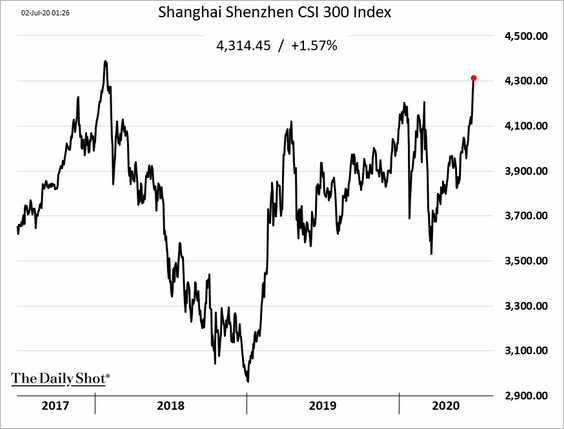
1. The stock market is on fire.
2. The PBoC is conducting some targeted easing.
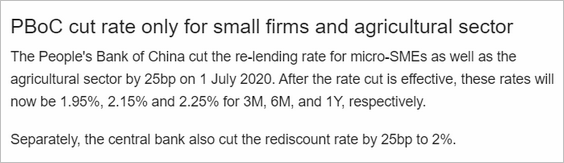 Source: ING Read full article
3. Coal consumption is now up on a year-over-year basis.
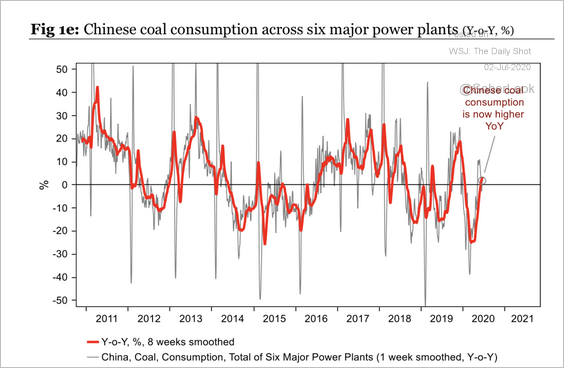 Source: Longview Economics
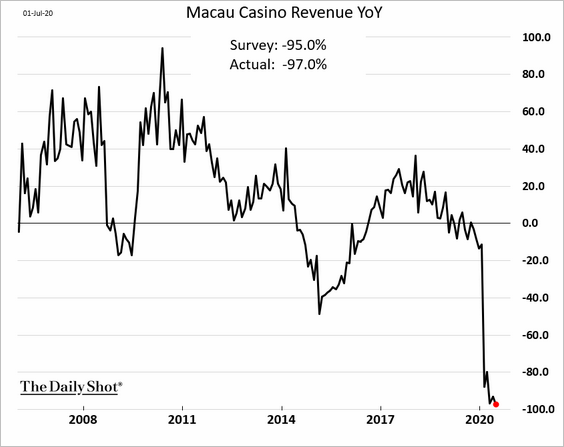
4. Macau’s casinos are not generating any revenues.
Emerging Markets
1. Let’s run through some PMI trends.
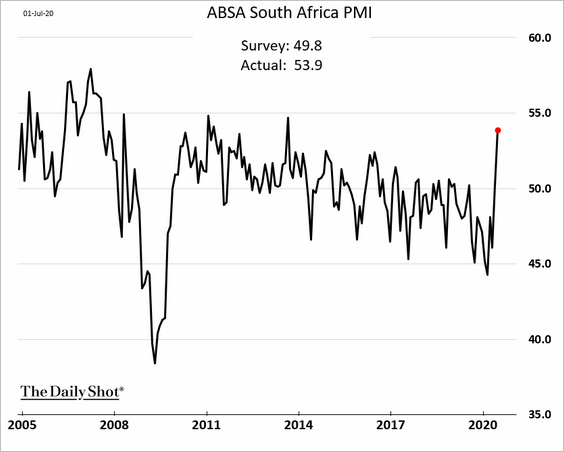
• South Africa (all-sector PMI) – an upside surprise:
• Turkey:
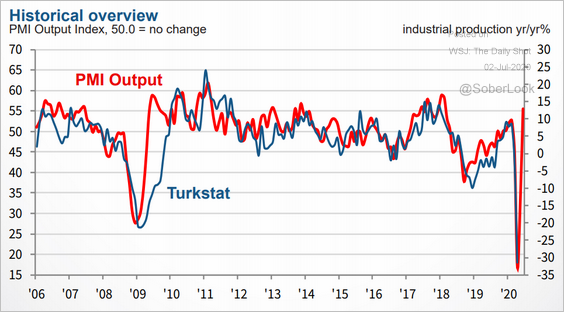 Source: IHS Markit Read full article
• India:
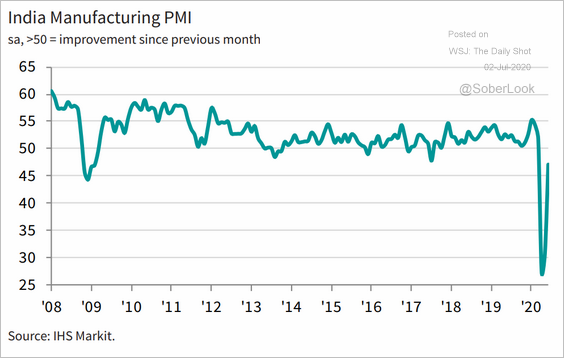 Source: IHS Markit Read full article
• Bazil- now in growth mode:
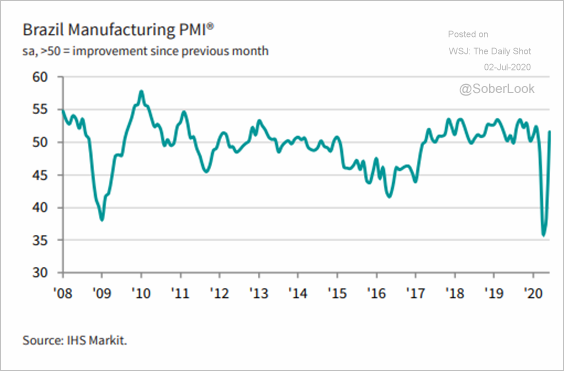 Source: @IHSMarkitPMI Read full article
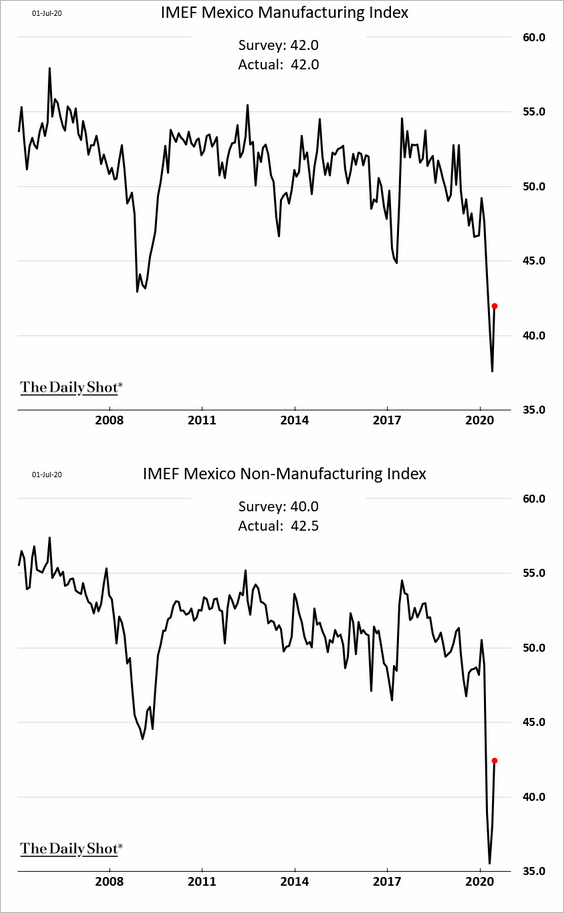
• Mexico (a long way from stabilizing):
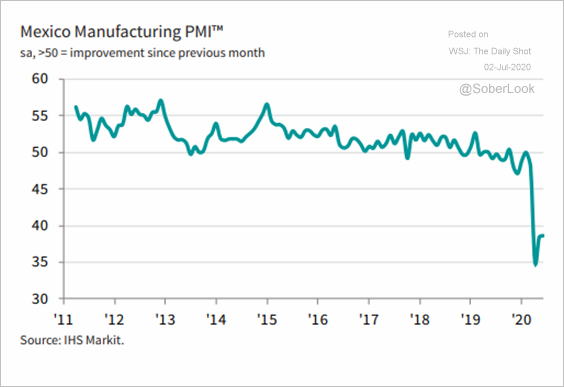 Source: @IHSMarkitPMI Read full article
——————–
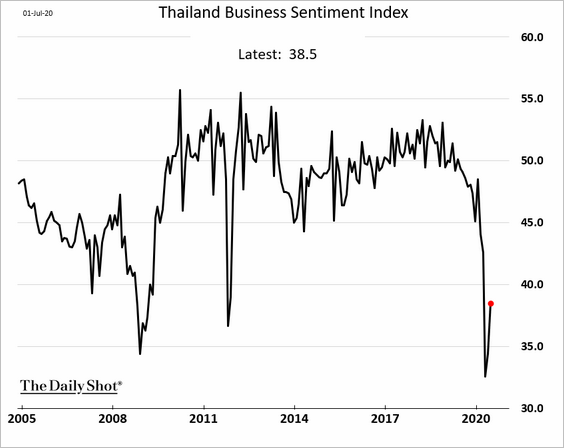
2. Thai business sentiment showed some improvement in June.
3. Dollar-denominated EM bonds have fully recovered from the crisis selloff.
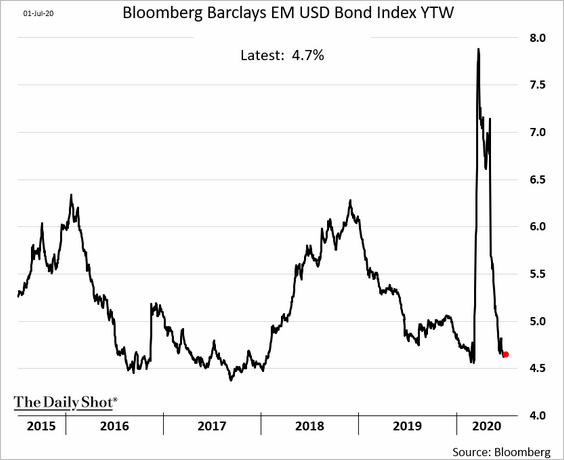 Source: Cormac Mullen
4. IIF estimates that EM securities attracted roughly $32.1 billion in June, substantially higher than the $3.5 billion in May.
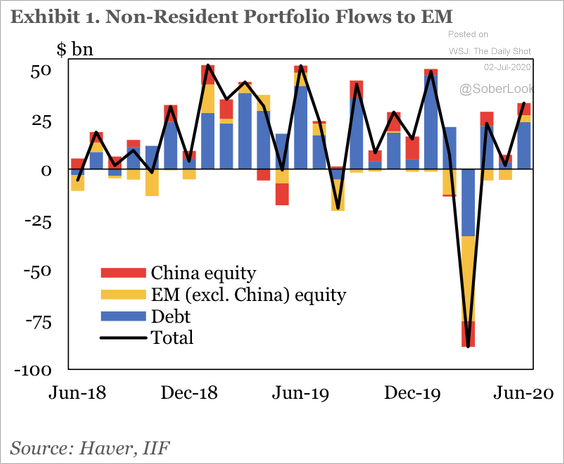 Source: IIF
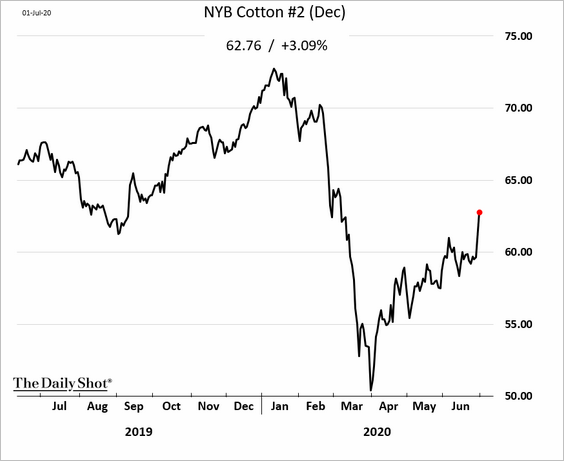
Commodities
Softs showed some strength this week.
• Cotton:
 Source: Cotton Grower Read full article
• Arabica coffee (boosted by lower inventories):
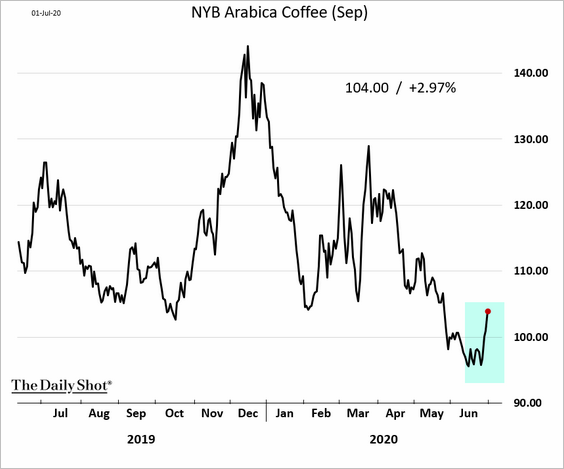
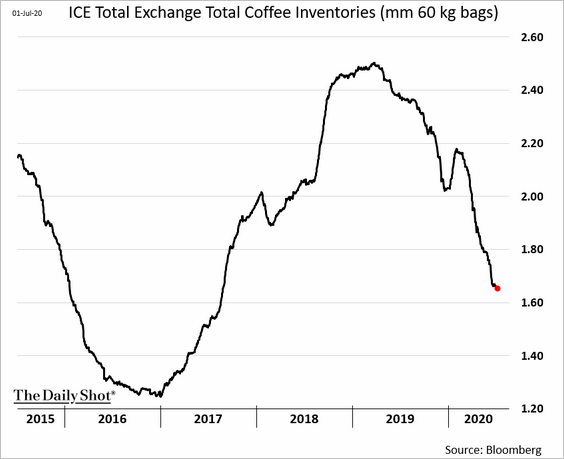 Source:
Energy
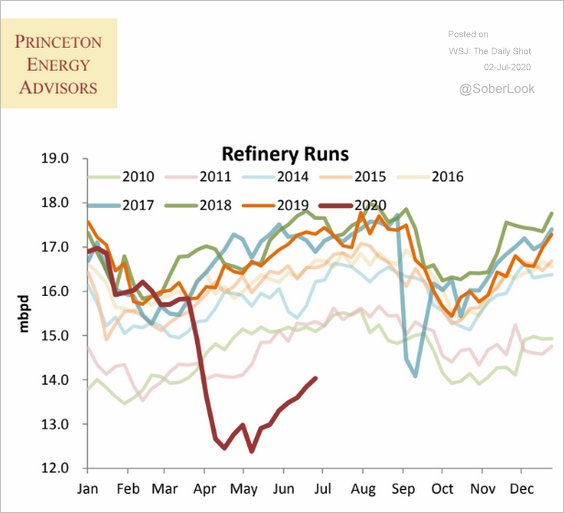
1. US refined product demand continues to improve.
• Distillates (diesel, etc.) demand is back to normal:
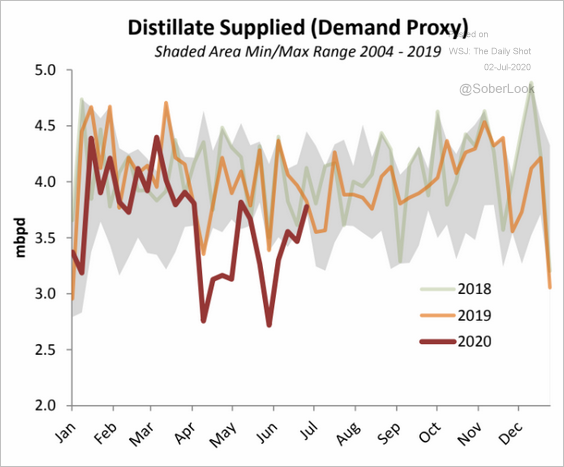 Source: Princeton Energy Advisors
• Gasoline implied demand:
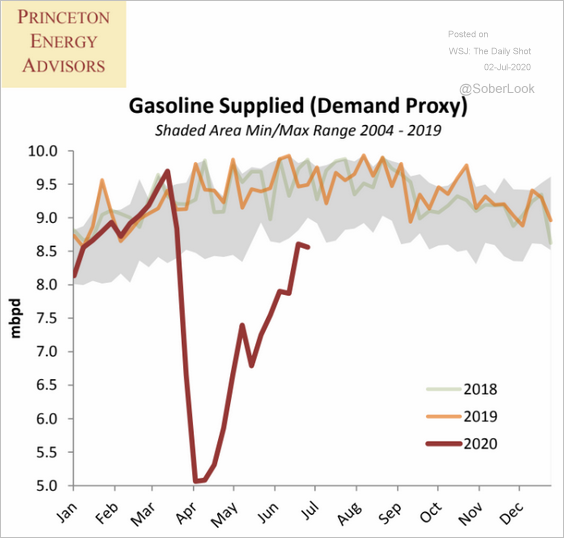 Source: Princeton Energy Advisors
• Refinery inputs:
 Source: Princeton Energy Advisors
——————–
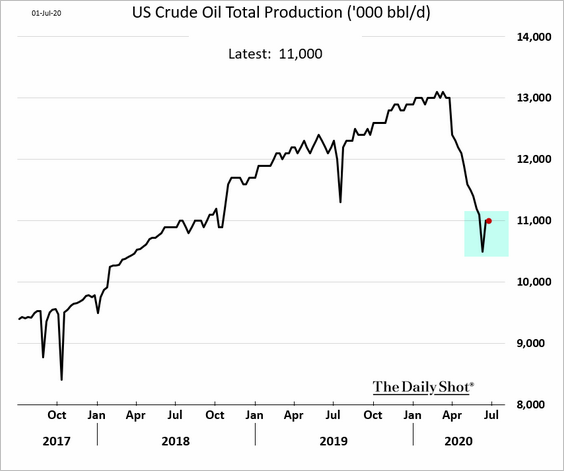
2. US crude oil production is no longer declining.
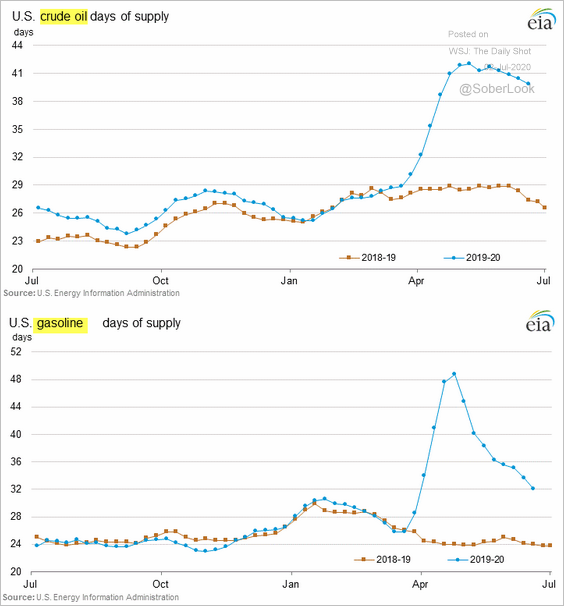
3. US crude oil inventories exceeded 540 million barrels for the first time.
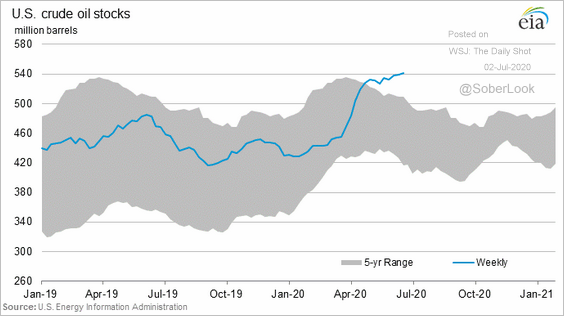
But we see improvement when inventories are measured in days of supply.
Equities
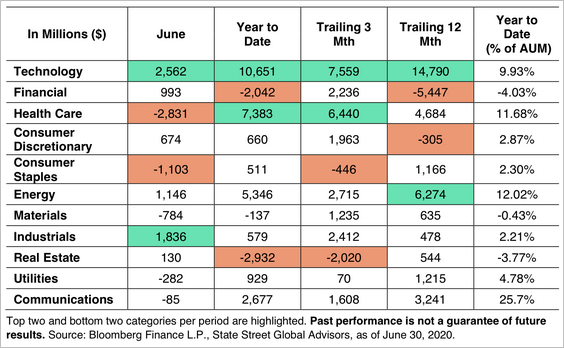
1. Healthcare and consumer staples saw outflows last month, while industrials saw inflows.
 Source: SPDR Americas Research, @mattbartolini
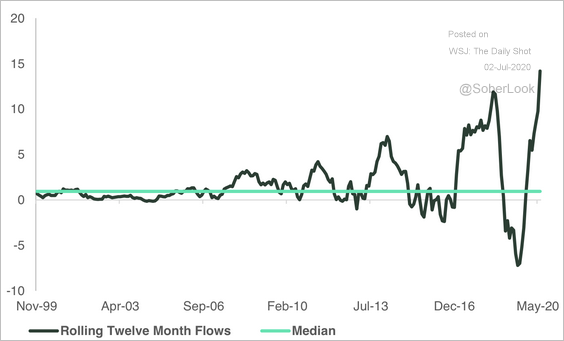
This chart shows the rolling 12-month flow totals (billions) for the tech sector.
 Source: SPDR Americas Research, @mattbartolini
——————–
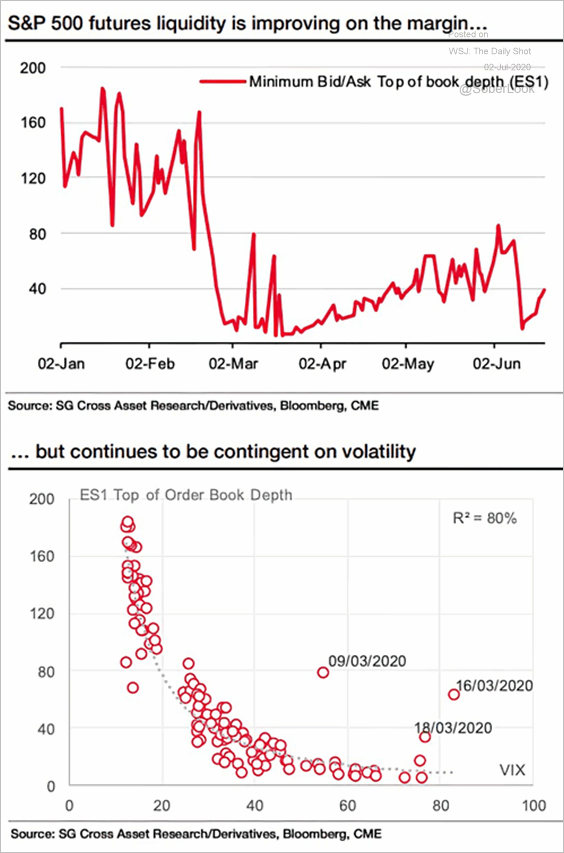
2. S&P futures liquidity is improving, but it remains linked to volatility.
 Source: @ISABELNET_SA, @SG_CIB
3. Since the March rally began, the S&P 500 has seen two pull-backs of more than 5%, which is typical of recent bull markets, according to SunTrust.
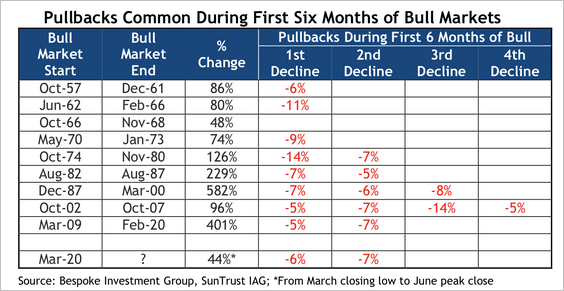 Source: SunTrust Private Wealth Management
4. VIX remains elevated.
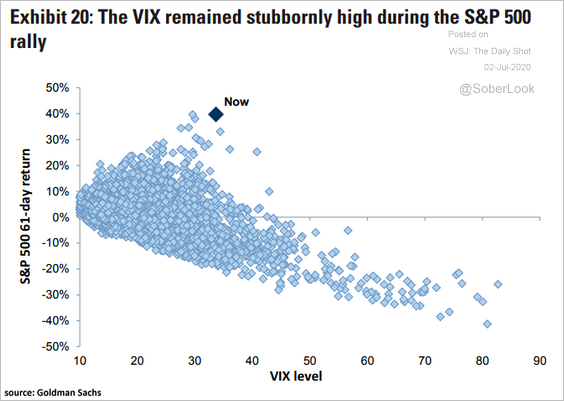 Source: @ISABELNET_SA, @GoldmanSachs
5. Trends in institutional vs. retail investor positioning have diverged.
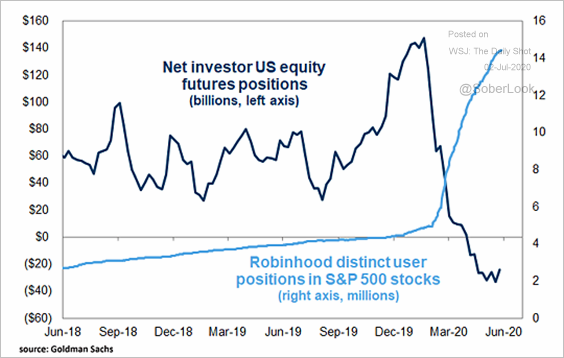 Source: @ISABELNET_SA, @GoldmanSachs
6. Here is how the composition of the S&P 500 changed over the past century.
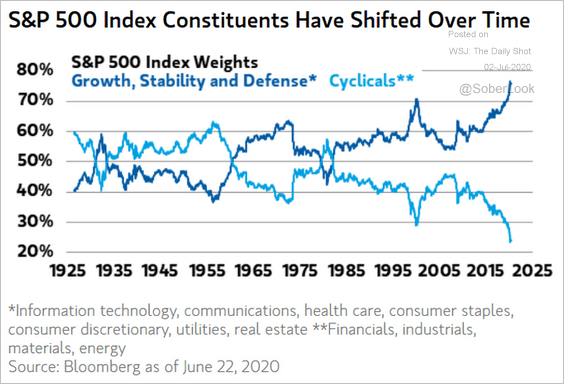 Source: @ISABELNET_SA, @MorganStanley
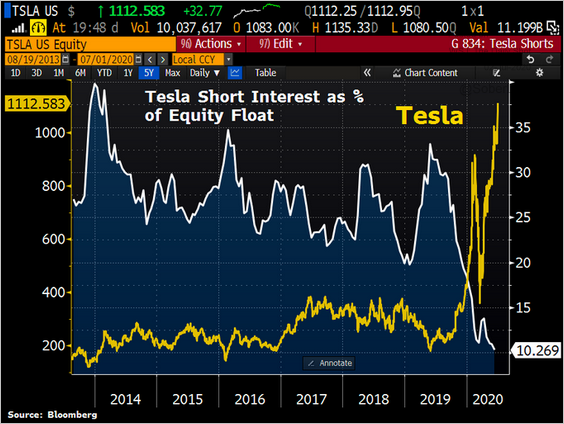
7. Tesla short-sellers have capitulated.
 Source: @Schuldensuehner
Credit
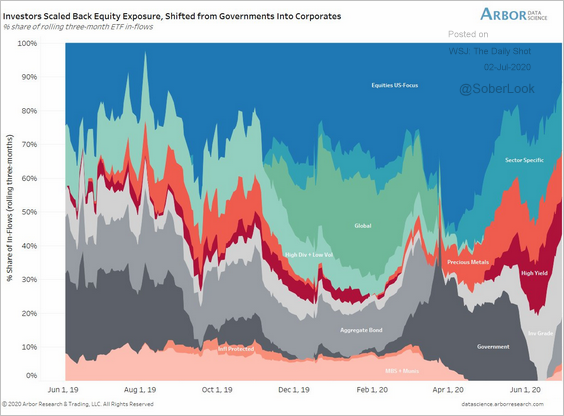
1. Investment-grade bonds have sharply outperformed high-yield this year.
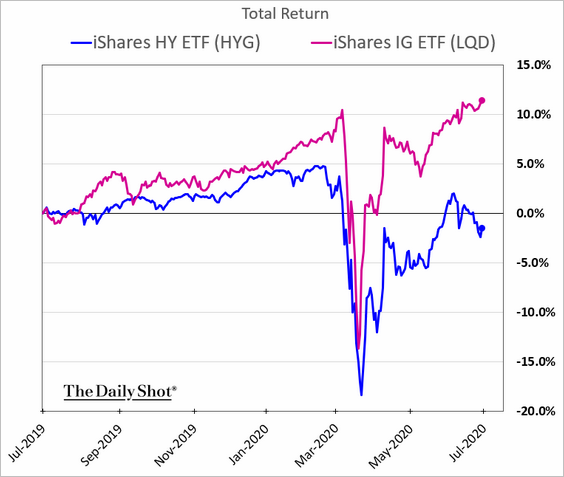
And we can see this divergence in ETF flows (red = HY).
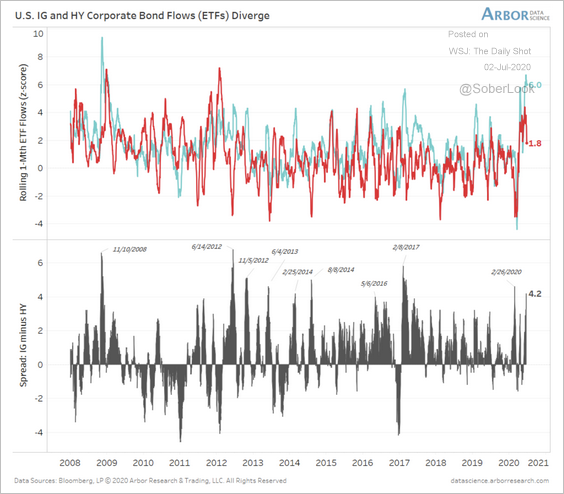 Source: Arbor Research & Trading
——————–
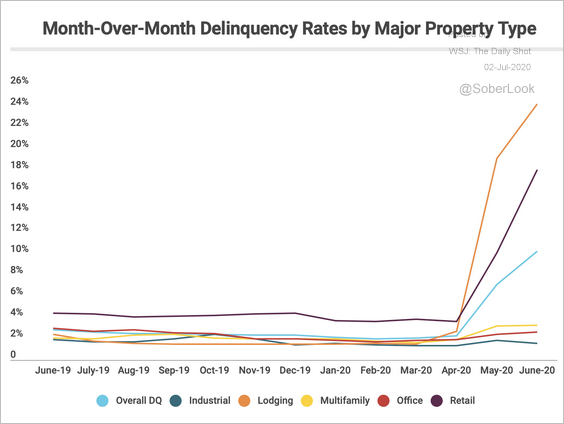
2. Lodging and retail sectors continue to post the highest delinquency rates.
 Source: Trepp
3. US bankruptcies gave accelerated.
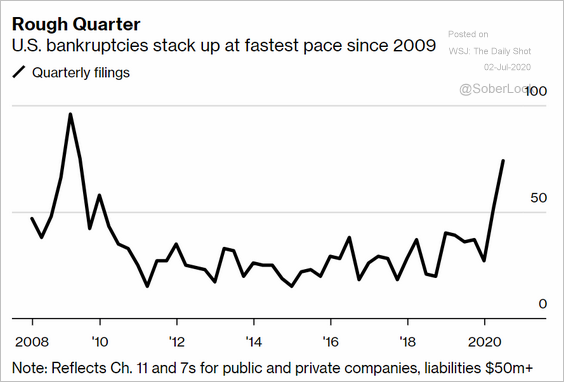 Source: @markets Read full article
4. Next, we have corporate bond defaults globally.
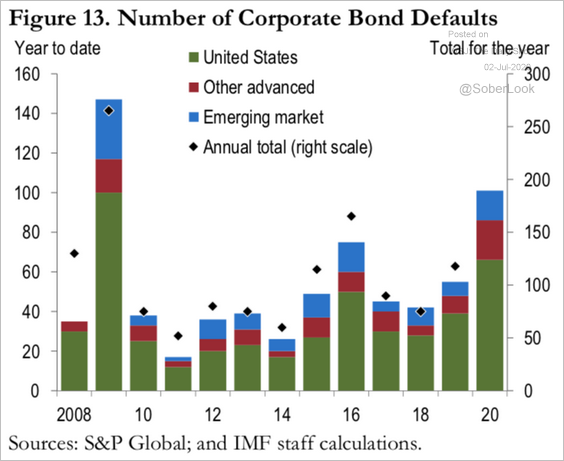 Source: IMF Read full article
Global Developments
1. This chart shows ETF inflows by asset class.
 Source: @benbreitholtz
June’s flow performance could be the start of a new trend as investors warm up to non-US equities. (chart below measured in billions).
 Source: SPDR Americas Research, @mattbartolini
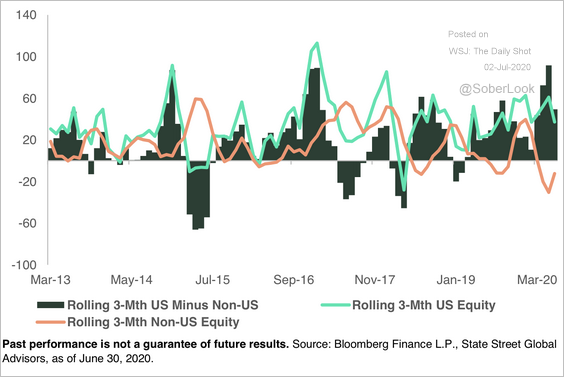
Indeed, US equity performance has stalled vs. the rest of the world in recent weeks.
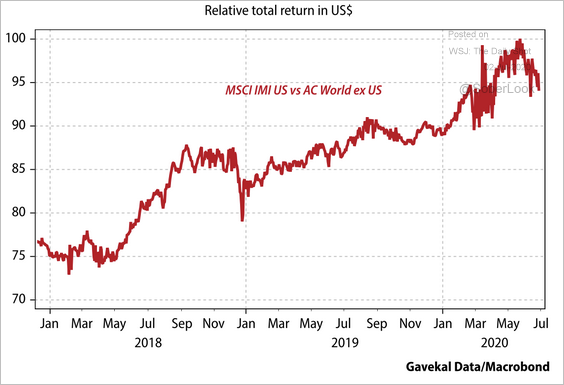 Source: Gavekal
——————–
2. Yield has been hard to come by.
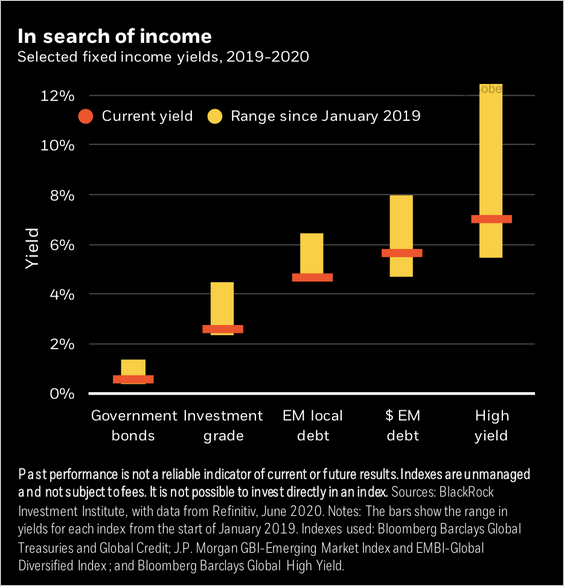 Source: BlackRock
3. The global stock/bond ratio is recovering from recent lows.
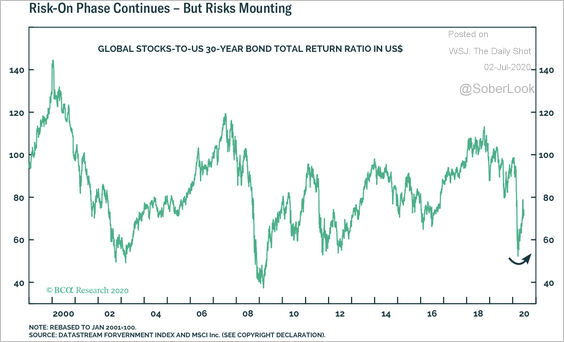 Source: BCA Research
——————–
Food for Thought
1. Top 10 advertisers on Facebook:
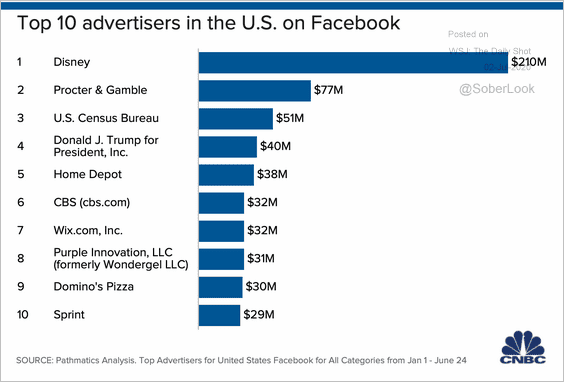 Source: CNBC Read full article
2. Automakers’ market capitalization:
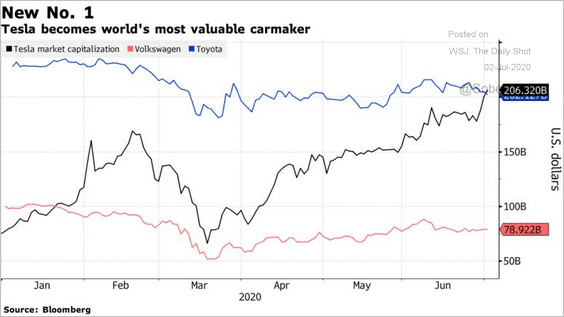 Source: @technology Read full article
3. Less product variety for US consumers:
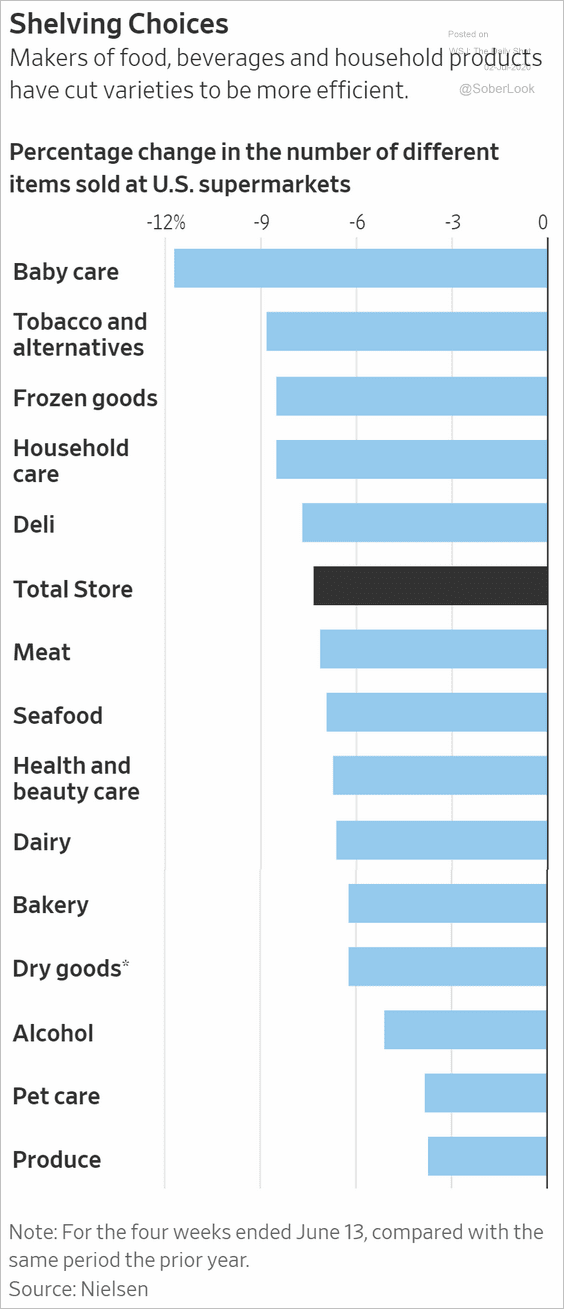 Source: @WSJ Read full article
4. Government payments as a percentage of personal income:
![]() Source: @EPBResearch
Source: @EPBResearch
5. Unpaid jobless benefits:
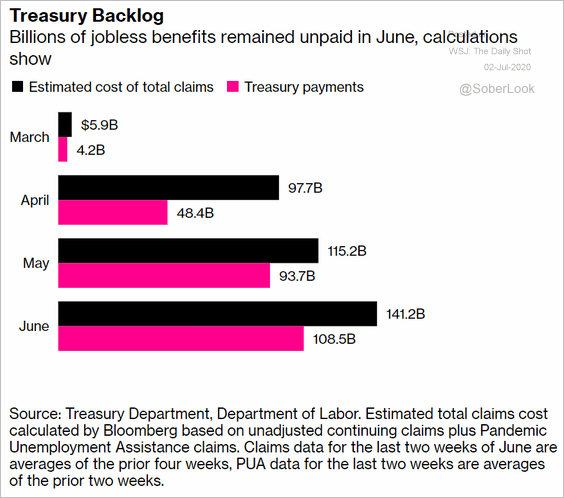 Source: @bpolitics Read full article
6. World leaders’ Twitter followers:
 Source: Statista
7. Books about Donald Trump:
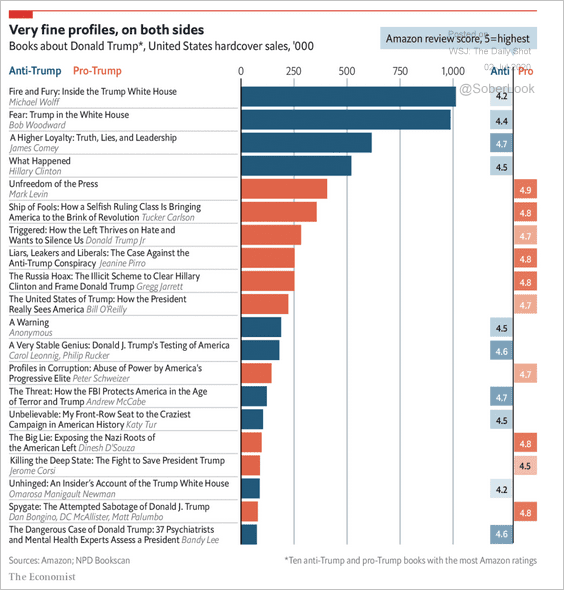 Source: The Economist Read full article
8. Spanish flu vs. COVID-19 death rates:
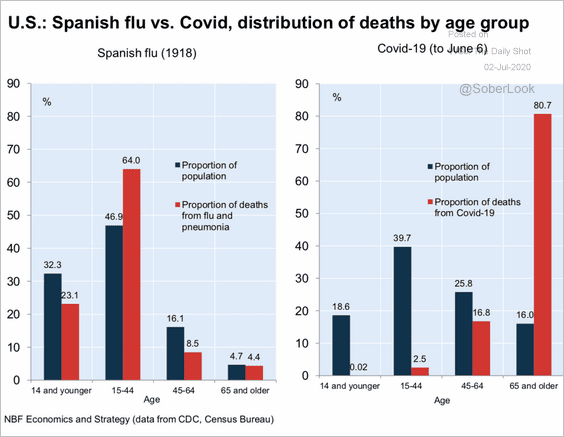 Source: Economics and Strategy Group, National Bank of Canada
9. Most searched plastic surgery procedures:
 Source: Westlake Dermatology Read full article
——————–
For our readers in the United States, happy July 4th!