
The Daily Shot: 07-Aug-20
• The United States
• The United Kingdom
• The Eurozone
• Asia-Pacific
• China
• Emerging Markets
• Cryptocurrency
• Commodities
• Energy
• Equities
• Credit
• Rates
• Food for Thought
The United States
1. Let’s begin with the labor market.
• Unemployment applications declined last week to the lowest level since March.
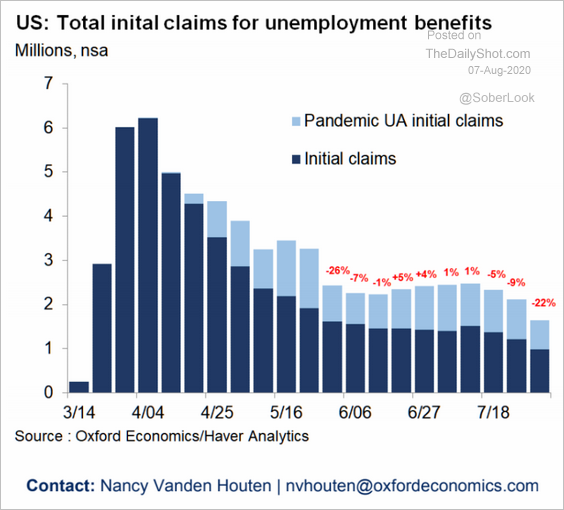 Source: Oxford Economics
• The total number of Americans receiving unemployment benefits remains near record highs (above 30 million).
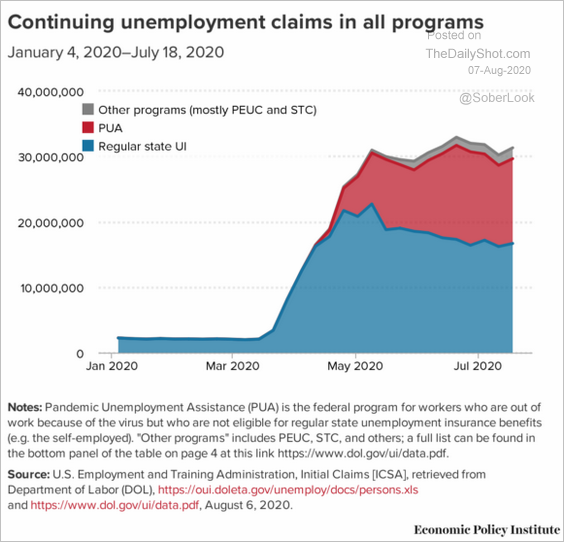 Source: Economic Policy Institute
• This year’s layoffs have been unprecedented in recent decades.
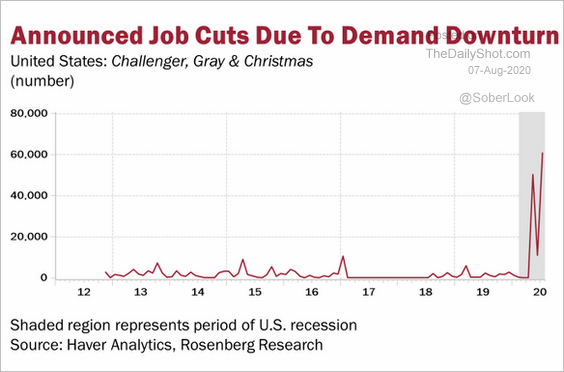 Source: @EconguyRosie
• Morgan Stanley expects today’s payrolls report to show a gain of two million in July.
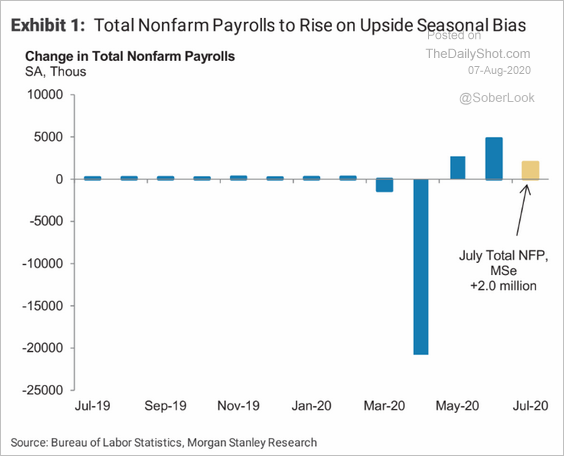 Source: Morgan Stanley Research
The firm sees the unemployment rate dropping to 10.2%.
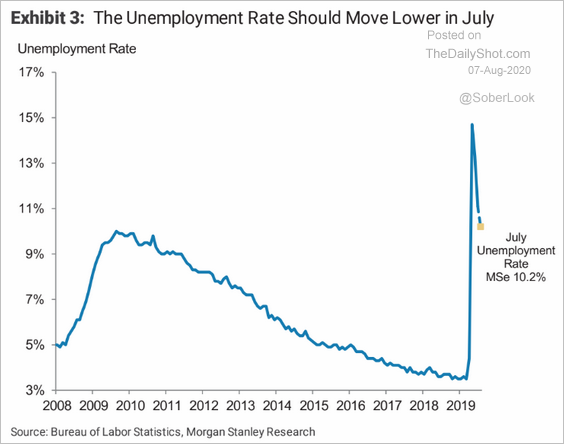 Source: Morgan Stanley Research
——————–
2. The trajectory of US unemployment will determine the number of evictions (which are expected to peak in October).
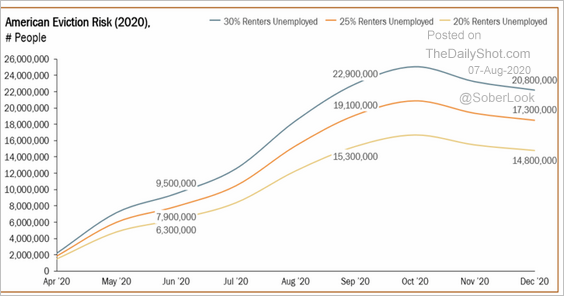 Source: The Aspen Institute
3. Next, we have a couple of high-frequency indicators.
• Small business revenue:
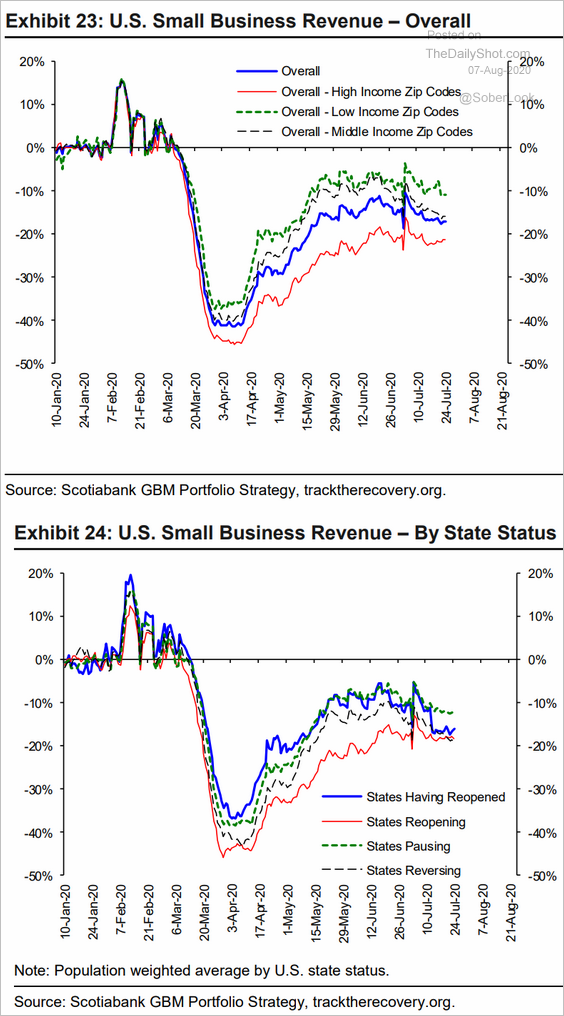 Source: Hugo Ste-Marie, Portfolio & Quantitative Strategy Global Equity Research, Scotia Capital
• Mobility index:
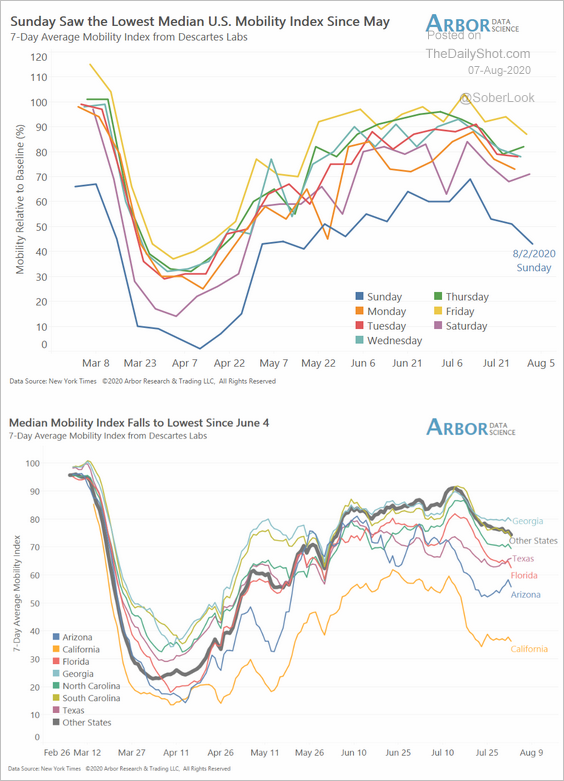 Source: Arbor Research & Trading
——————–
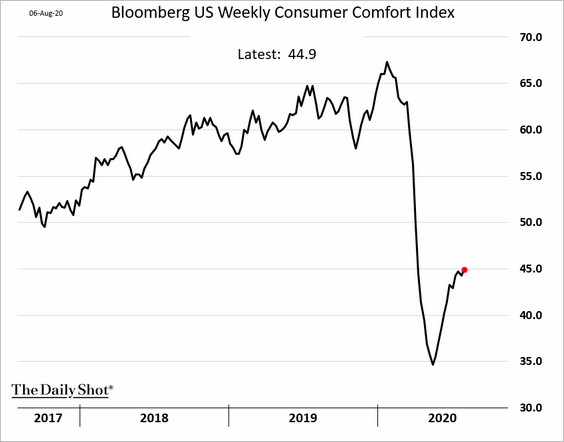
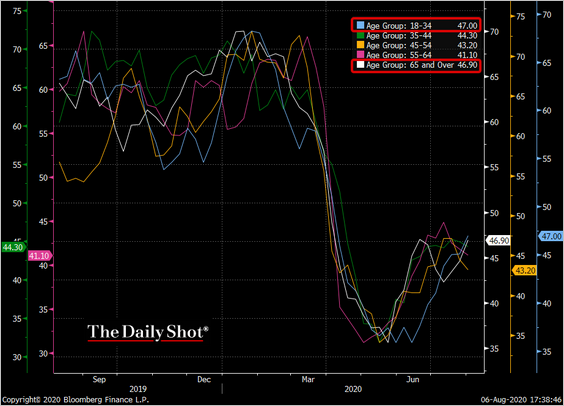
4. Bloomberg’s consumer sentiment ticked higher.
The gains were driven by the youngest and the oldest cohorts (18-34 and 65+). Sentiment among all the groups in the middle declined.
 Source: @TheTerminal
——————–
5. Finally, here are some updates on consumer credit.
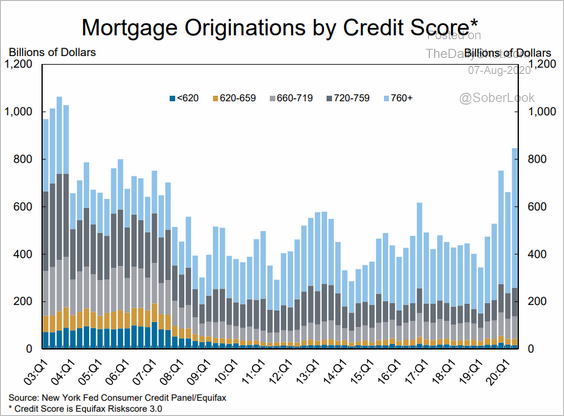
• Most of the increase in mortgage originations this year was driven by borrowers with the highest credit scores.
 Source: NY Fed
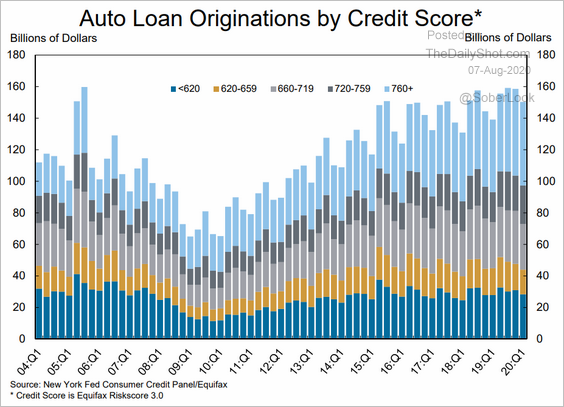
As a comparison, here is the distribution of credit scores for new auto loans.
 Source: NY Fed
By the way, the sharp gains in the median price of homes sold this year reflect not only home price appreciation but also improved sales of higher-end homes (better credit scores).
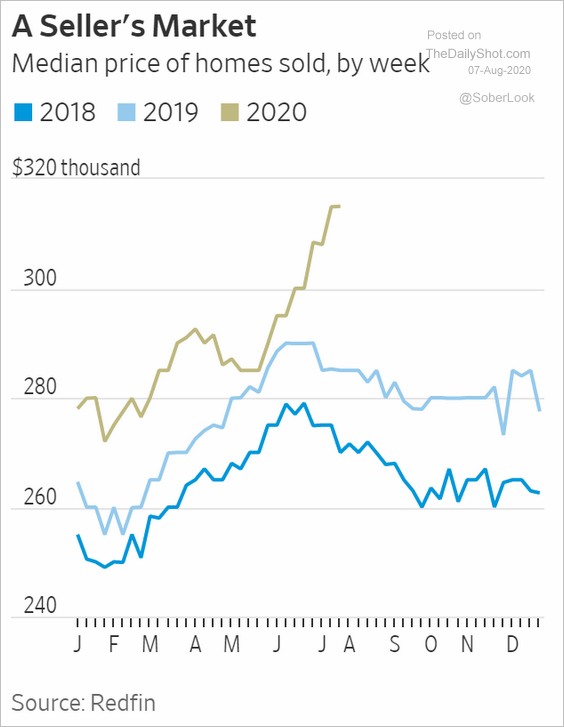 Source: @WSJ Read full article
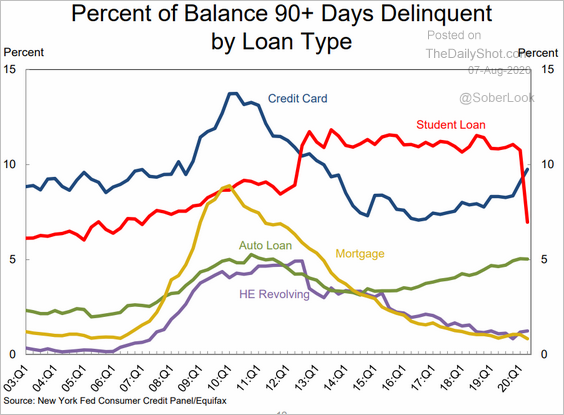
• Mortgage delinquencies tumbled as loans shifted forbearance.
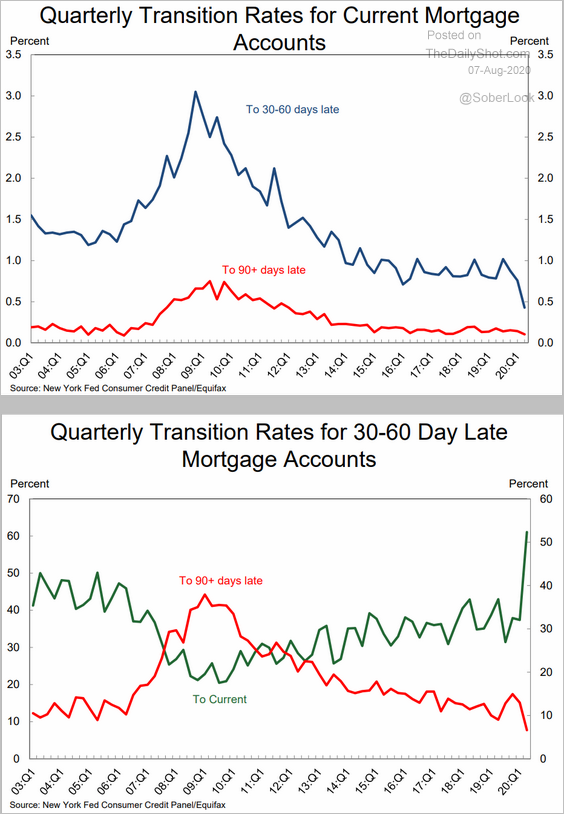 Source: NY Fed
Foreclosures dropped off as the CARES Act went into effect.
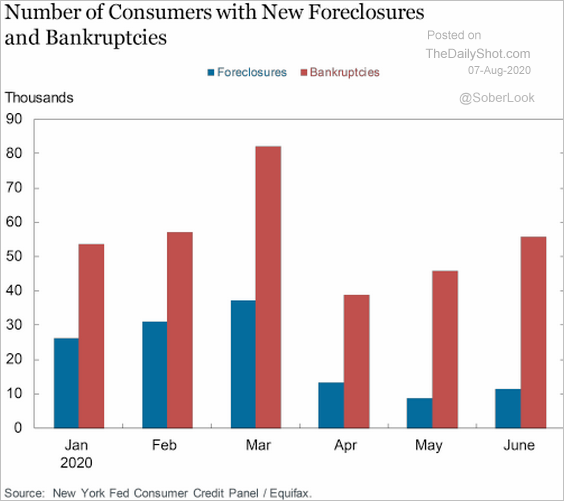 Source: @jeannasmialek, Liberty Street Economics Read full article
• Credit card balances declined again.
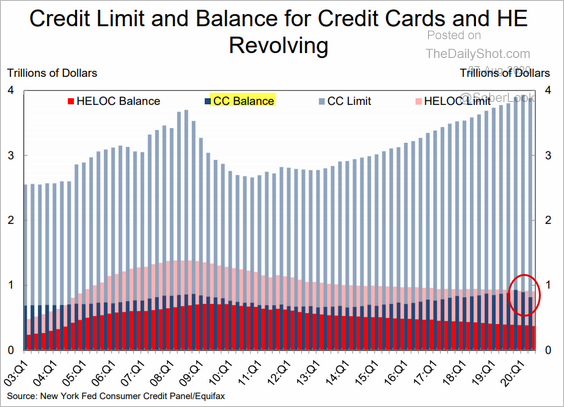 Source: NY Fed
This chart shows the contributions to changes in consumer debt by loan type.
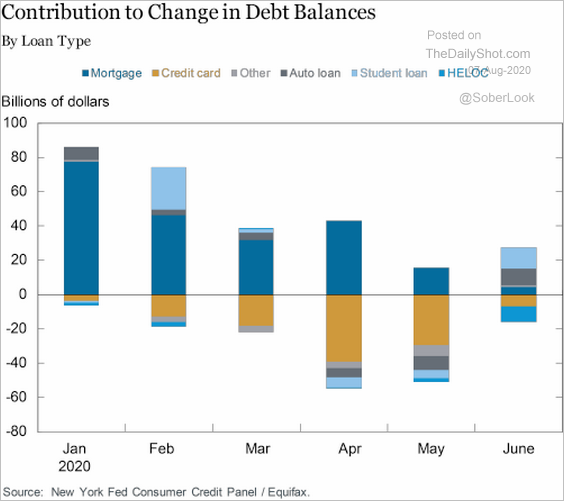 Source: @lisaabramowicz1, Liberty Street Economics Read full article
• Student loan delinquencies plummeted due to the CARES Act emergency relief (see overview).
 Source: NY Fed
With student loan relief for almost 40 million borrowers now expiring, will the federal government step in again?
 Source: Politico Read full article
The United Kingdom
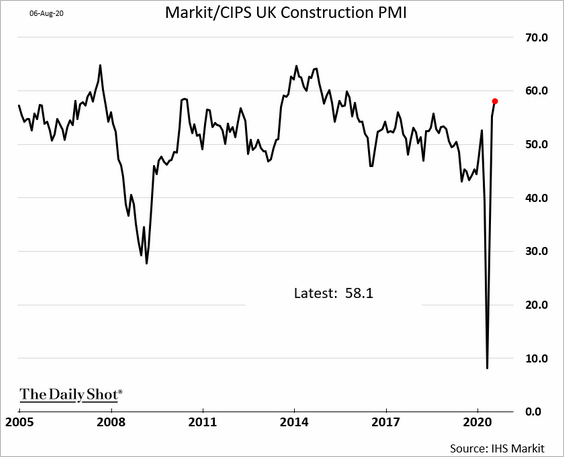
1. Construction activity accelerated last month.
2. Here are the BoE’s latest economic forecasts.
• Inflation:
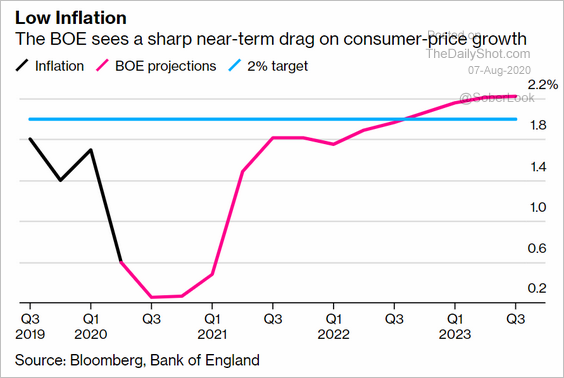 Source: @markets Read full article
• The GDP (compared to previous recessions):
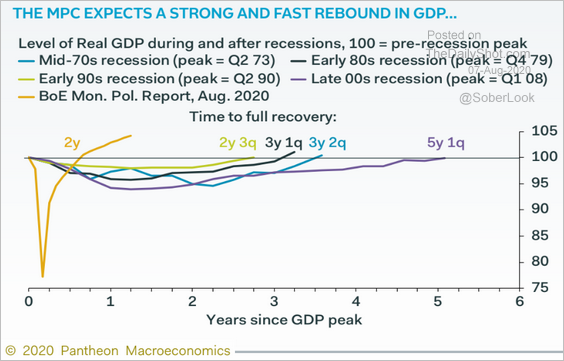 Source: Pantheon Macroeconomics
Is the central bank’s GDP outlook too optimistic? Below is a forecast from Pantheon Macroeconomics.
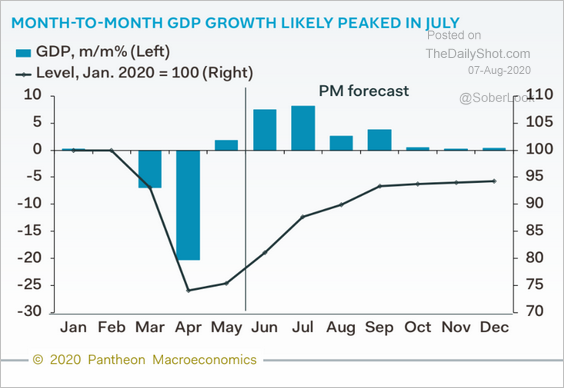 Source: Pantheon Macroeconomics
The Eurozone
1. Let’s begin with Germany.
• June factory orders rebounded more than expected, driven by domestic demand (2nd chart).
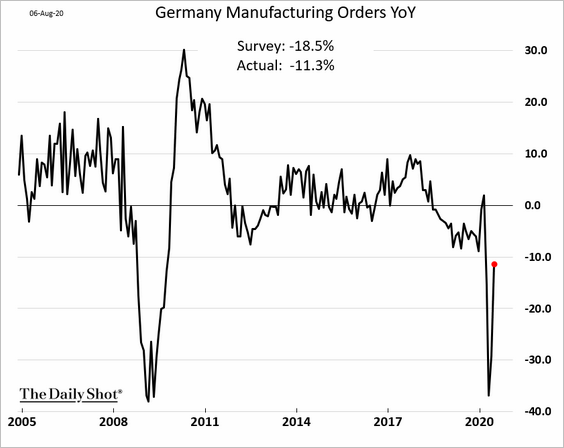
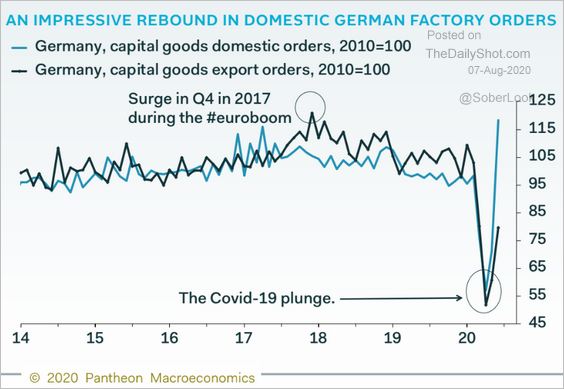 Source: Pantheon Macroeconomics
• Industrial production was roughly in line with forecasts.
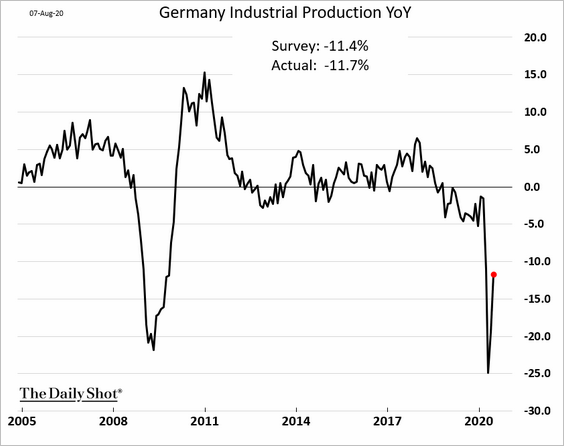
By the way, automobile production rebounded across Europe.
 Source: IHS Markit Read full article
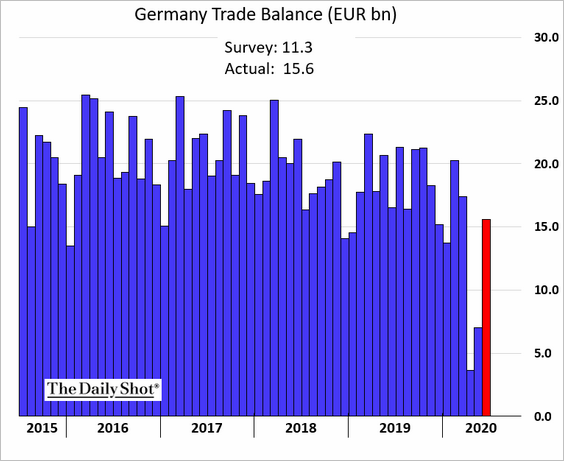
• Exports rose sharply, boosting Germany’s trade surplus.
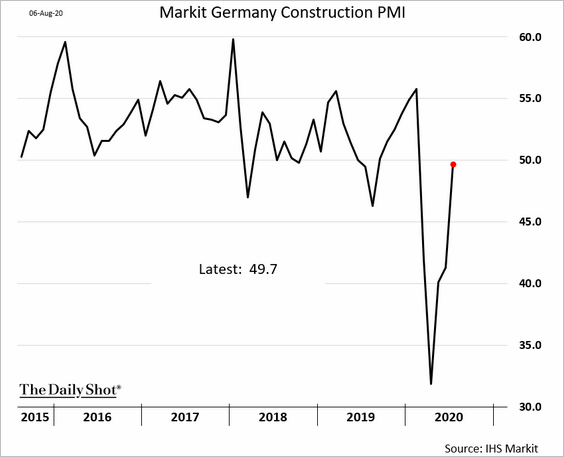
• Construction activity has stabilized.
• This chart shows German unemployment and the use of short-time work (Kurzarbeit).
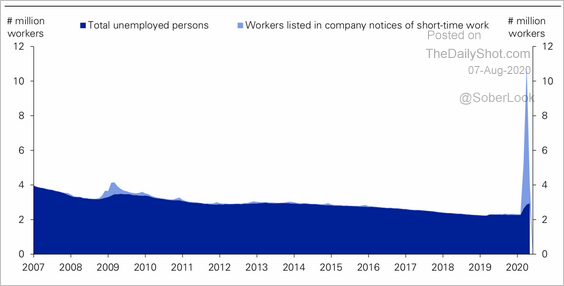 Source: Deutsche Bank Research
• Corporate margins have been declining.
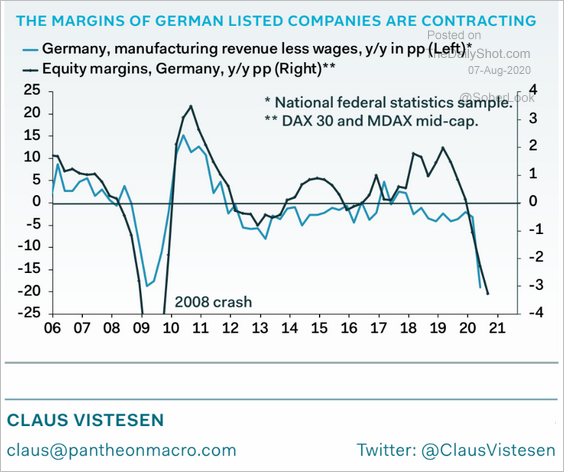 Source: Pantheon Macroeconomics
——————–
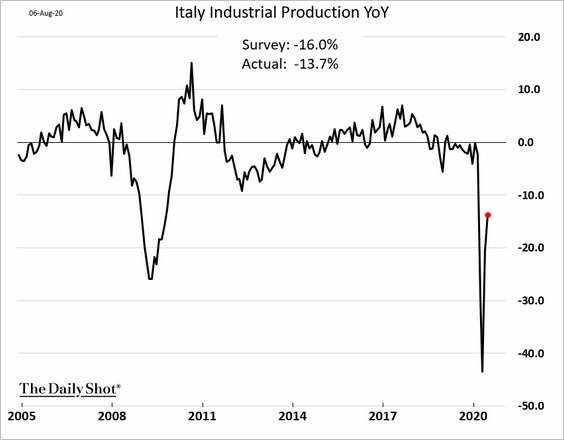
2. Next, we have some updates on Italy.
• Industrial production rebounded sharply in May and June.
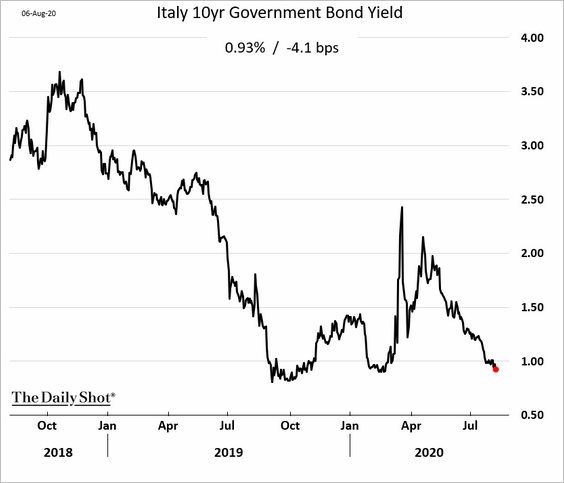
• The 10yr bond yield is below 1% again.
• According to Gavekal, Italy has entered “debt-trap” conditions.
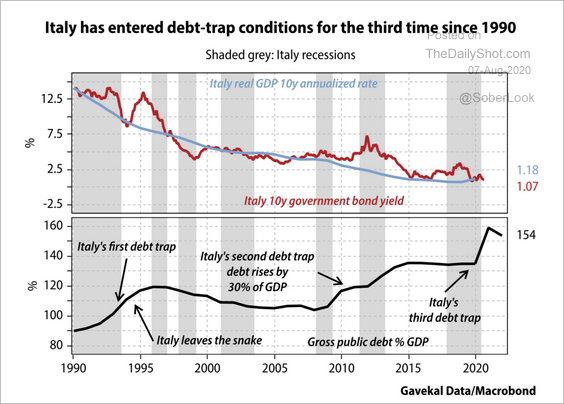 Source: Gavekal
• Italy has been less productive in recent years.
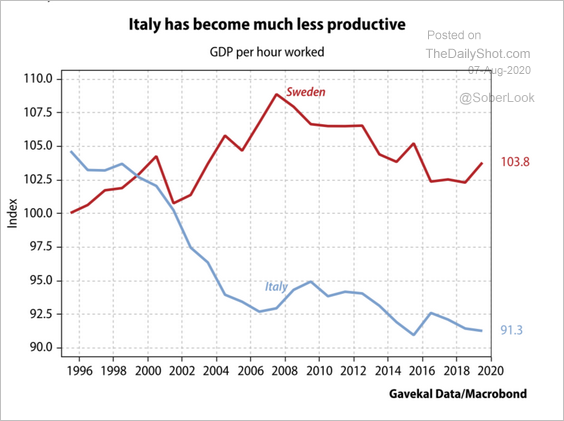 Source: Gavekal
——————–
3. After sharp declines during the lockdown, productivity is improving across the Eurozone.
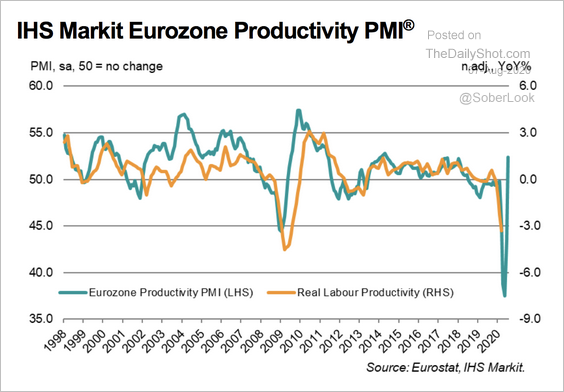 Source: IHS Markit Read full article
Asia-Pacific
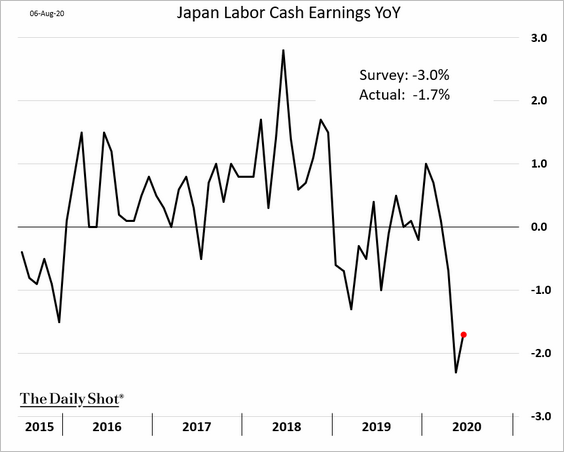
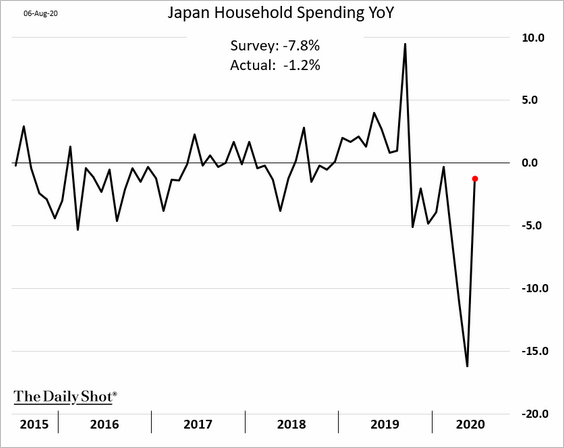
1. Japan’s wages have stabilized in June (a decline was expected).
The nation’s household spending rocketed back.
——————–
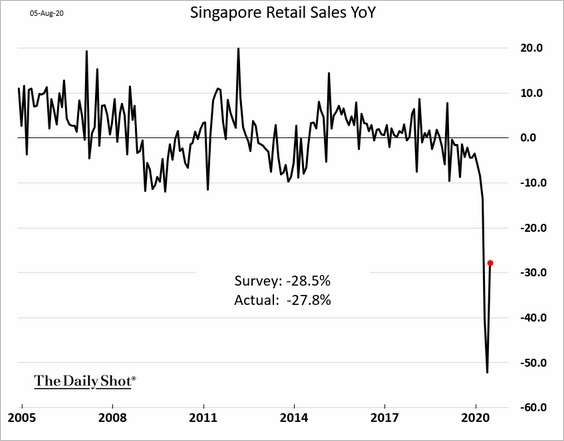
2. Singapore’s retail sales remain fragile.
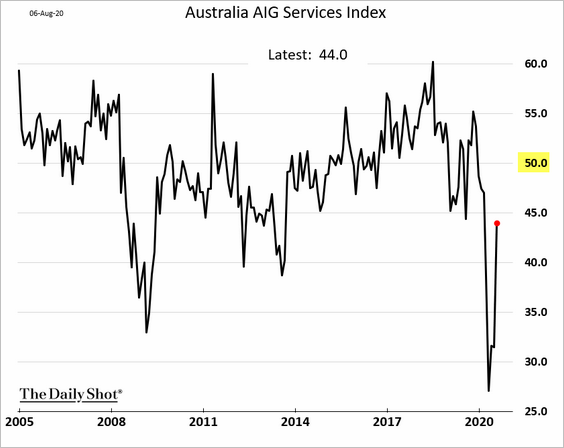
3. Australia’s service sector is yet to stabilize.
4. This chart shows Asia’s sector PMIs.
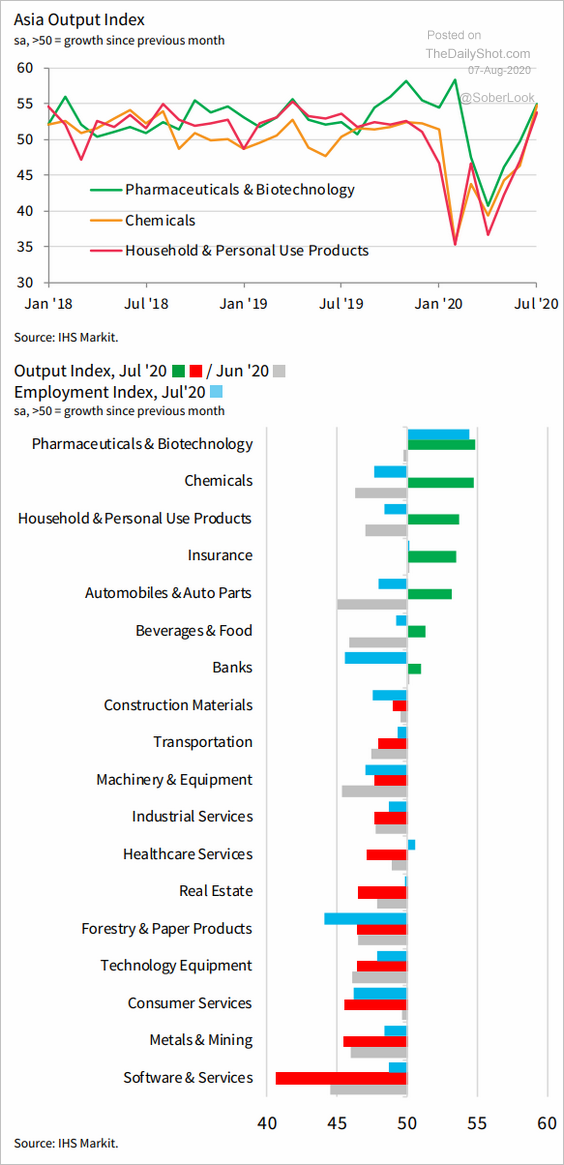 Source: IHS Markit Read full article
China
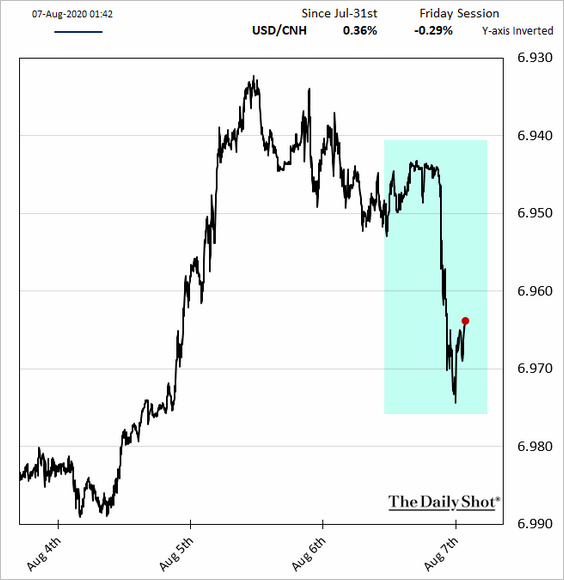
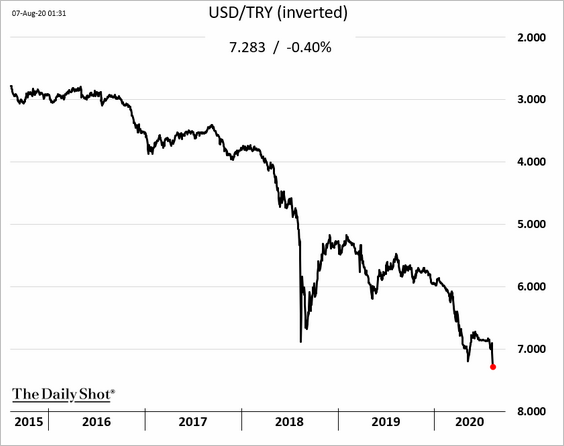
1. The US-China escalation of tensions is pressuring the renminbi.
 Source: The New York Times Read full article
——————–
2. Exports have been robust, boosting China’s trade surplus to multi-year highs.
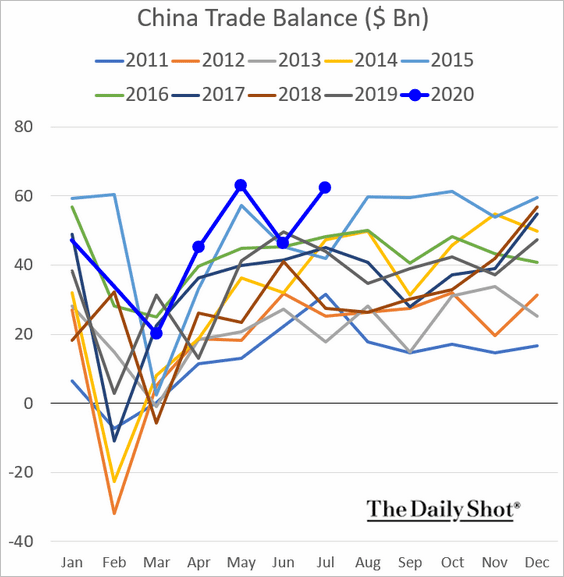
But the rebound in exports has been uneven across sectors.
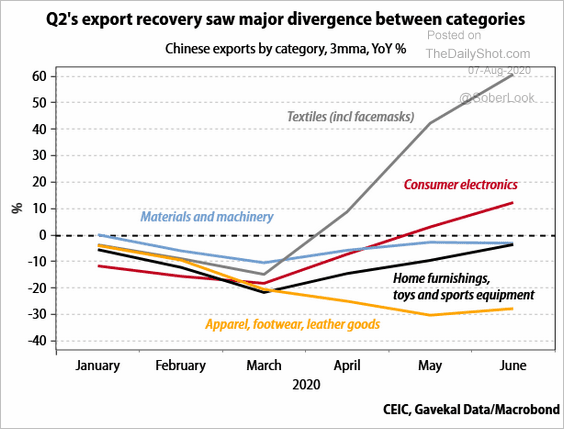 Source: Gavekal
By the way, this chart shows exports of pharmaceuticals over the past decade.
 Source: @WSJ Read full article
Emerging Markets
1. The Turkish lira hit a record low as outflows accelerated.
There is unease with the nation’s falling foreign reserves. How long will Turkey be able to support the lira without hiking rates dramatically?
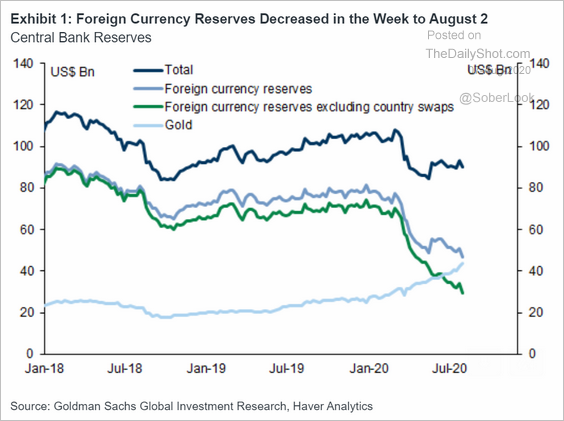 Source: Goldman Sachs
The lira is down 80% over the past decade.
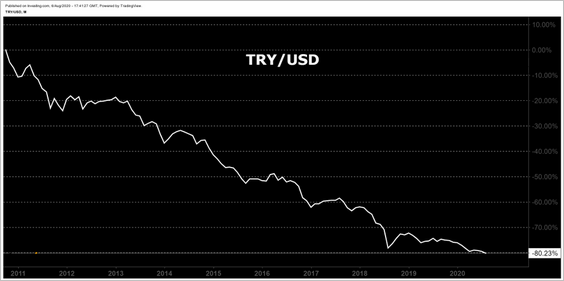 Source: @jsblokland
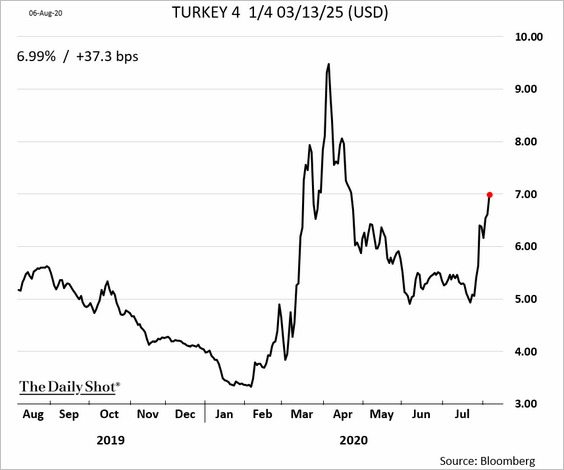
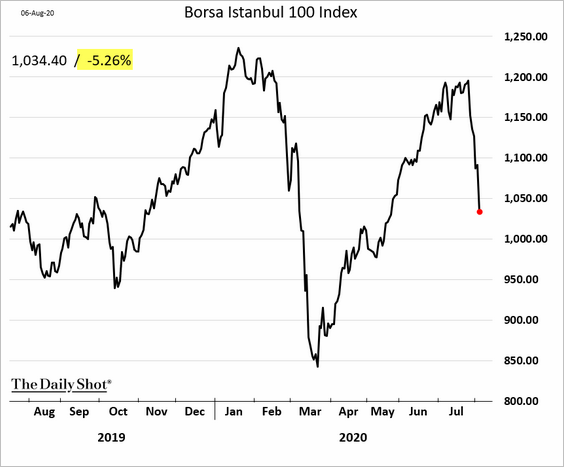
Stocks have been tumbling, and debt yields continue to climb.
——————–
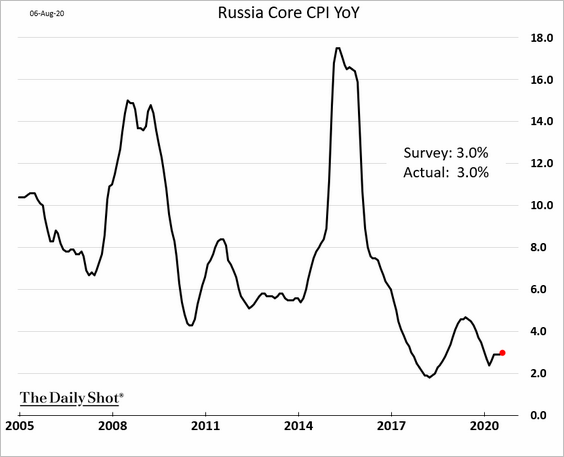
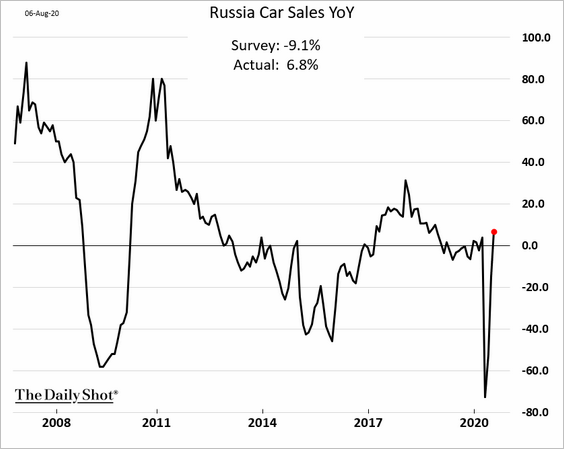
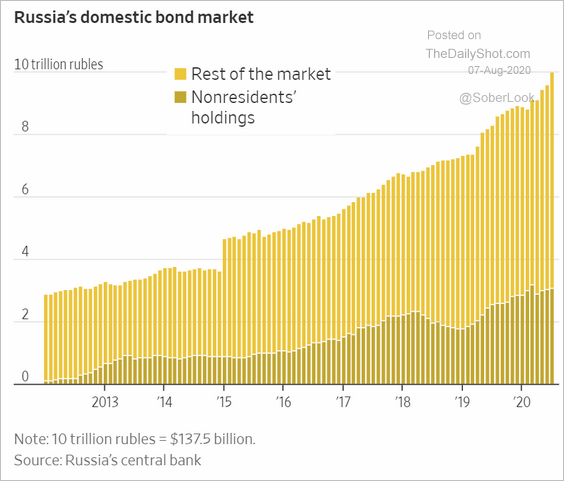
2. Here are some updates on Russia.
• Core CPI (stable):
• Car sales (impressive rebound):
• Domestic bond market:
 Source: @WSJ Read full article
——————–
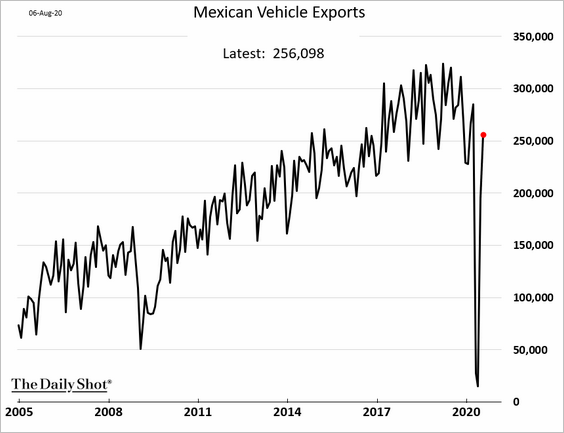
3. Next, we have some data on Mexico.
• Vehicle exports through July (boosted by US demand):
• Fixed investment:
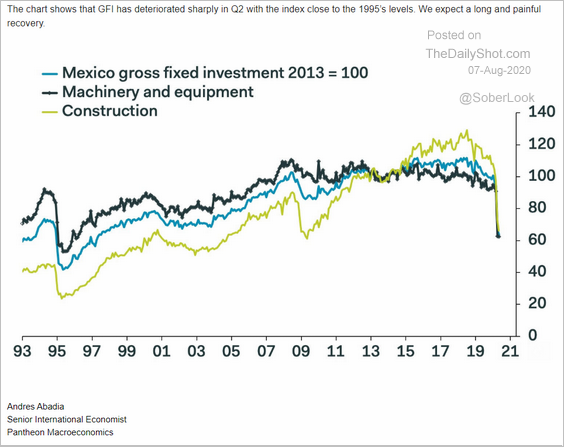 Source: Pantheon Macroeconomics
• Producer confidence:
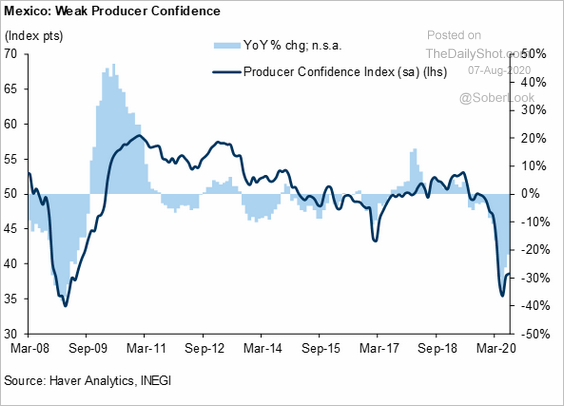 Source: Goldman Sachs
——————–
4. India’s central bank left rates unchanged amid elevated inflation. But there is a cut coming later this year, according to ANZ.
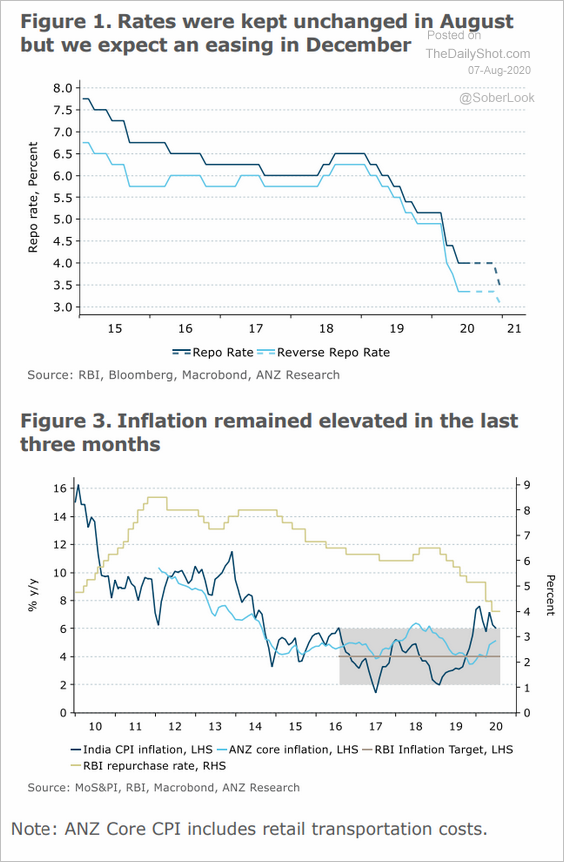 Source: ANZ Research
5. EM currencies have significantly underperformed DM.
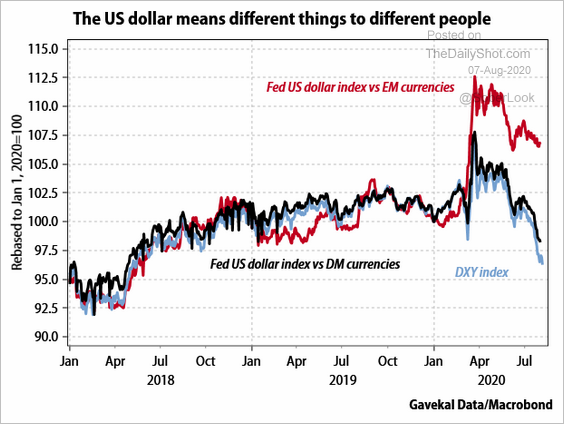 Source: Gavekal
Cryptocurrency
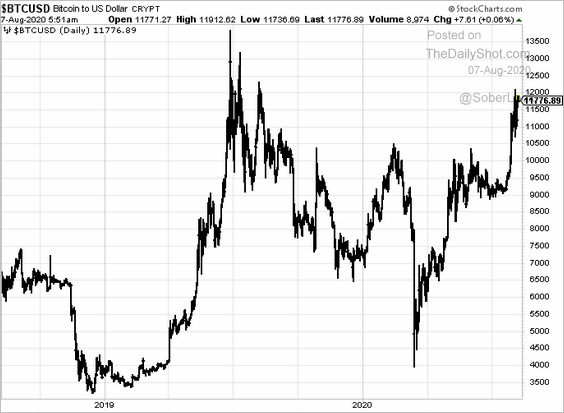
• Bitcoin is testing $12k.
• Ethereum’s daily active addresses (number of unique “from” or “to” addresses) have diverged from price.
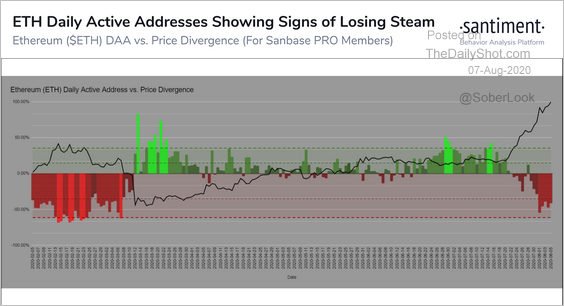 Source: @santimentfeed
• Bitcoin’s daily volume has declined from July highs, while open interest remains elevated.
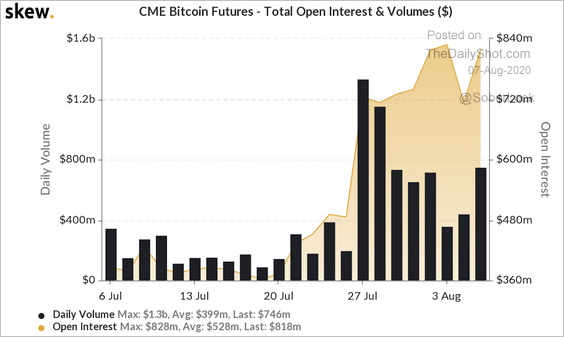 Source: Skew
Commodities
1. The media’s excitement about gold points to speculative frenzy.
 Source: @TeddyVallee
Google search activity for “how to buy gold” has been rising.
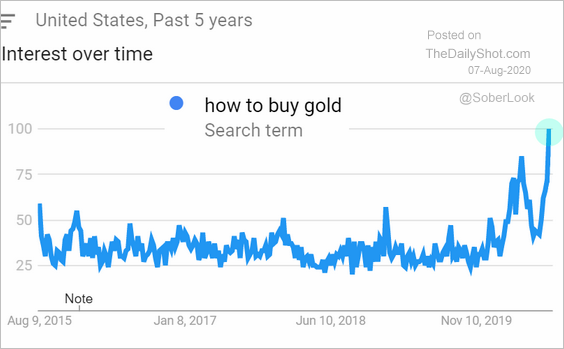 Source: Google Trends
——————–
2. This chart shows China’s steel demand.
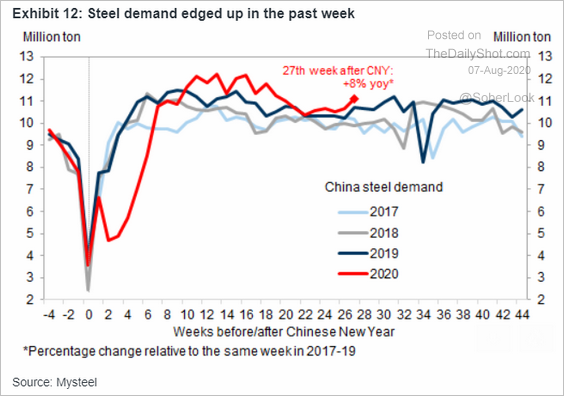 Source: Goldman Sachs
3. Finally, we have coffee prices denominated in Brazilian real. This chart makes local growers extremely happy.
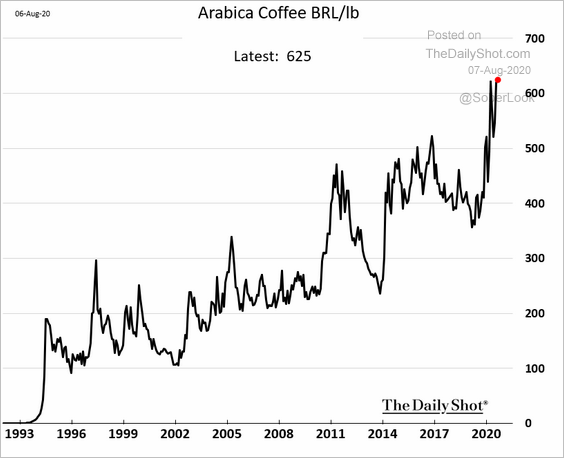 h/t @manishajha03
Energy
1. OPEC exports are rebounding.
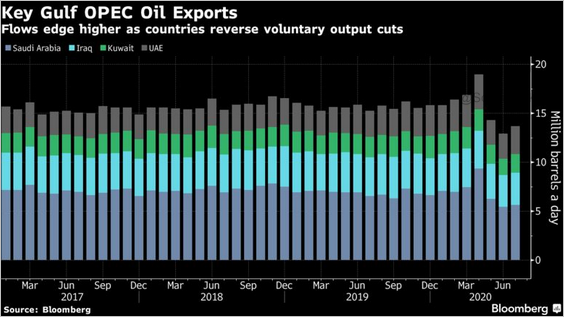 Source: @markets Read full article
2. US downstream refinery utilization remains depressed.
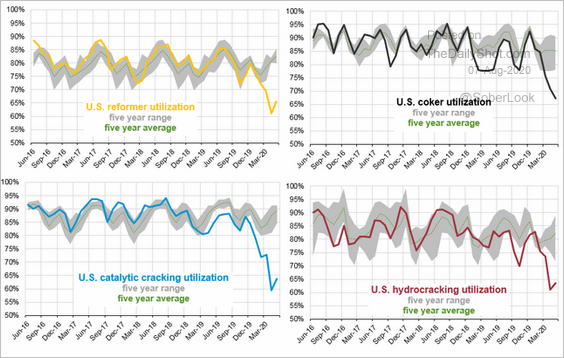 Source: EIA, @T_Mason_H
3. Energy companies’ earnings could decline further based on the WTI price forecast from Barclays.
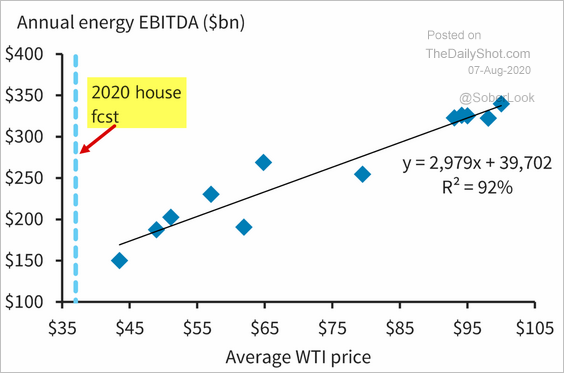 Source: Barclays Research
By the way, here is the distribution of energy companies’ earnings by type of business.
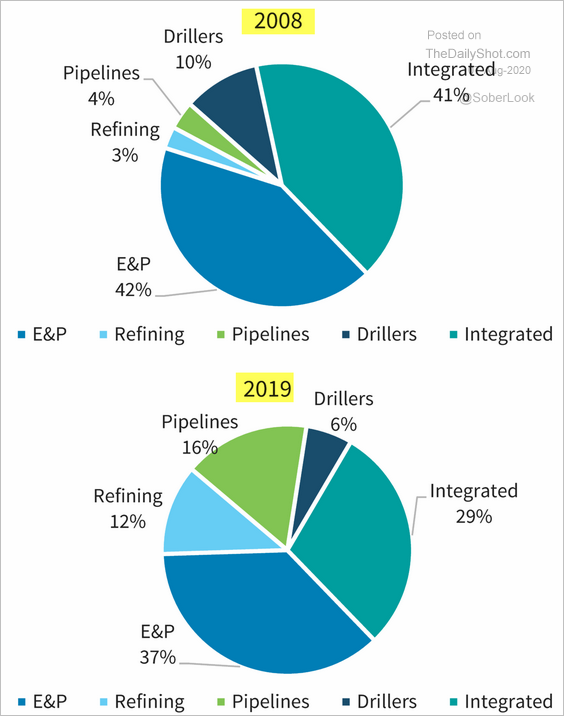 Source: Barclays Research
Equities
1. Retail investors fell in love with options trading.
• This is what shows up in Google when you type “how to buy.”
 Source: @jessefelder
• Here is the Google search frequency for “how to buy options.”
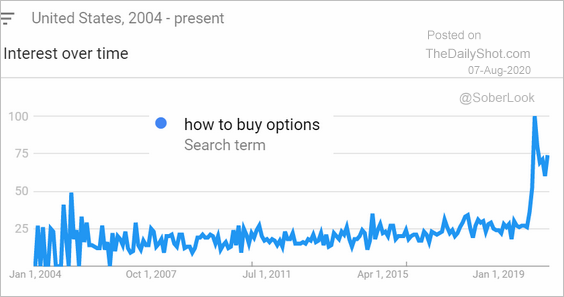 Source: Google Trends
——————–
2. CNN’s fear/greed index is moving deeper into greed territory.
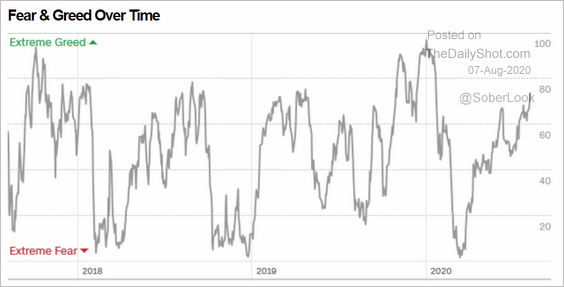 Source: CNN Business
The put/call ratio continues to signal rising risk appetite.
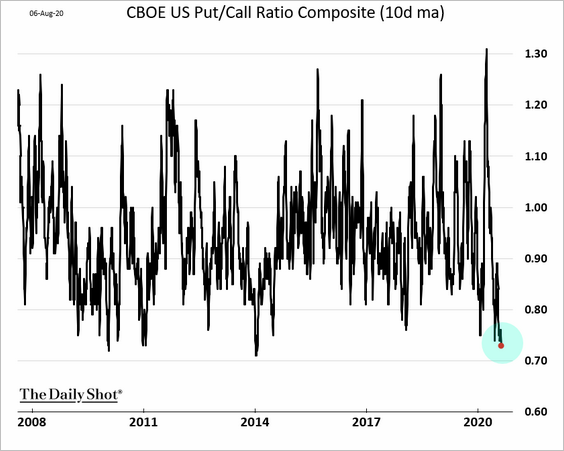
Also, this chart shows media mentions of the phrase “relentless rally.”
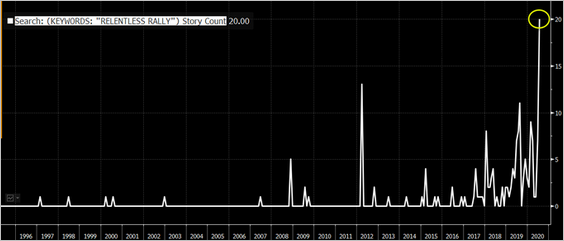 Source: @EricBalchunas, @SarahPonczek, @hmeisler, @jessefelder
——————–
3. Downside volatility is at the lowest levels of the year.
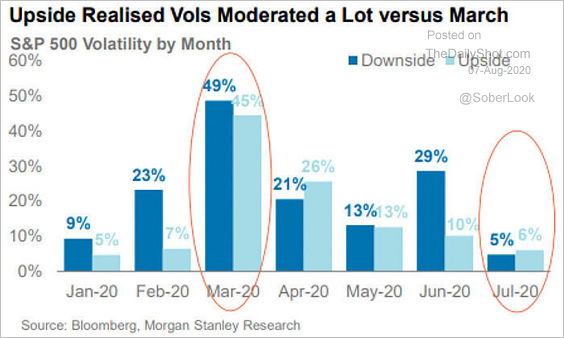 Source: @ISABELNET_SA, @MorganStanley
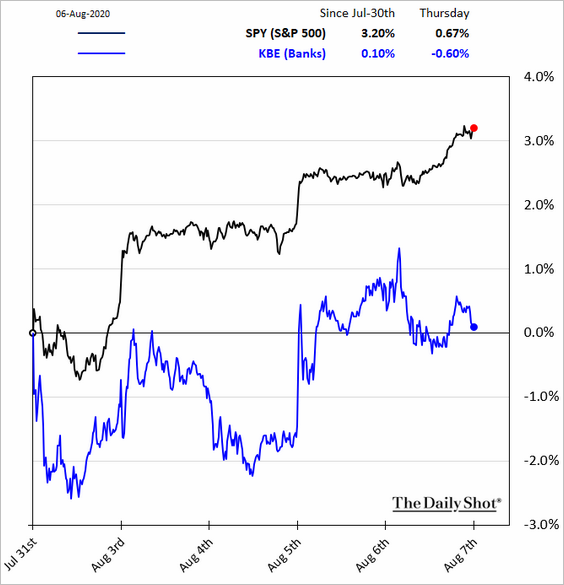
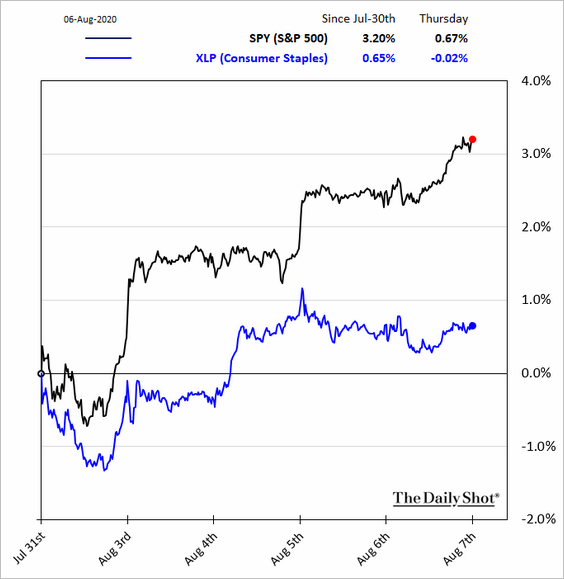
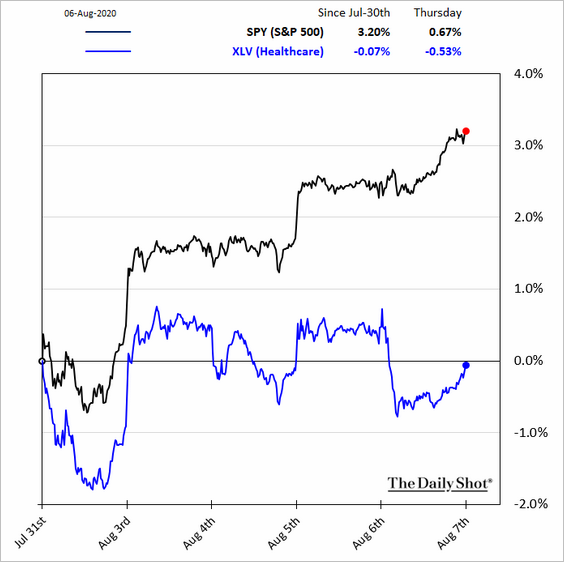
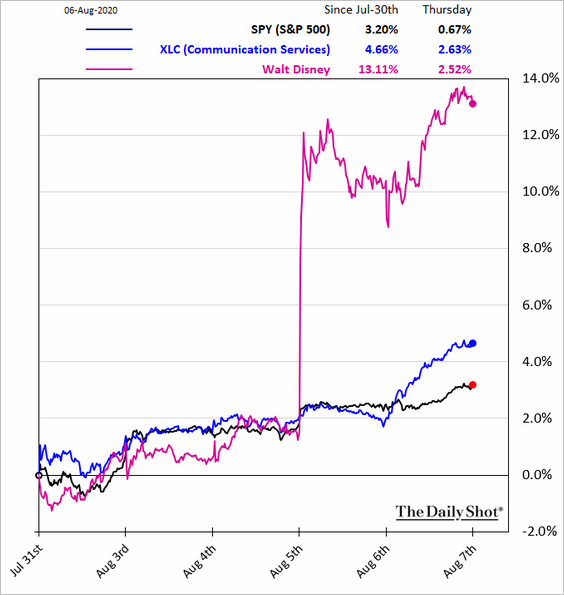
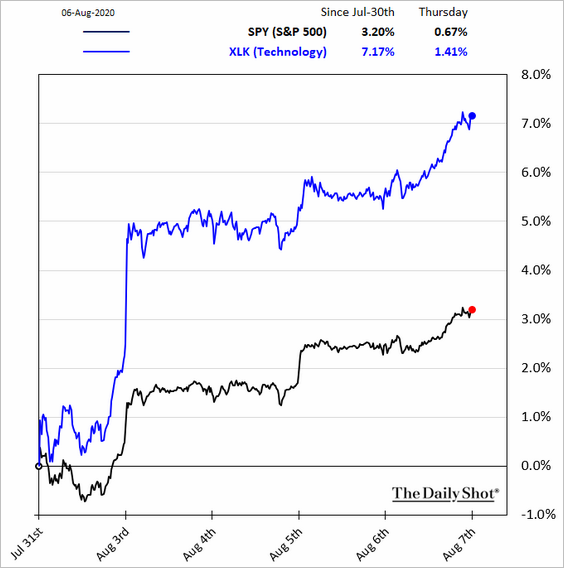
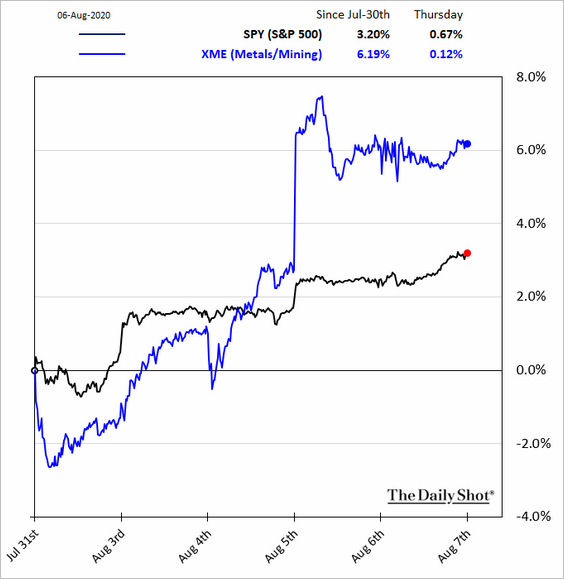
4. Next, we have some sector updates (relative returns).
• Banks:
• Consumer staples:
• Healthcare:
• Communication services:
• Tech:
• Metals & Mining:
• Transportation:
![]()
Credit
1. US investment-grade bond yields are hitting new lows.
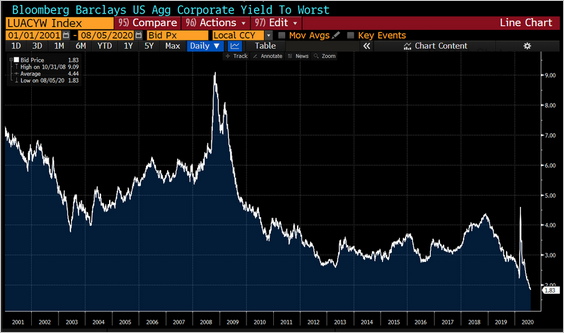 Source: @lisaabramowicz1
2. Here is the distribution of leveraged loan ratings.
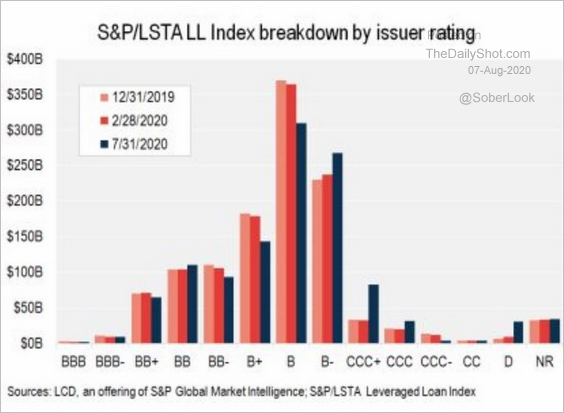 Source: @lcdnews
3. The biggest weekly flows into corporate bond and loan funds have occurred this year.
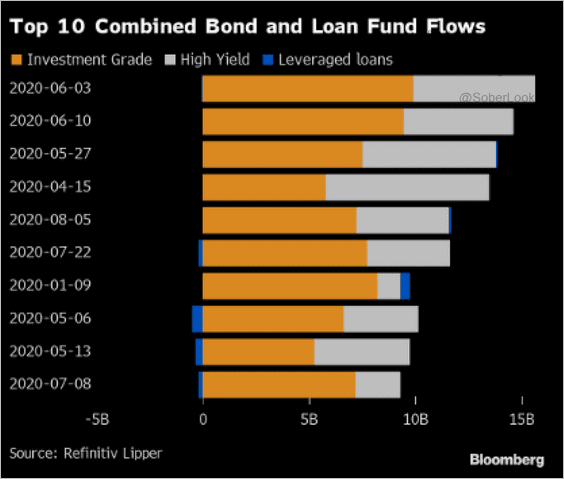 Source: @lisaabramowicz1, @skyler_rossi, @theterminal
Rates
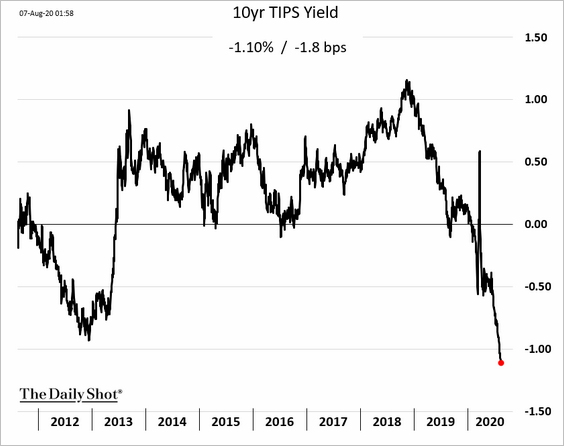
1. Real yields continue to tumble.
2. 90% of government bonds trade at yields lower than 1% versus 40% in 2019.
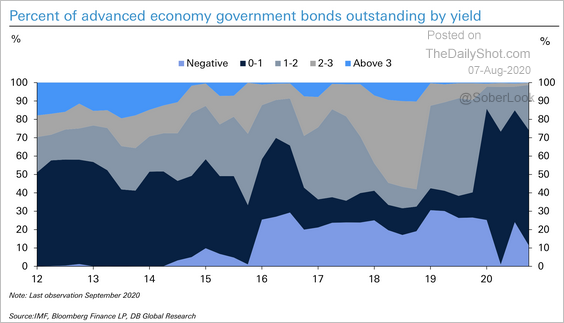 Source: Deutsche Bank Research
3. The Treasury bill market has doubled since March.
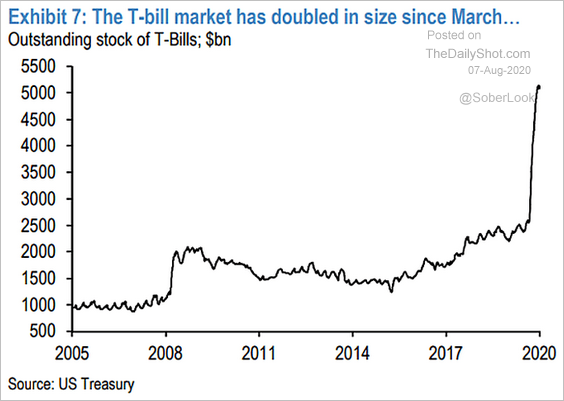 Source: JP Morgan, @ISABELNET_SA, @jpmorgan
4. The chaos in the Treasury market at the start of the crisis had little to do with hedge funds (despite some media reports). It was all about foreign corporations, governments, and central banks selling US debt to raise liquidity.
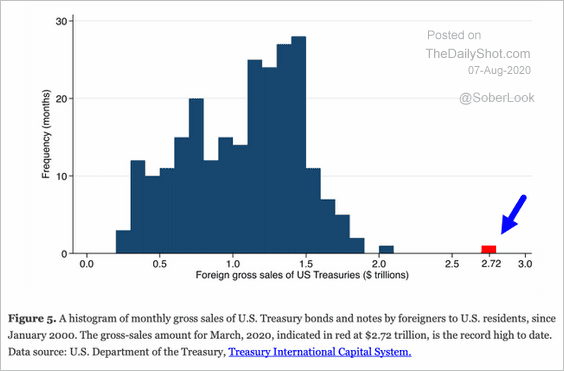 Source: @adam_tooze, Brookings Read full article
——————–
Food for Thought
1. What do homebuyers want?
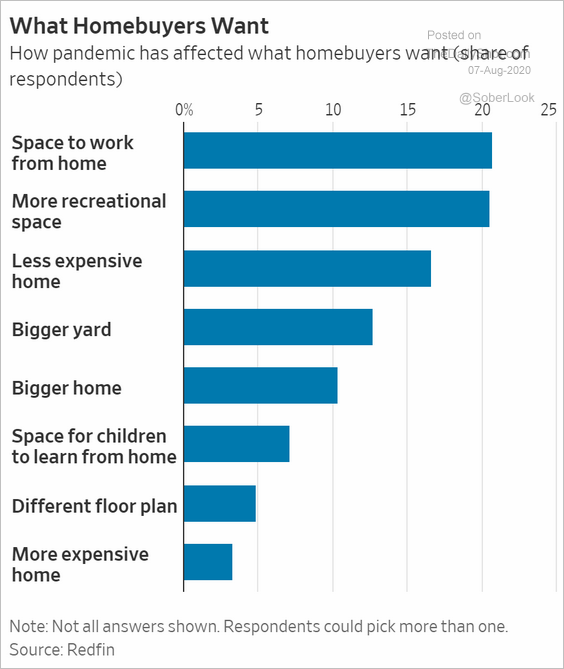 Source: @WSJ Read full article
2. Job satisfaction globally:
 Source: Statista, @wef Further reading
3. Air traffic:
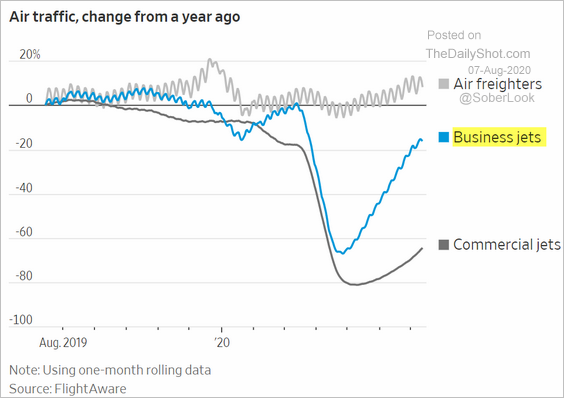 Source: @WSJ Read full article
4. New York City subway ridership:
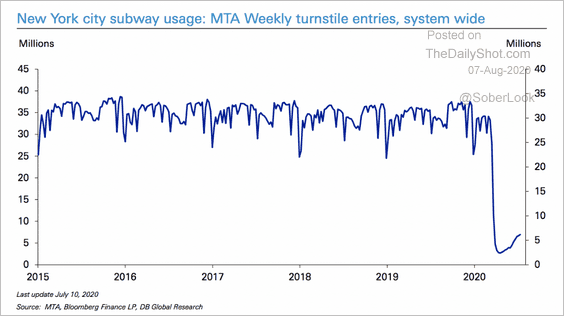 Source: Deutsche Bank Research
5. Ammonium nitrate disasters:
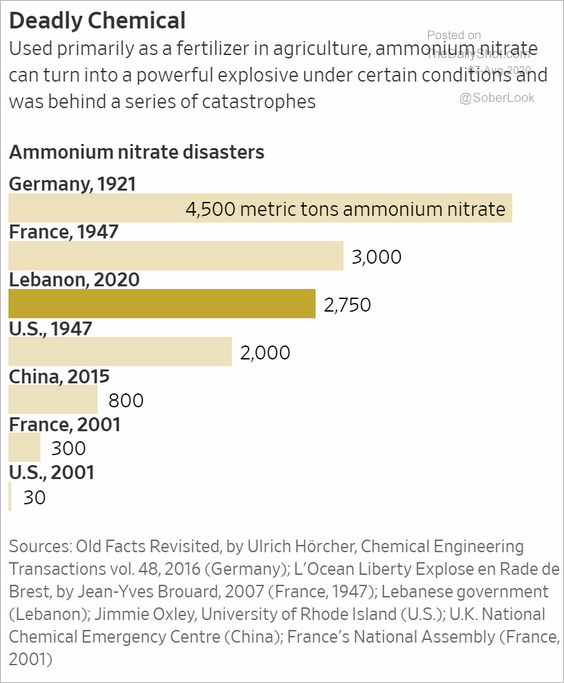 Source: @WSJ Read full article
6. Where the US is viewed as an ally:
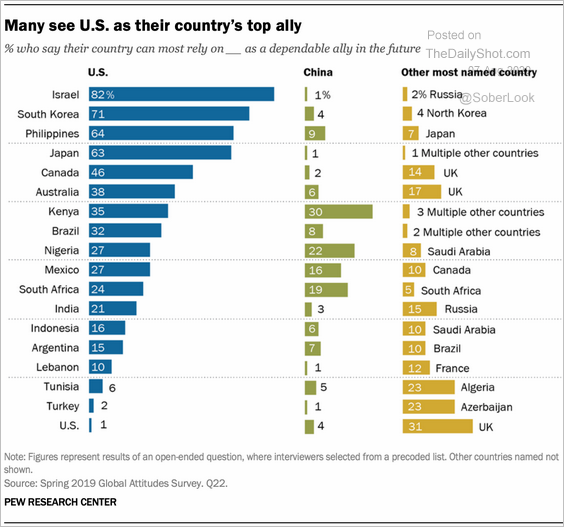 Source: @pewglobal Read full article
7. Mail-in voting status:
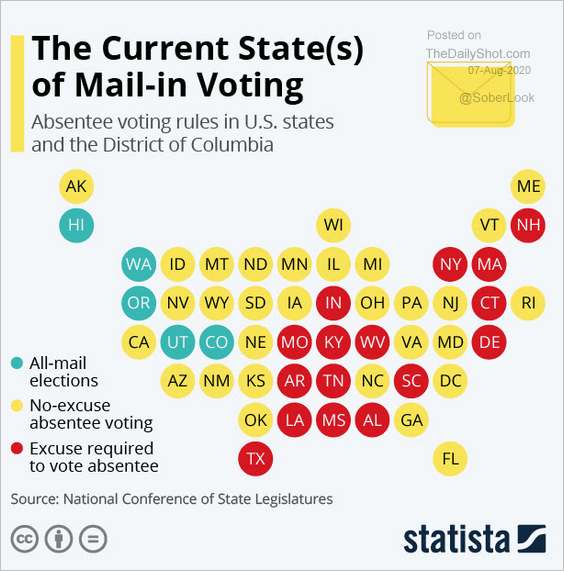 Source: Statista
8. Skilled freelance workers:
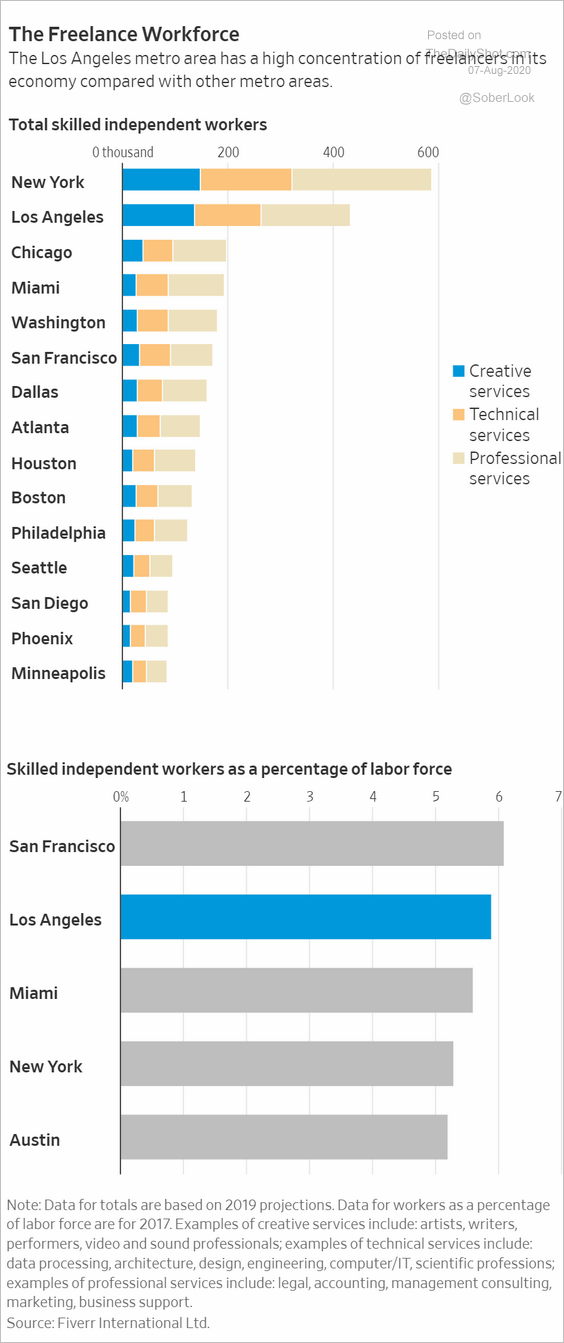 Source: @WSJ Read full article
9. Hot dog styles:
 Source: Food Republic
——————–
Have a great weekend!