
The Daily Shot: 14-Aug-20
• The United States
• The Eurozone
• Europe
• Asia – Pacific
• China
• Emerging Markets
• Commodities
• Equities
• Credit
• Rates
• Global Developments
• Food for Thought
The United States
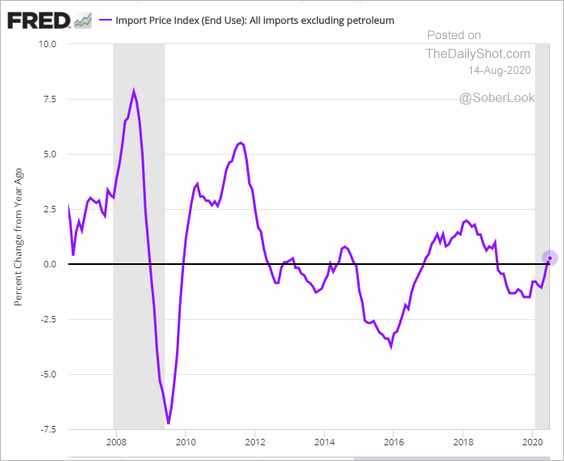
1. Import prices are rebounding. Excluding petroleum products, import prices are now up on a year-over-year basis.
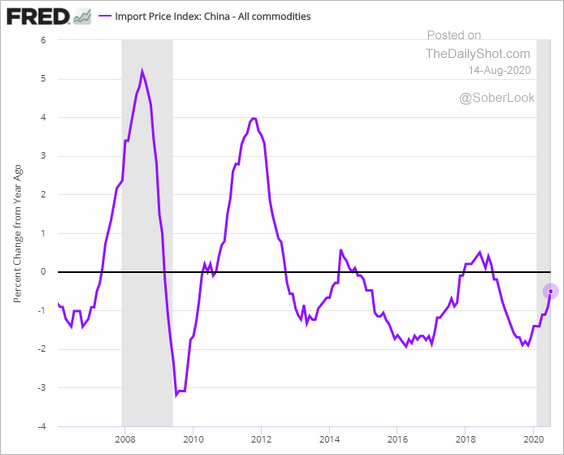
This chart shows the changes in import prices from China.
——————–
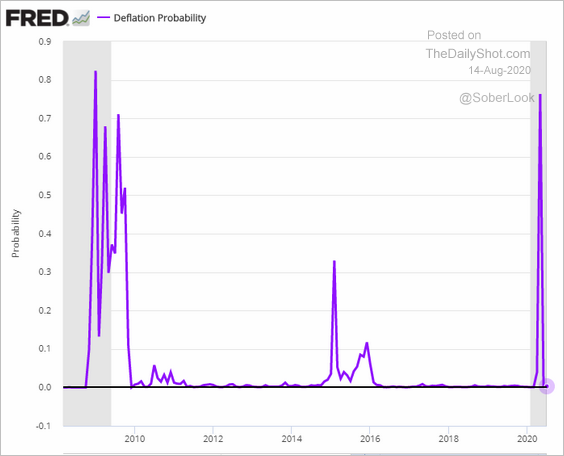
2. Next, we have a couple of other inflation-related trends.
• In May, the St. Louis Fed estimated a 75% likelihood of deflation, but that probability receded in June.
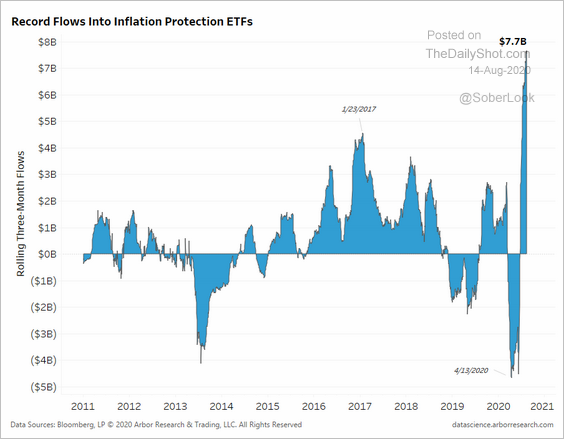
• Capital flows into inflation protection ETFs (which invest in TIPS) are hitting new records as investors prepare for faster growth in prices.
 Source: @benbreitholtz
——————–
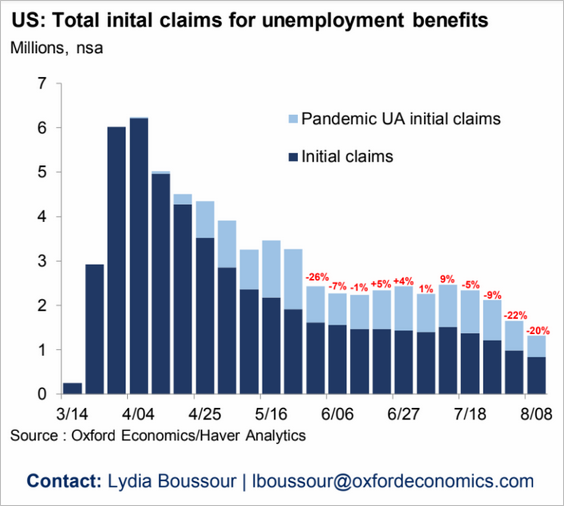
3. Here are some updates on the labor market.
• US initial jobless claims continue to moderate.
 Source: Oxford Economics
• Job postings are showing modest improvements.
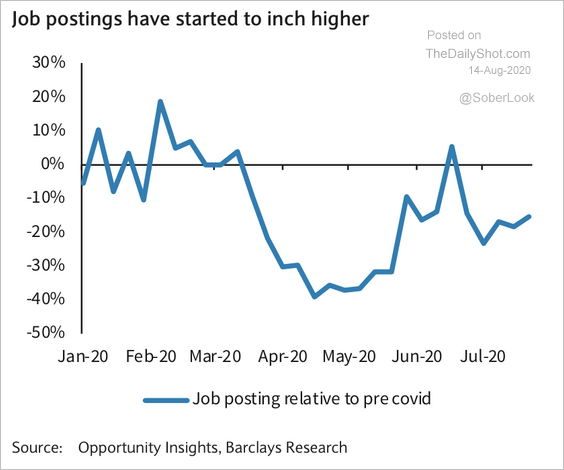 Source: Barclays Research
• Manufacturing employment hasn’t kept pace with the recovery in manufacturing activity.
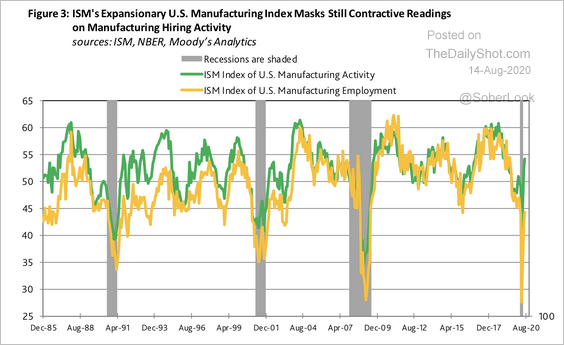 Source: Moody’s Analytics
——————–
4. The Oxford Economics recovery tracker has stalled at about three-quarters of the pre-crisis levels.
![]() Source: Oxford Economics
Source: Oxford Economics
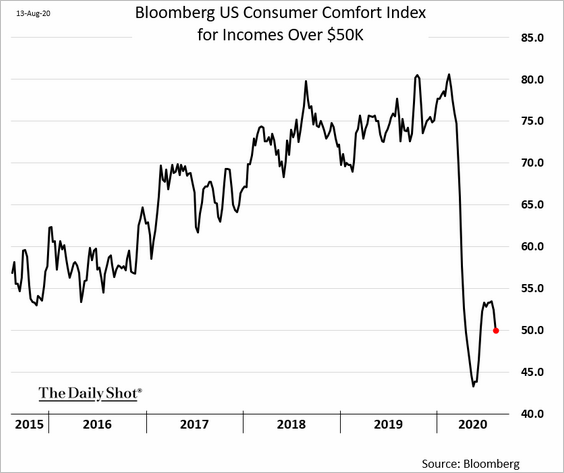
5. Bloomberg’s consumer sentiment index is rolling over.
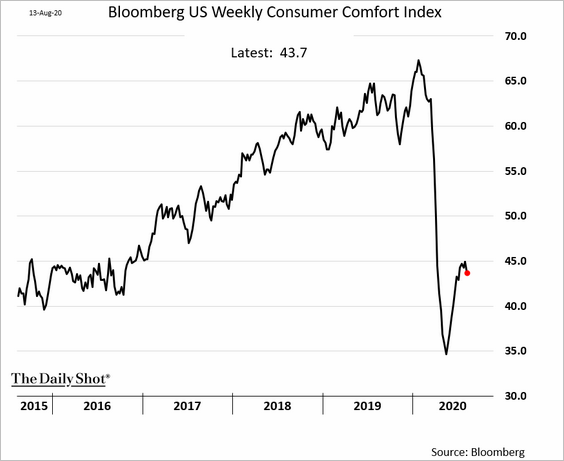
Americans making over $50k/year are losing confidence in the recovery.
——————–
6. Selling prices of homes have failed to keep pace with list prices.
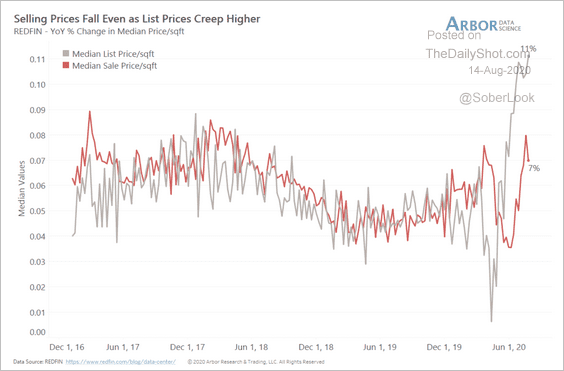 Source: Arbor Research & Trading
7. “New economy” business investment is now half of the total CapEx.
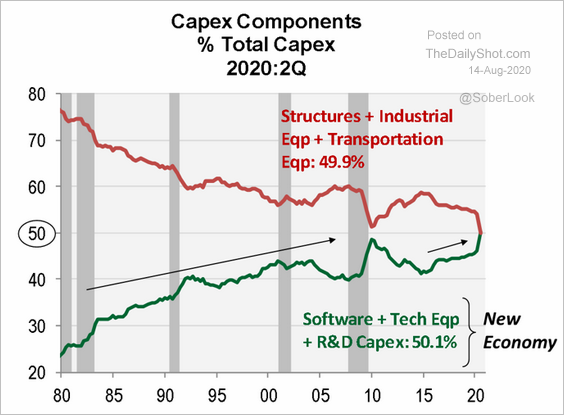 Source: @NancyRLazar1
The Eurozone
1. The French unemployment rate hit a multi-decade low, but the lockdown had distorted the figures.
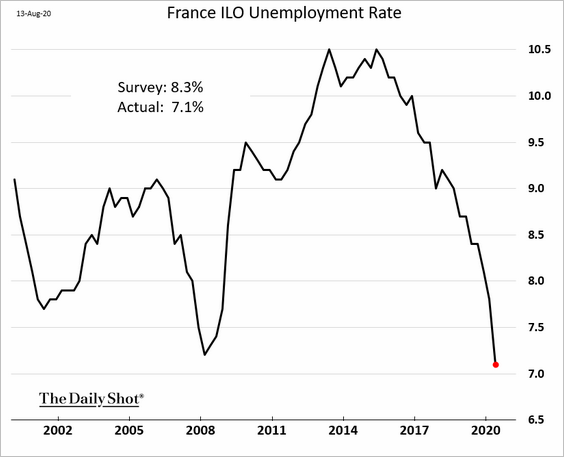
 Source: Reuters Read full article
——————–
2. As we saw earlier, Germany’s consumer inflation touched zero last month.
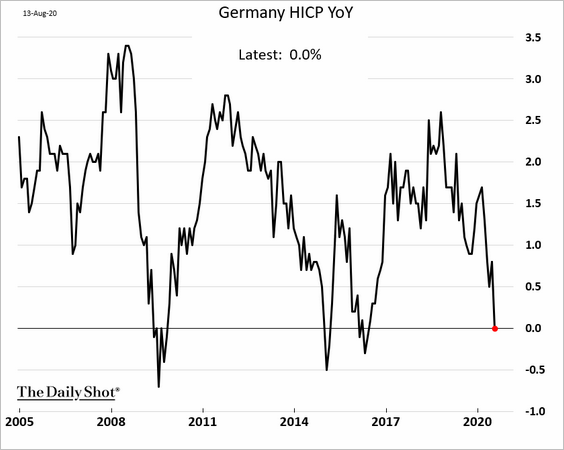
However, the CPI figures were distorted by the recent cut in sales tax (VAT).
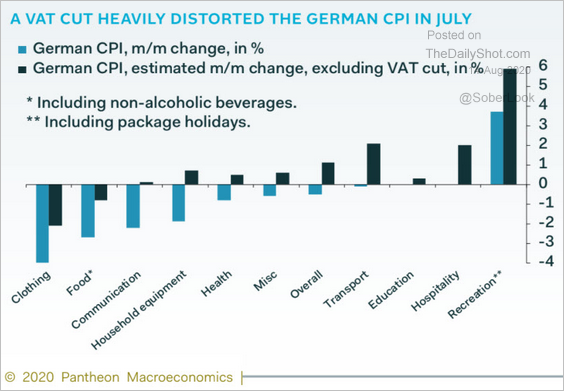 Source: Pantheon Macroeconomics
——————–
3. The spread between the US and German real yields has declined sharply this year, which provided support for the euro.
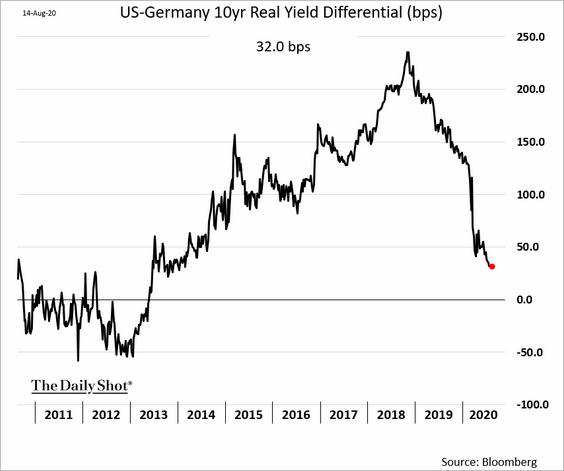 h/t Anil Varma
Europe
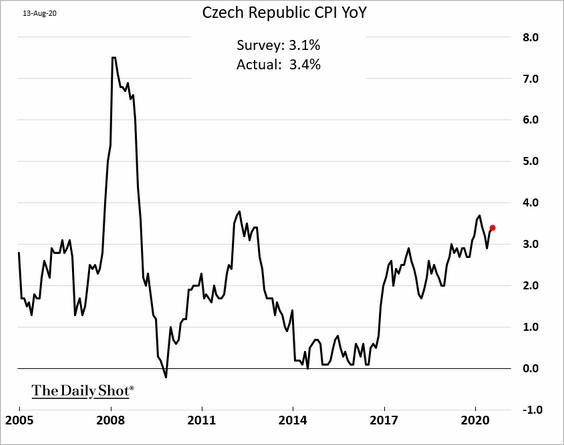
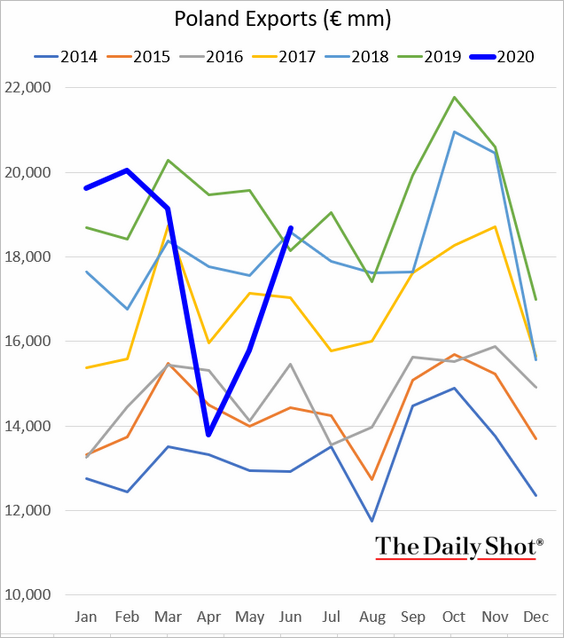
1. Here are a couple of updates on central Europe.
• The Czech CPI continues to trend higher.
• Poland’s exports are rebounding.
——————–
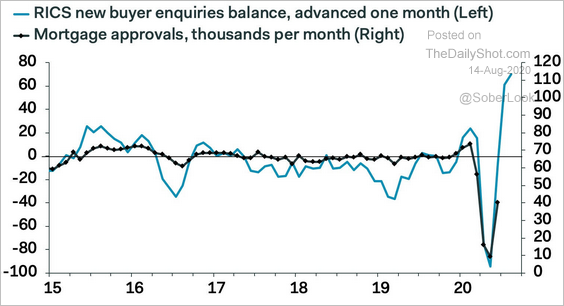
2. In the UK, new homebuyer inquiries point to a sharp rebound in mortgage approvals.
 Source: Pantheon Macroeconomics
Asia – Pacific
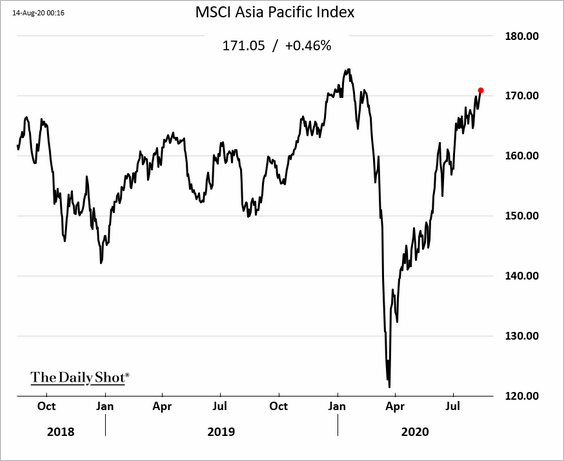
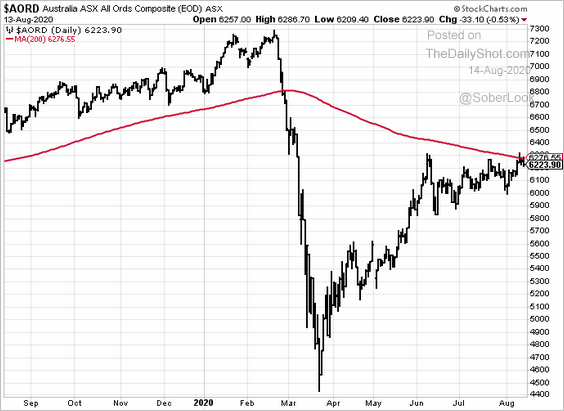
1. Asia-Pacific shares have fully recovered from the pandemic selloff.
2. Australia’s stock market is testing resistance.
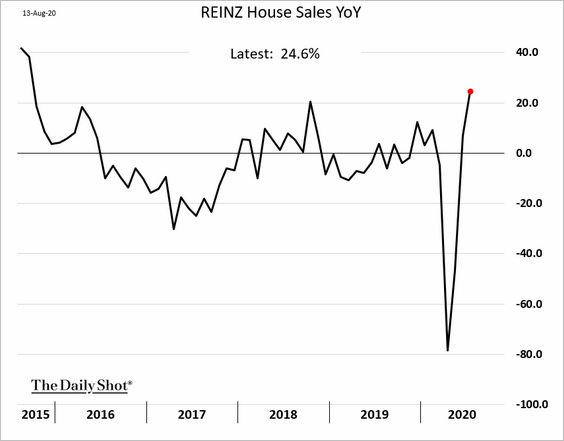
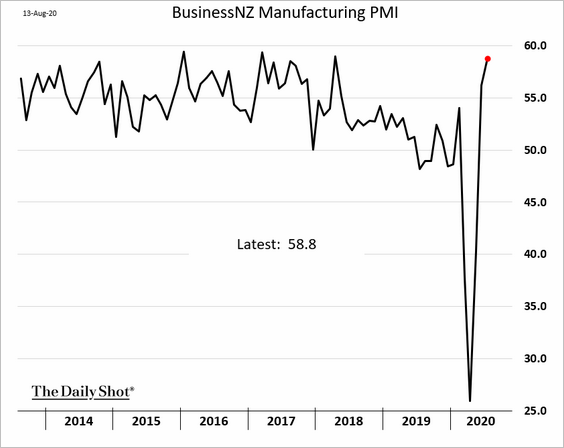
3. Next, we have a couple of updates on New Zealand.
• House sales:
• Manufacturing activity (PMI > 50 means growth):
China
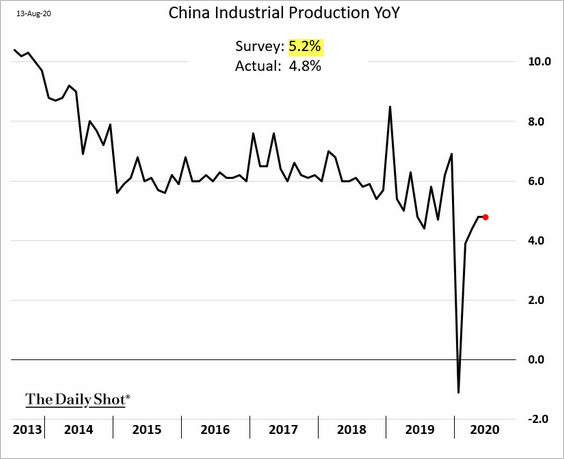
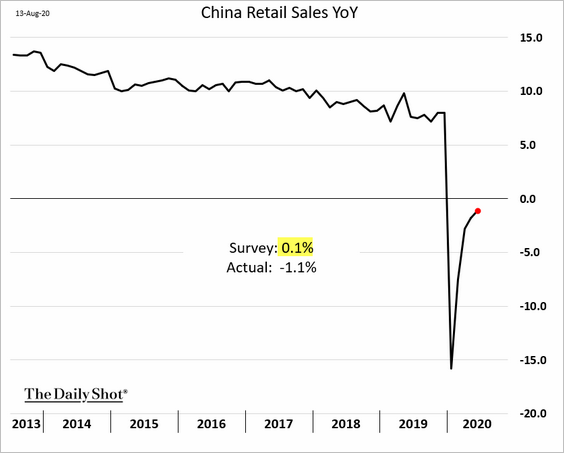
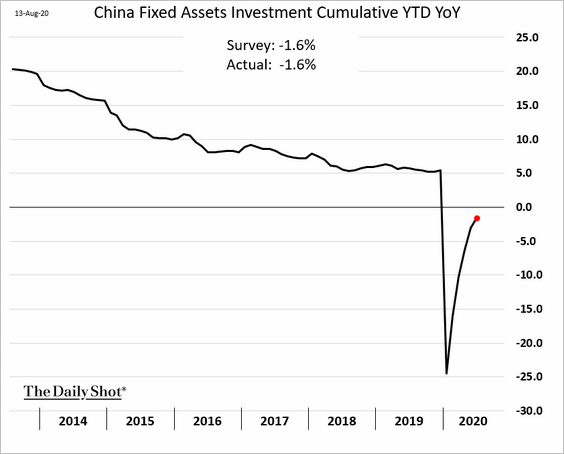
1. The July economic data was a bit disappointing, suggesting that the rebound momentum is slowing.
• Industrial production:
• Retail sales:
• Fixed asset investment:
Here is the breakdown between state and private investment.
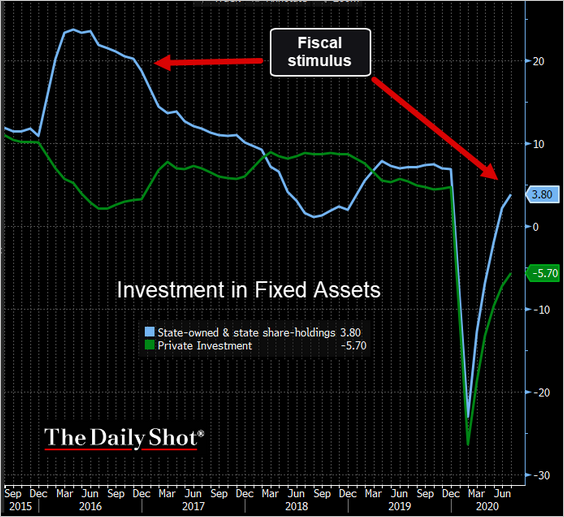 Source: @TheTerminal
——————–
2. Is the money supply growth peaking?
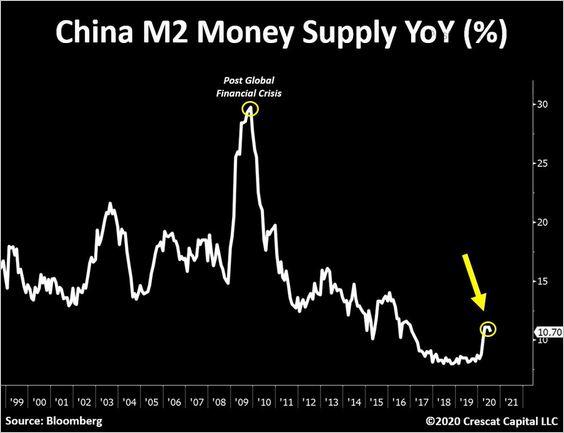 Source: @TaviCosta
3. Domestic travel has recovered.
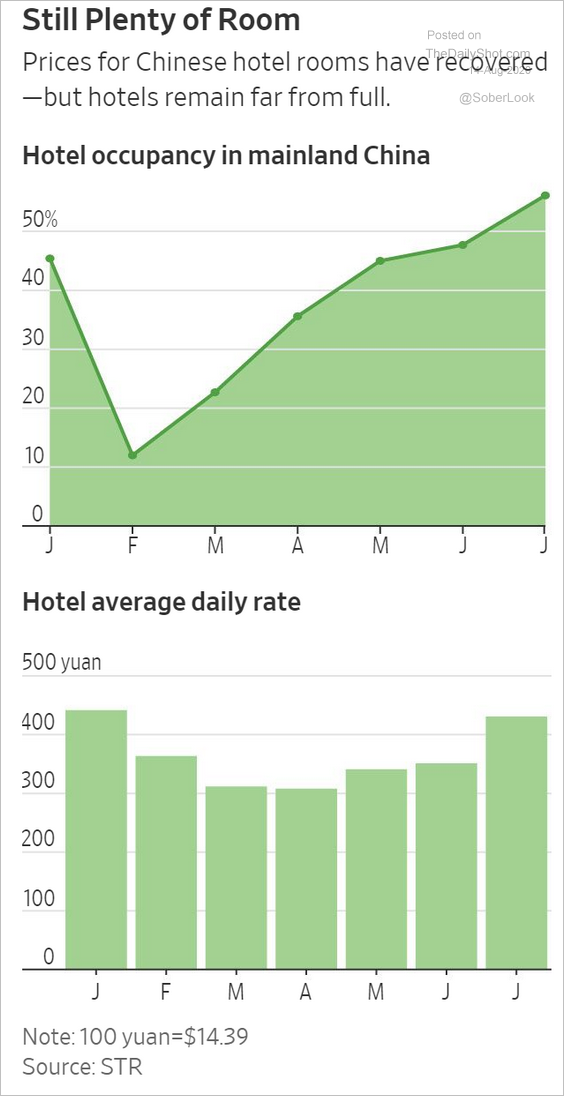 Source: @WSJ Read full article
Emerging Markets
1. Let’s begin with India.
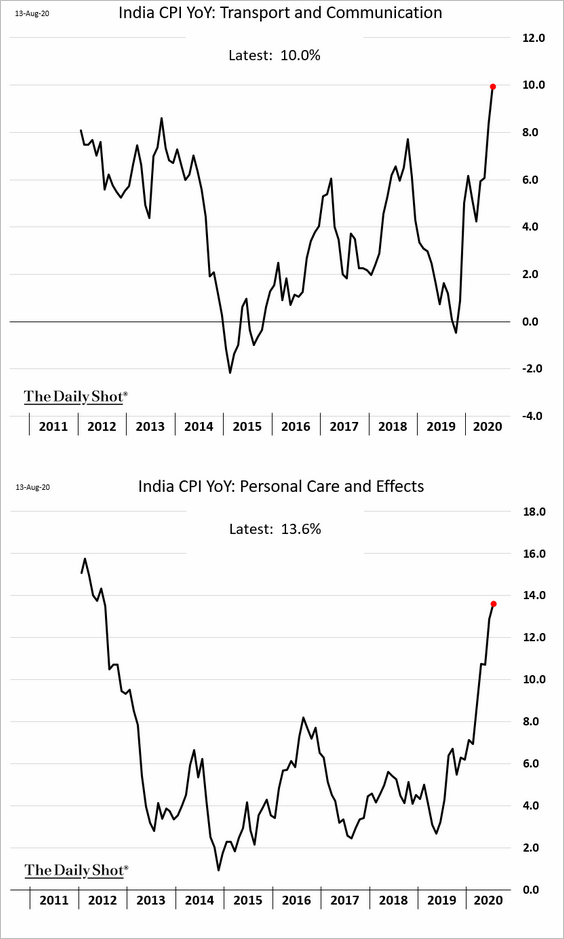
• Inflation remains stubbornly high.
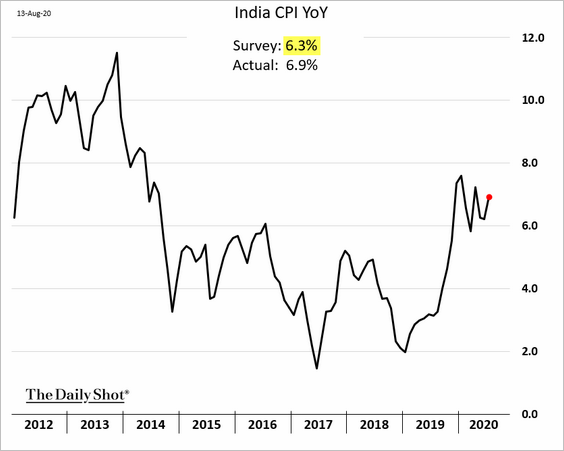
And it’s not just food prices.
The CPI is above the RBI’s target range, and the core CPI is moving there as well.
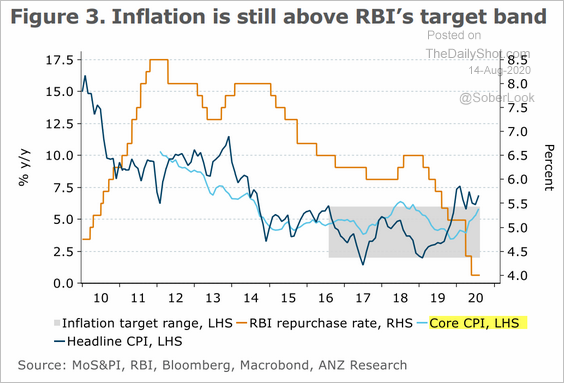 Source: ANZ Research
• The government has been tapping the central bank for extra funds.
![]() Source: @markets Read full article
Source: @markets Read full article
• Indian banks’ profitability is expected to be the worst in Asia.
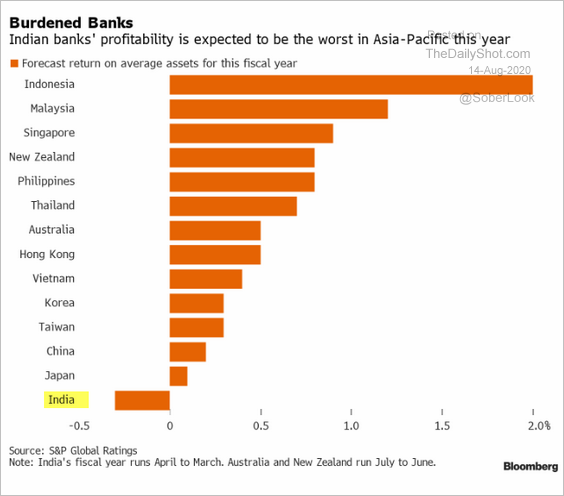 Source: @myrahulsatija, @TheTerminal
• The daily new coronavirus cases are hitting record highs.
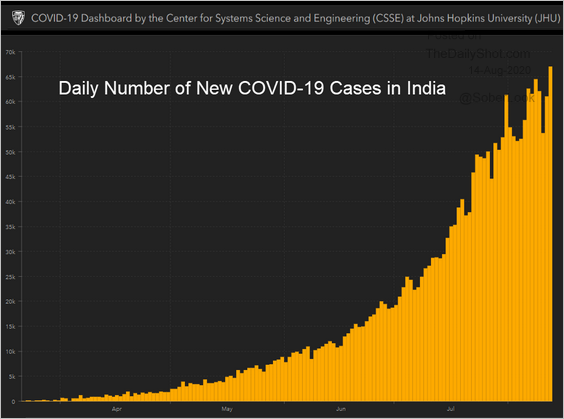 Source: JHU CSSE
——————–
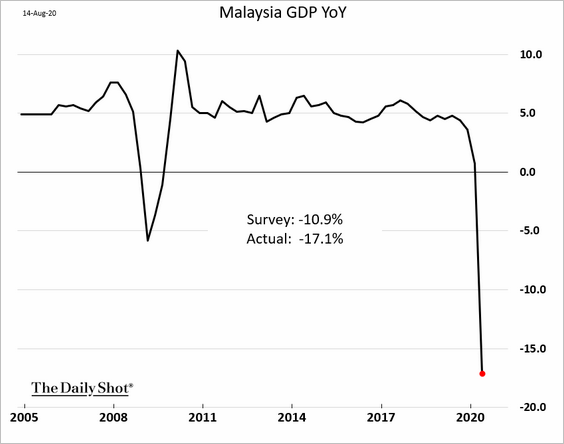
2. Malaysia’s GDP collapsed in Q2.
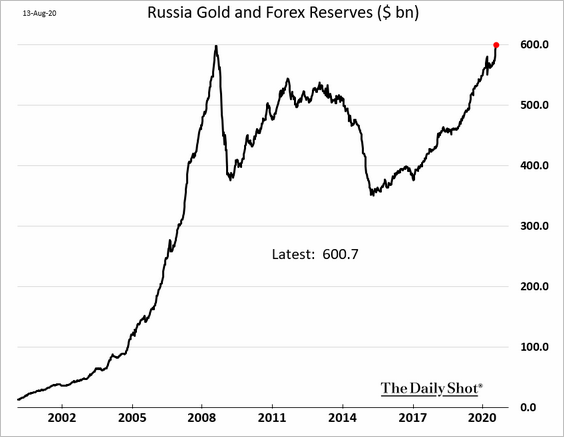
3. Boosted by higher gold prices, Russia’s F/X and gold reserves exceeded $600 billion for the first time.
4. Banxico cut rates again.
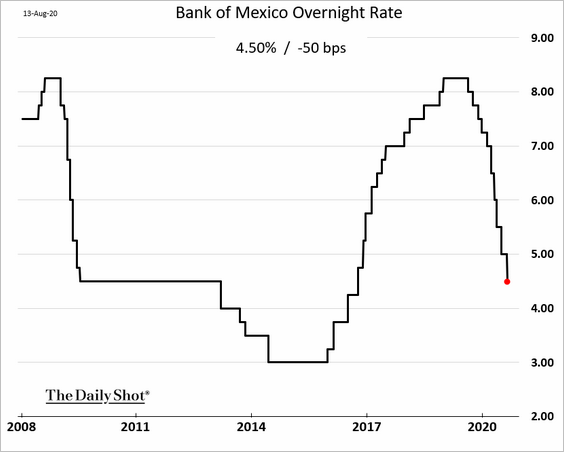
 Source: Reuters Read full article
——————–
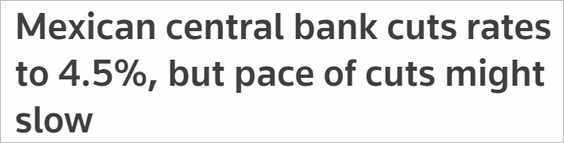
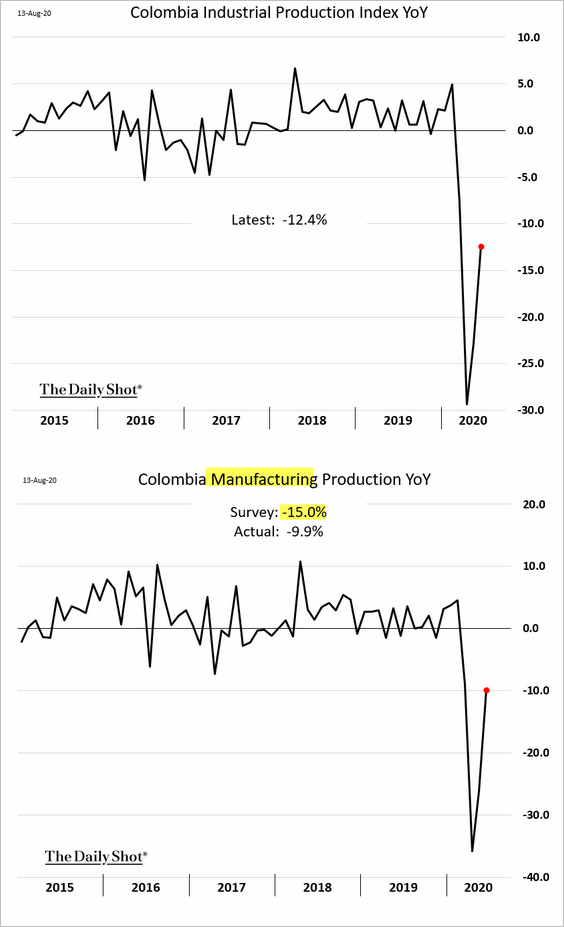
5. Colombia’s manufacturing output strengthened further in June, exceeding forecasts.
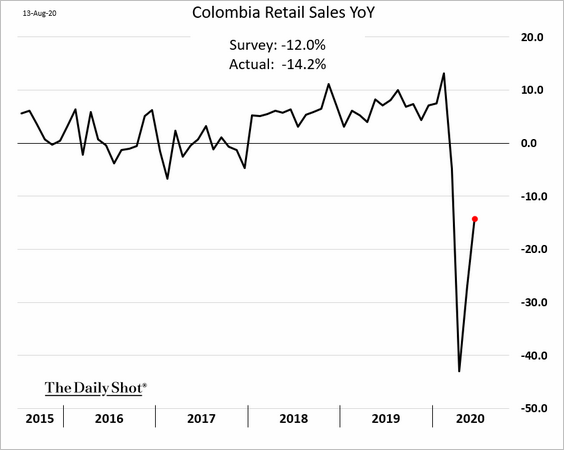
But retail sales were disappointing.
——————–
6. EM bank stocks hit the lowest point in two decades relative to the broad EM market.
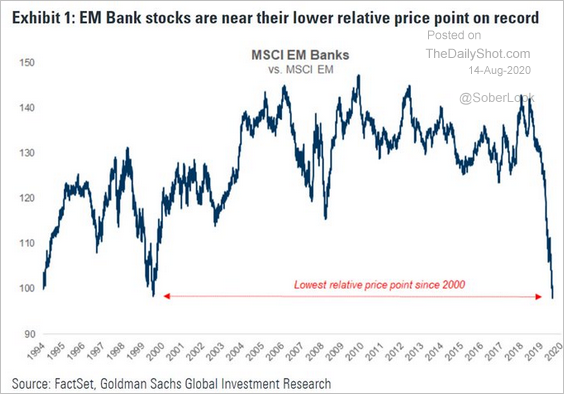 Source: Goldman Sachs, @jsblokland
Commodities
1. Let’s begin with precious metals.
• Gold’s premium to fair value is comparable to its peak in 2008, according to Deutsche Bank.
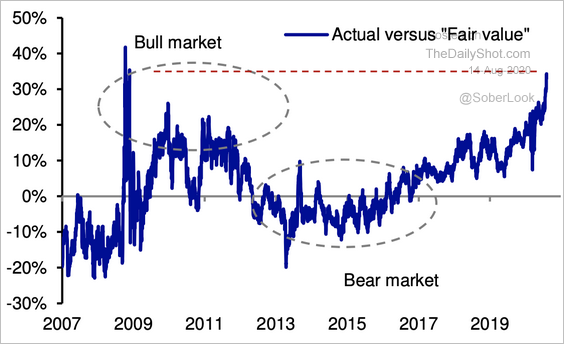 Source: Deutsche Bank Research
• The decline in the gold/silver ratio has been extremely rapid compared to history.
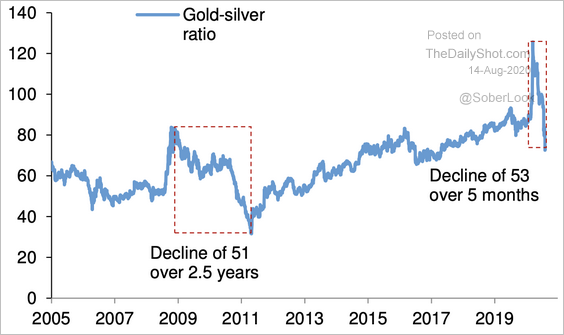 Source: Deutsche Bank Research
——————–
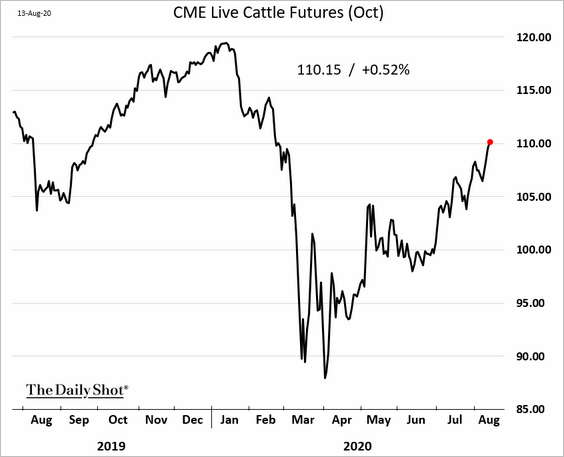
2. US cattle futures continue to recover.
3. Only 35% of commodities are producing year-over-year gains at the moment.
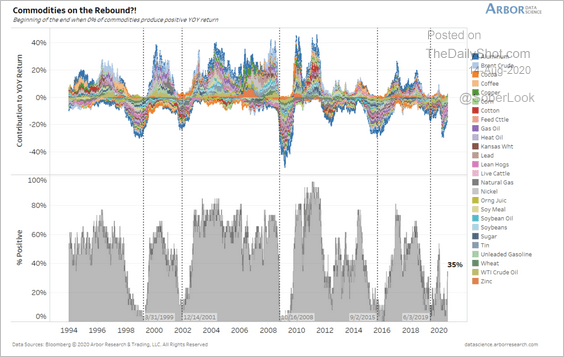 Source: Arbor Research & Trading
Equities
1. The S&P 500 appears expensive versus commodities. Will we see a reversal?
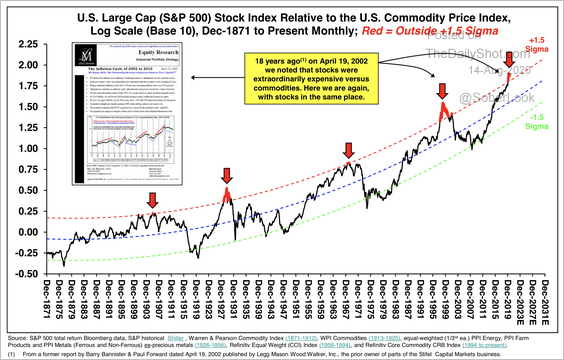 Source: Stifel
2. This recovery has been the fastest on record, with the S&P 500 rising 25% in just 37 days. The 2009 recovery took three times longer.
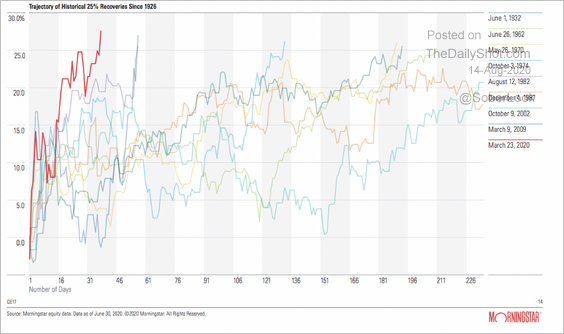 Source: Morningstar
3. The Variant Perception’s leading index points to weakness in operating income for S&P 500 companies.
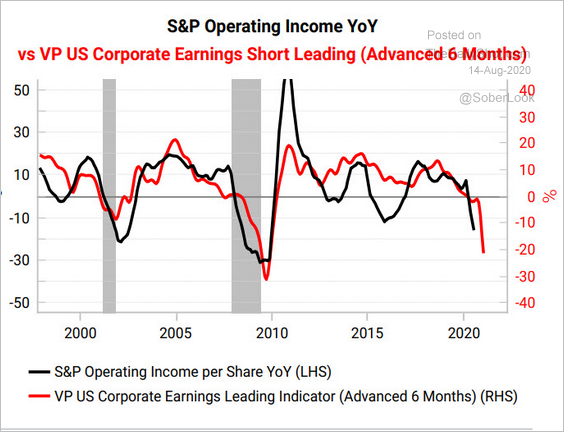 Source: Variant Perception
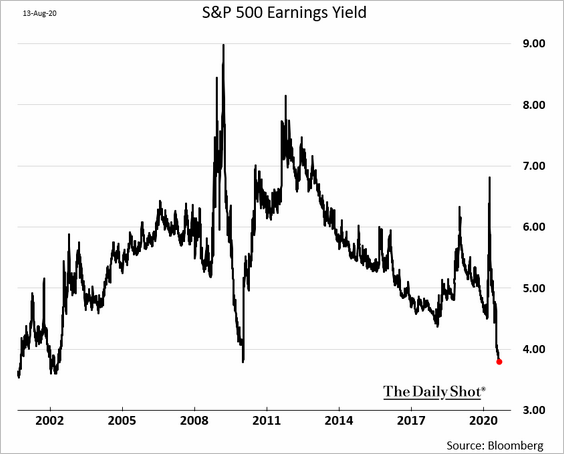
4. Here is the S&P 500 earnings yield (Bloomberg’s calculation).
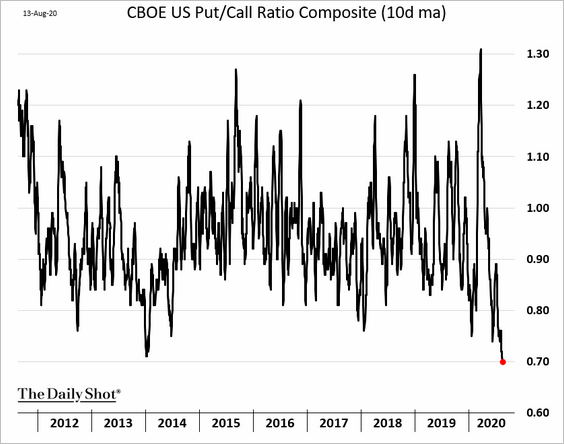
5. The 10-day moving average of the CBOE’s put/call ratio is at multi-year lows, as complacency persists.
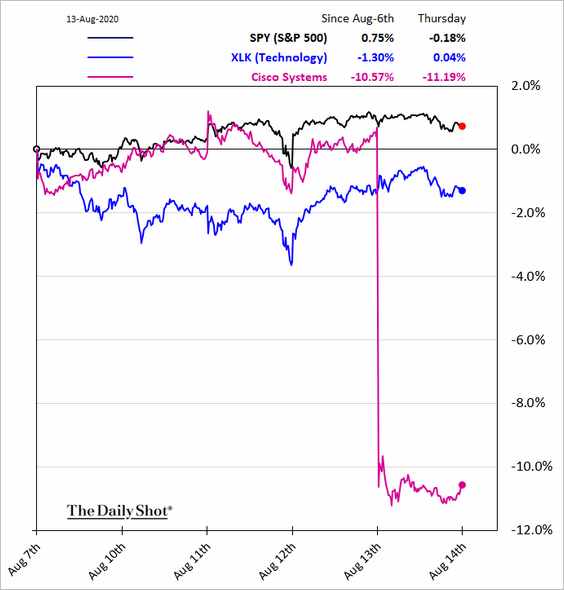
6. Next, we have a couple of charts on tech.
• Cisco (see story):
• The tech sector generates the highest percentage of international sales, while financials, utilities, and real estate are more domestically focused.
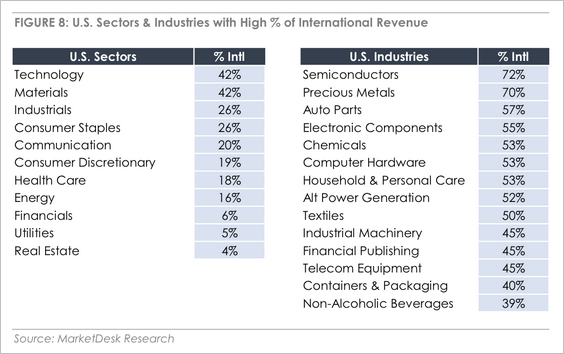 Source: MarketDesk Research
——————–
7. Banks’ loan provisions point to higher stock market volatility ahead.
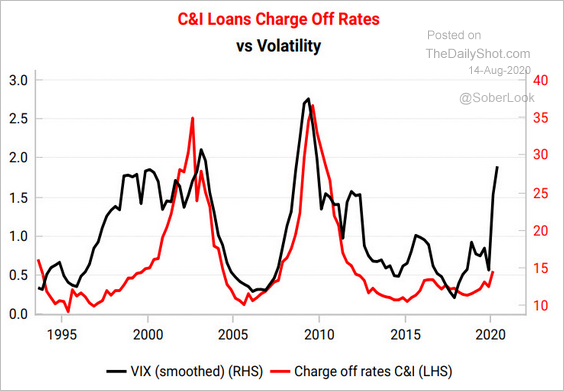 Source: Variant Perception
Credit
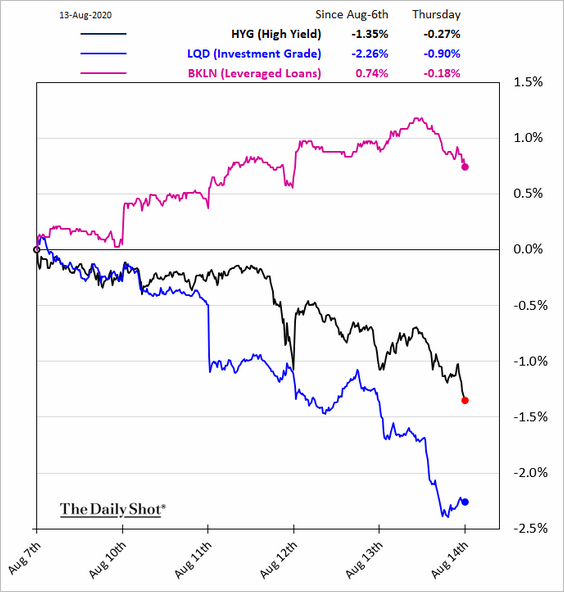
1. Leveraged loans have been outperforming as yields rise.
2. Investment-grade loan volume hit the lowest level in a decade.
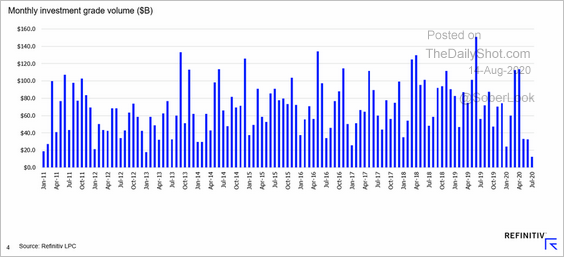 Source: @LPCLoans
3. Private-equity-backed high-yield bond issuance has been robust.
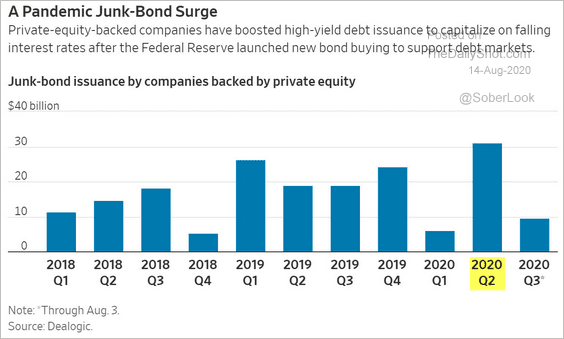 Source: @WSJ Read full article
4. More Chapter 11 filings ahead?
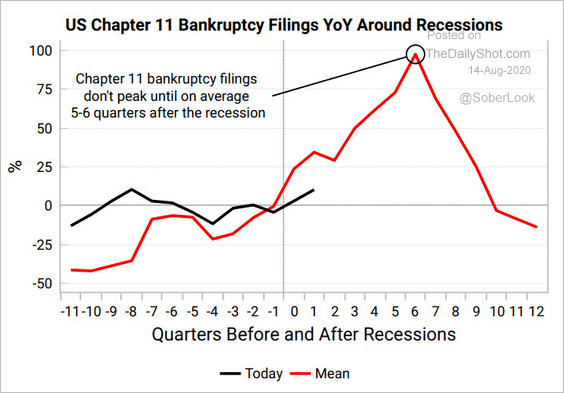 Source: Variant Perception
5. Despite a modest rally, MBS spreads remain stubbornly wide.
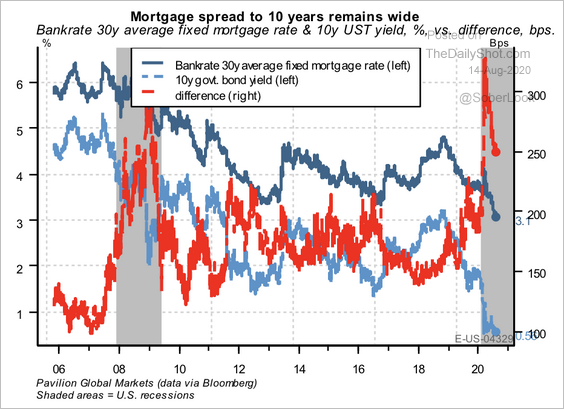 Source: Pavilion Global Markets
6. Next, we have a couple of updates on state/municipal budgets.
• Cities’ revenues vs. expenditures:
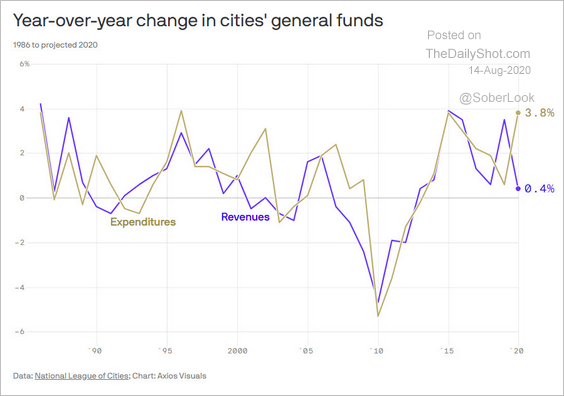 Source: @axios Read full article
• State & local government spending:
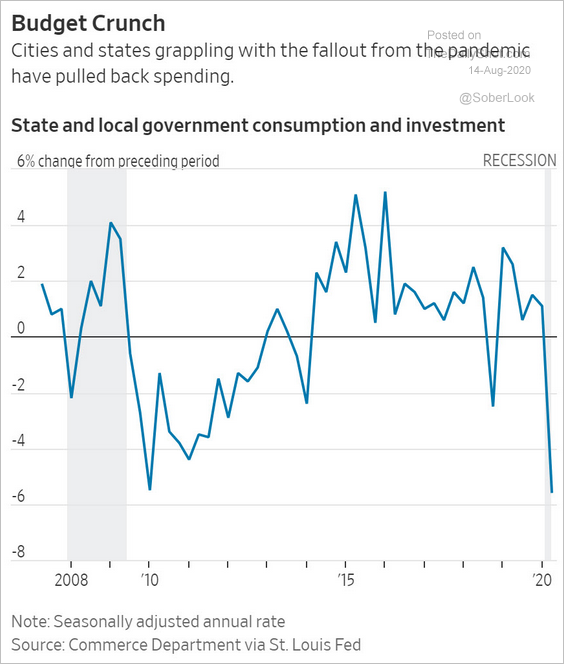 Source: @WSJ Read full article
Rates
1. The $26 billion long-bond auction was a bit “sloppy,” pushing the 30yr yield higher.
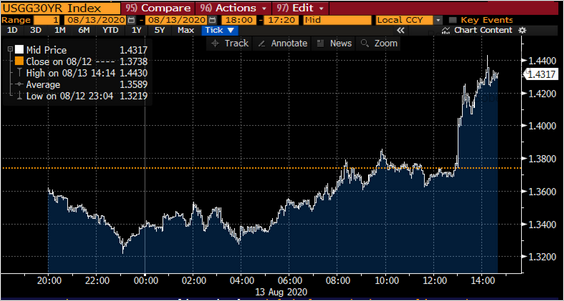 Source: @lisaabramowicz1
2. Here are a couple of technical charts.
• The 10yr Treasury yield:
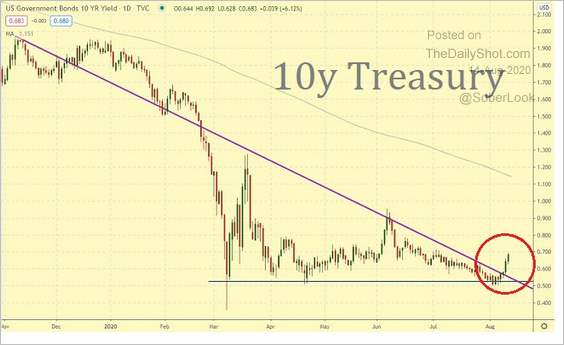 Source: @RMKOutFront
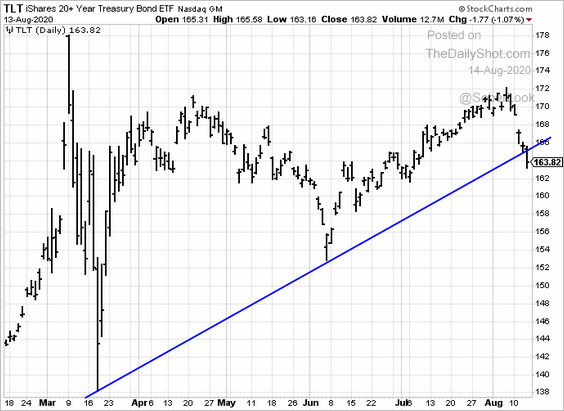
• The iShares 20+ Yr Treasury ETF (TLT):
——————–
3. The market expects rates to remain at or below zero for the next few years.
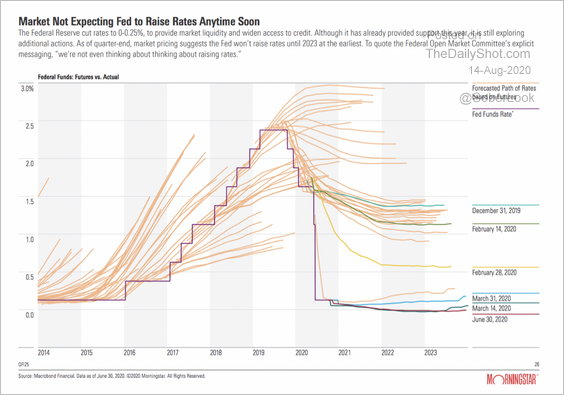 Source: Morningstar
4. This chart shows the divergence between Treasury yields and inflation expectations. The widening gap has pushed real yields deep into negative territory.
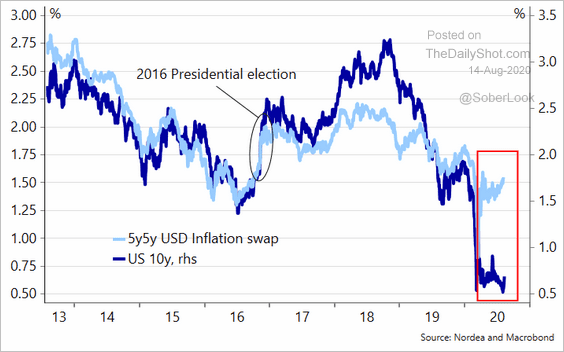 Source: @meremortenlund
5. Below is a breakdown of the US broad money supply.
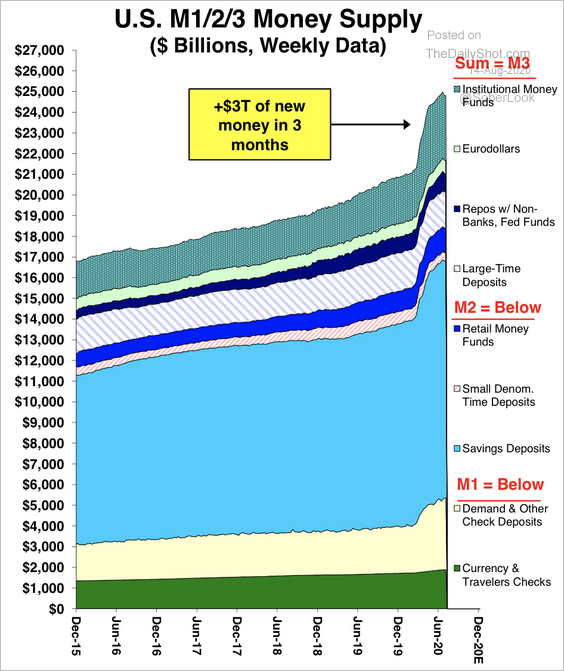 Source: Stifel
Global Developments
1. The July drop in the dollar was hardly unprecedented.
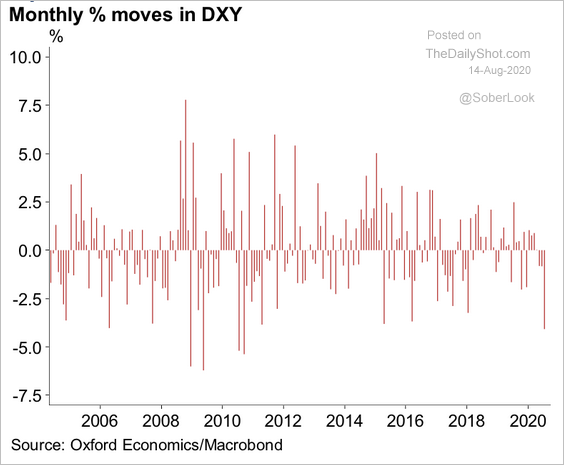 Source: Oxford Economics
2. This chart shows the performance of various asset classes and investment factors during prior periods of dollar weakness.
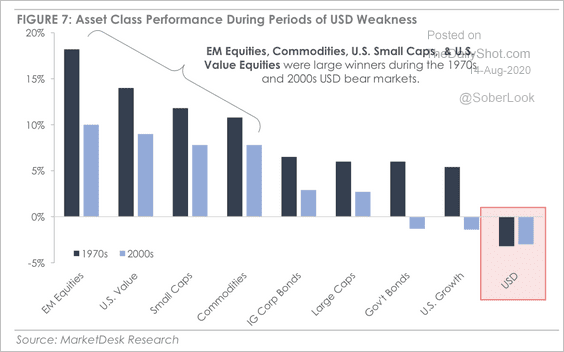 Source: MarketDesk Research
3. The dollar is elevated versus EM currencies.
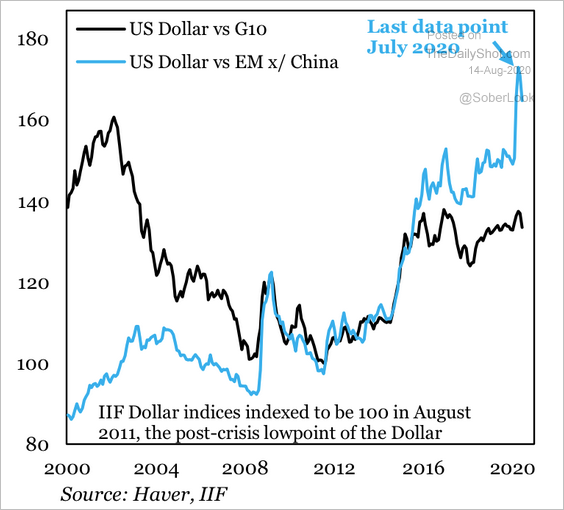 Source: IIF
4. The interest rate differential between the US and international yields is shrinking.
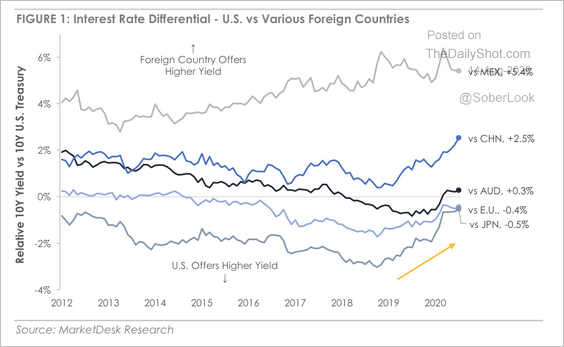 Source: MarketDesk Research
5. Global tech and healthcare stocks have diverged from the rest of the market.
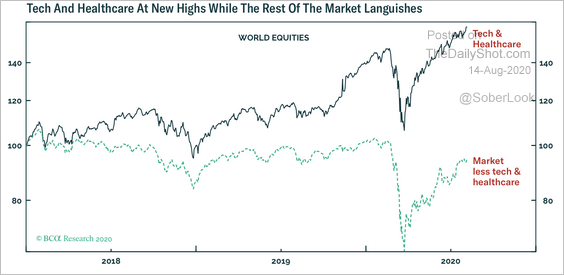 Source: BCA Research
——————–
Food for Thought
1. Online consumer search activity by sector:
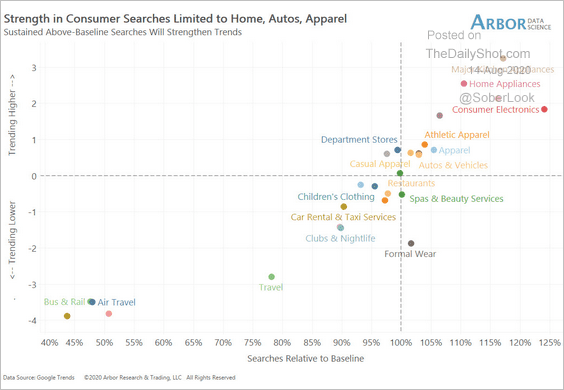 Source: Arbor Research & Trading
2. Tesla’s market value:
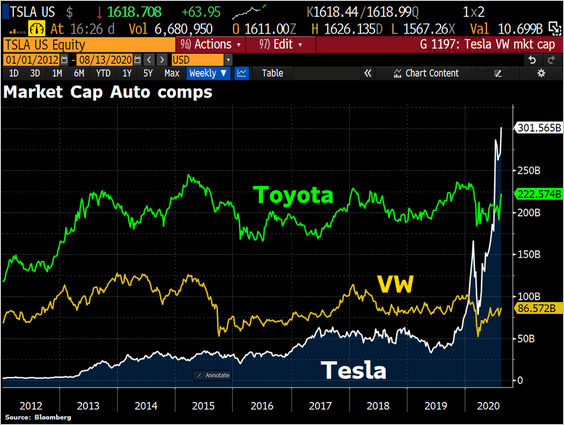 Source: @Schuldensuehner
3. Manhattan apartment rents:
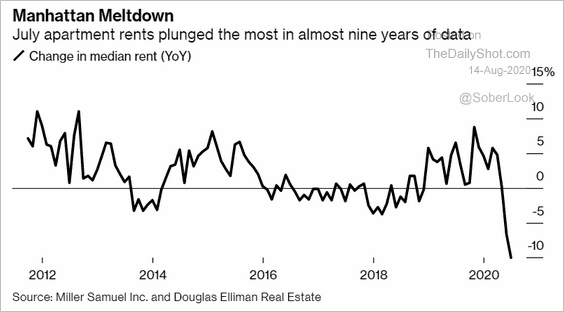 Source: @markets Read full article
4. Herd immunity:
 Source: Statista
5. US public school employment:
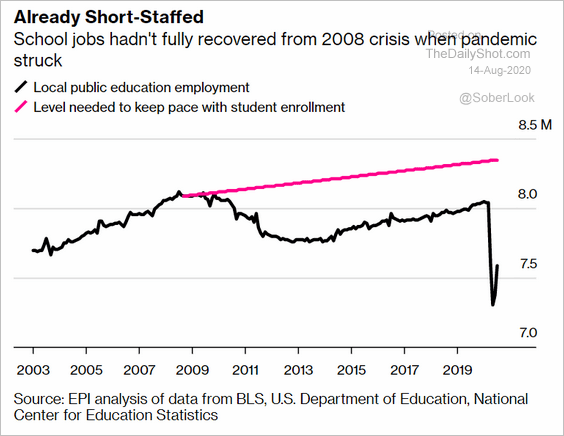 Source: @bpolitics Read full article
6. US labor force participation:
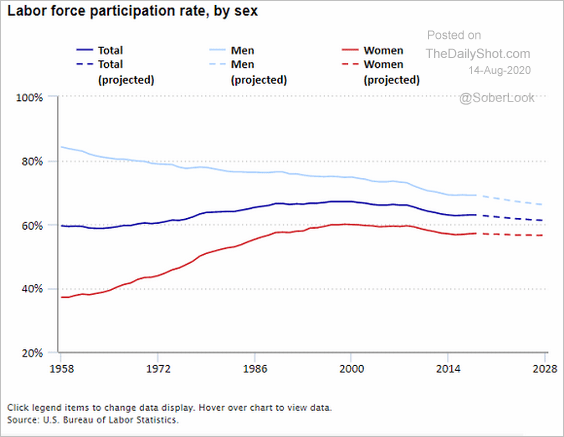 Source: @BLS_gov Read full article
7. The percentage of Americans with a side-hustle, by age:
 Source: @chartrdaily
8. The overall cost of healthcare vs. prescription and nonprescription drugs:
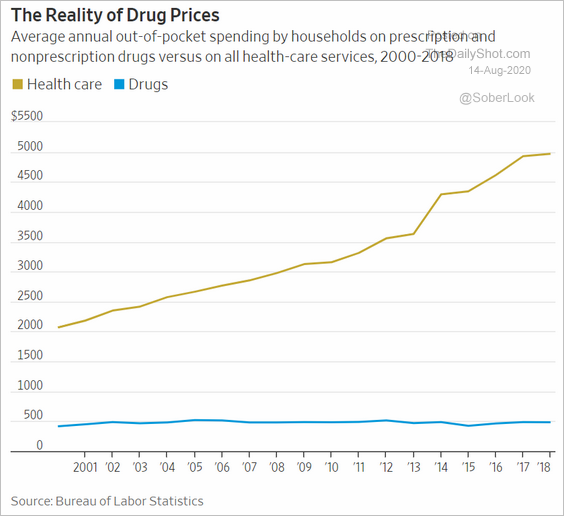 Source: @WSJ Read full article
9. Most popular baby names:
 Source: Nameberry
——————–
Have a great weekend!