
The Daily Shot: 18-Aug-20
• The United States
• Canada
• The United Kingdom
• The Eurozone
• Europe
• Asia – Pacific
• China
• Emerging Markets
• Commodities
• Energy
• Equities
• Global Developments
• Food for Thought
The United States
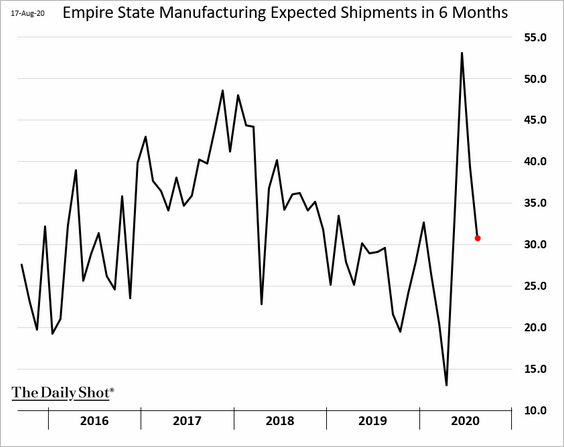
1. The NY Fed’s August regional manufacturing report (Empire Manufacturing) suggests that after the initial backlog-driven rebound, factory activity is running out of steam. To be sure, manufacturing remains in growth mode, but the pace has slowed.
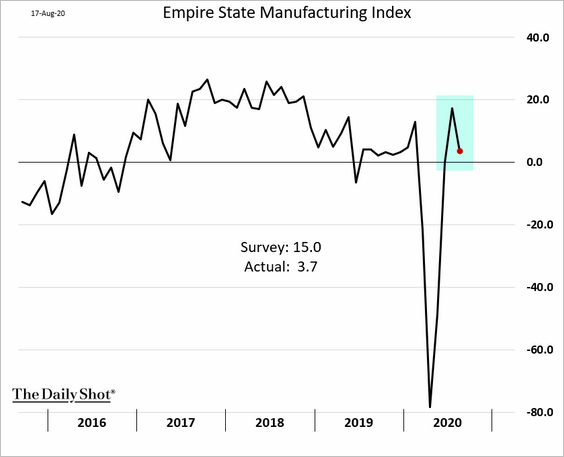
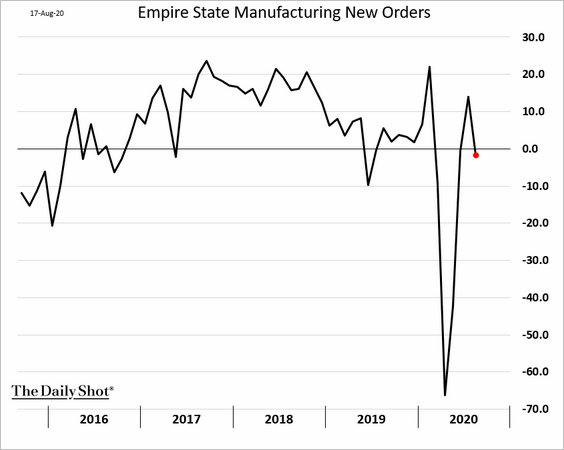
The index of new orders is back in negative territory.
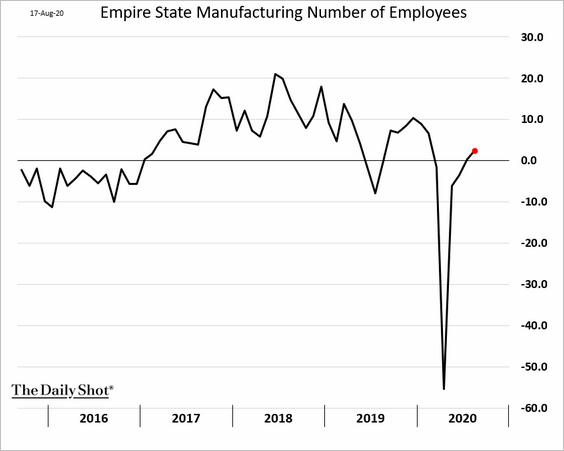
Hiring is still improving.
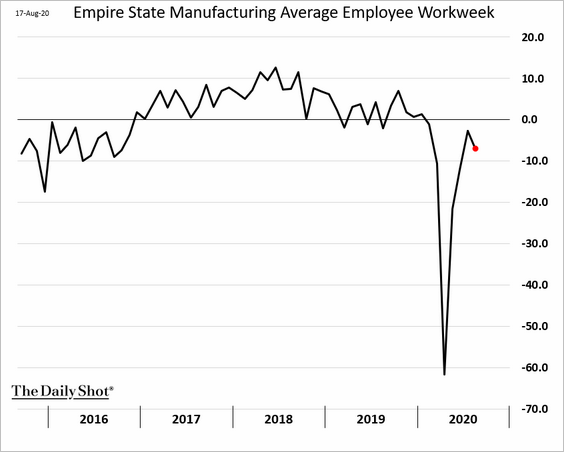
But factories are cutting back workers’ hours again.
Business outlook is less upbeat than it was last month. This chart shows expectations for shipments six months out.
——————–
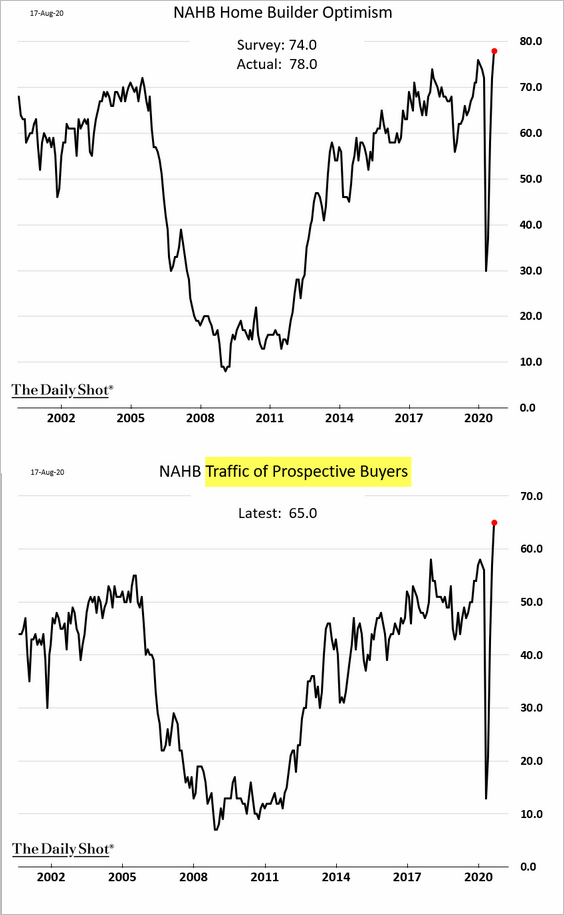
2. Homebuilder optimism is near record levels as demand strengthens.
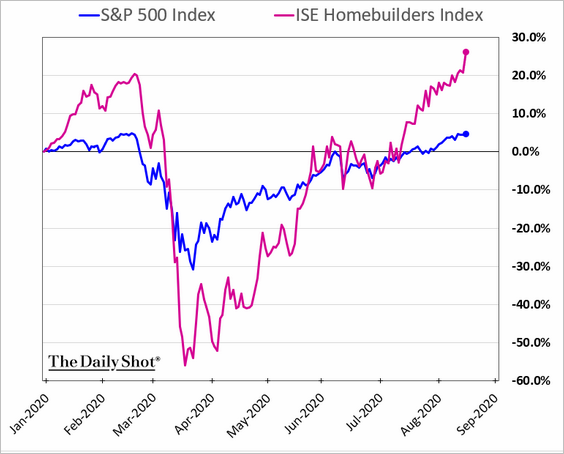
Homebuilder share prices are soaring (chart below), and lumber prices are hitting record highs (see the commodities section).
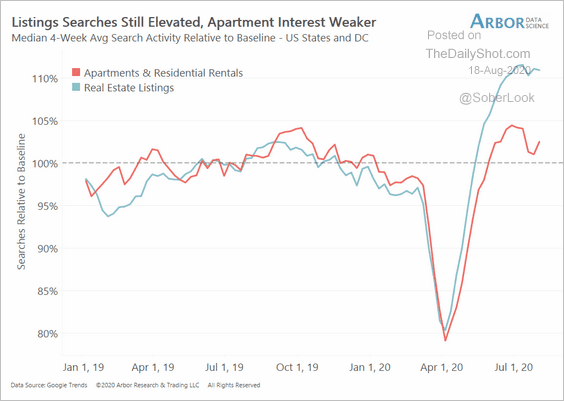
The shift from rentals to homeownership (often from cities to suburbs) is underway. Americans are looking for more room to work and have their children educated at home while reducing exposure to densely populated areas.
• Search activity trends for rentals vs. real estate listings have diverged. Moreover, many of the rental searches are for single-family homes in the suburbs.
 Source: Arbor Research & Trading
• Based on online searches, families have been preparing for virtual classrooms.
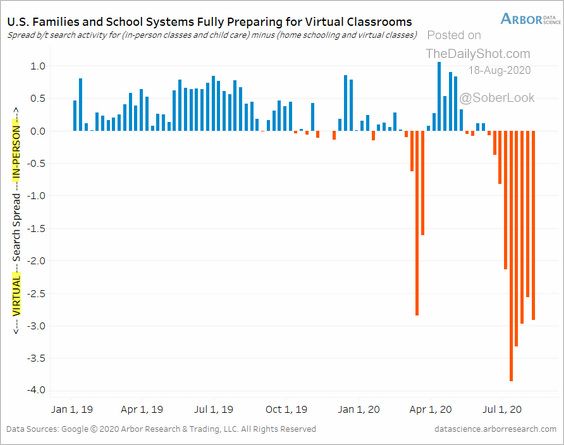 Source: Arbor Research & Trading
• Moving to the suburbs requires a car.
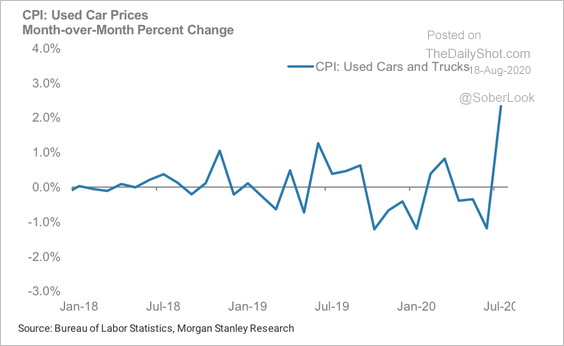 Source: Morgan Stanley Research
——————–
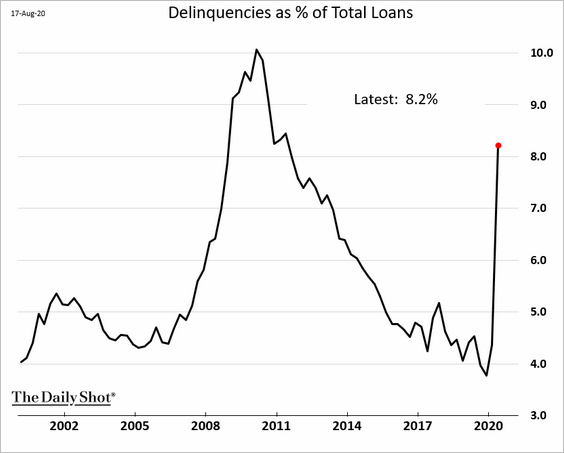
3. Mortgage delinquencies spiked in the second quarter.
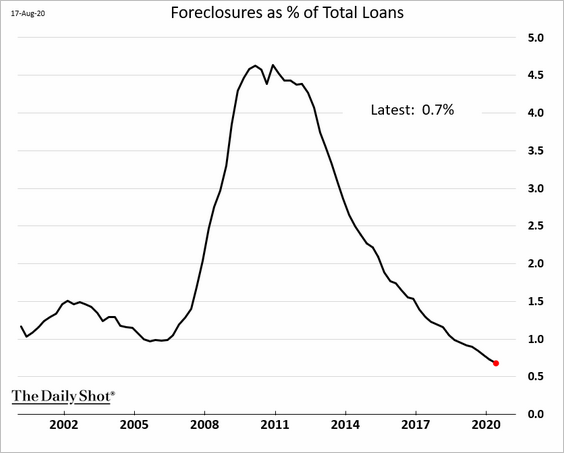
But foreclosures are at record lows due to moratoriums on notices. At some point, this trend will reverse.
——————–
4. Will another CARES package thrust the nation’s budget deficit to a new record?
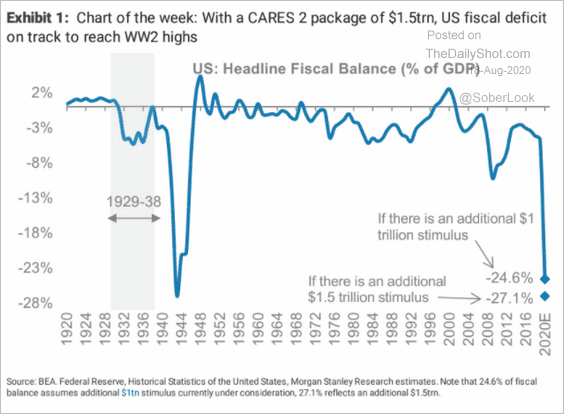 Source: Morgan Stanley Research
Canada
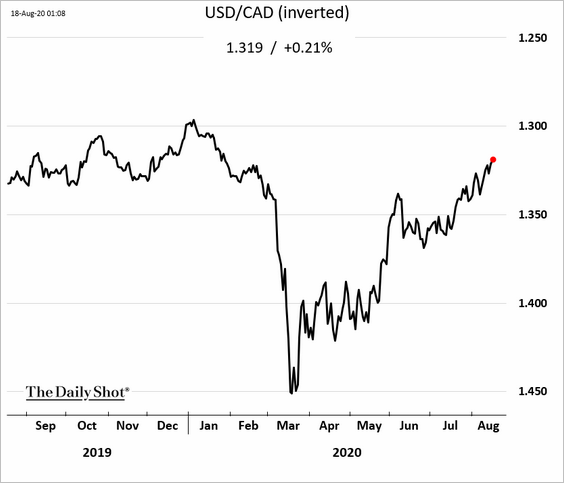
1. The loonie has fully reversed the pandemic losses.
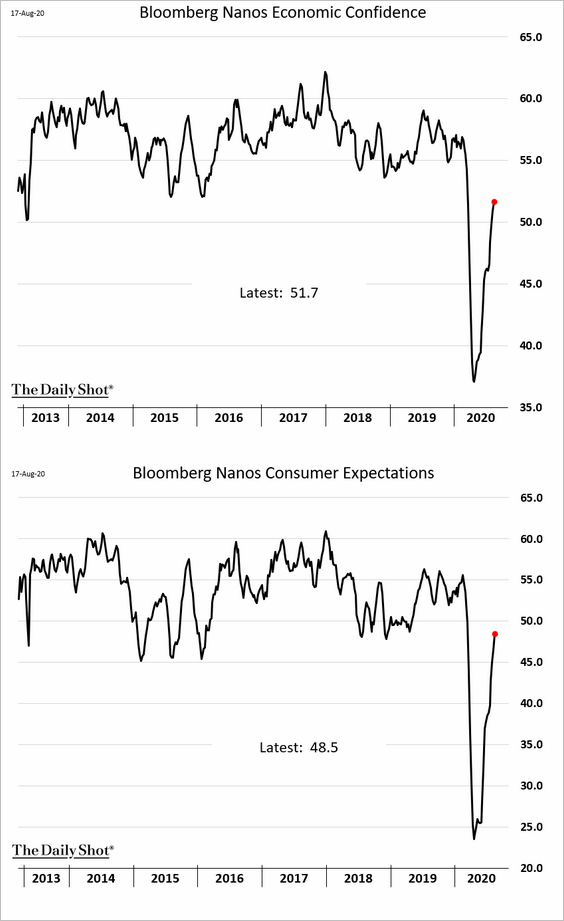
2. Consumer sentiment is recovering quickly.
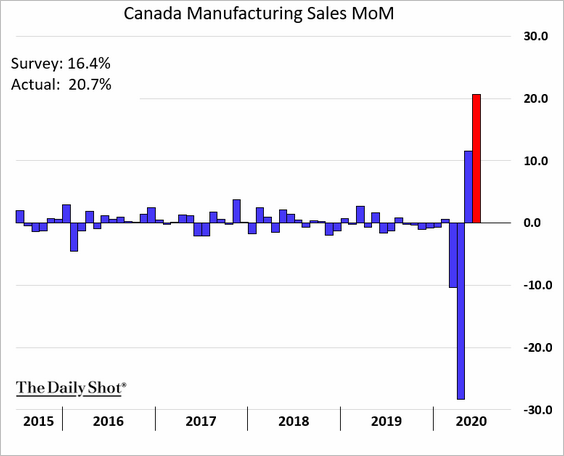
3. Manufacturing sales rose sharply in June.
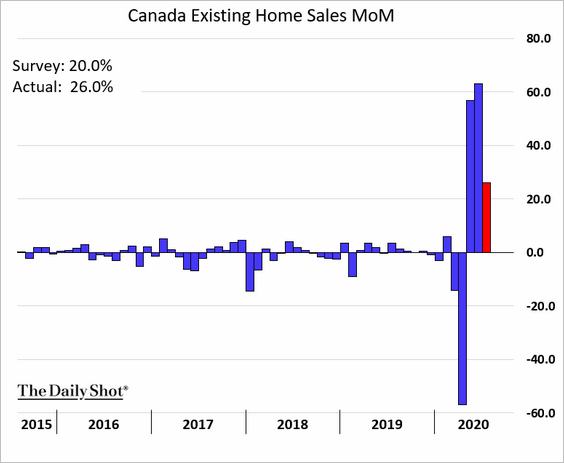
4. Like in the US, the housing market remains robust, with existing home sales climbing 26% last month.
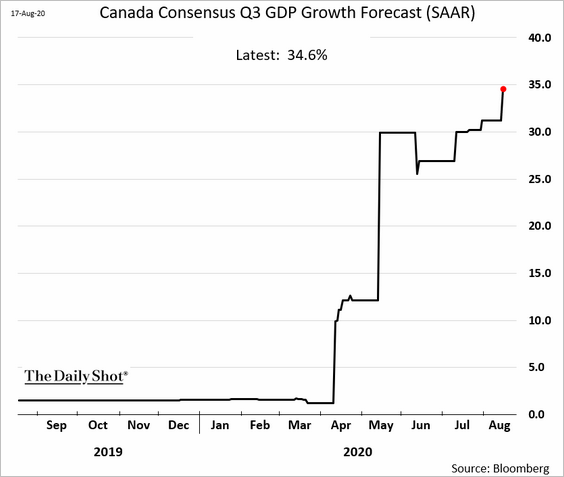
5. Economists now expect Canada’s GDP to rebound by almost 35% (annualized) in Q3.
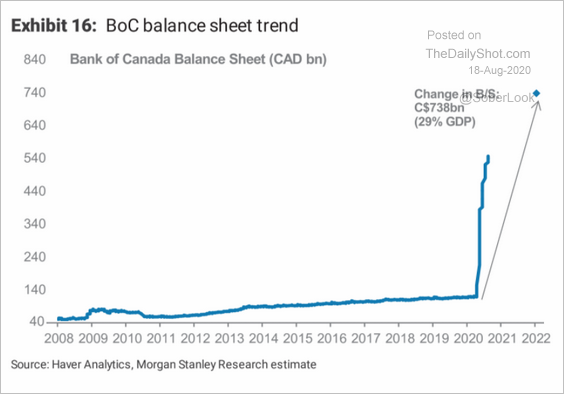
6. Here is Morgan Stanley’s forecast for the BoC’s balance sheet.
 Source: Morgan Stanley Research
The United Kingdom
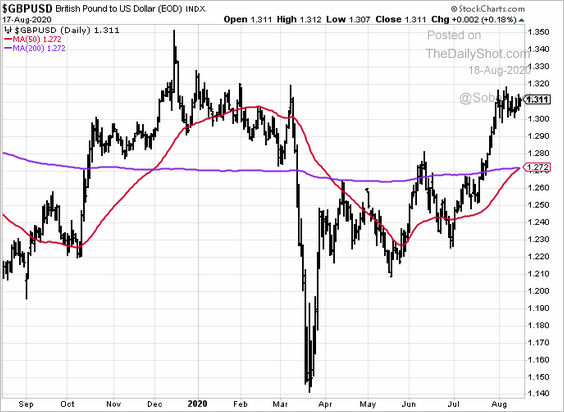
1. The pound has formed a golden cross (a bullish indicator).
 h/t @vkaramanis_fx
2. Morgan Stanley expects a massive boost to the BoE’s QE program.
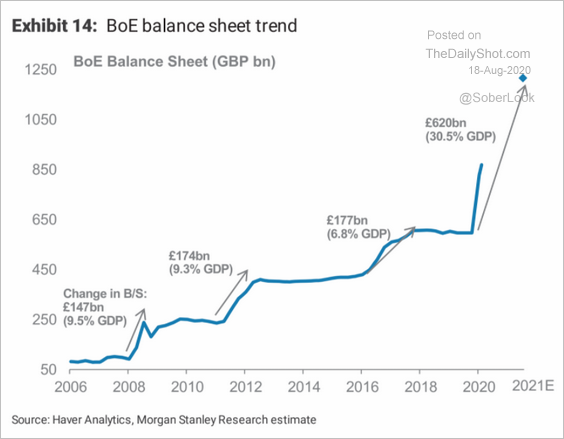 Source: Morgan Stanley Research
The Eurozone
1. Economists are concerned that the rebound is stalling as high-frequency indicators flatten out.
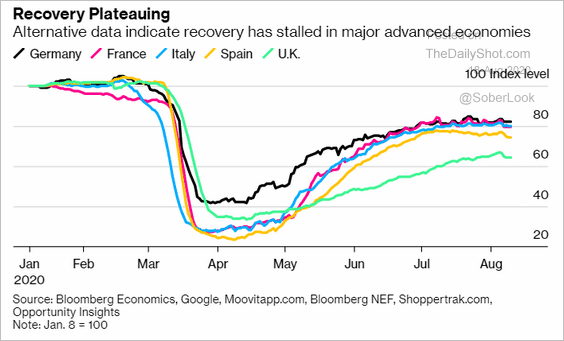 Source: @business Read full article
2. Worried about the economic outlook, euro-area loan officers are tightening credit standards.
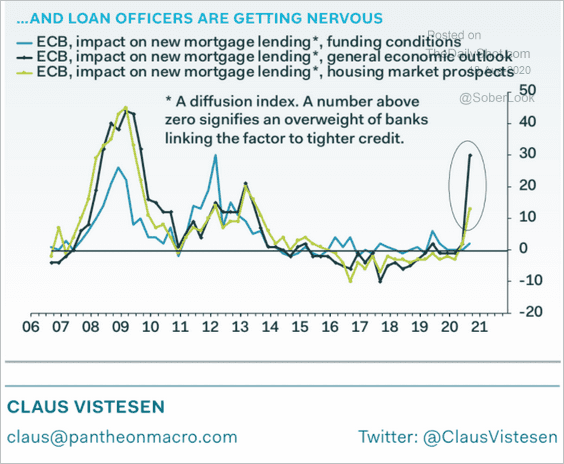 Source: Pantheon Macroeconomics
3. On a price-to-book basis, Eurozone shares look incredibly cheap relative to the US. Part of this trend is the difference in sector composition (the US is more tech-heavy).
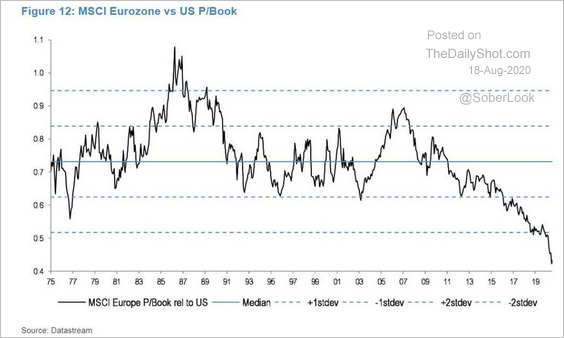 Source: @jsblokland
4. French stocks have underperformed this year.
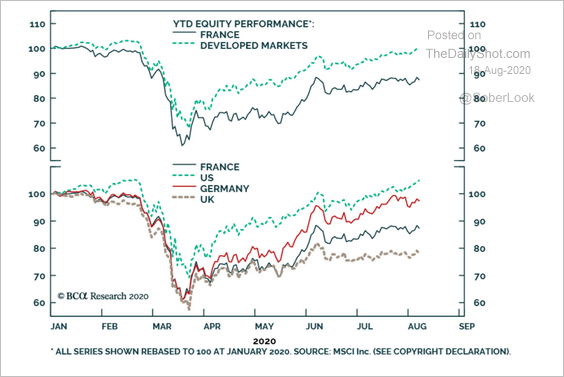 Source: BCA Research
5. The divergence in the US/Eurozone money supply has been unprecedented, which has been powering the euro (there is an oversupply of dollars).
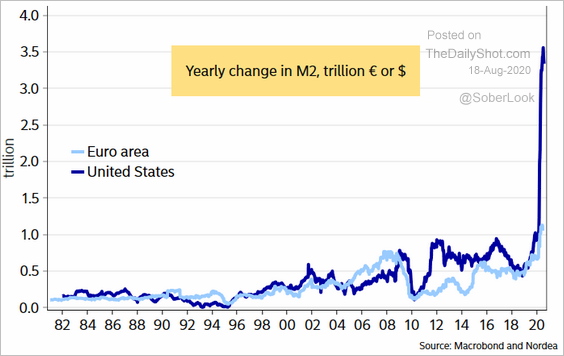 Source: @AndreasSteno
6. Forecasts show euro-area debt-to-GDP ratios climbing sharply.
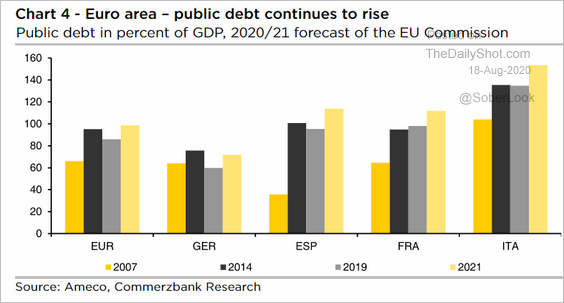 Source: Commerzbank Research
Europe
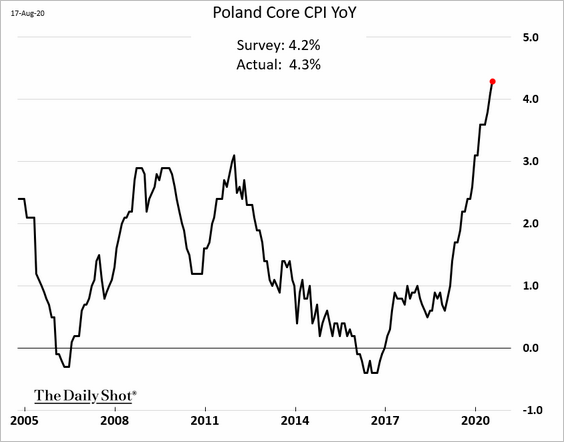
1. Poland’s core inflation hit a multi-year high.
2. USD/NOK (USD vs. Norwegian krone) is approaching its 200-week exponential moving average, as Norway’s currency recovers.
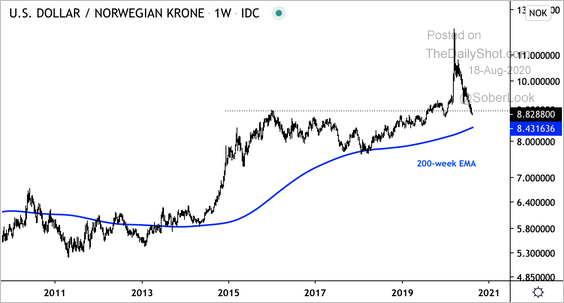 Source: @DantesOutlook
Asia – Pacific
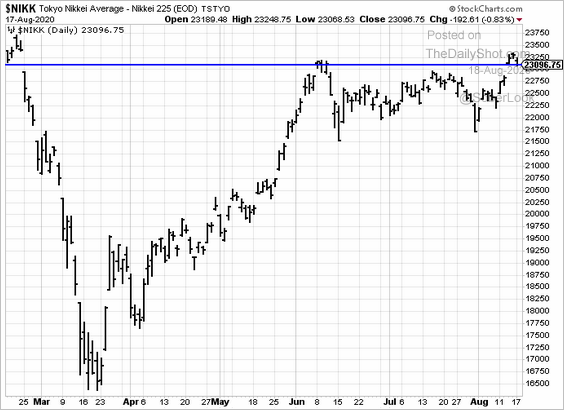
1. Let’s begin with Japan.
• Will the Nikkei break resistance?
• After the Q3 rebound, Pantheon Macroeconomics expects another GDP contraction in Q4.
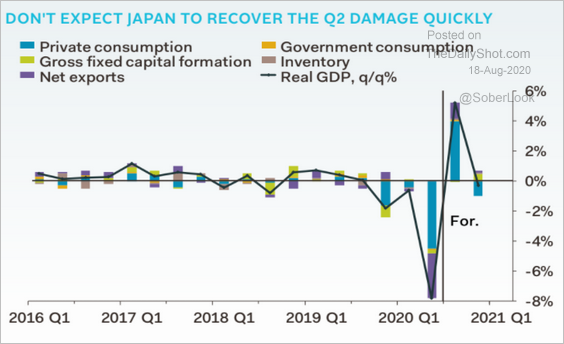 Source: Pantheon Macroeconomics
• This chart shows Morgan Stanley’s estimate for the BoJ’s balance sheet.
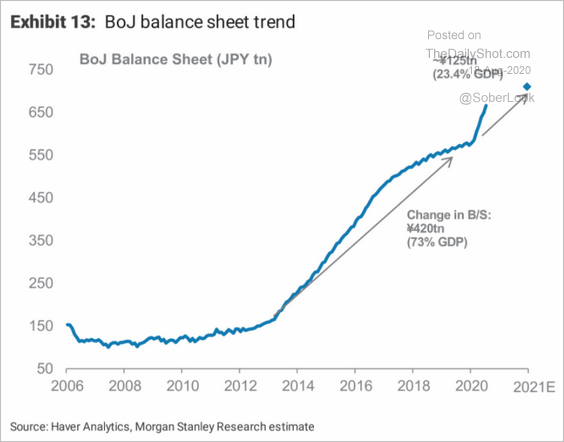 Source: Morgan Stanley Research
——————–
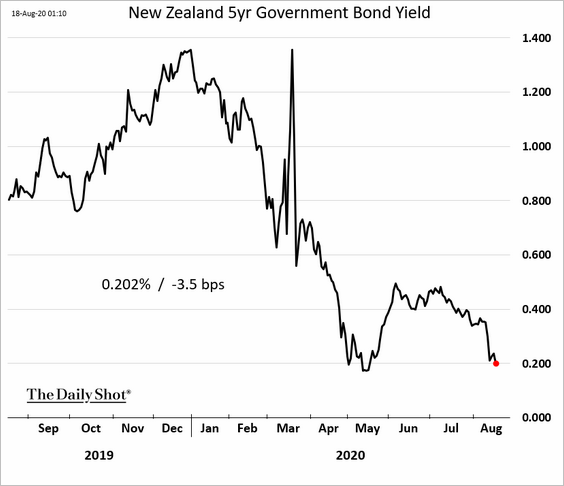
2. New Zealand’s bond yields have declined sharply since the RBNZ’s bond-buying announcement.
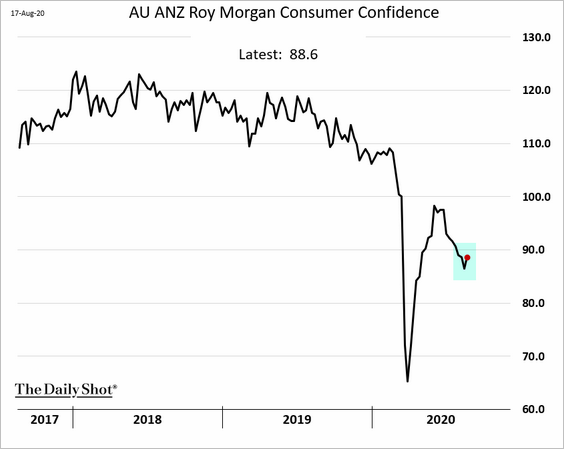
3. Next, we have a couple of updates on Australia.
• Consumer confidence appears to have stabilized.
• This chart shows periods of high correlation between the Aussie dollar and US equities.
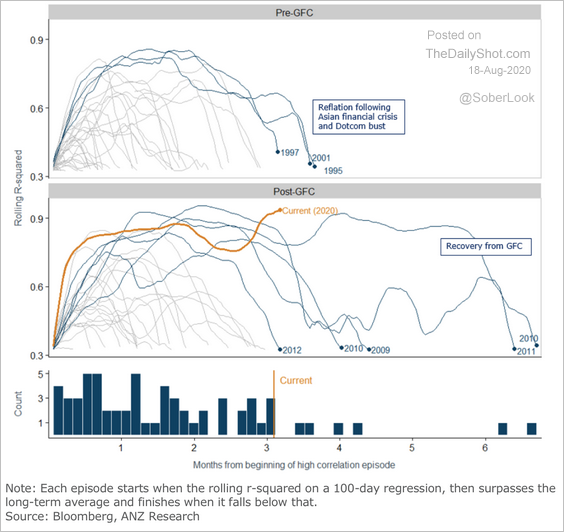 Source: ANZ Research
Currently, the correlation to the S&P 500 is extremely high.
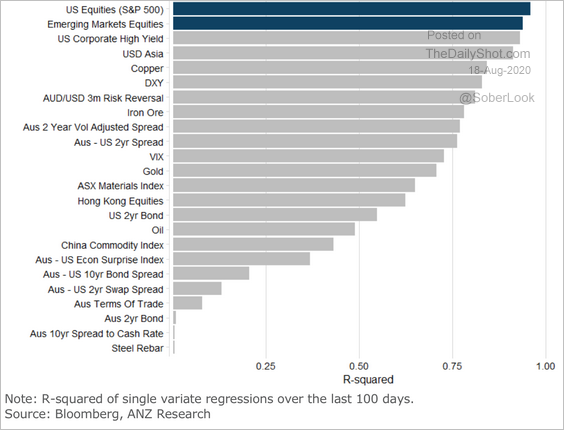 Source: ANZ Research
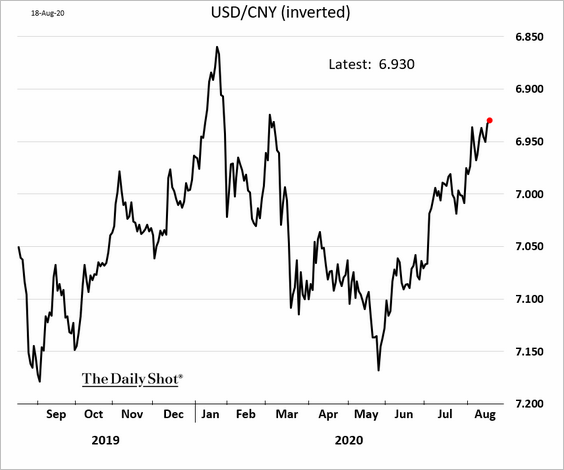
China
1. The renminbi continues to climb, which is more of a weak USD story than the strengthening of China’s currency.
2. China’s trade has held up well relative to the rest of the world.
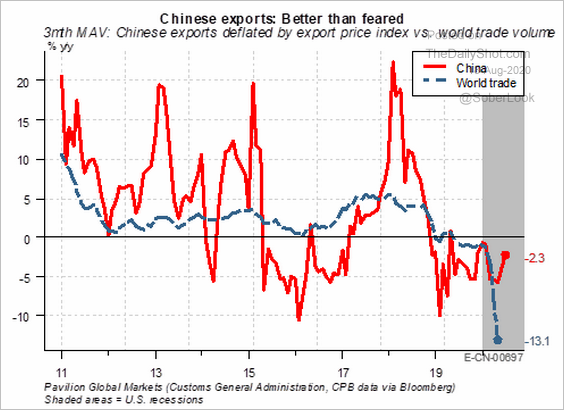 Source: Pavilion Global Markets
And the nation’s growth has outperformed other large economies.
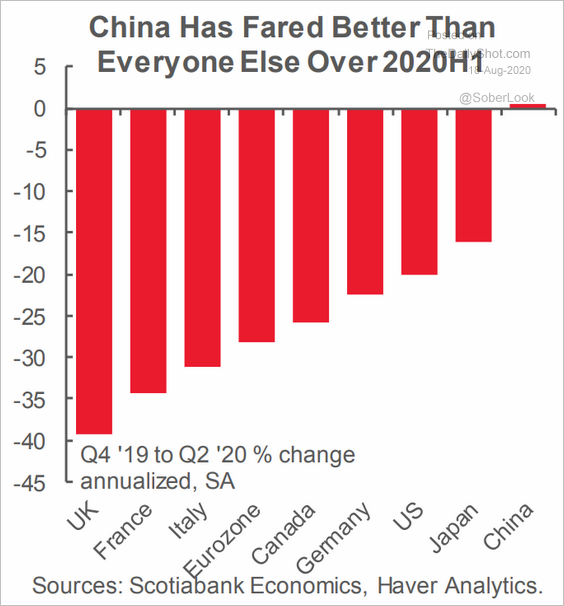 Source: Scotiabank Economics
——————–
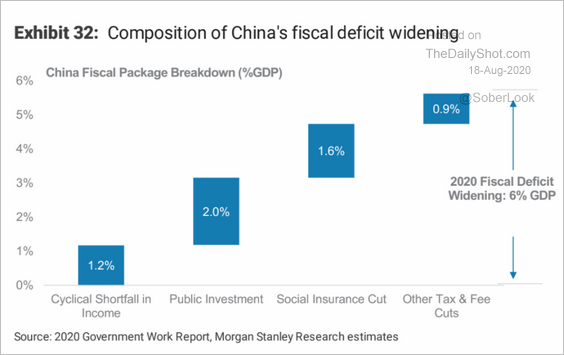
3. This chart shows the contributions to China’s widening fiscal deficit.
 Source: Morgan Stanley Research
4. More US firms are moving operations out of China (but not to the US).
 Source: Statista
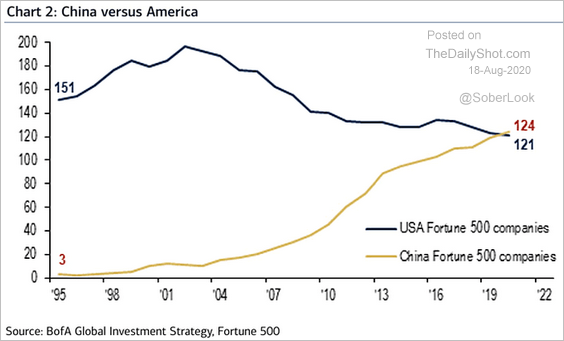
5. China now has more global Fortune 500 companies than the US.
 Source: @ISABELNET_SA, @BofAML
Emerging Markets
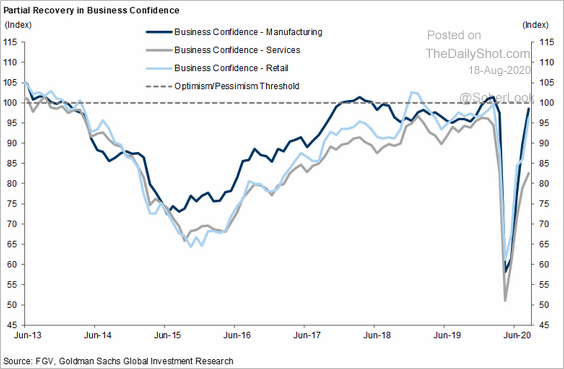
1. Brazil’s business confidence is recovering, but service firms have been lagging.
 Source: Goldman Sachs
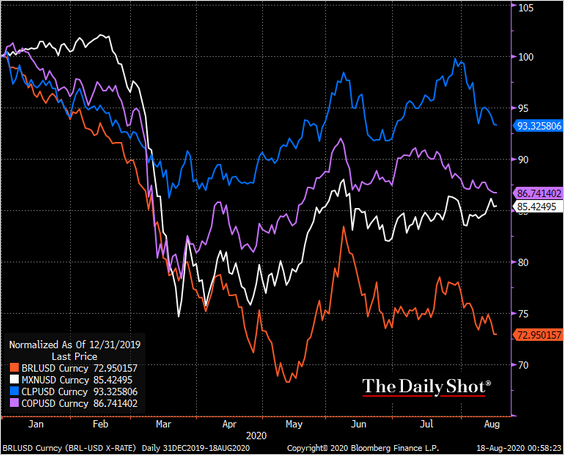
Separately, the Brazilian real has underperformed other LatAm currencies.
 Source: @TheTerminal
——————–
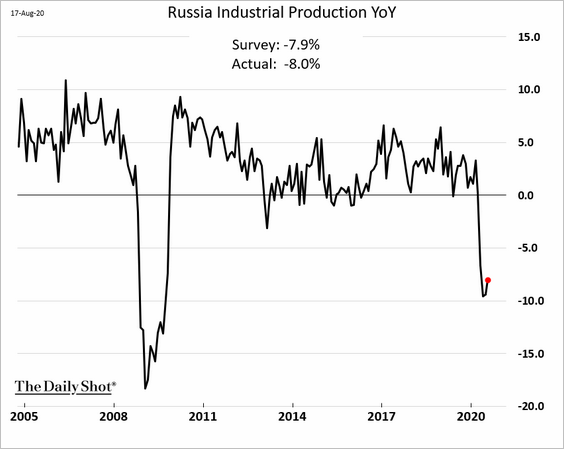
2. Russia’s industrial production hasn’t recovered much from the pandemic lows (the chart is through July).
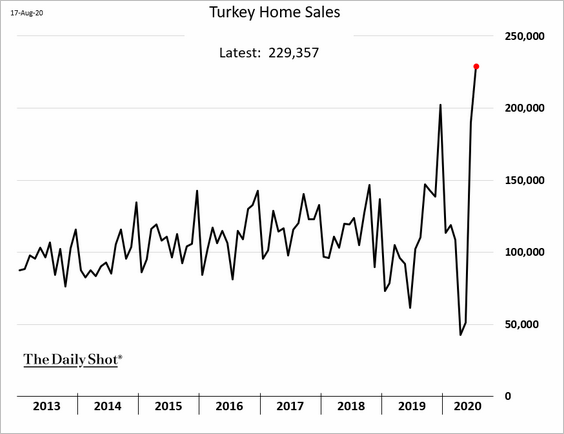
3. Turkey’s home sales hit a record high amid low borrowing costs, foreign demand.
 Source:
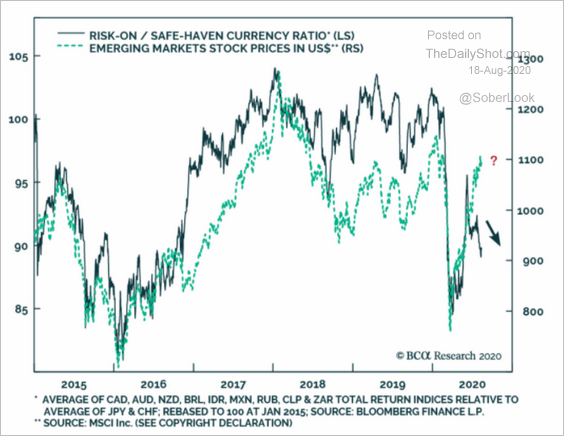
4. The currency market has been much more cautious than EM stocks.
 Source: BCA Research
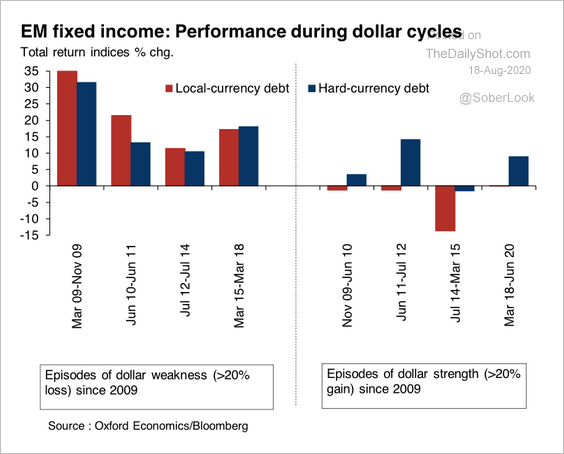
5. Total returns for EM fixed income are considerably higher during episodes of dollar weakness.
 Source: Oxford Economics
Commodities
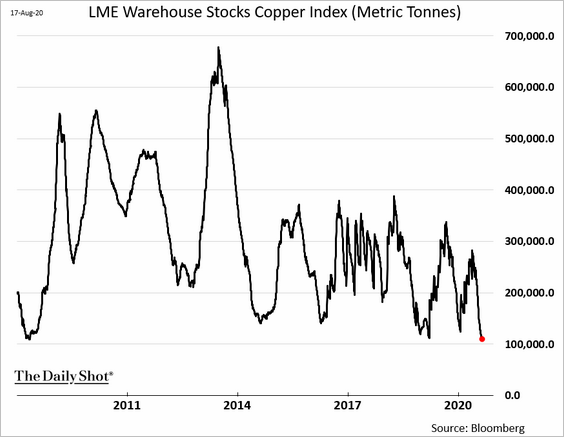
1. LME copper inventories have been running low.
 h/t @mburtonmetals
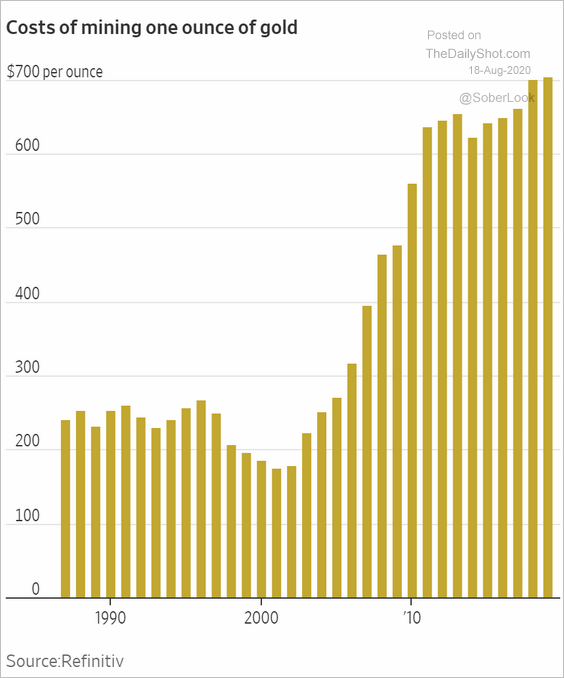
2. The cost of mining gold has risen sharply over the past couple of decades.
 Source: @WSJ Read full article
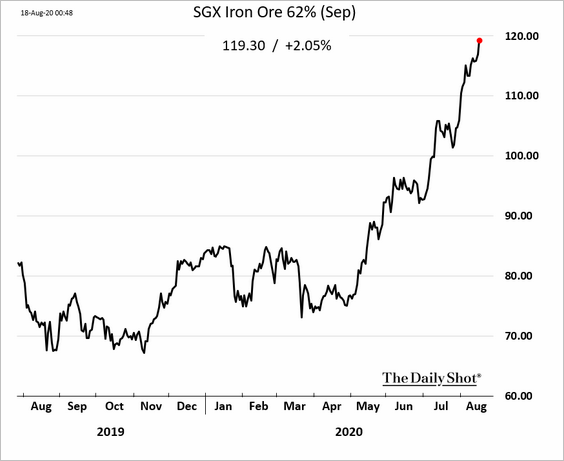
3. Iron ore prices continue to soar.
4. US lumber futures hit another record high.
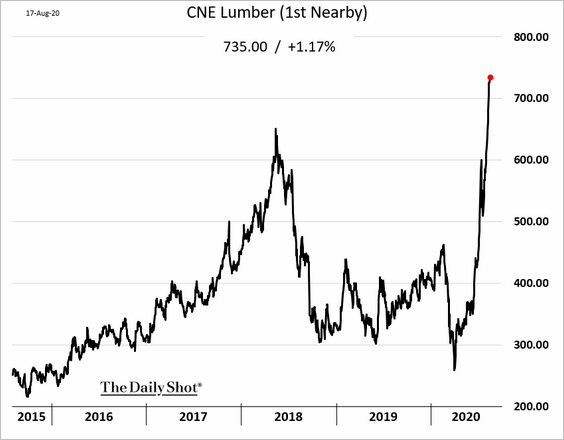
Not only is the market facing a spike in housing demand, but beetle infestations are wiping out timber globally.
 Source: @BloombergQuint Read full article
Energy
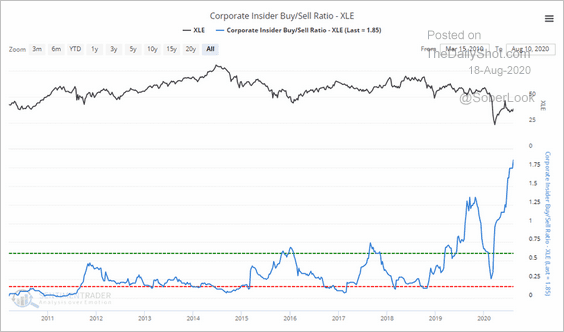
1. Energy-sector insiders have been buying shares.
 Source: @sentimentrader
2. Fitch expects lower refined fuels demand in key EM countries such as India, Mexico, and Brazil.
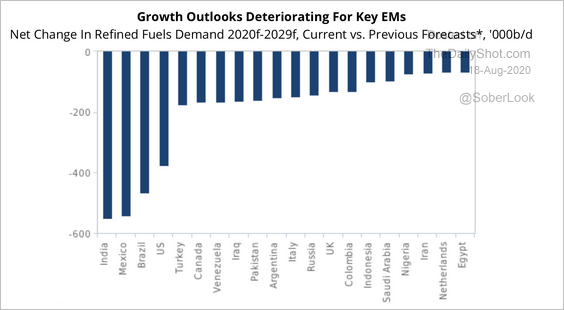 Source: Fitch Solutions Macro Research
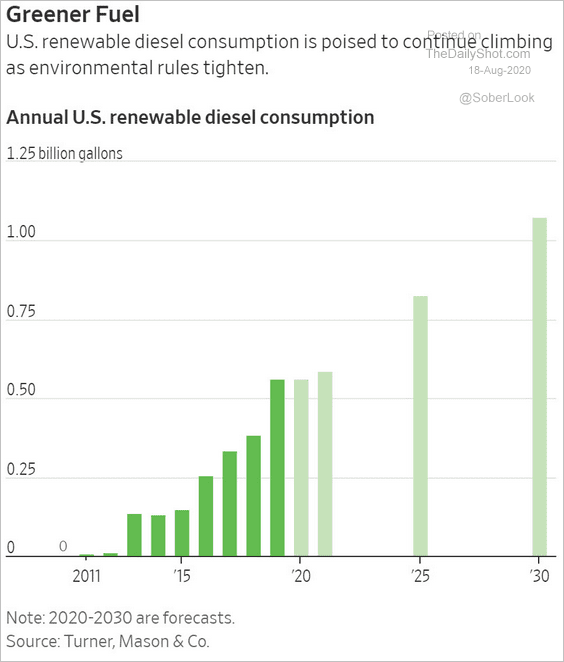
3. Renewable diesel consumption keeps climbing.
 Source: @WSJ Read full article
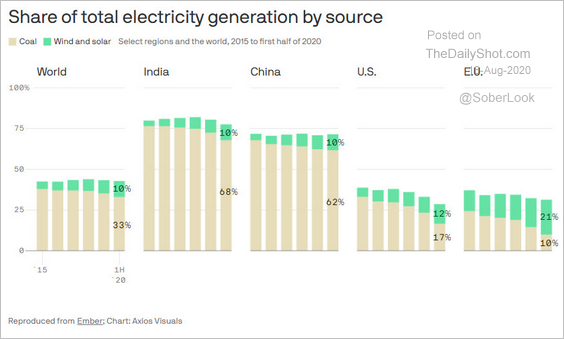
4. Wind and solar market share vs. coal has been rising globally.
 Source: @axios Read full article
Equities
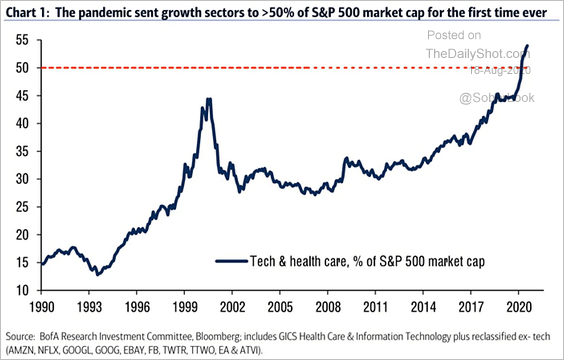
1. Growth sectors are now more than 50% of the S&P 500 market cap.
 Source: @ISABELNET_SA, @BofAML
2. Forecasters expect earnings to rebound sharply next year (2 charts).
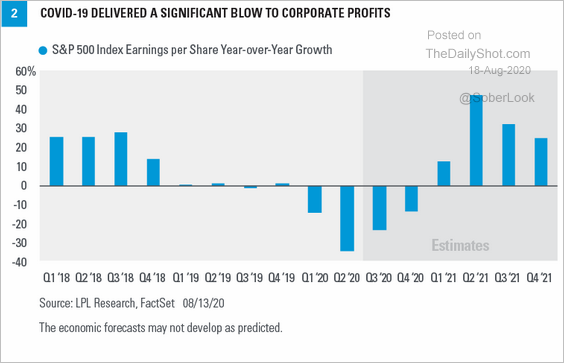 Source: LPL Research
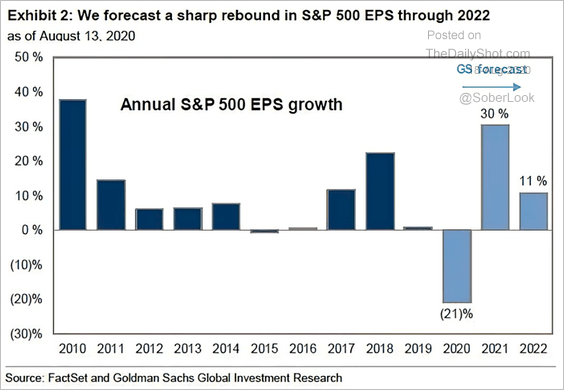 Source: @ISABELNET_SA, @GoldmanSachs
Here are the trajectories of earnings-per-share (EPS) estimates by year.
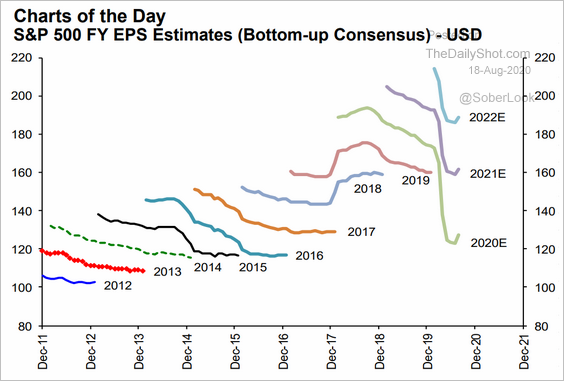 Source: Hugo Ste-Marie, Portfolio & Quantitative Strategy Global Equity Research, Scotia Capital
——————–
3. A double top?
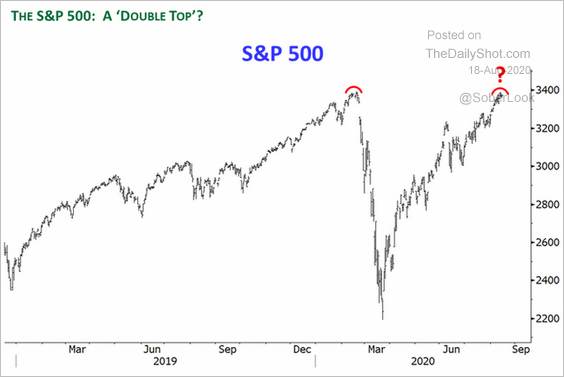 Source: @CarterBWorth
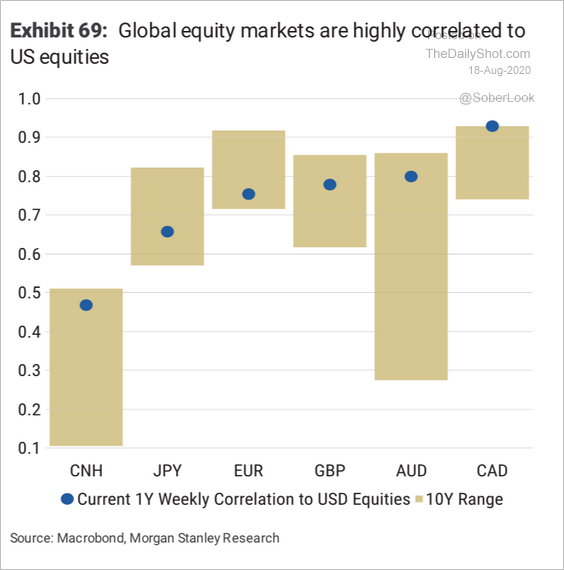
4. Most global markets are highly correlated to the US.
 Source: Morgan Stanley Research
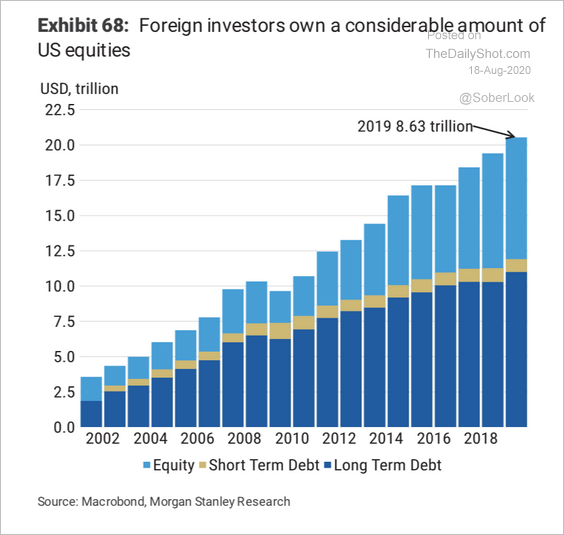
5. Foreign investors sharply increased their holdings of US equities over the past decade.
 Source: Morgan Stanley Research
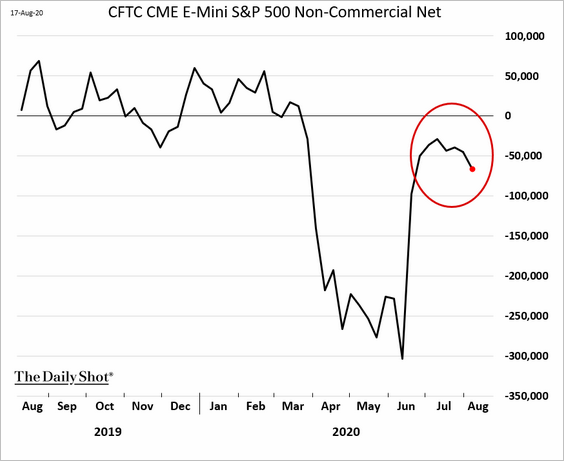
6. Speculative accounts have been cutting back their exposure to US stock futures.
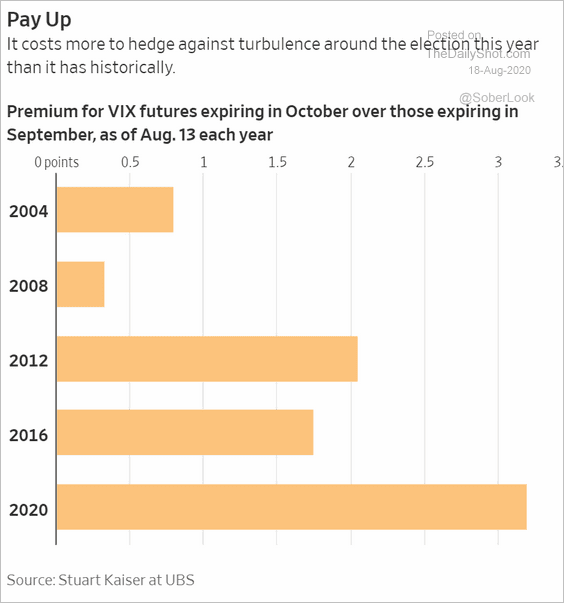
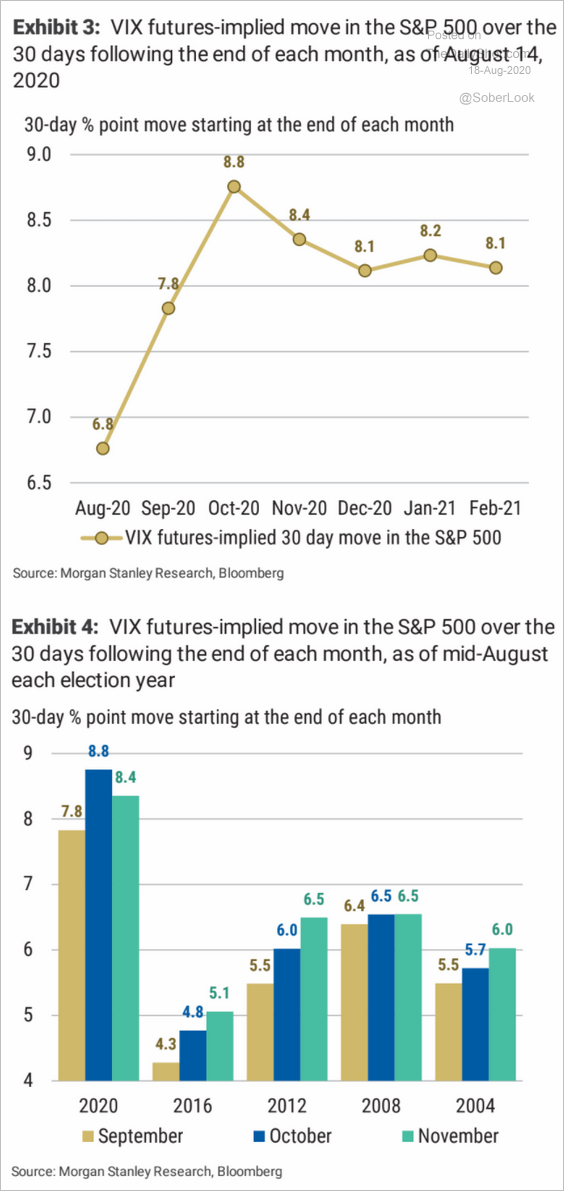
7. The 2020 election premium priced into the volatility markets remains elevated.
 Source: @WSJ Read full article
These charts show the 30-day market moves implied by the VIX futures curve.
 Source: Morgan Stanley Research
——————–
7. Next, we have some sector updates.
• US industrial REIT valuations are stretched, while retail appears relatively cheap.
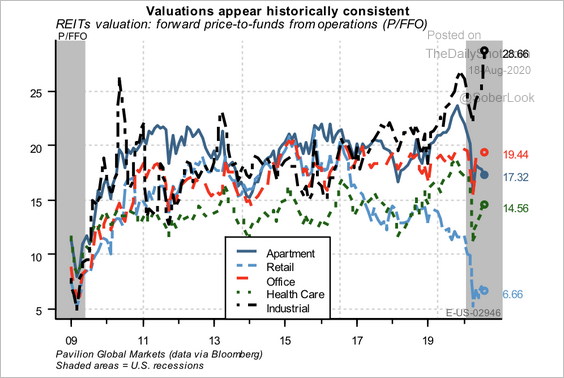 Source: Pavilion Global Markets
A burst of stagflation could create a 1970’s style nightmare for REITs, according to Pavilion Global Markets.
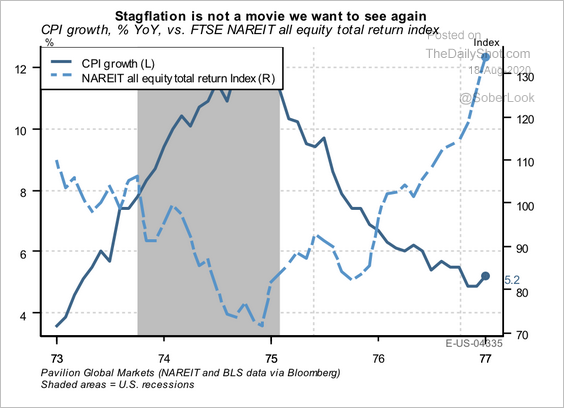 Source: Pavilion Global Markets
——————–
• Healthcare stocks typically underperform ahead of presidential elections.
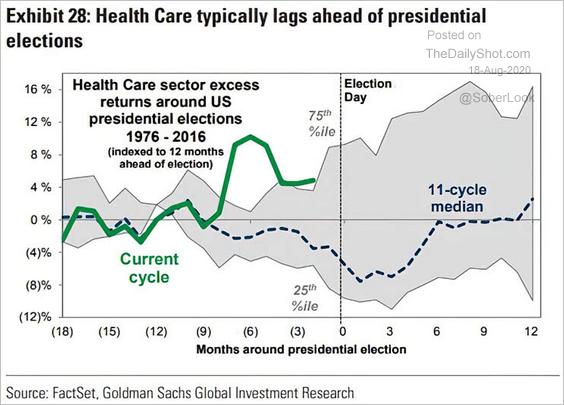 Source: @ISABELNET_SA, @GoldmanSachs
• Consumer discretionary and industrials appear overvalued versus the broader market (2 charts).
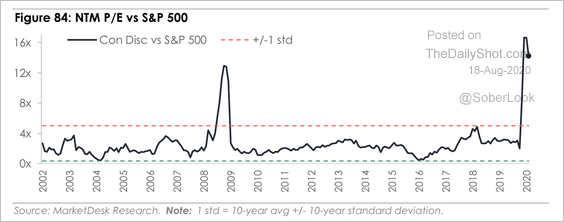 Source: MarketDesk Research
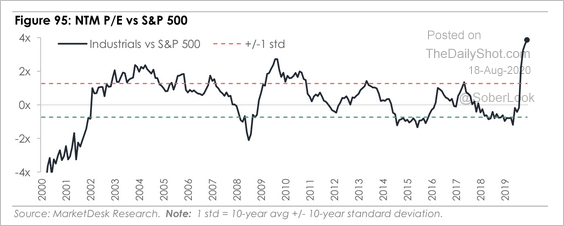 Source: MarketDesk Research
Energy and healthcare are undervalued versus the broader market.
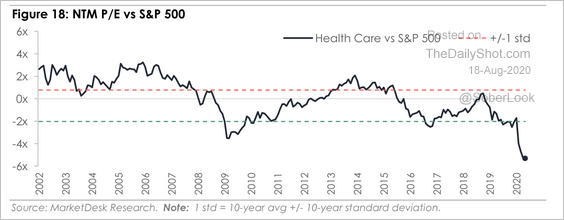 Source: MarketDesk Research
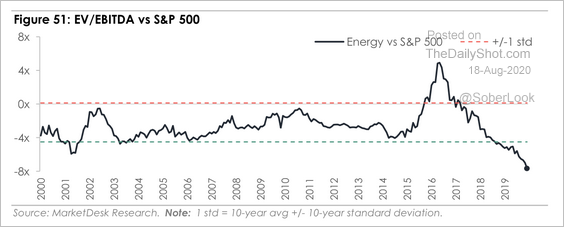 Source: MarketDesk Research
Global Developments
1. Speculative accounts continue to press their bets against the dollar, with leveraged funds driving the latest increase (2 charts).
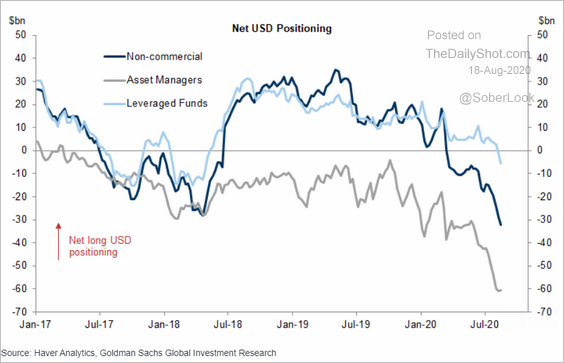 Source: Goldman Sachs
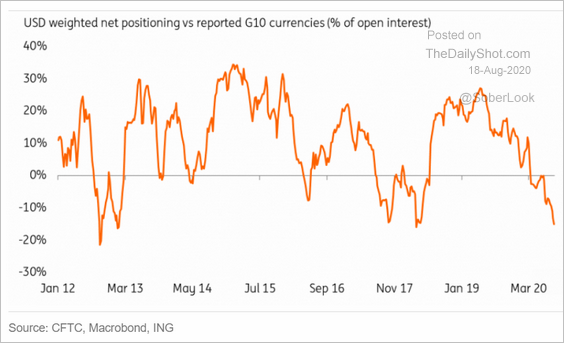 Source: ING
The trade has been working.
——————–
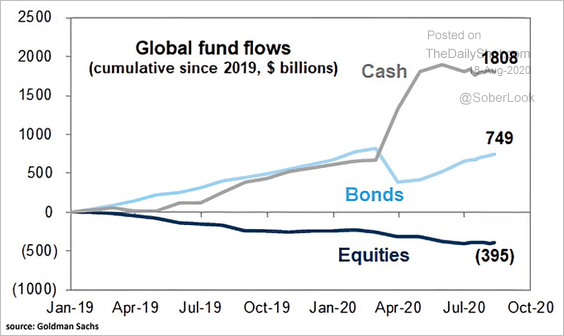
2. Next, we have global fund flows since the start of last year.
 Source: @ISABELNET_SA, @GoldmanSachs
3. Most real rates have been moving lower.
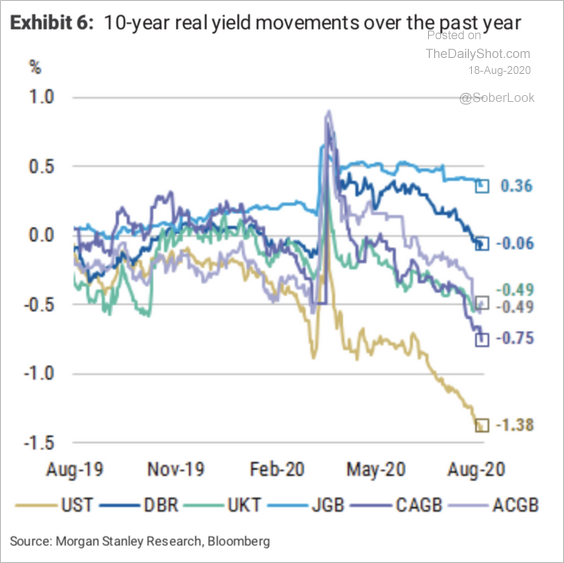 Source: Morgan Stanley Research
4. The recovery Variant Perception’s growth index has stalled.
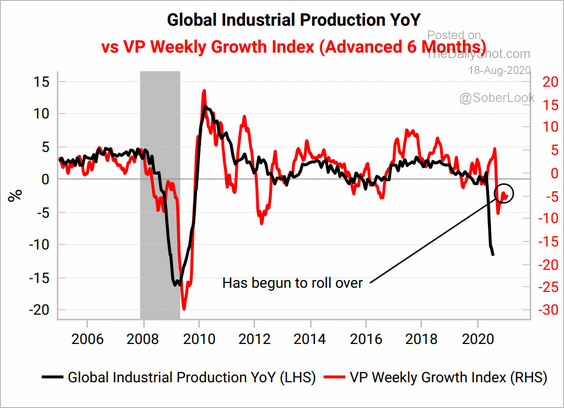 Source: Variant Perception
5. This chart shows the number of quarters of economic growth lost to the pandemic and how far the GDP has been set back.
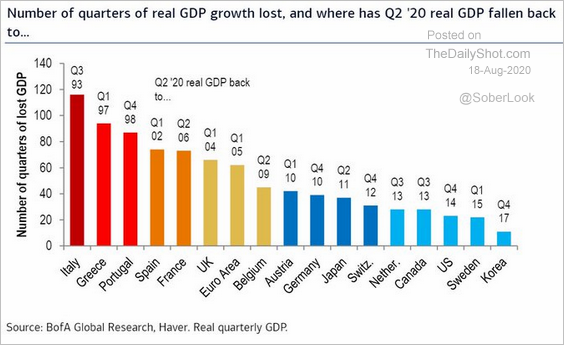 Source: BofA Merrill Lynch Global Research, @jsblokland
——————–
Food for Thought
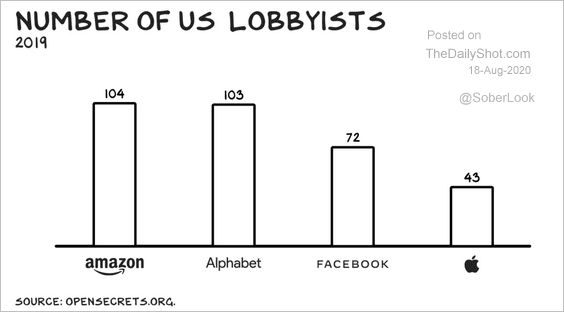
1. Tech lobby (2 charts):
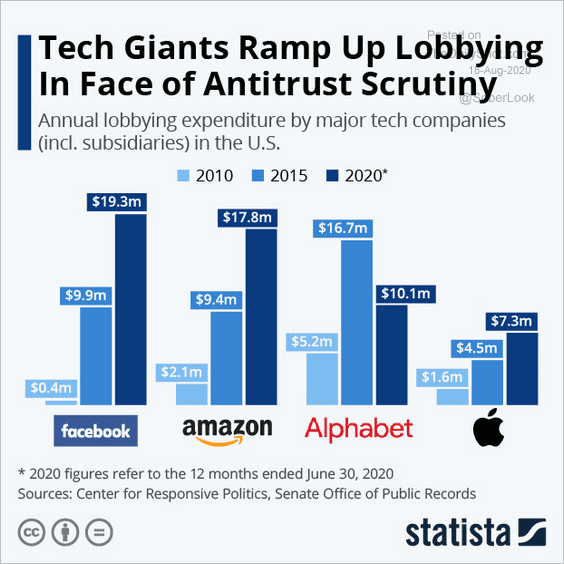 Source: Statista
 Source: @profgalloway Read full article
2. Mobile payment adoption:
• The US:
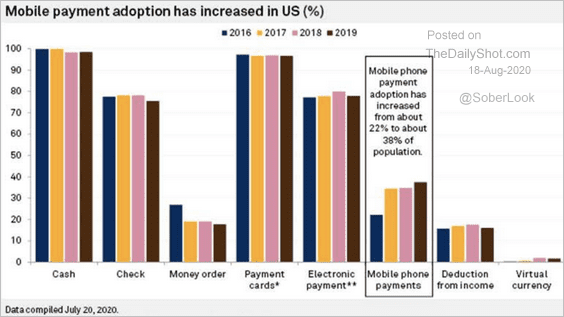 Source: S&P Global Market Intelligence
• Globally:
 Source: Statista
——————–
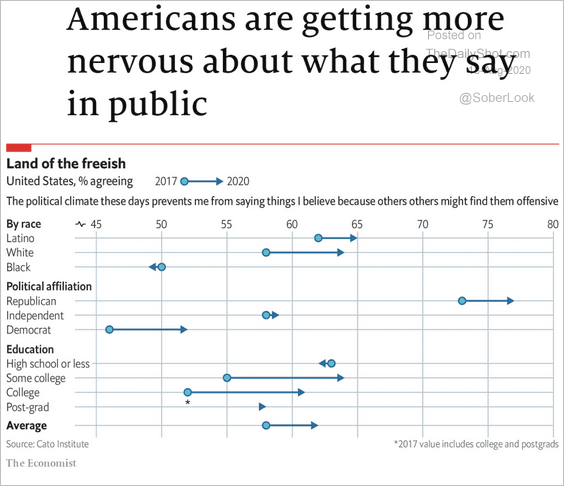
3. Concerns about public expression due to the political climate:
 Source: The Economist Read full article
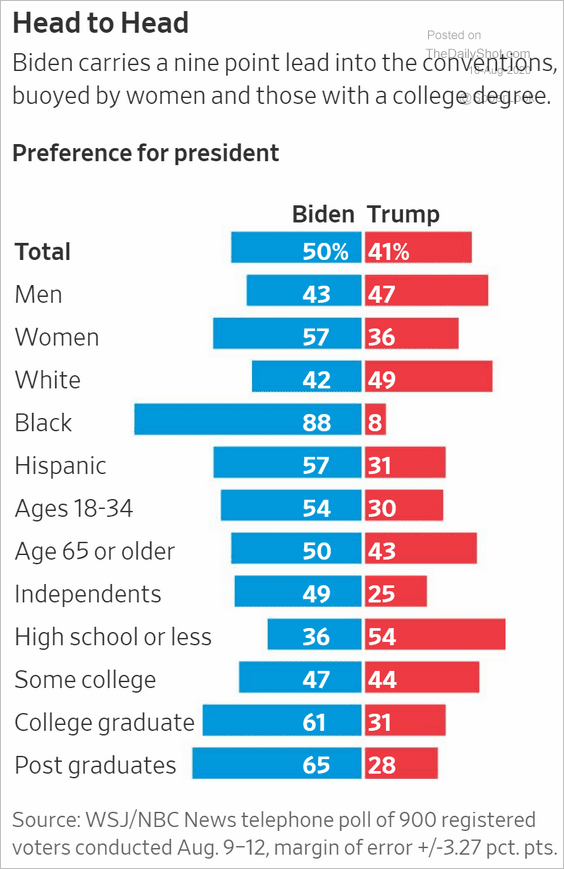
4. The Biden-Trump poll:
 Source: @WSJ Read full article
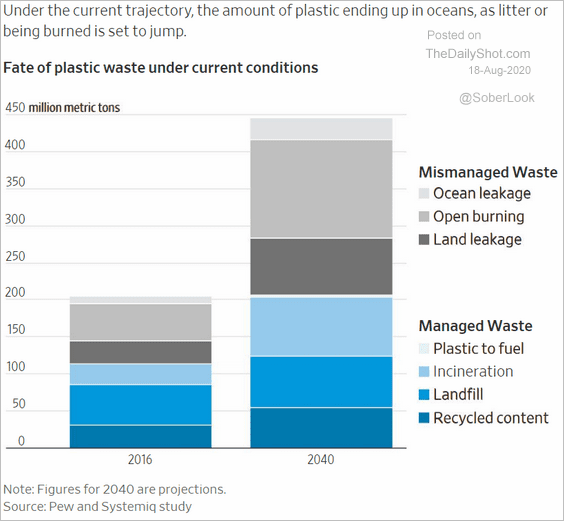
5. What happens to plastic waste?
 Source: @WSJ Read full article
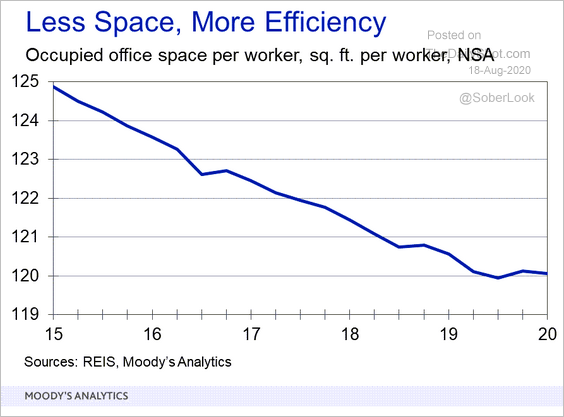
6. Office space per worker over time:
 Source: Moody’s Analytics
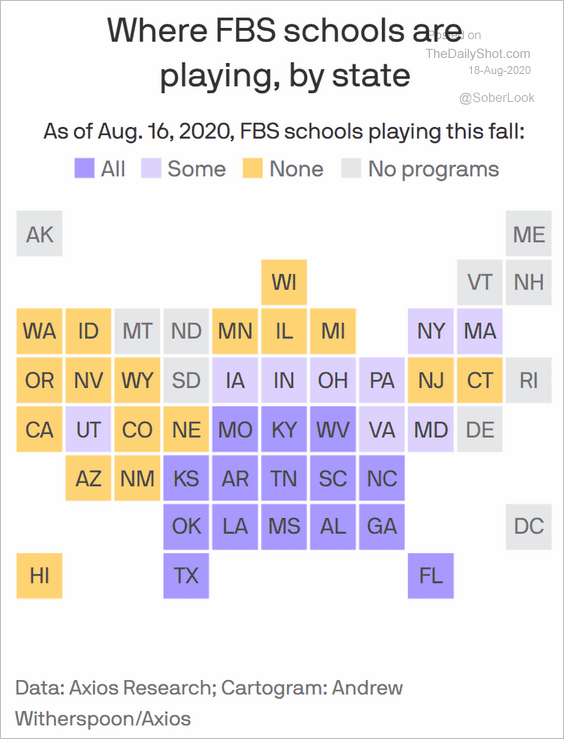
7. The status of college football:
 Source: @axios Read full article
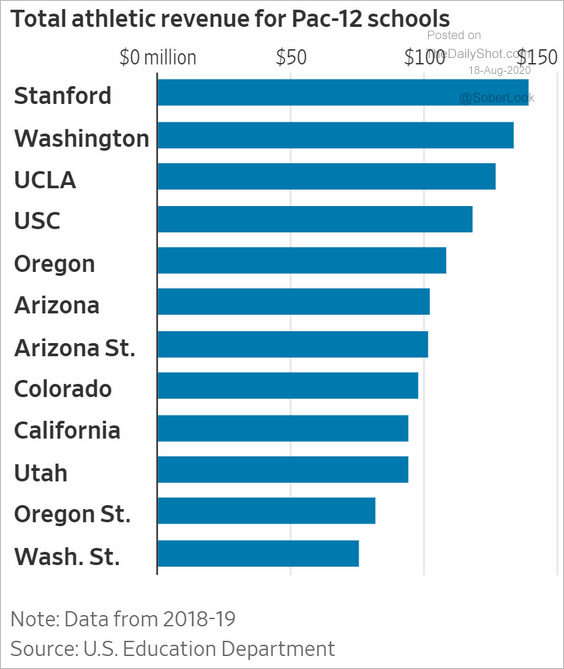
Athletic revenue:
 Source: @WSJ Read full article
——————–
8. Utilization of seafood:
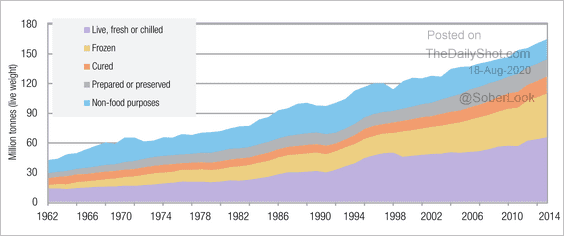 Source: UNCTAD Read full article
9. Most popular coffee drinks:
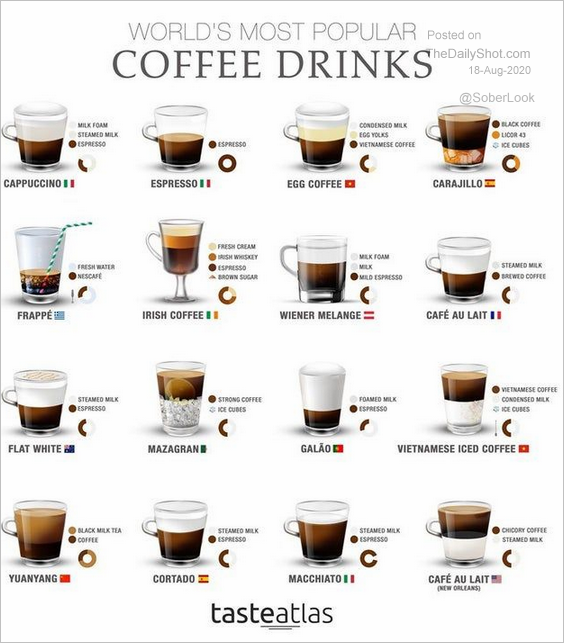 Source: @simongerman600
——————–