The Daily Shot: 27-Oct-20
• Equities
• Alternatives
• Credit
• Rates
• Commodities
• Energy
• Emerging Markets
• China
• Asia – Pacific
• The Eurozone
• The United States
• Food for Thought
Equities
1. Stocks sold off on Monday amid rising COVID threat and stimulus uncertainty. Forecasters now don’t expect to see stimulus legislation before next year.
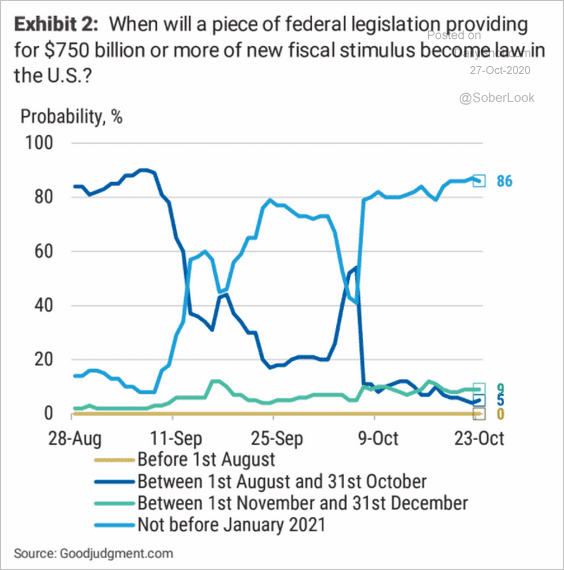 Source: Morgan Stanley Research
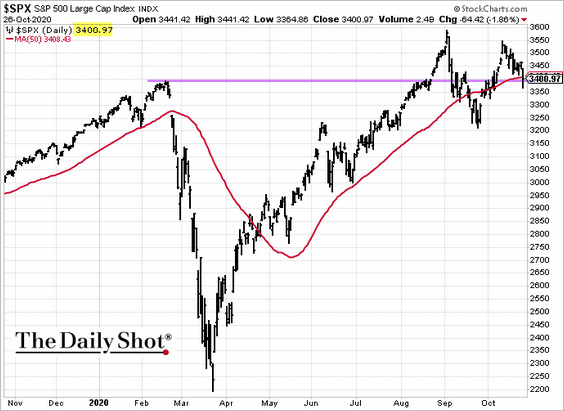
However, the S&P 500 held support at 3400.
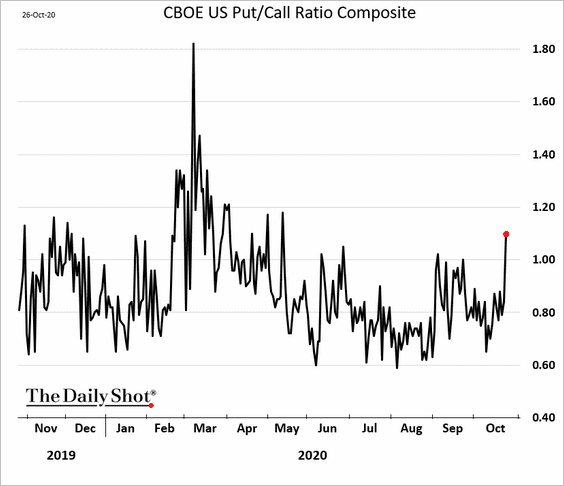
The put/call ratio jumped as investors bought downside protection.
——————–
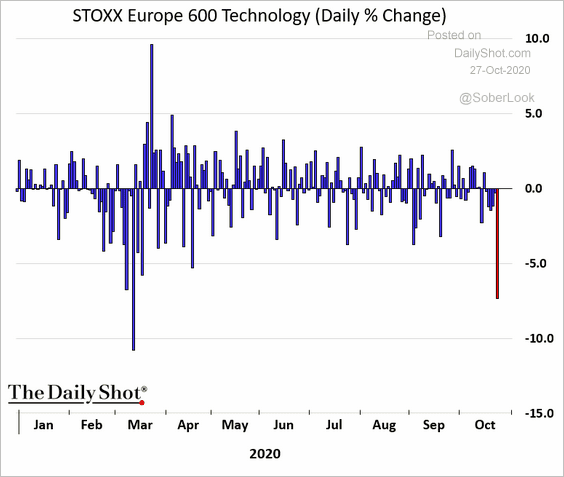
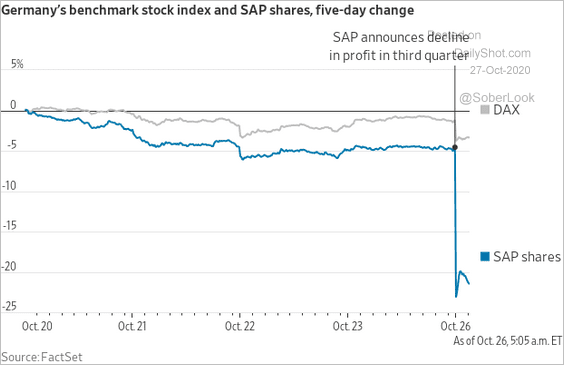
2. European tech shares tumbled, pressured by SAP (2nd chart).
 h/t @_kitrees
 Source: @WSJ Read full article
——————–
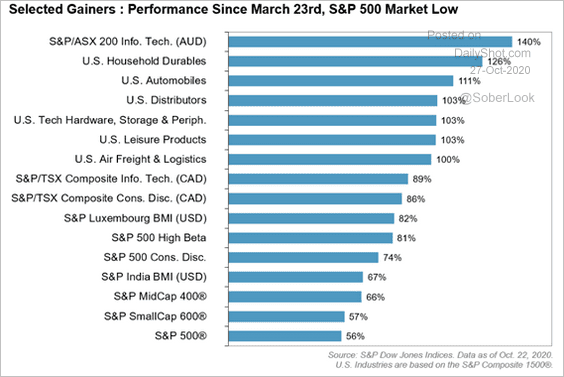
3. This chart shows various sector performances since the March bottom. Australian tech stocks have had a stellar run.
 Source: Chris Bennett; S&P Global
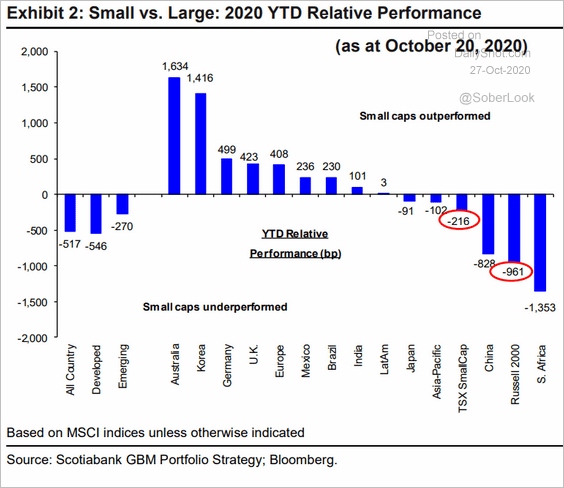
4. How have small caps performed this year globally?
 Source: Hugo Ste-Marie, Portfolio & Quantitative Strategy Global Equity Research, Scotia Capital
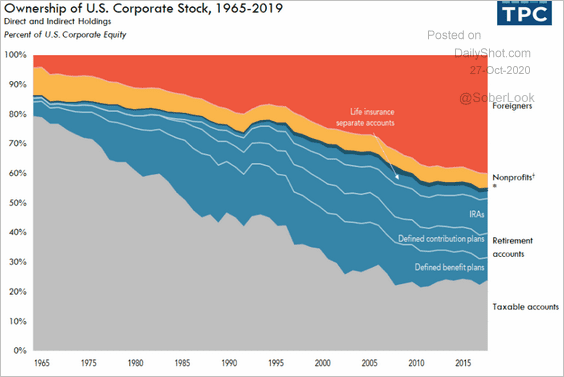
5. Foreign investors’ share of the US market has been rising.
 Source: @urbaninstitute, @TaxPolicyCenter Read full article
6. The recent value factor underperformance has been the steepest in two centuries.
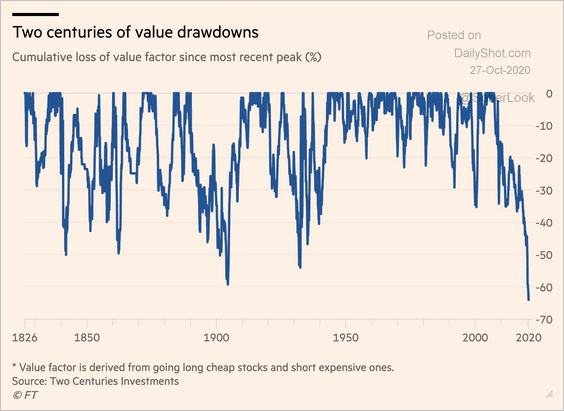 Source: @jessefelder, @FT Read full article
7. How did the US market perform through the presidential cycle going back to 1872?
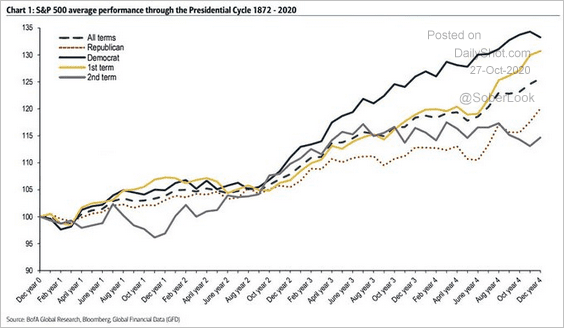 Source: @ISABELNET_SA, @BofAML
This chart shows global equity fund flows around US elections.
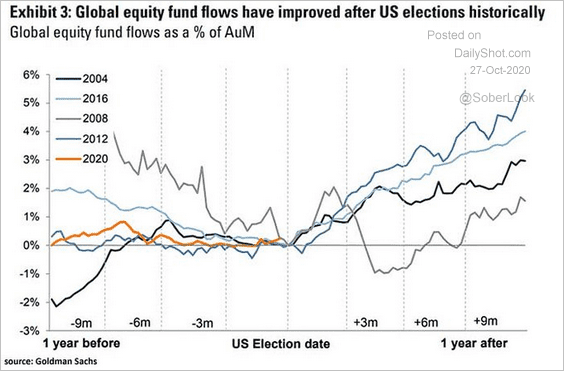 Source: @ISABELNET_SA, @GoldmanSachs
——————–
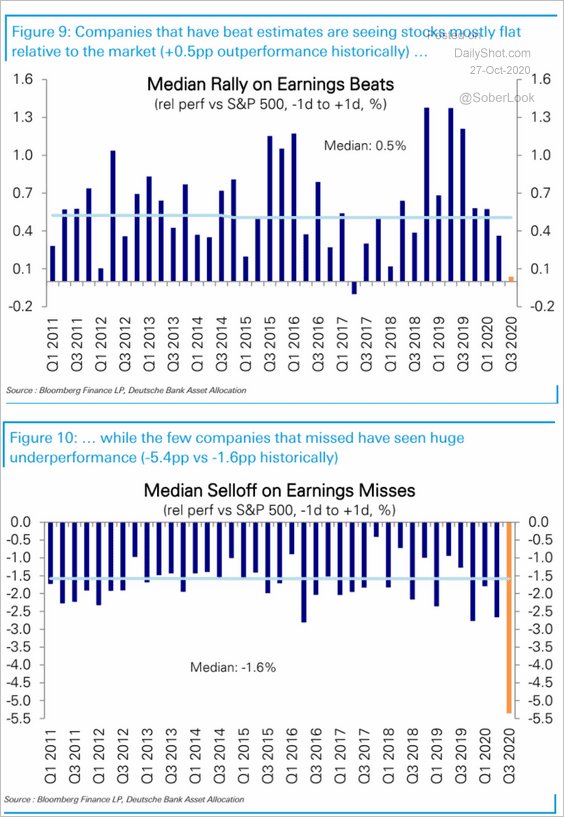
8. Q3 earnings reports have been substantially exceeding analysts’ estimates.
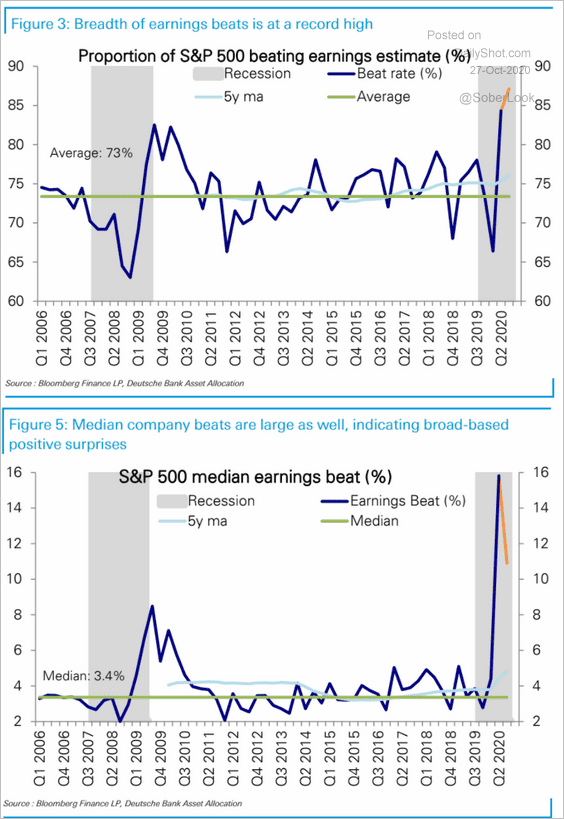 Source: Deutsche Bank Research
But the market hasn’t been rewarding earnings beats while punishing firms that missed estimates by most in years (2nd chart).
 Source: Deutsche Bank Research
——————–
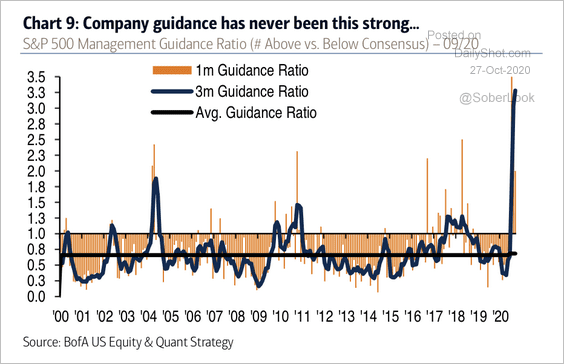
9. The ratio of S&P 500 companies issuing guidance above consensus versus below has surged to new highs.
 Source: BofA Global Research
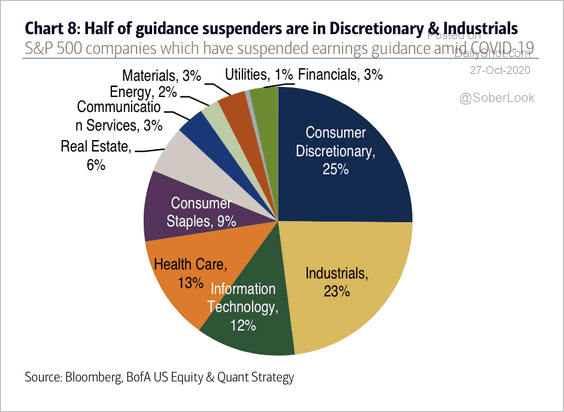
Many consumer discretionary and industrial companies have suspended earnings guidance.
 Source: BofA Global Research
——————–
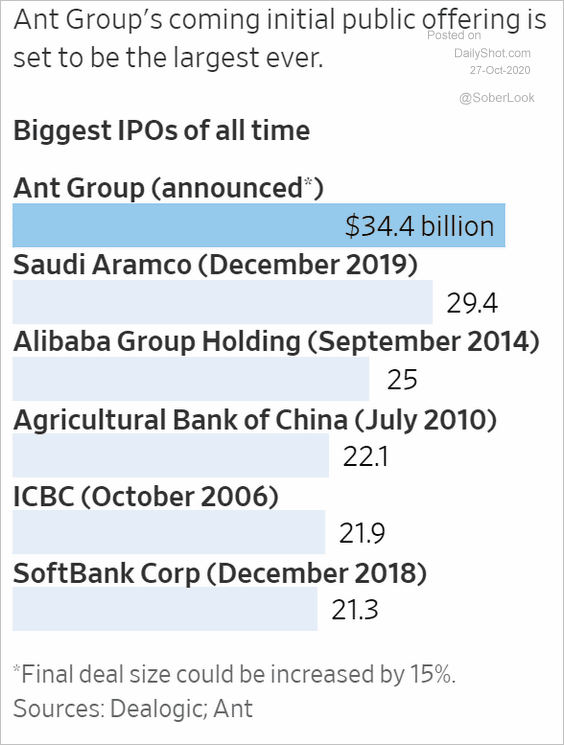
10. Ant Group’s IPO will be the largest on record.
 Source: @WSJ Read full article
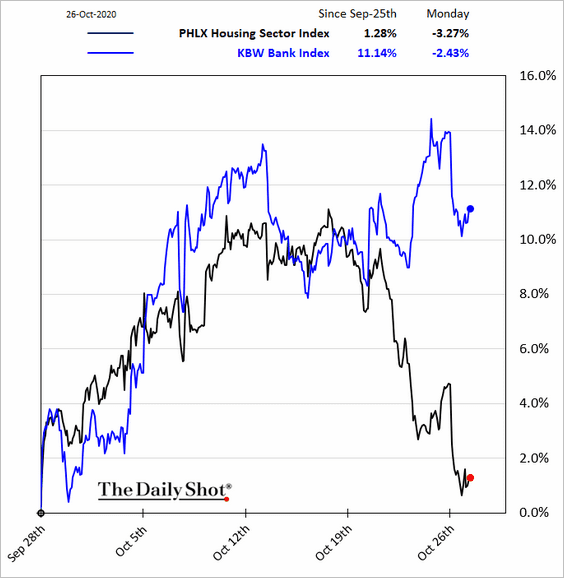
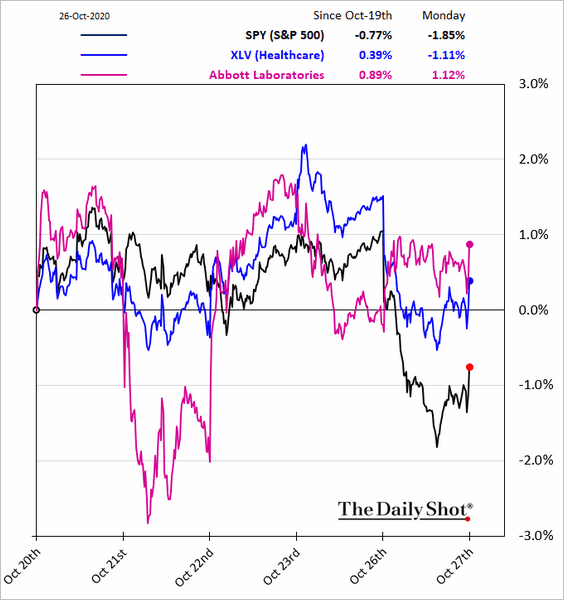
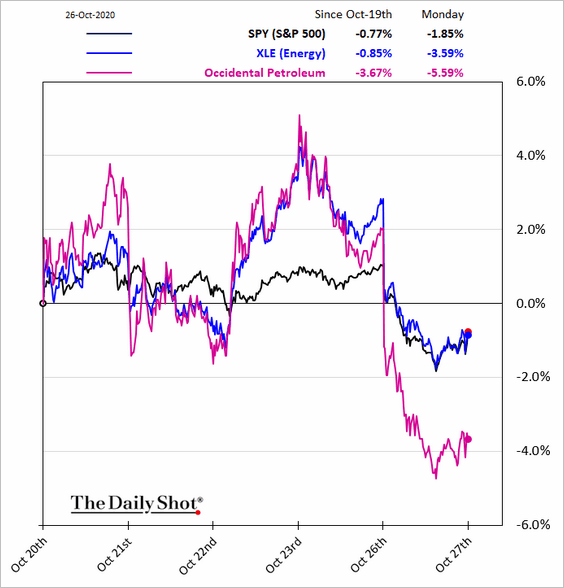
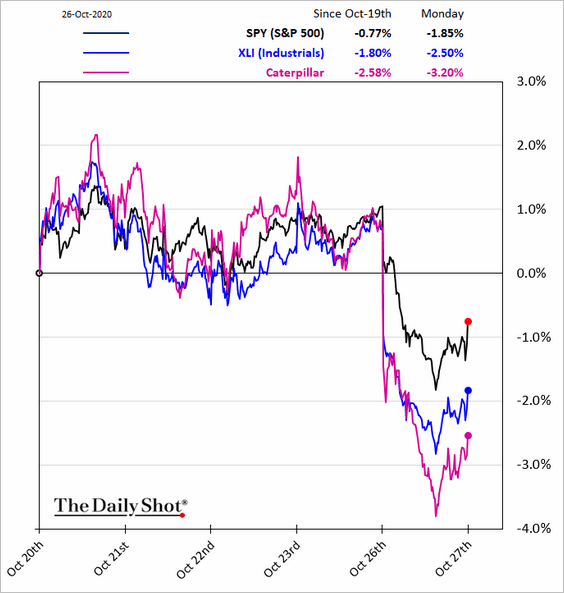
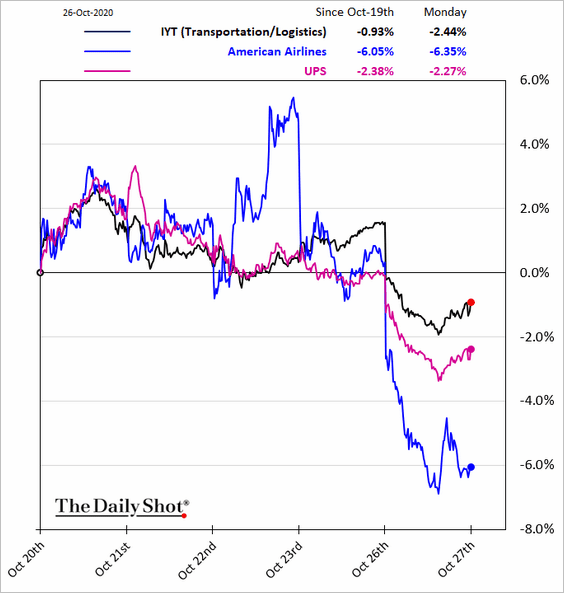
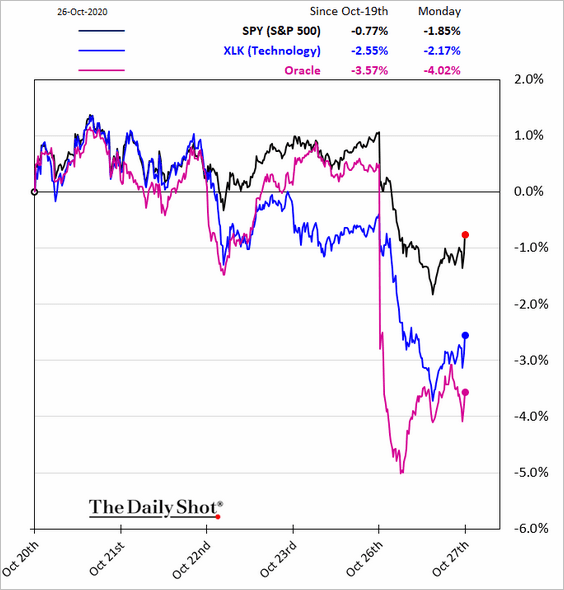
11. Finally, we have some sector performance updates.
• Housing vs. banks over the past month:
• Healthcare:
• Energy:
• Industrials:
• Transportation:
• Tech:
——————–
Alternatives
1. US hedge funds have been reducing exposure to European stocks.
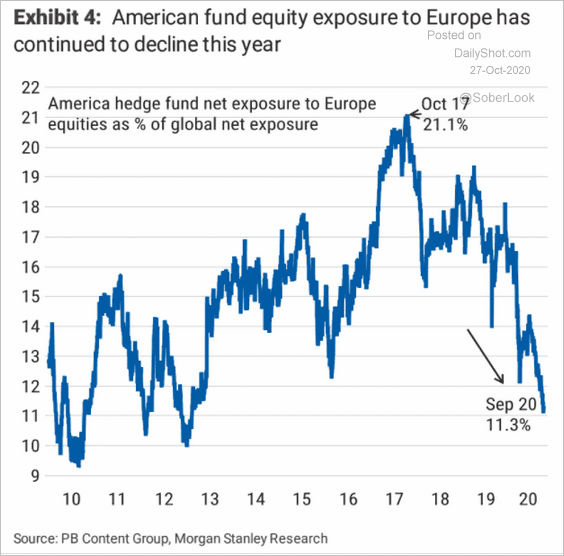 Source: Morgan Stanley Research
2. Hedge fund startups have slowed.
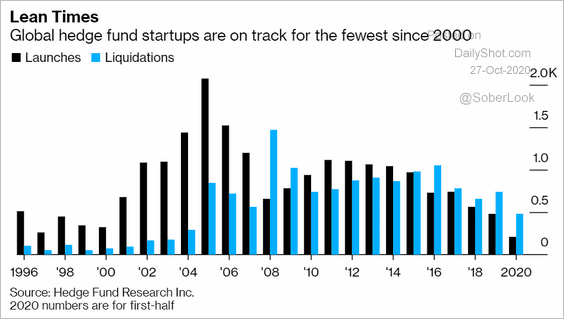 Source: @markets Read full article
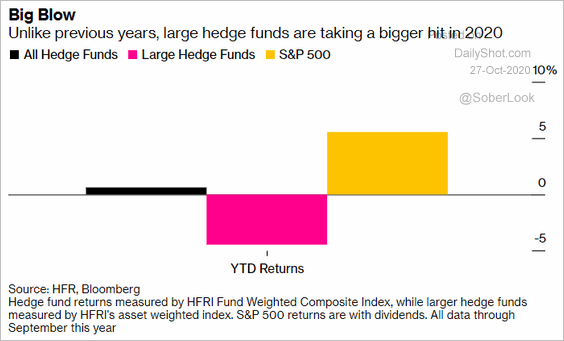
3. Large hedge funds have underperformed this year.
 Source: @markets Read full article
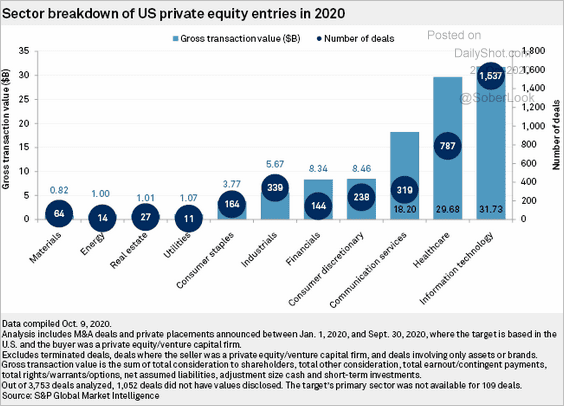
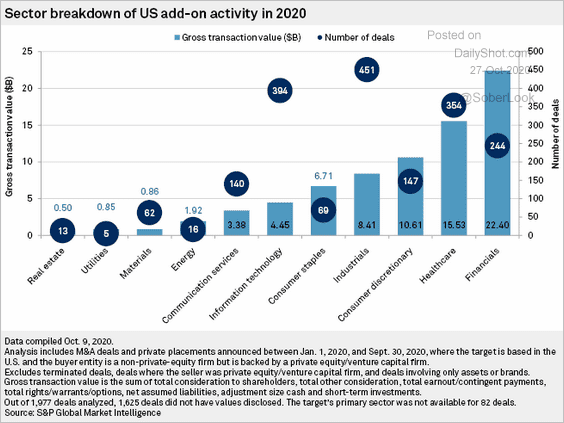
4. Next, we have sector-level private equity activity in 2020.
• New deals:
 Source: S&P Global Market Intelligence
• Add-ons:
 Source: S&P Global Market Intelligence
Credit
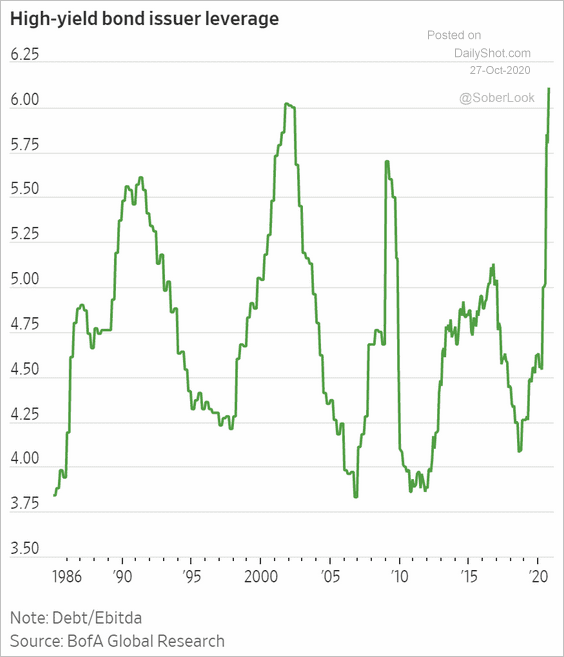
1. High-yield bond leverage (debt/EBITDA) has risen sharply this year. Investors expect the trend to reverse substantially as earnings improve.
 Source: @WSJ Read full article
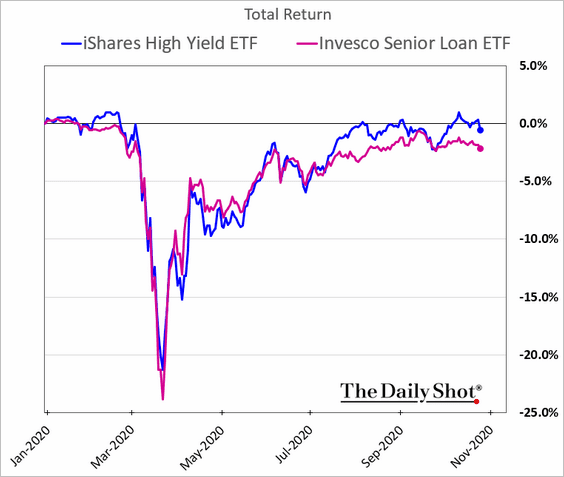
2. US high-yield bonds have recovered the COVID-related losses. Leveraged loans have not.
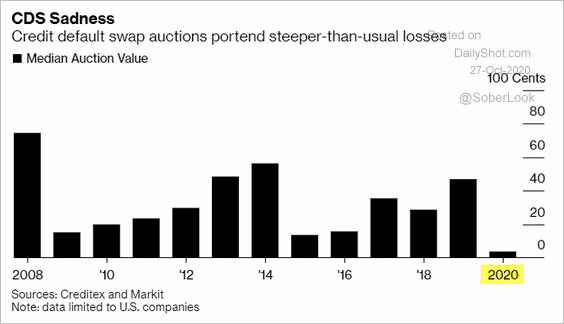
3. CDS auction recoveries (defaulted debt) have been extremely low this year, dominated by leveraged retailers with broken business models. Cov-lite debt structures exacerbated the losses.
 Source: @markets Read full article
4. The US banking-system loan-to-deposit ratio hit a multi-decade low, with deposits rising much faster than loans (due to the Fed’s QE).

Rates
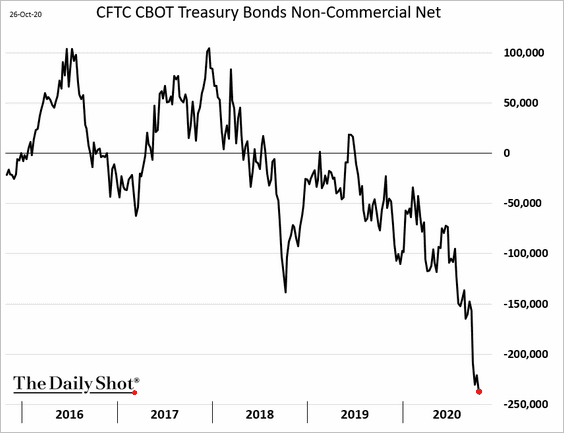
1. Speculative accounts have been betting on the Treasury curve steepening, boosting their net short positions in the long bond.
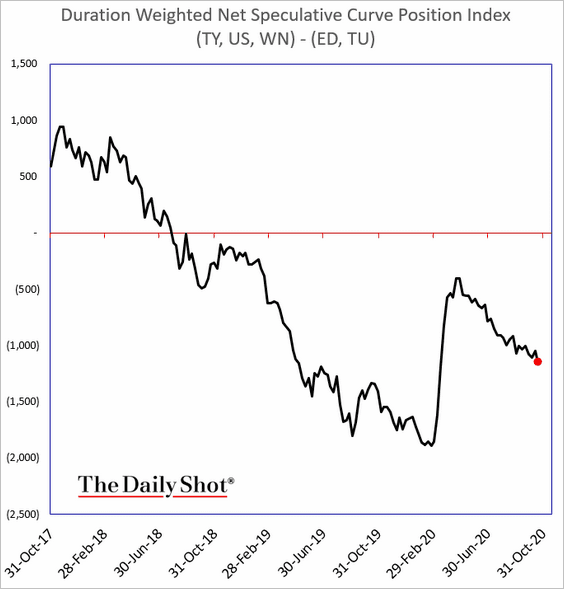
This chart shows a duration-weighted curve positioning indicator (negative = bet on steepening).
——————–
2. The US money supply surge suggests a steeper yield curve.
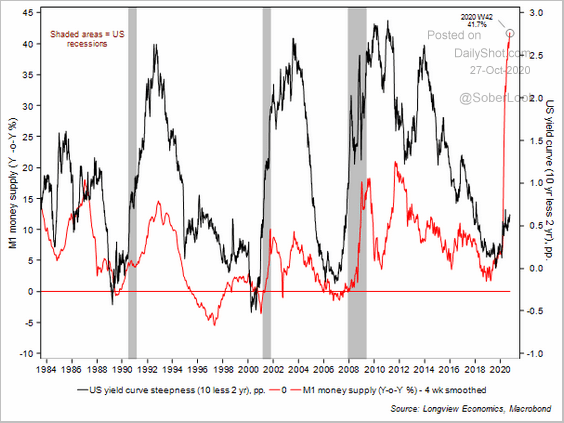 Source: Longview Economics
3. A steeper Treasury yield curve has generally been associated with a cheaper dollar.
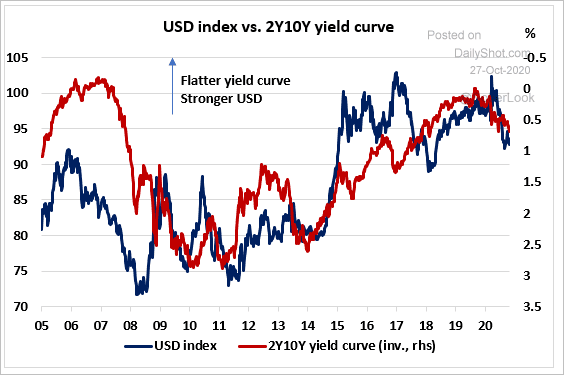 Source: Rothko Research
Commodities
1. Let’s begin with some updates on coffee.
• China’s coffee imports (vs. Japan):
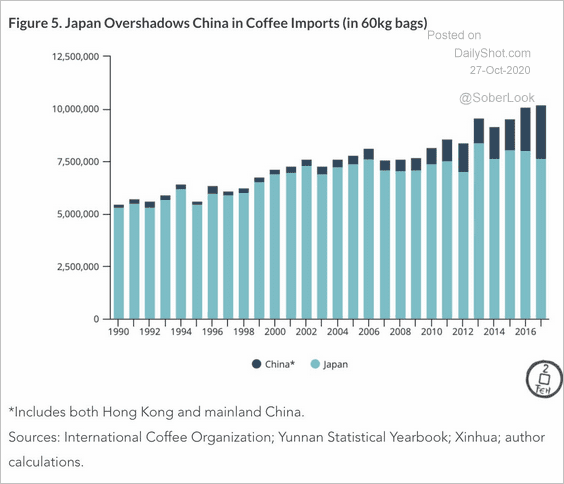 Source: @adam_tooze, @MacroPoloCharts Read full article
• Largest coffee producers:
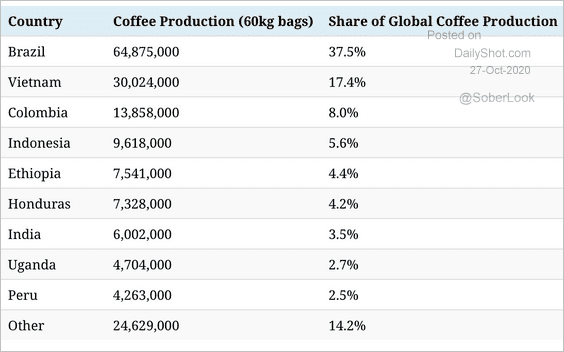 Source: Visual Capitalist Read full article
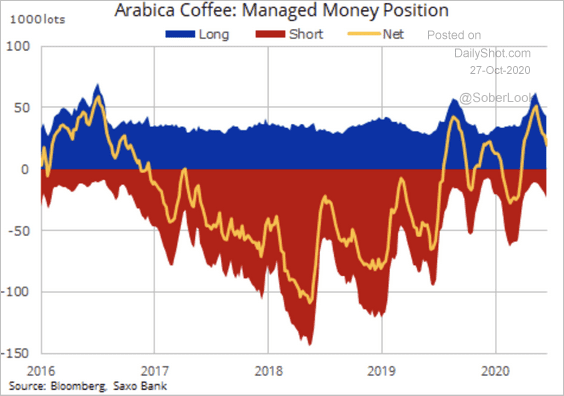
• Speculators have reduced their net-long positions in Arabica coffee futures.
 Source: @Ole_S_Hansen
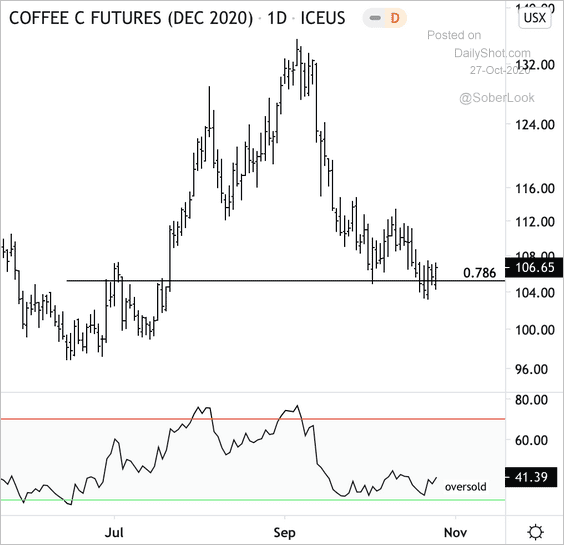
• The December coffee futures contract is at short-term support.
 Source: @DantesOutlook
——————–
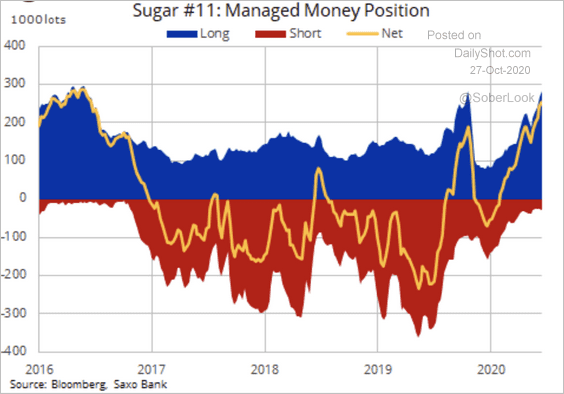
2. Long positioning in sugar futures is at an extreme.
 Source: @Ole_S_Hansen
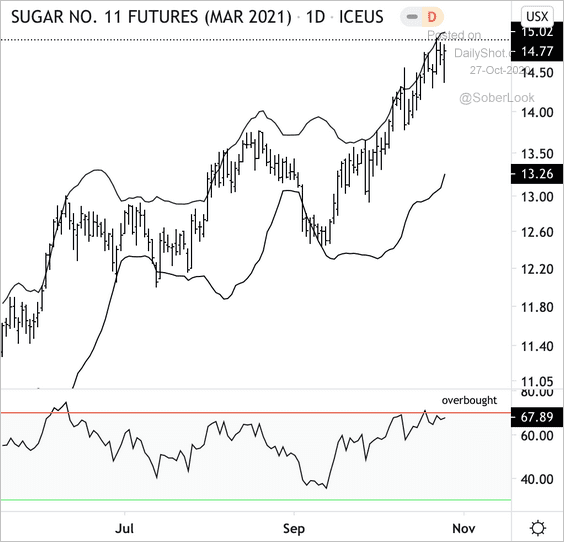
The March 2021 sugar futures contract appears overbought.
 Source: @DantesOutlook
——————–
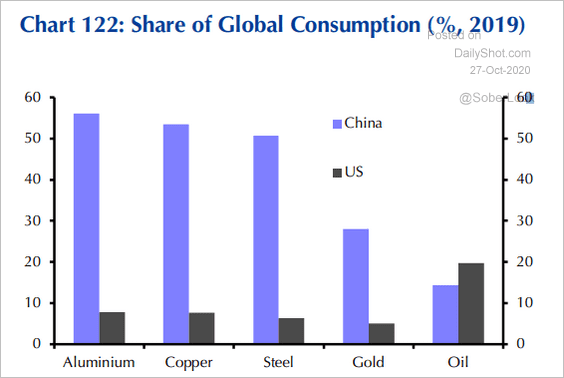
3. China dominates the global consumption of industrial metals.
 Source: Capital Economics
Energy
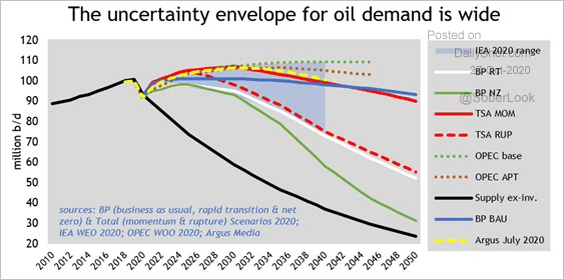
1. The outlook for long-term oil demand varies substantially.
 Source: Argus Media Read full article
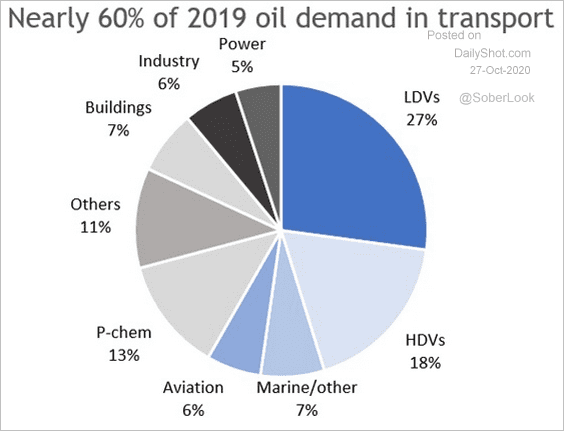
2. Transport accounted for the majority of oil demand last year.
 Source: Argus Media Read full article
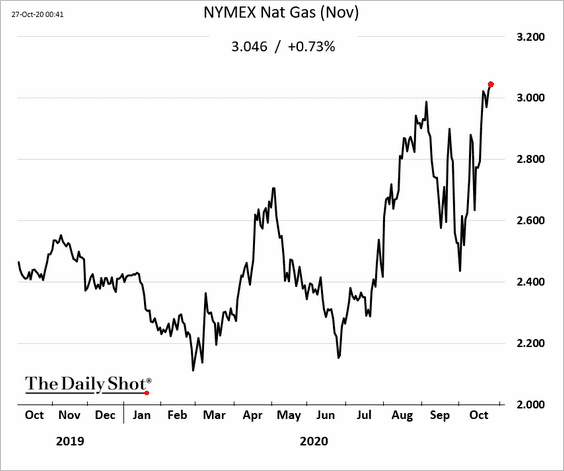
3. The November US natural gas futures price is now firmly above $3/MMBTU.
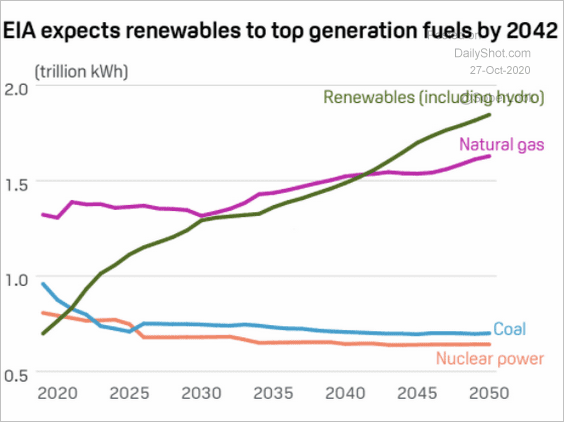
4. Renewables’ use in power generation is expected to exceed natural gas by 2042.
 Source: EIA, S&P Global Platts
Emerging Markets
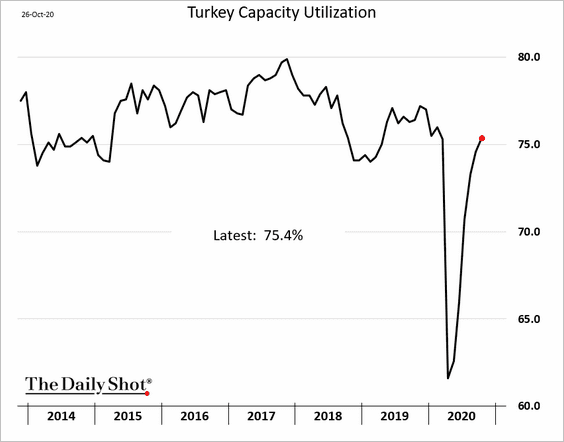
1. Let’s begin with some updates on Turkey.
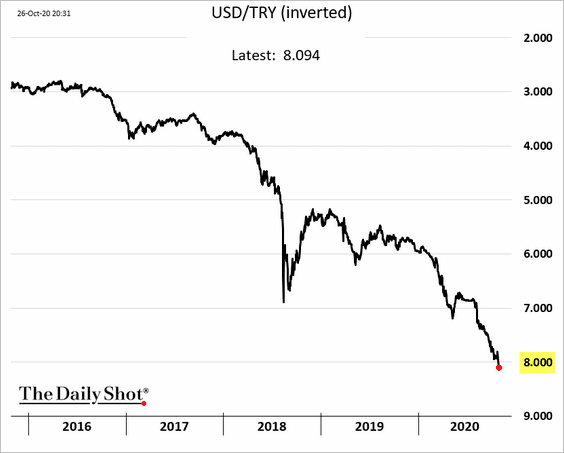
• The lira (a record low):
• The stock market:
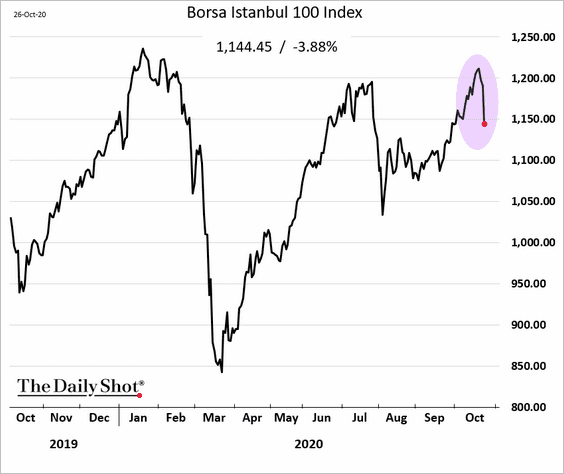
This development isn’t helping.
 Source: @WSJ Read full article
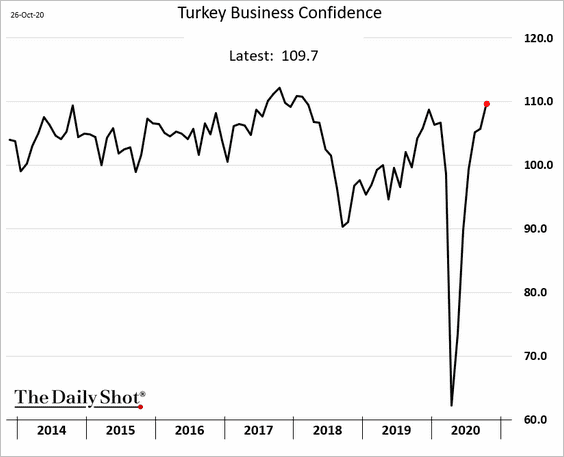
• Business confidence:
• Capacity utilization:
• Government borrowing:
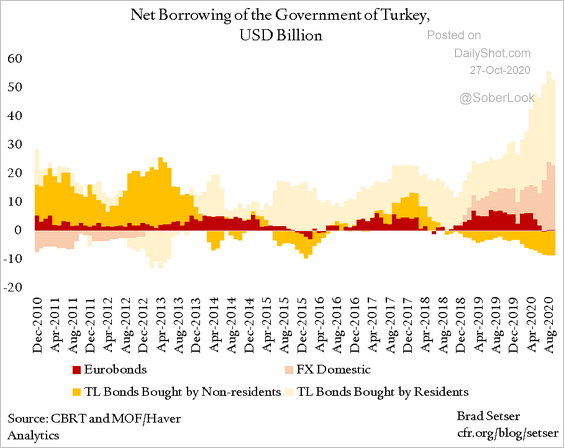 Source: @Brad_Setser
• Domestic foreign currency deposits:
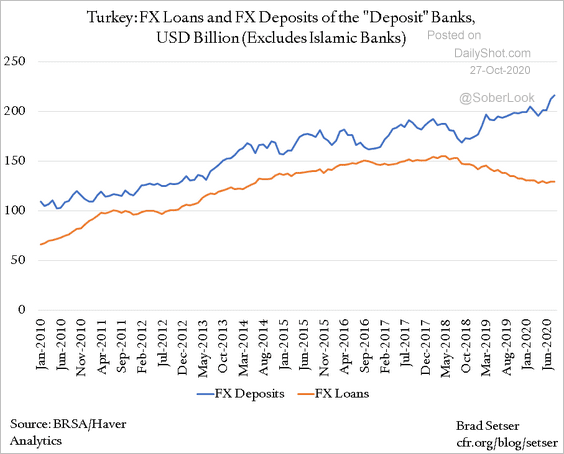 Source: @Brad_Setser Read full article
——————–
2. Here are the changes in government debt across the Middle East and North Africa.
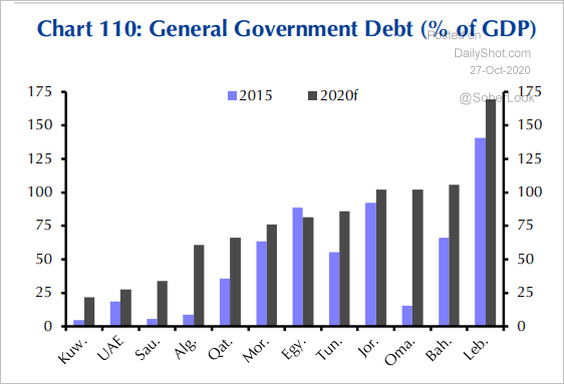 Source: Capital Economics
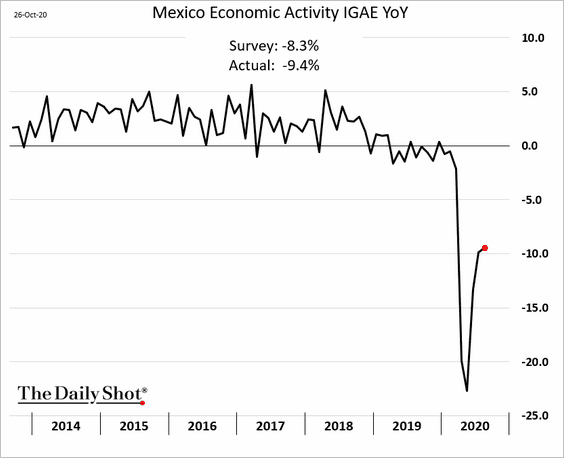
3. Mexico’s economic activity remains depressed (data as of August).
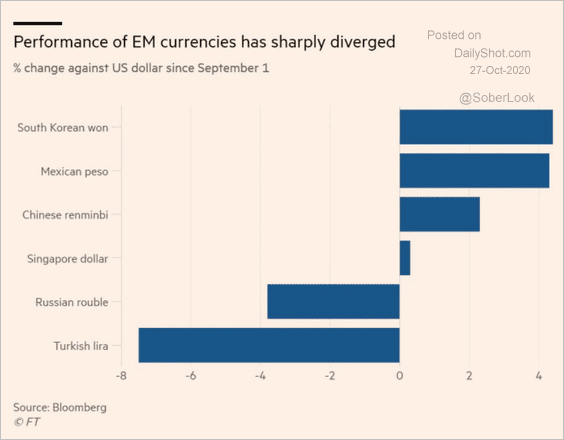
4. Expectations of a Biden win in the US are showing up in the currency markets.
 Source: @adam_tooze, @FT Read full article
China
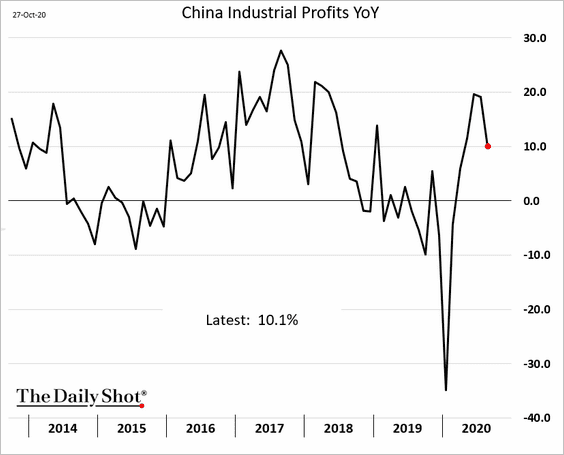
1. Industrial profits remain robust.
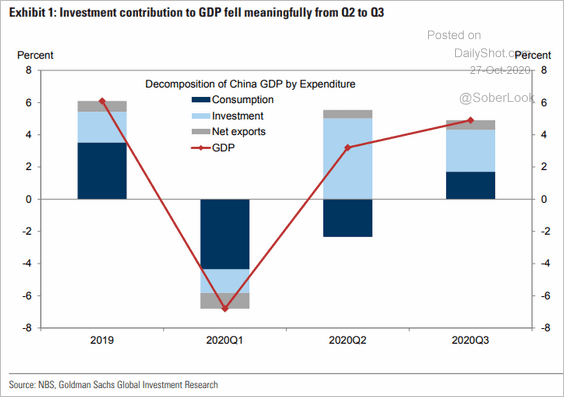
2. Here are the contributions to China’s GDP growth.
 Source: Goldman Sachs
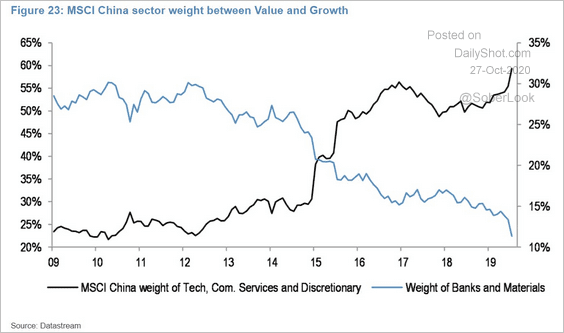
3. The tech sector’s weight in China’s equity market has been increasing.
 Source: @jsblokland
Asia – Pacific
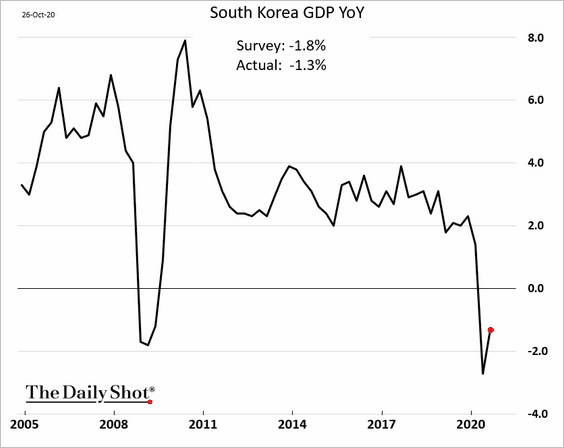
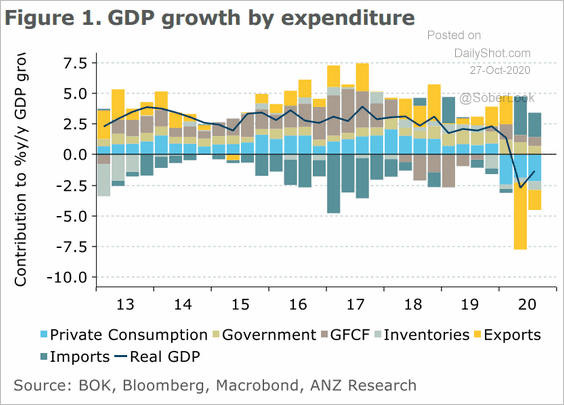
1. South Korea’s Q3 GDP growth was a bit better than expected.
 Source: ANZ Research
——————–
2. Singapore’s industrial production climbed 24% vs. last year.

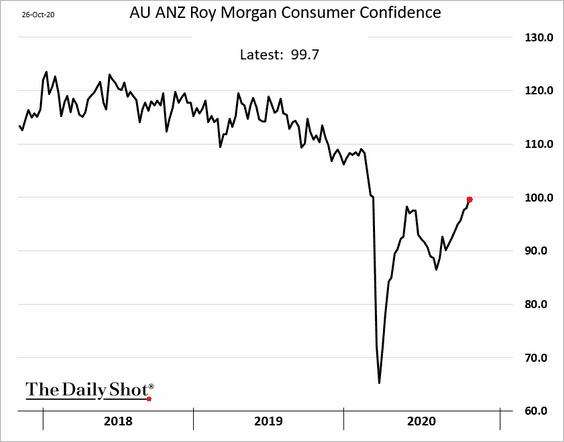
3. Australia’s consumer confidence continues to recover.
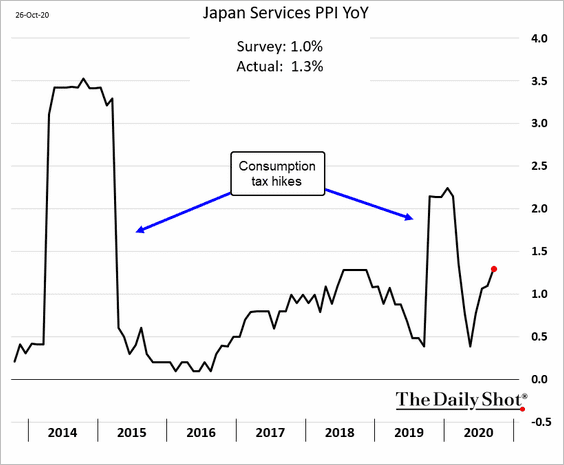
4. Japan’s service-sector PPI surprised to the upside.
The Eurozone
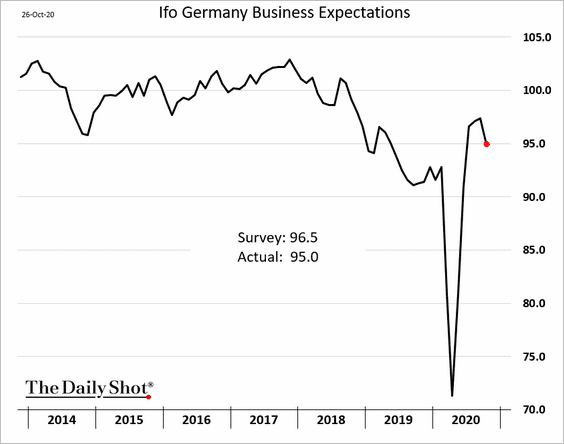
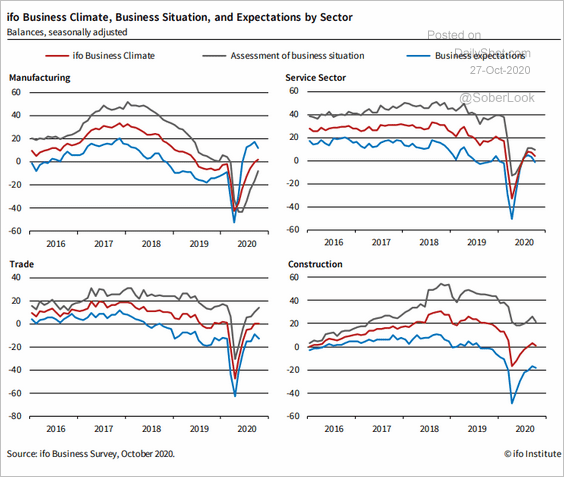
1. Germany’s Ifo business expectations index was weaker than expected.
 Source: ifo Institute
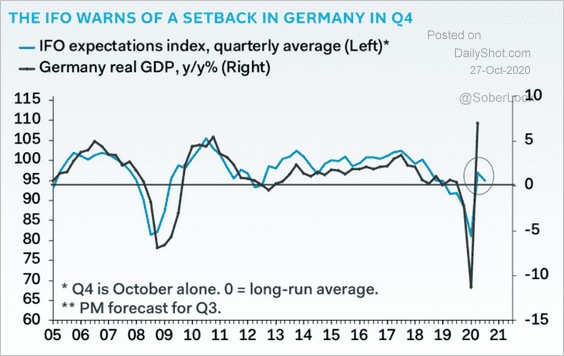
The soft Ifo reading poses a risk for the fourth-quarter GDP performance.
 Source: Pantheon Macroeconomics
——————–
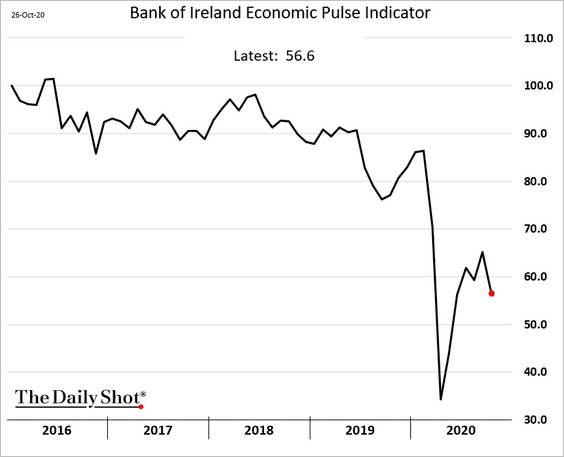
2. Ireland’s sentiment is deteriorating again.
3. How long will it take to get the GDP back to pre-crisis levels?
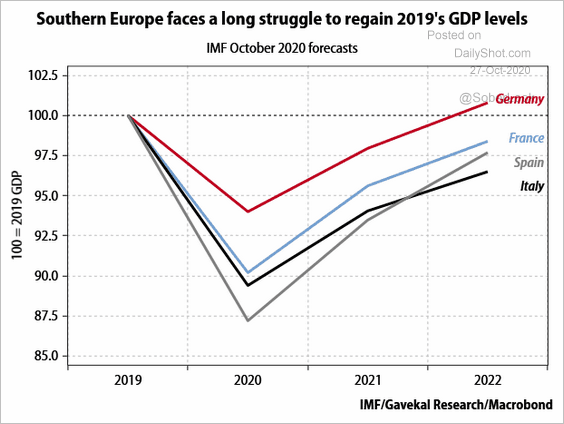 Source: Gavekal
The United States
1. Let’s begin with the housing market.
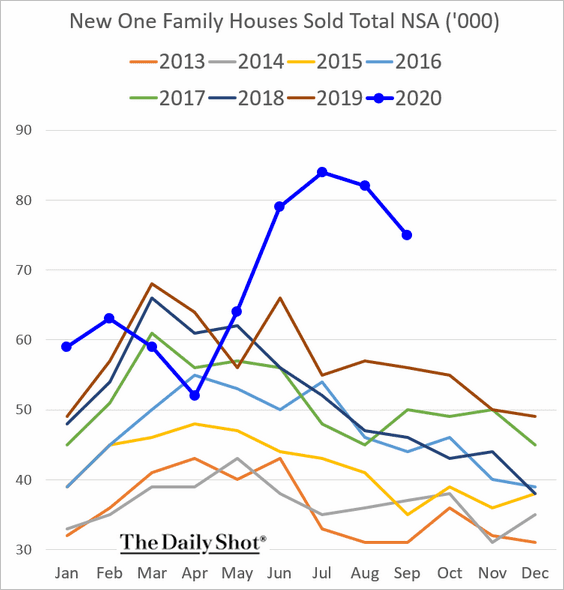
• New home sales were below market expectations.
• New home inventories remain depressed (2 charts).
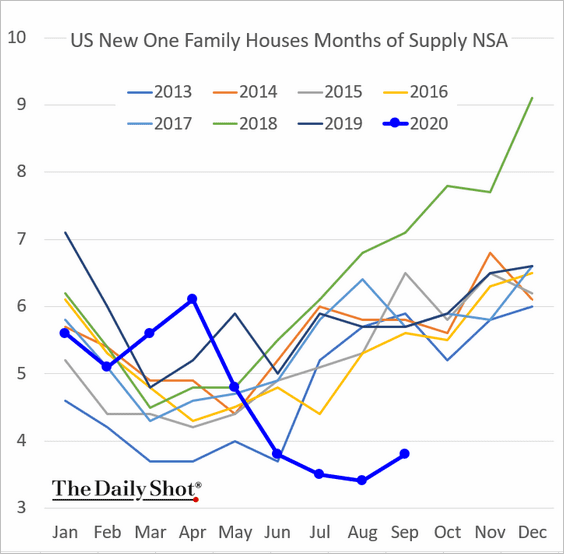
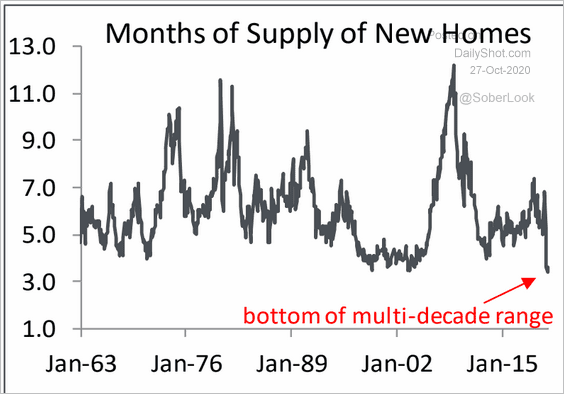 Source: Piper Sandler
• This chart shows pending home sales by region.
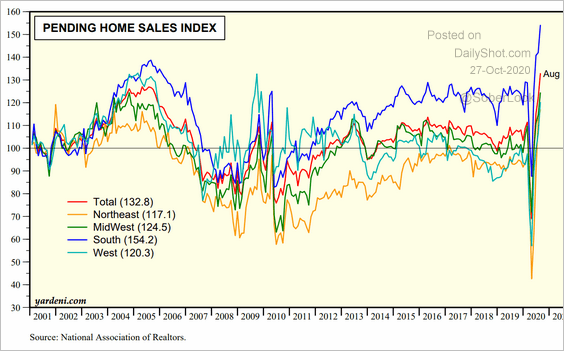 Source: Yardeni Research
• Home price appreciation could hit 12% in November, according to AEI Housing Center.
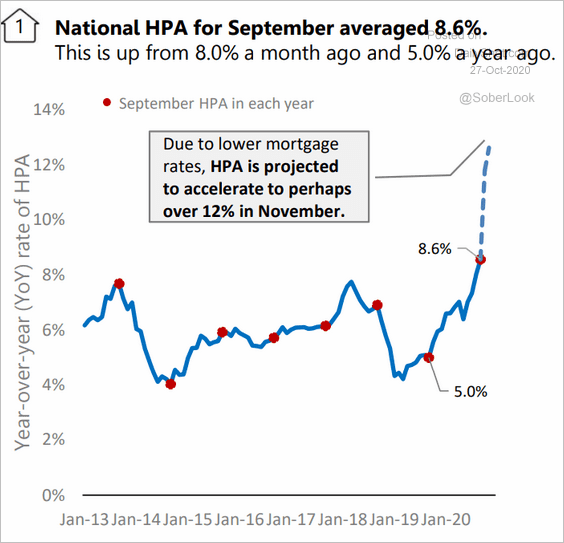 Source: AEI Housing Center
——————–
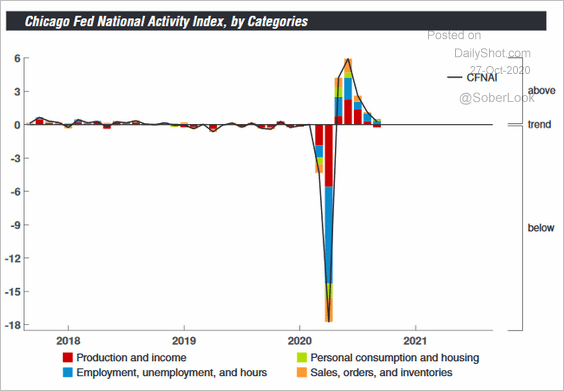
2. The September Chicago Fed National Activity Index was below forecasts, pointing to a loss of recovery momentum.
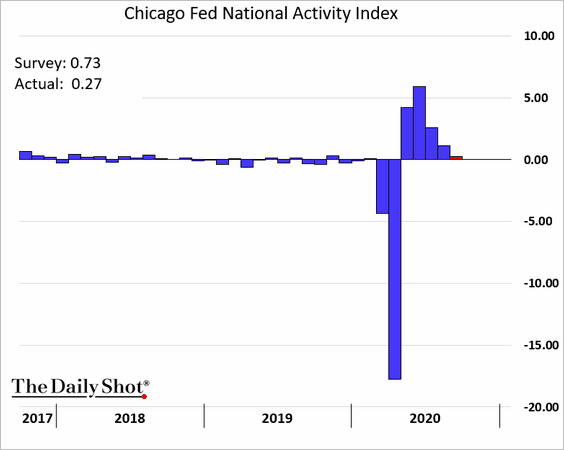
 Source: @GregDaco, @ChicagoFed
——————–
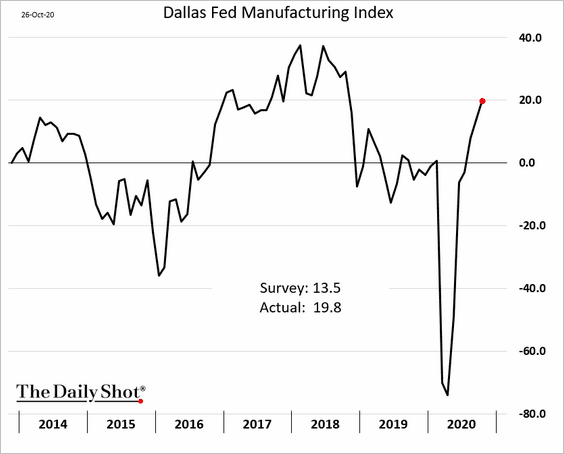
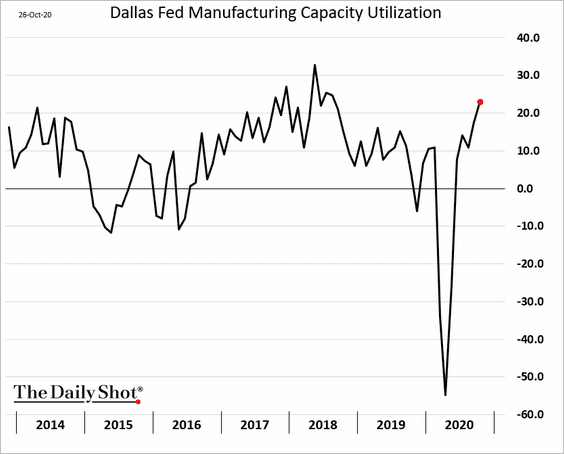
3. The Dallas Fed’s regional manufacturing index showed robust growth this month (similar to other regional Fed surveys).
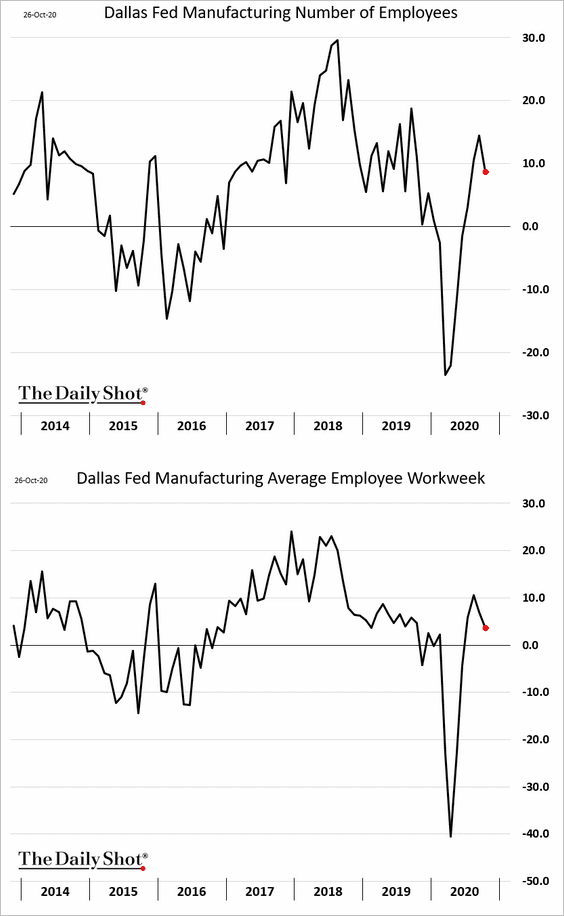
Hiring slowed a bit.
——————–
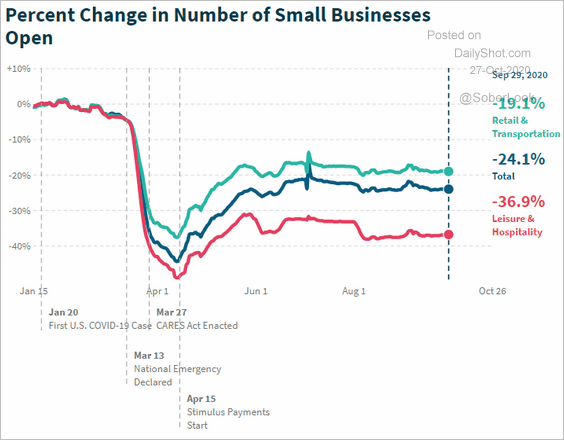
4. The number of US small businesses that are open is down some 24% this year.
 Source: @LizAnnSonders, @OppInsights
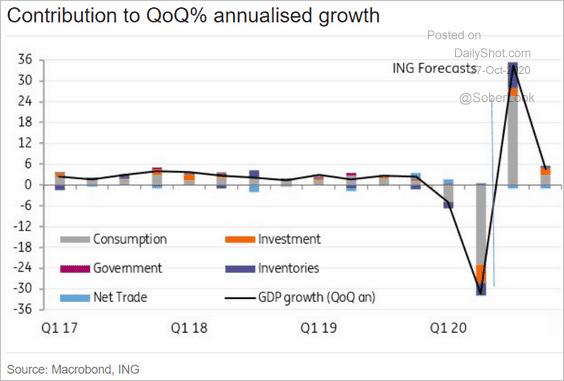
5. This chart shows ING’s GDP forecast for Q3 and Q4.
 Source: ING
——————–
Food for Thought
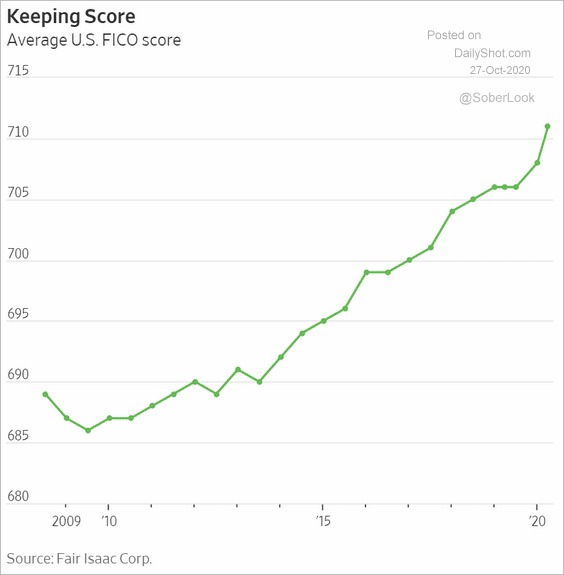
1. Credit score inflation:
 Source: @WSJ Read full article
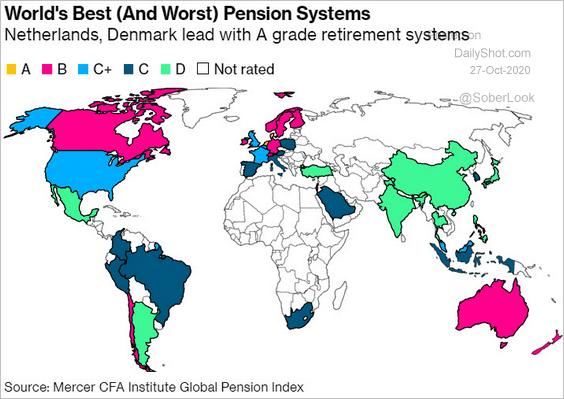
2. World’s pensions rated:
 Source: @business Read full article
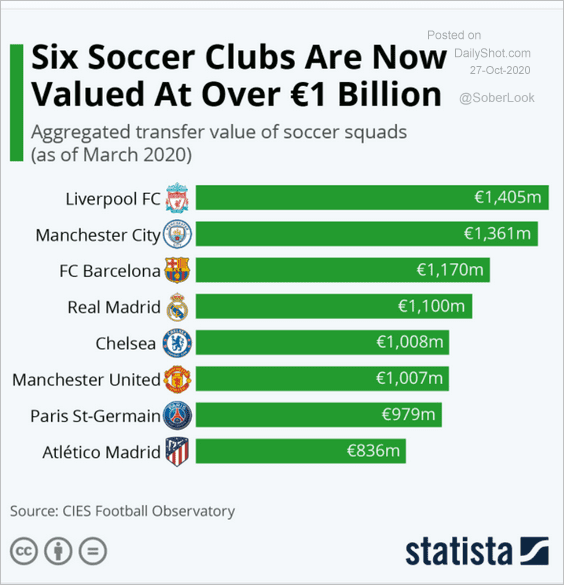
3. Soccer club valuations:
 Source: Statista
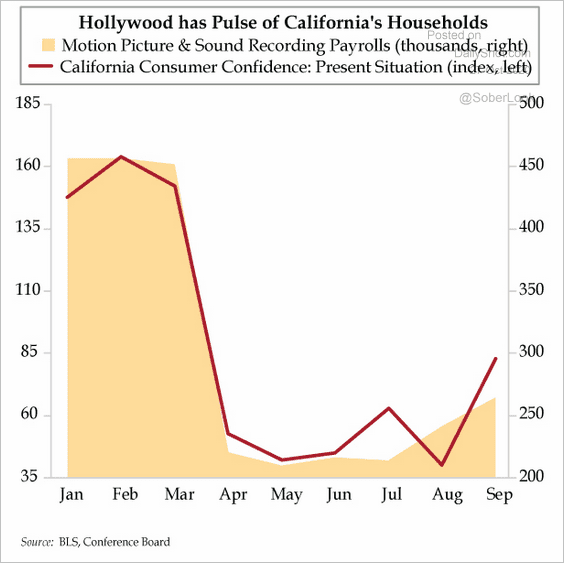
4. Motion picture industry jobs vs. California consumer confidence:
 Source: The Daily Feather
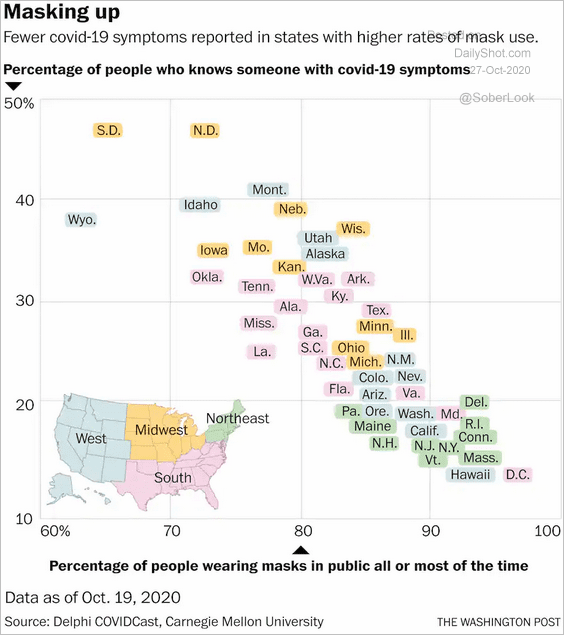
5. COVID prevalence vs. mask usage in the US:
 Source: The Washington Post Read full article
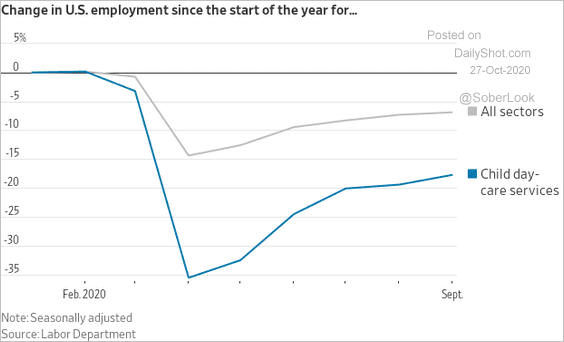
6. Childcare employment:
 Source: @WSJ Read full article
7. Americans’ views on economic recovery:
 Source: @FT Read full article
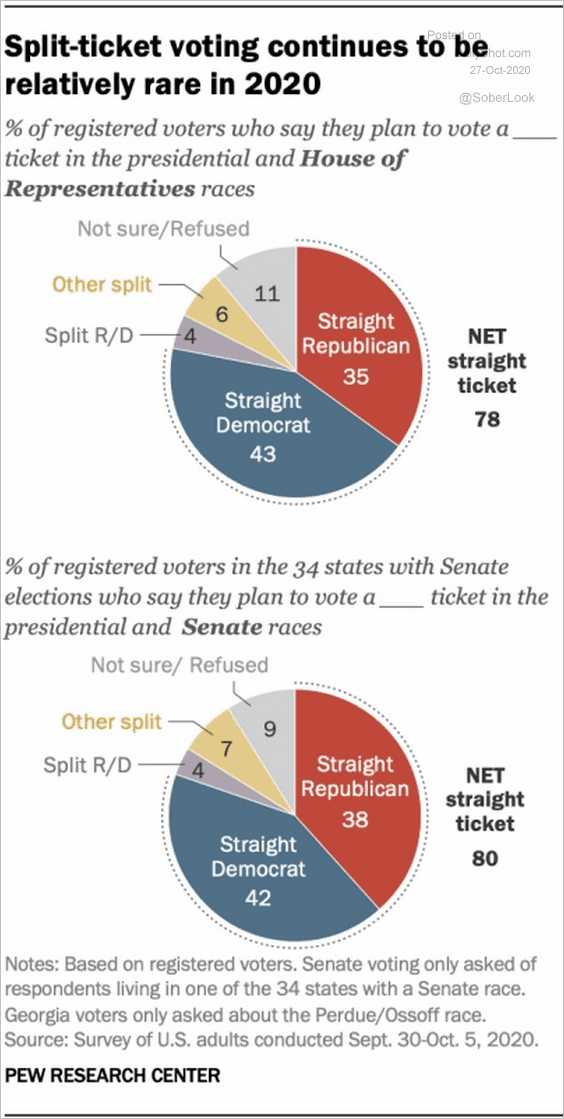
8. Split-ticket voting:
 Source: Pew Research Center Read full article
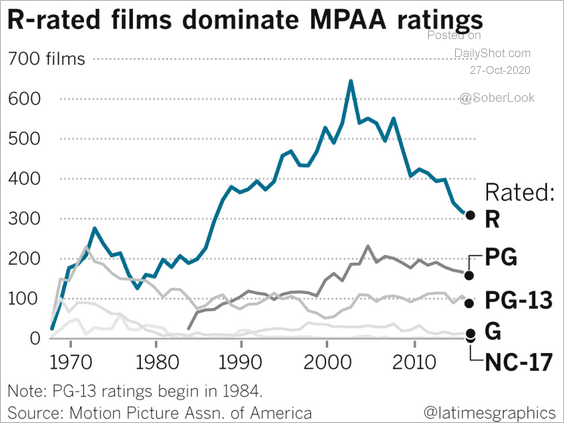
9. Movie ratings (MPAA) over time:
 Source: @latimes Read full article
——————–
