
The Daily Shot: 16-Nov-20
• The United States
• Canada
• The United Kingdom
• The Eurozone
• Europe
• Japan
• Asia – Pacific
• China
• Emerging Markets
• Cryptocurrency
• Commodities
• Energy
• Equities
• Rates
• Global Developments
• Food for Thought
The United States
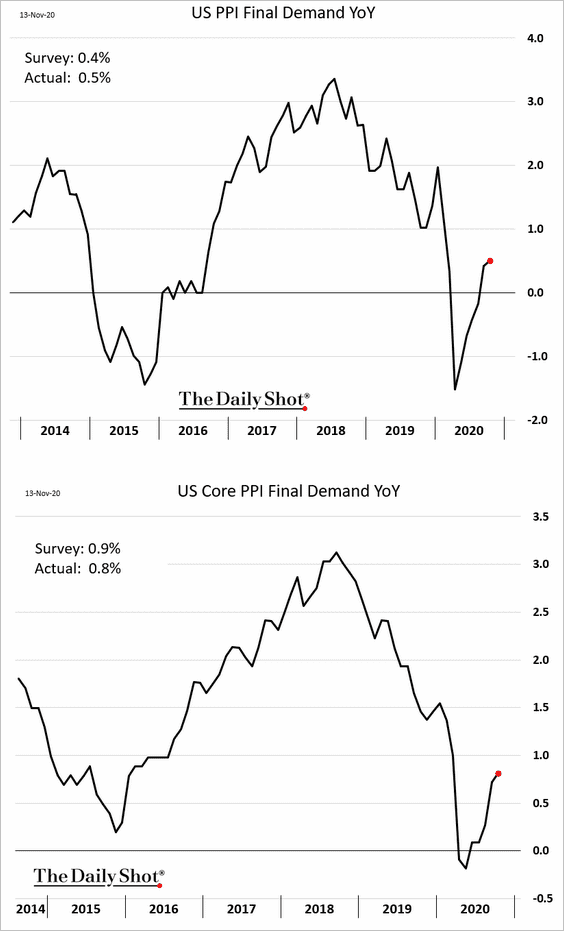
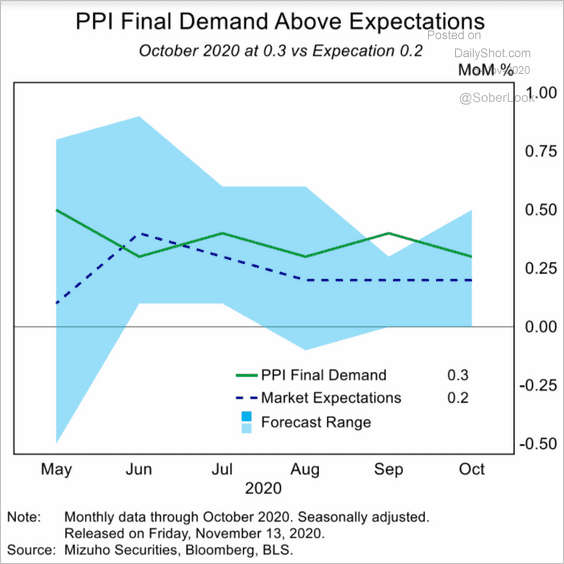
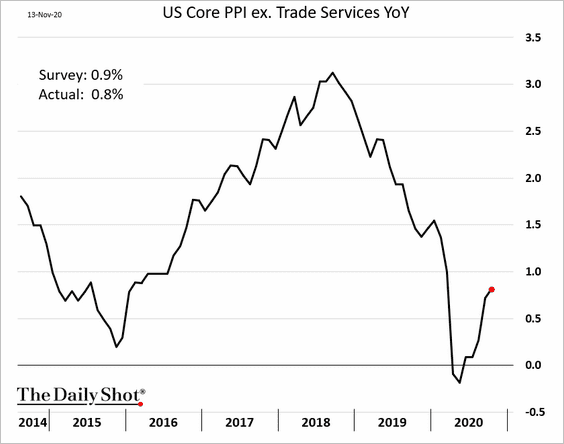
1. Producer prices continue to rebound, with the headline PPI running above estimates in recent months (third chart below). The core PPI recovery has been more modest.
 Source: Mizuho Securities USA
• This chart shows the core PPI excluding trade services (business markups), which tend to be volatile.
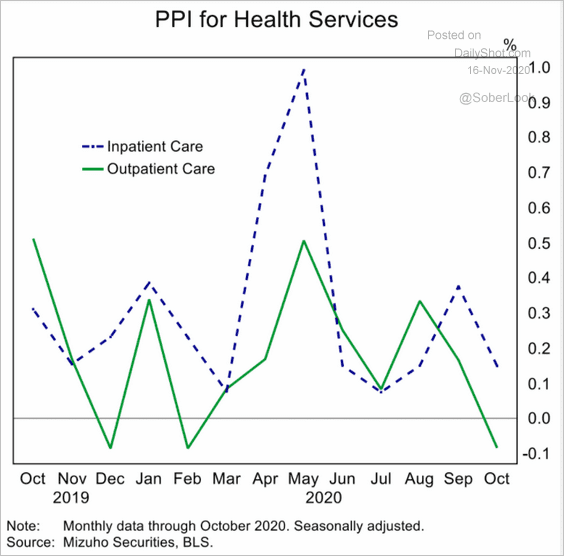
• After a big jump during the first COVID wave, healthcare services PPI moderated in October.
 Source: Mizuho Securities USA
——————–
2. The U. Michigan Consumer Sentiment index surprised to the downside this month.
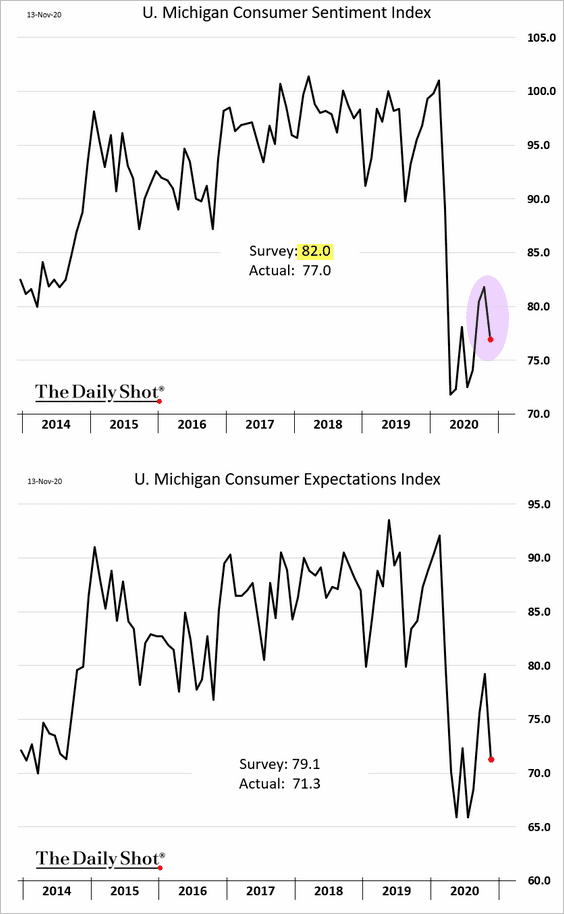
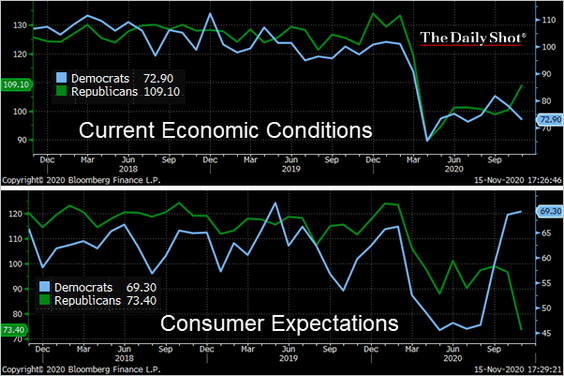
As we’ve seen earlier, presidential elections tend to have a substantial impact on US sentiment indicators. Republicans are more upbeat about the current situation (1st panel), while Democrats are more optimistic about the future (2nd panel). However, the expectations gains among Democrats weren’t enough to offset the pessimism among Republicans, pulling the overall index lower.
 Source: @TheTerminal, Bloomberg Finance L.P.
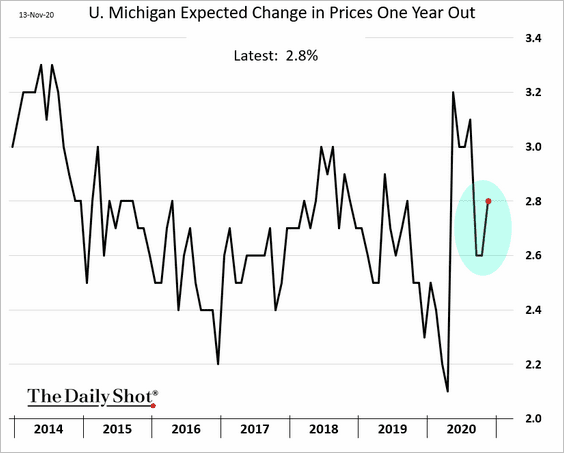
Inflation expectations ticked up.
——————–
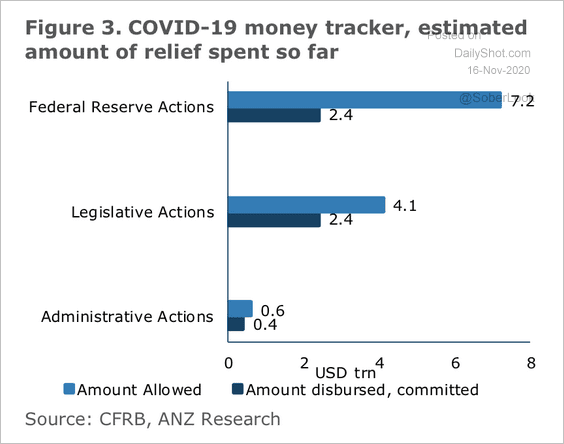
3. Here is an estimate of the amount of pandemic relief “allowed” vs. spent so far.
 Source: ANZ Research
4. Surveys increasingly point to lower holiday spending this year.
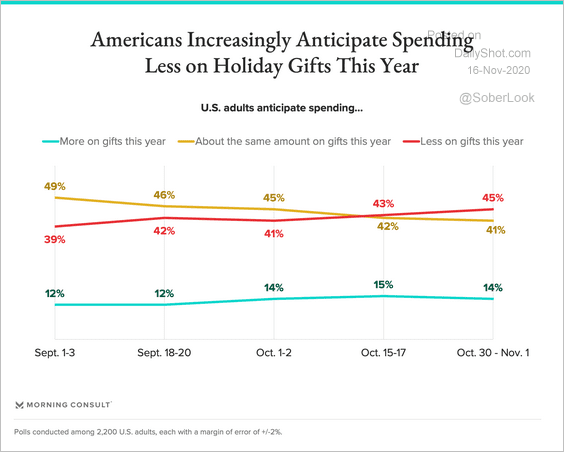 Source: Morning Consult Read full article
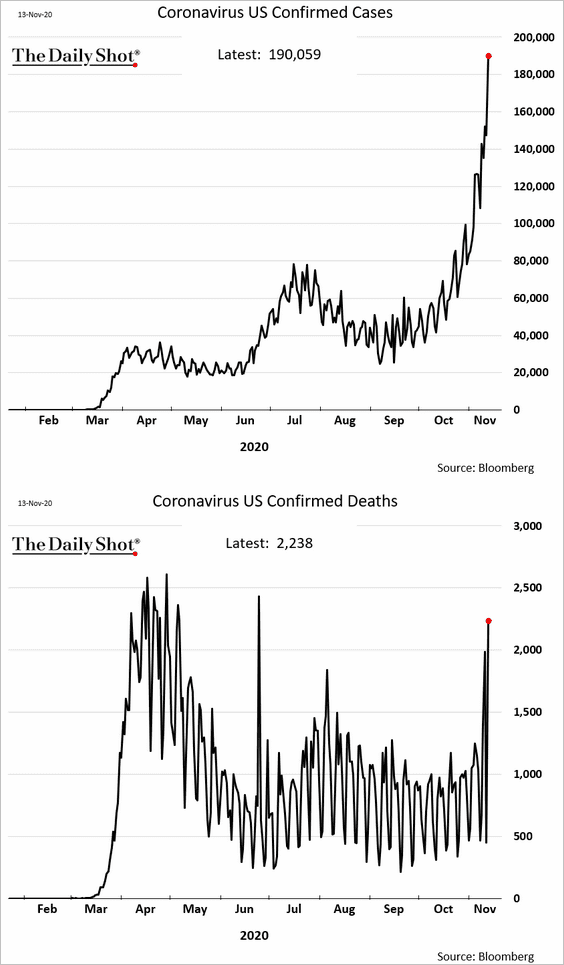
5. Next, we have some updates on the COVID situation.
• Daily new cases and deaths:
• Positivity rates for select states:
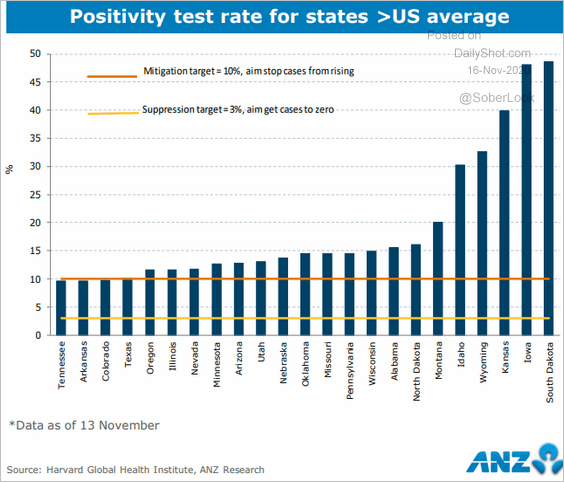 Source: ANZ Research
• Hospitalizations:
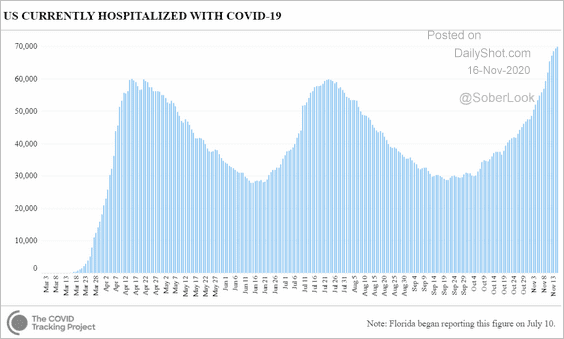 Source: CovidTracking.com
——————–
6. The pandemic is increasingly taking a toll on the recovery. Here are some high-frequency trends.
• Mobility indicators:
![]() Source: ANZ Research
Source: ANZ Research
• The Oxford Economics Recovery Tracker:
![]() Source: @GregDaco, @OxfordEconomics Further reading
Source: @GregDaco, @OxfordEconomics Further reading
• Consumer spending by income category:
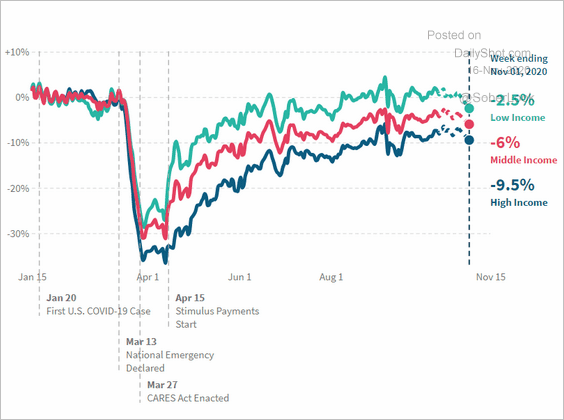 Source: Opportunity Insights Economic Tracker
Canada
1. The COVID situation has deteriorated further. The red line shows the pace of increases (1st derivative) in the number of daily cases.
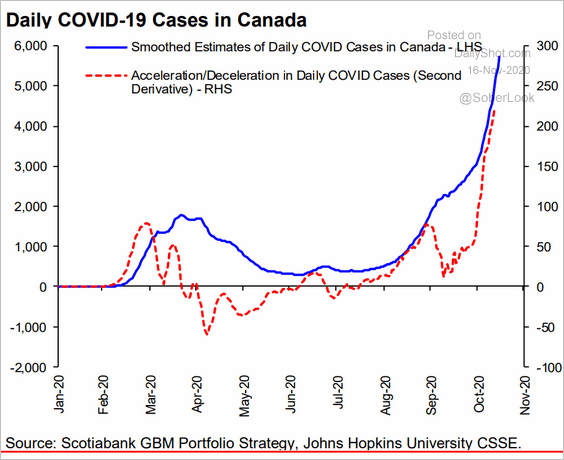 Source: Hugo Ste-Marie, Portfolio & Quantitative Strategy Global Equity Research, Scotia Capital
2. Quebec employment is approaching pre-pandemic levels.
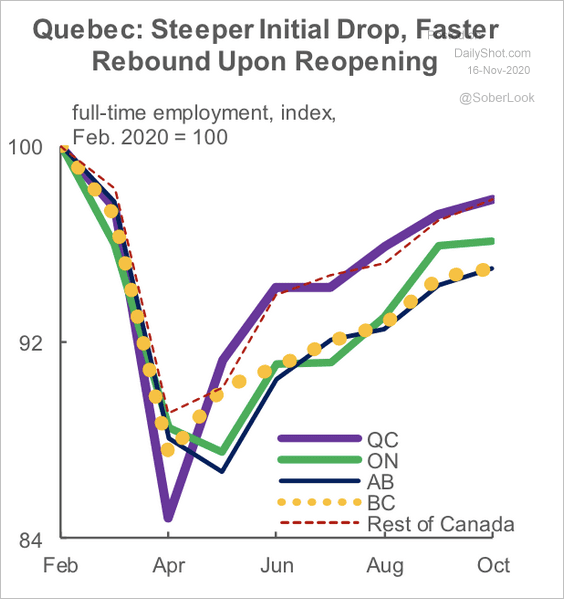 Source: Scotiabank Economics
A hefty C$4 billion in “contingency” funds will add further strain to Quebec’s fiscal budget next year. Fiscal consolidation has taken a backseat to pandemic related expenditures.
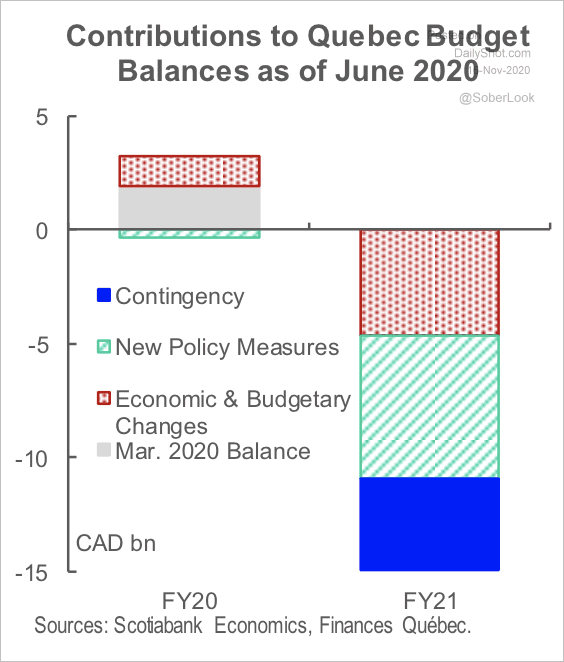 Source: Scotiabank Economics
The United Kingdom
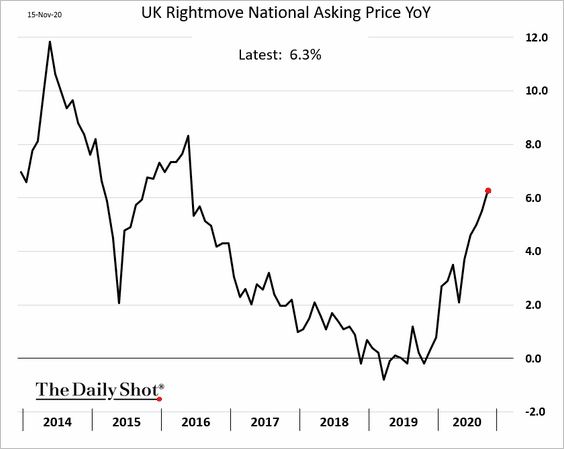
1. Asking prices for homes are now 6% above last year’s levels.
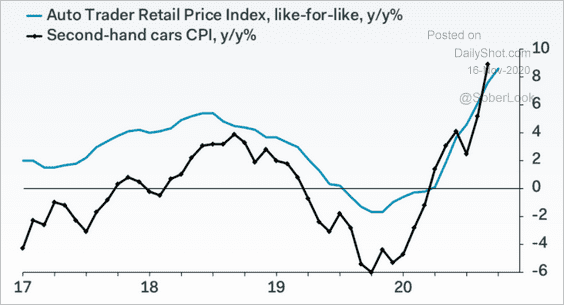
2. Just like in the US, the UK used car price gains accelerated in recent months.
 Source: Pantheon Macroeconomics
The Eurozone
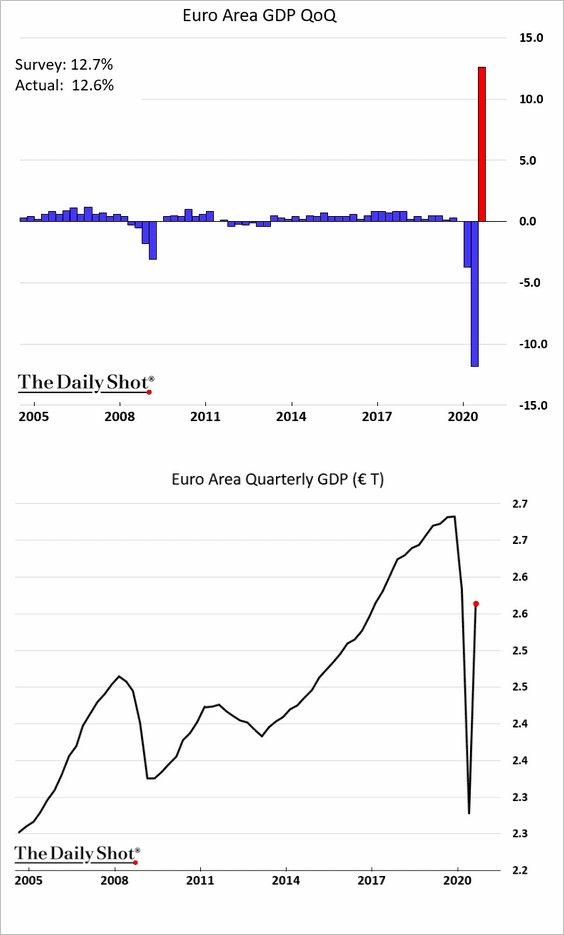
1. The Q3 GDP rebound was roughly in line with expectations. Economists now expect a decline in the current quarter (a “double-dip”).
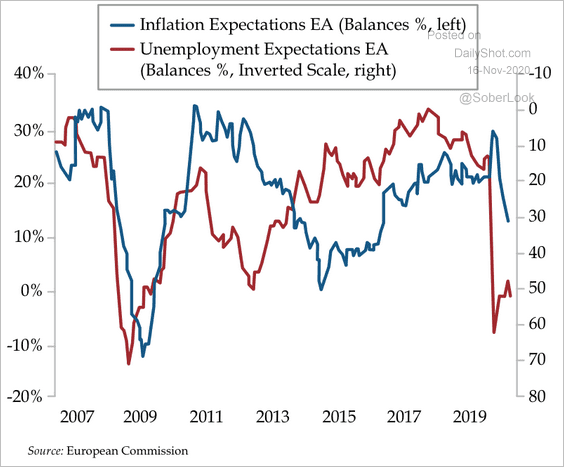
2. Inflation and employment expectations remain weak.
 Source: EC, Quill Intelligence
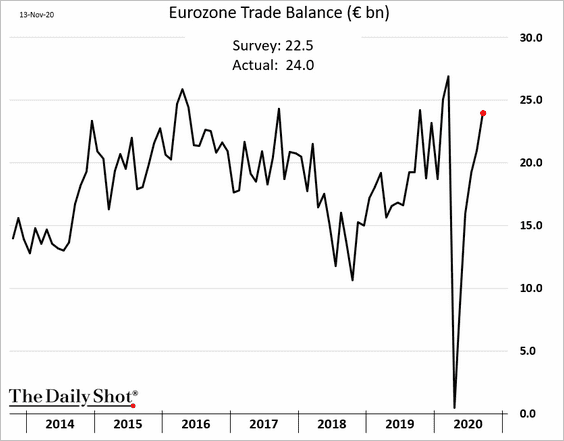
3. The euro-area trade surplus has undergone a V-shape recovery.
Europe
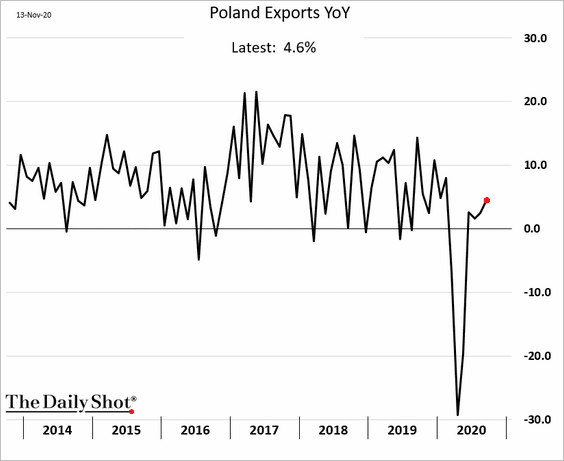
1. Poland’s exports are now well above last year’s levels, following the Eurozone trend above.
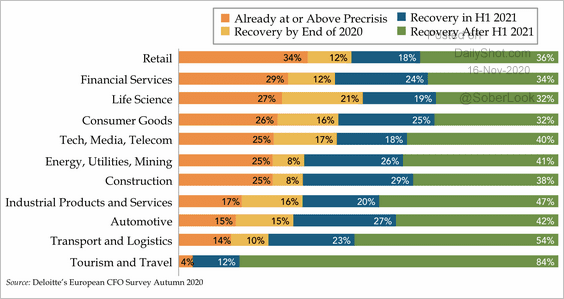
2. A majority of European CFOs don’t expect a full recovery until the second half of next year, according to a Deloitte survey.
 Source: Deloitte, Quill Intelligence
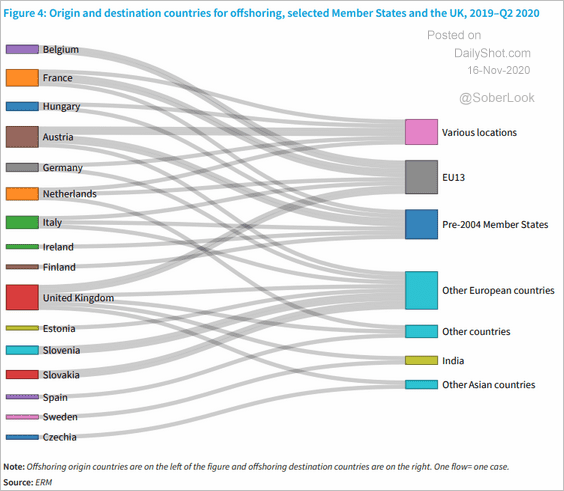
3. This chart shows the origin and destination for offshoring by the EU and the UK.
 Source: Eurofound Read full article
4. The COVID situation continues to pressure economic activity.
• ICU hospitalizations:
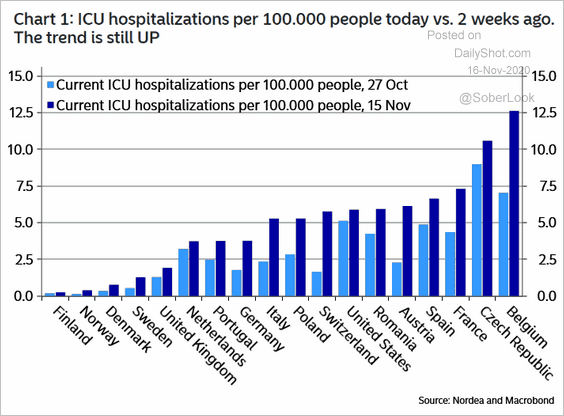 Source: Nordea Markets
• COVID cases:
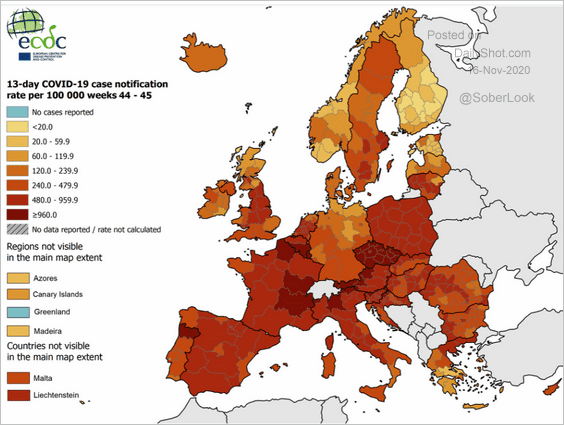 Source: ECDC Read full article
• Mobility trends:
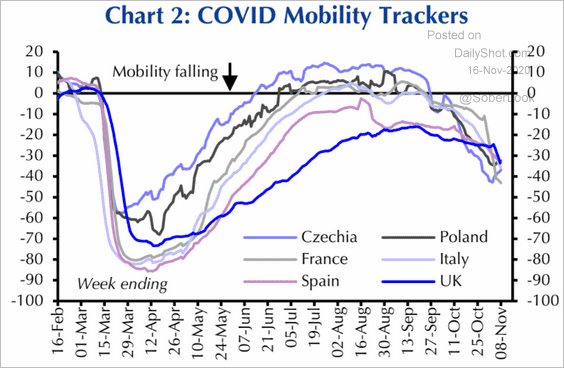 Source: Capital Economics
Japan
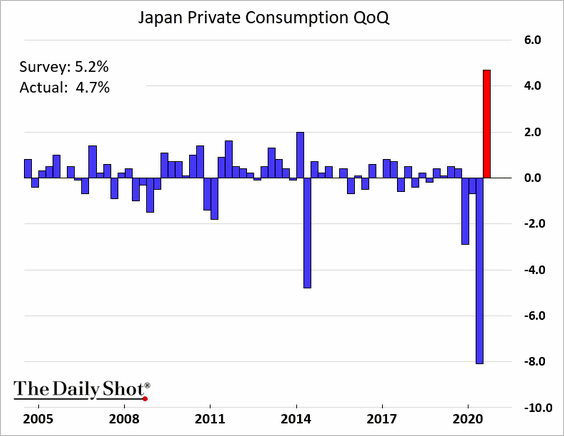
1. The Q3 GDP rebound was a bit better than expected.
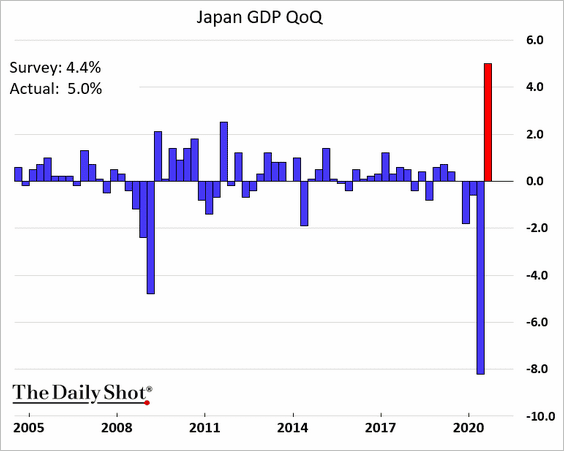
However, the GDP beat (above) has been driven by stronger exports. The recovery in private domestic demand was weaker than expected.
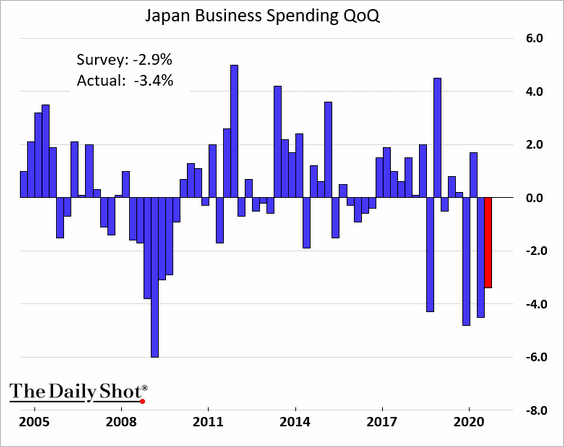
Business spending declined again.
Here are the contributions to the GDP.
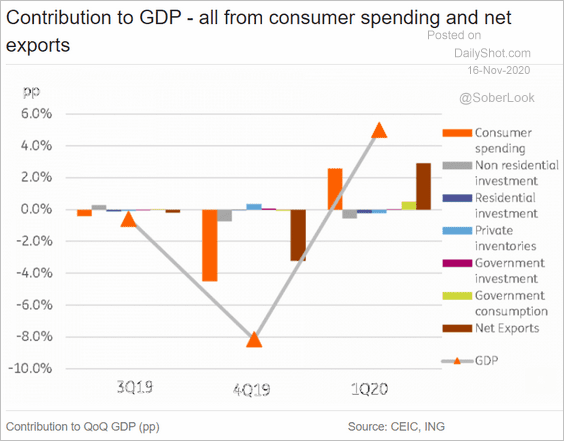 Source: ING
——————–
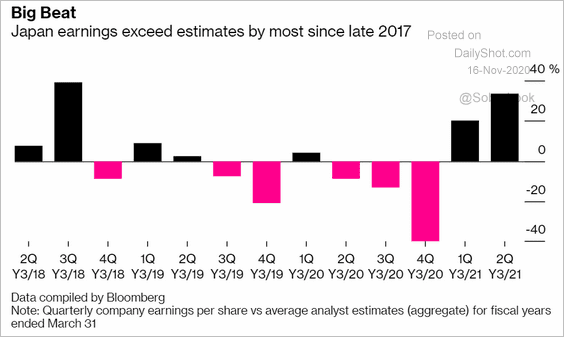
2. Corporate earnings have been exceeding expectations.
 Source: @markets Read full article
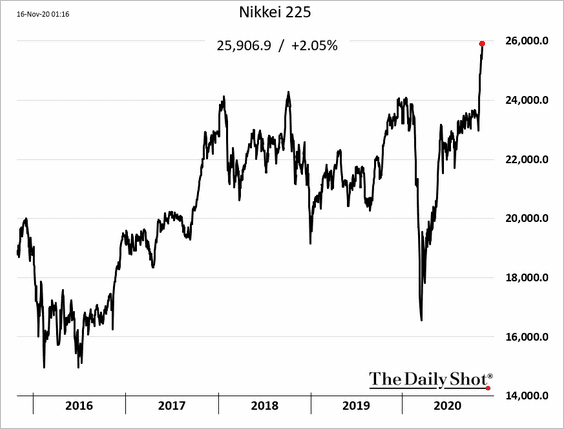
Foreign inflows continue to drive the stock market sharply higher.
Asia – Pacific
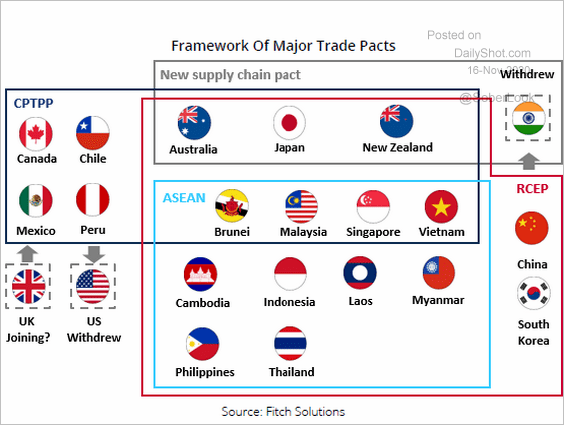
1. Fifteen Asia-Pacific nations signed a massive trade pact.
 Source: ABC News Read full article
The red frame in the graphic below outlines the trade group.
 Source: Fitch Solutions Macro Research
——————–
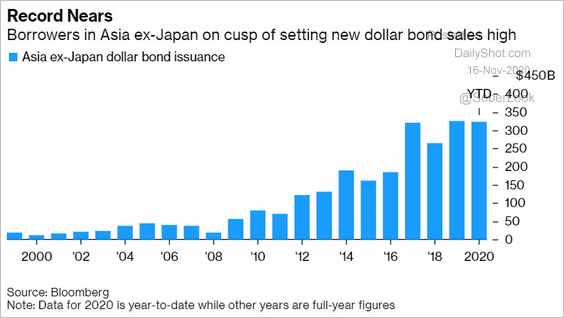
2. Asian borrowers’ USD bond sales are approaching a record high.
 Source: @markets Read full article
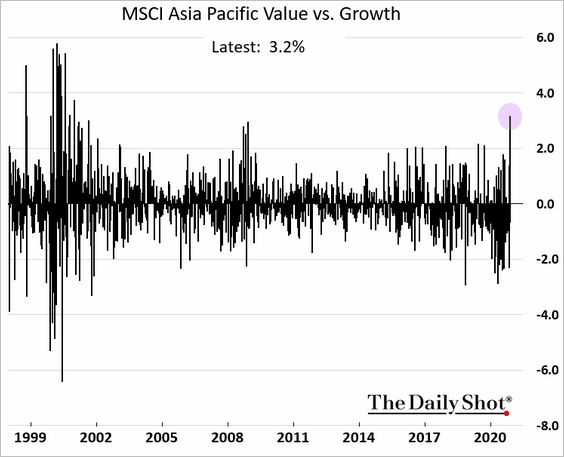
3. Last week’s growth-value rotation in Asian stocks was impressive.
 Source: @IshikaMookerjee
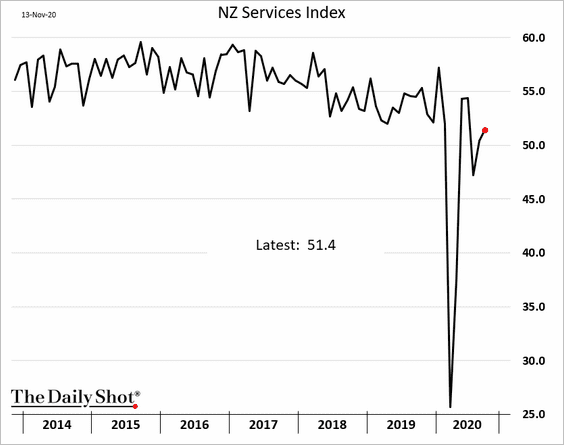
4. New Zealand’s service sector continues to recover.
China
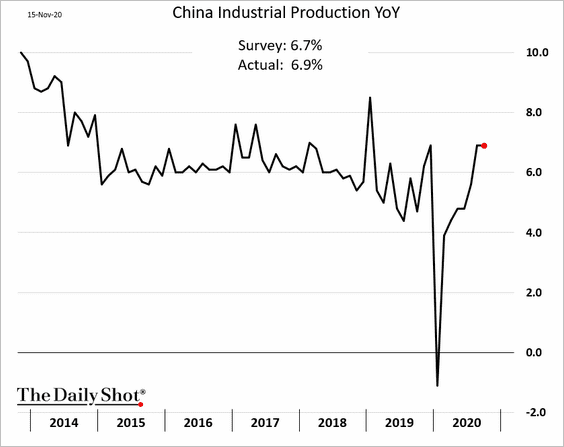
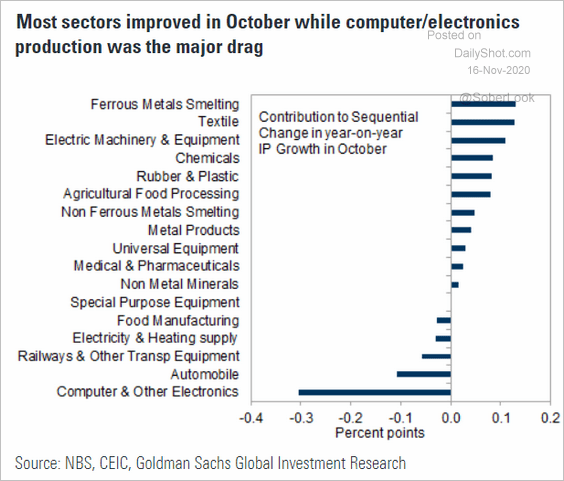
1. Industrial production remains robust, with the October figure exceeding forecasts.
Here is the breakdown by sector.
 Source: Goldman Sachs
——————–
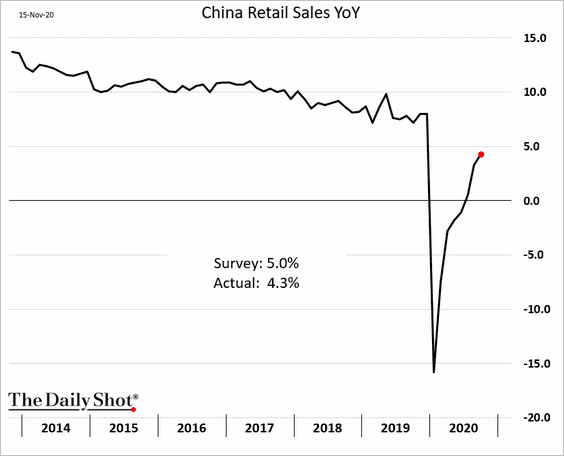
2. The rebound in retail sales continues, albeit somewhat slower than expected.
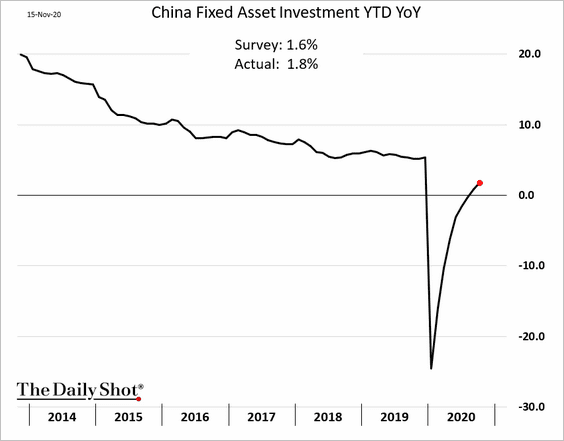
3. Fixed-asset investment is now above last year’s levels.
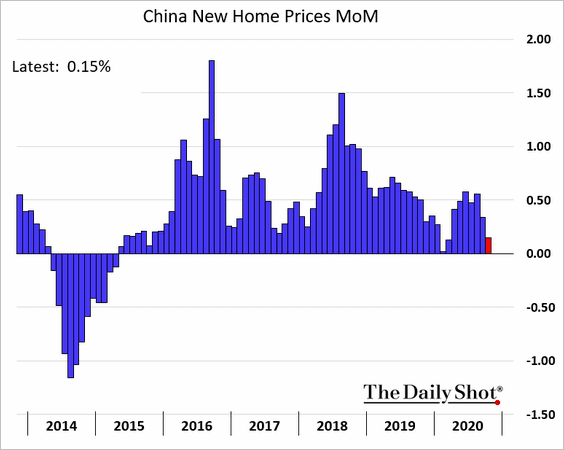
4. Gains in new home sales have slowed.
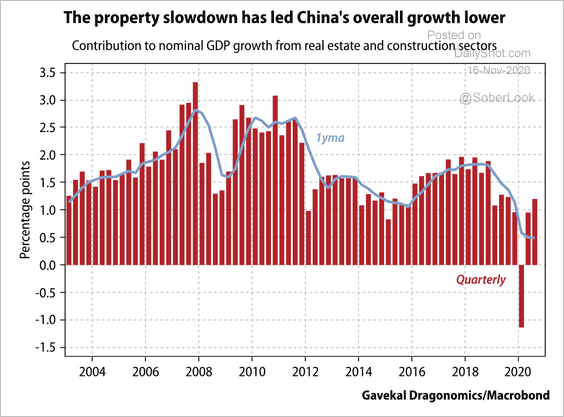
• The property market has been decelerating over the past 15 years.
 Source: Gavekal
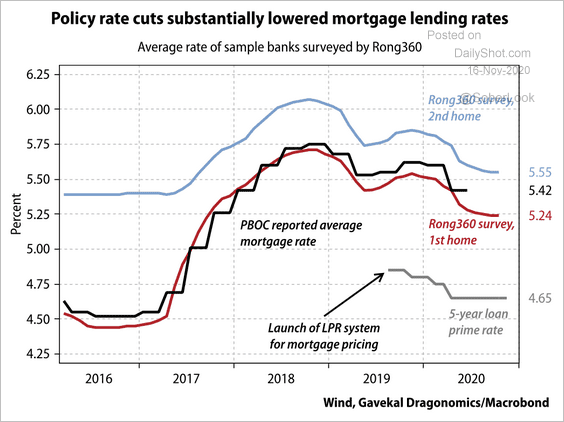
• Will policy easing pump some life into the housing market?
 Source: Gavekal
• The gap between housing sales and starts is narrowing.
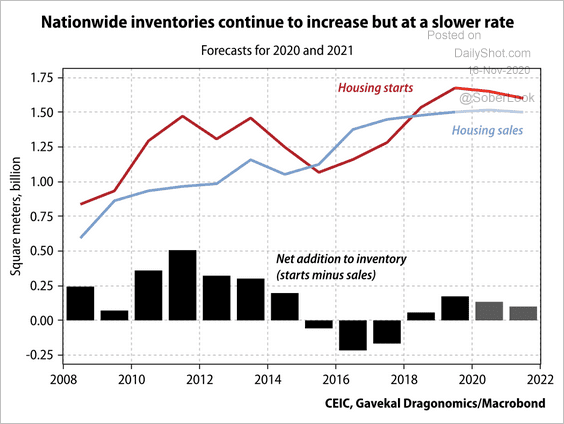 Source: Gavekal
——————–
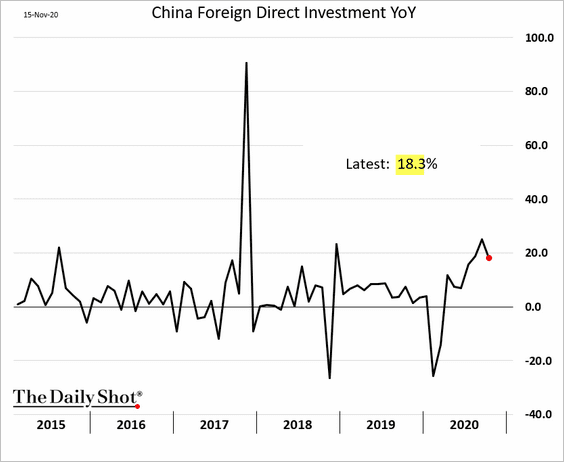
5. Foreign direct investment has been strong.
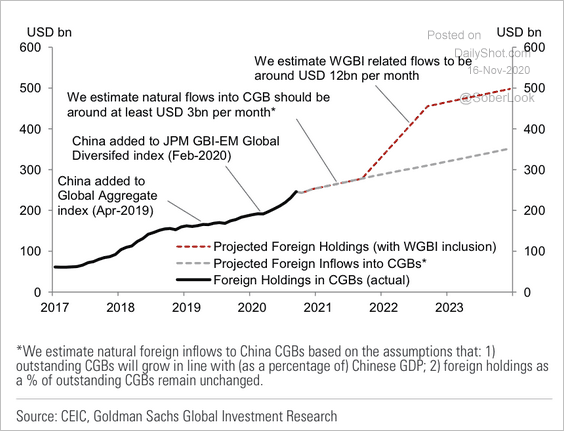
6. The renminbi continues to climb.
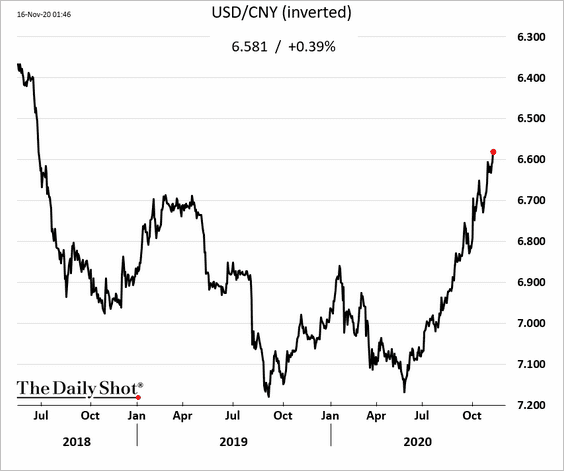
Goldman expects a secular rotation into CNY fixed income markets.
 Source: Goldman Sachs
——————–
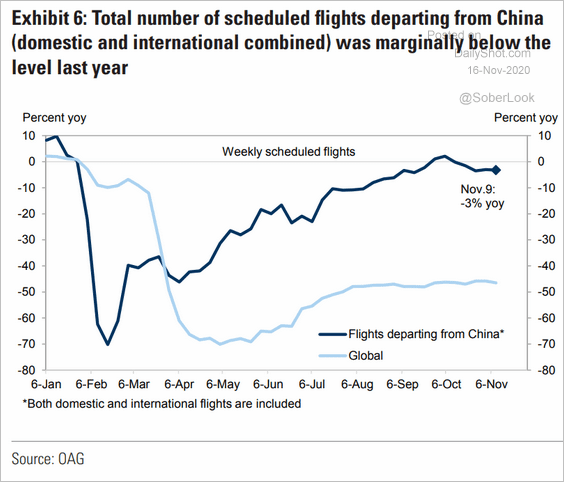
7. Flight departures from China (international and domestic) are near last year’s levels. As a comparison, flights are almost 50% below 2019 levels globally.
 Source: Goldman Sachs
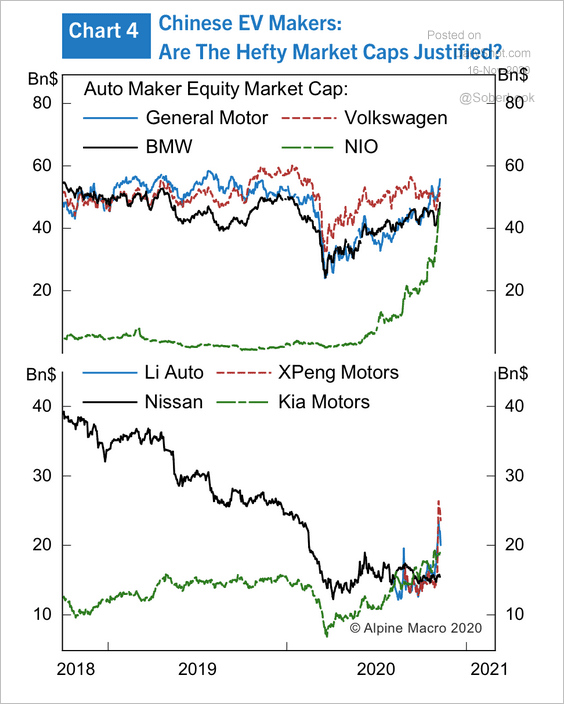
8. The market cap of Chinese electric vehicle companies have quickly caught up to traditional automakers.
 Source: Alpine Macro
Emerging Markets
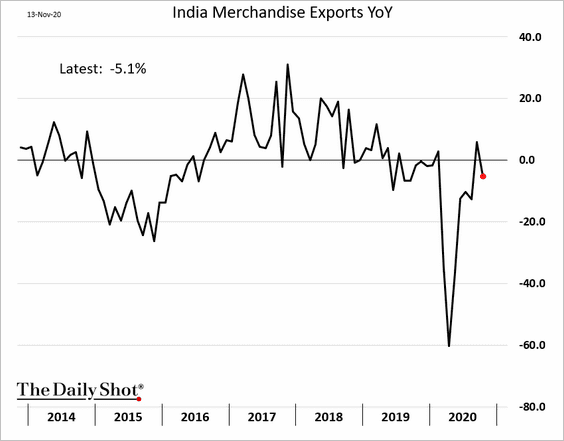
1. India’s exports declined again.
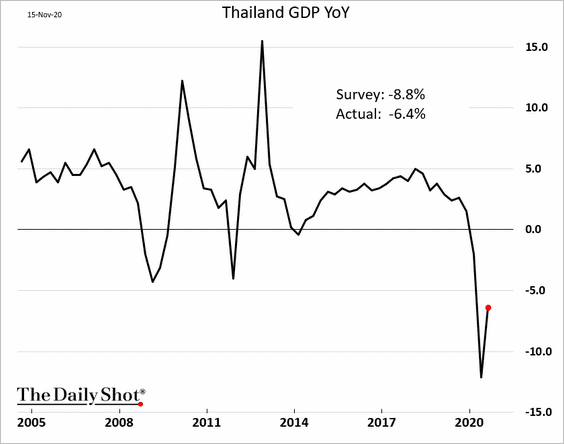
2. Thailand’s GDP rebound was stronger than expected, but there is a long way to go.
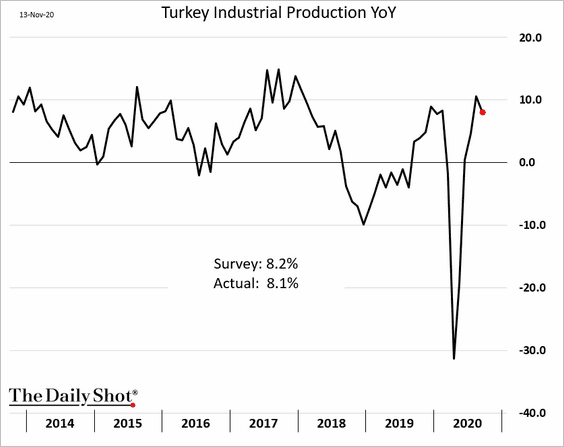
3. Turkey’s industrial production remains strong.
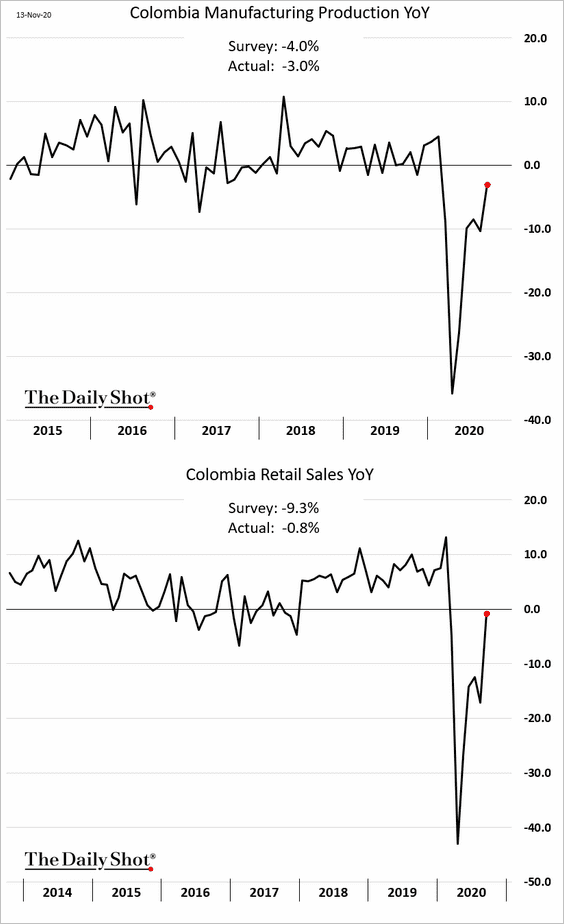
4. Colombia’s economy is recovering quickly, as retail sales surprise to the upside.
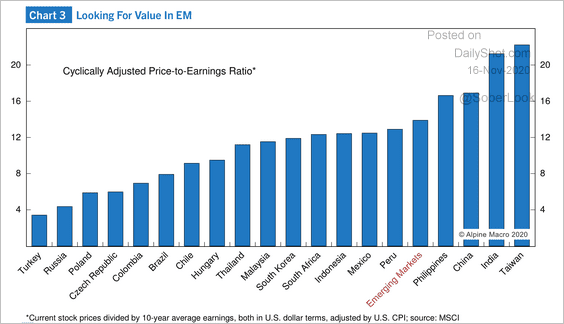
5. Here is a look at equity market valuations by country.
 Source: Alpine Macro
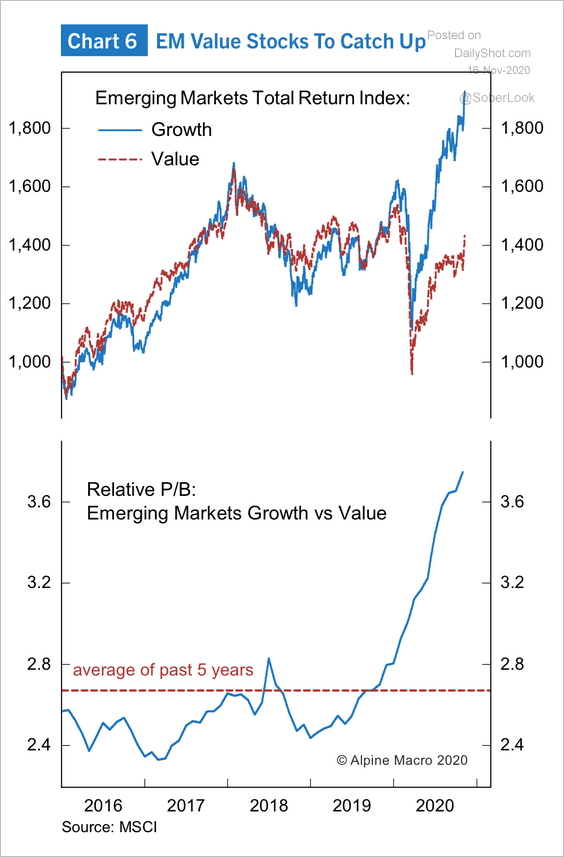
Will EM value stocks catch up to growth?
 Source: Alpine Macro
——————–
6. This chart shows foreign-currency borrowings as a percentage of GDP.
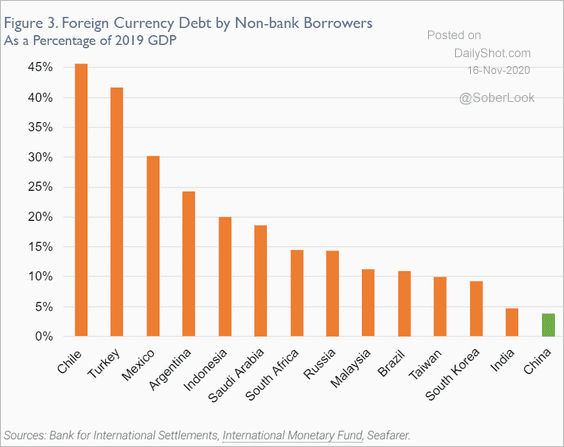 Source: Seafarer Capital Partners
Cryptocurrency
The net demand for bitcoin call options is outstripping the demand for puts. The options market is extremely bullish.
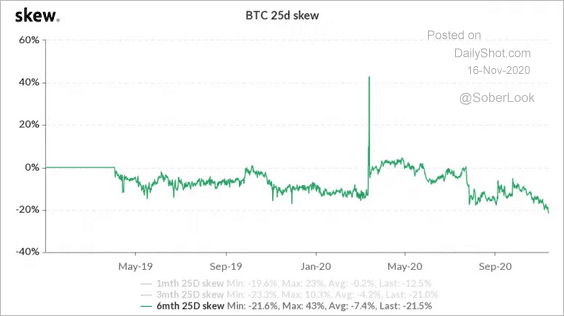 Source: CoinDesk Read full article
Commodities
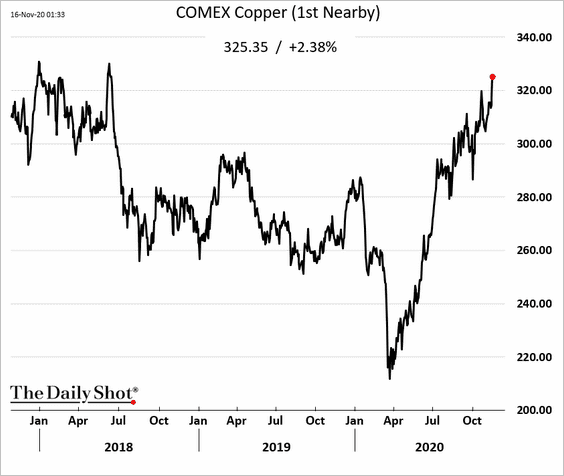
1. US copper futures hit the highest level since mid-2018.
2. The falling gold/CRB commodity index ratio is consistent with reflationary policies gaining traction, according to TS Lombard.
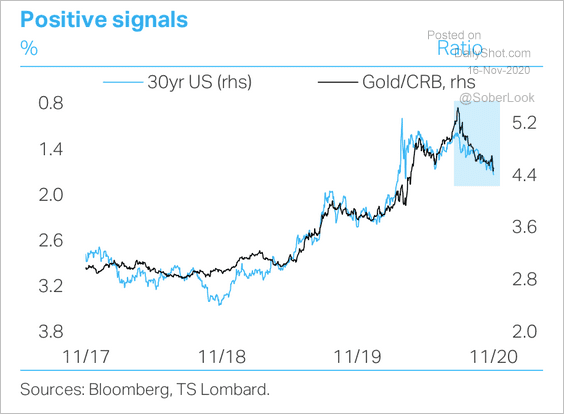 Source: TS Lombard
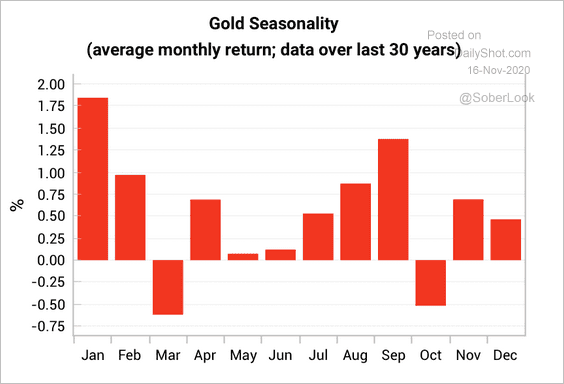
3. January tends to be a strong month for gold prices.
 Source: Variant Perception
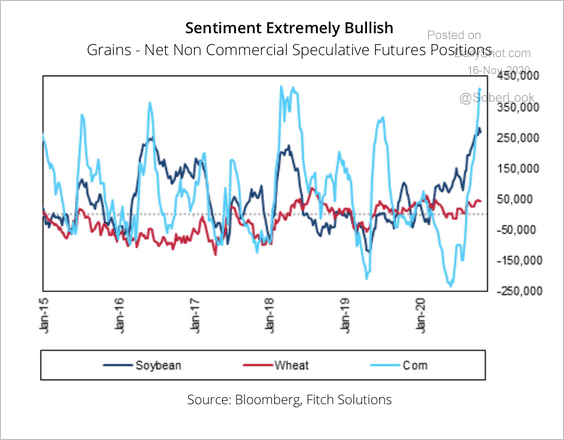
4. Speculative long positioning in grains futures is at an extreme.
 Source: Fitch Solutions Macro Research
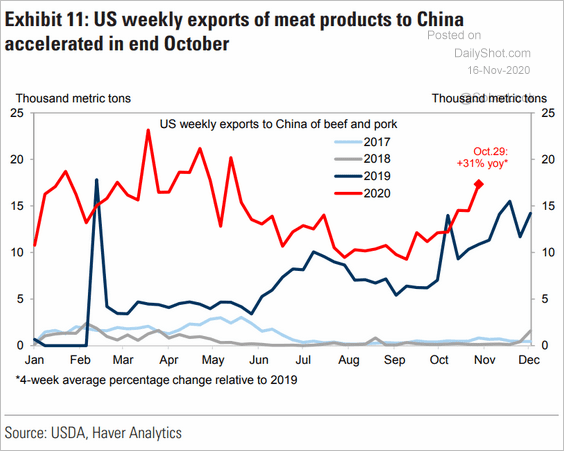
5. US meat exports to China remain well above last year’s levels.
 Source: Goldman Sachs
Energy
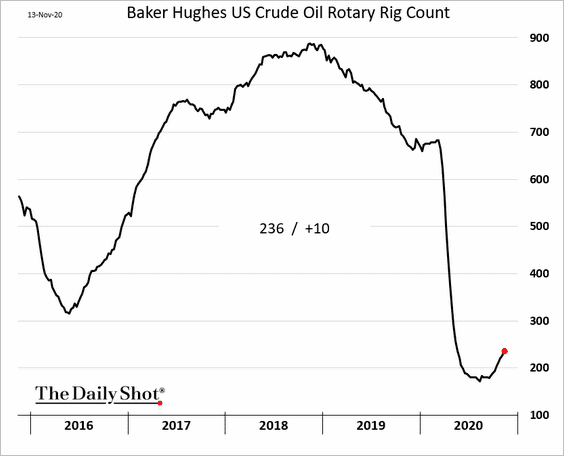
1. The number of US oil rigs continues to rebound.
2. A recovery in global oil demand over the next two years could trigger a turnaround in energy stocks.
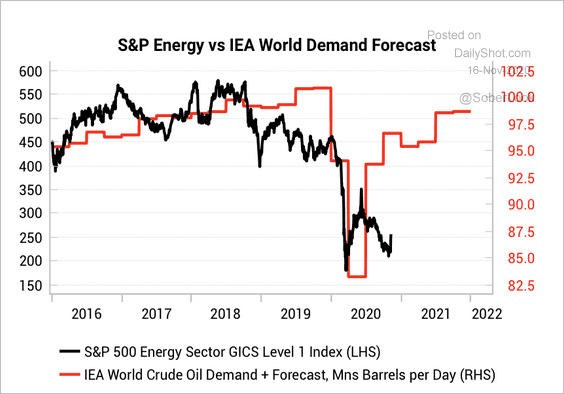 Source: Variant Perception
3. The performance gap between clean energy ETFs and broad energy ETFs is starting to narrow.
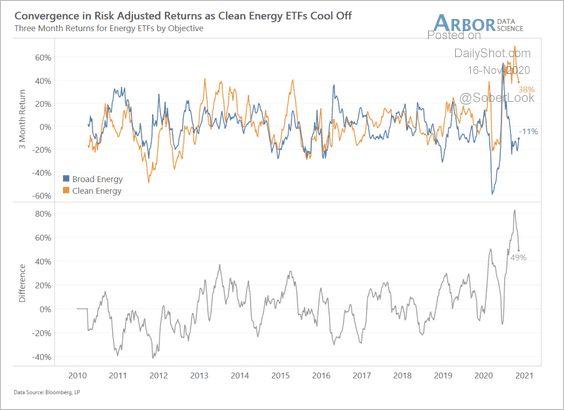 Source: Arbor Research & Trading
Equities
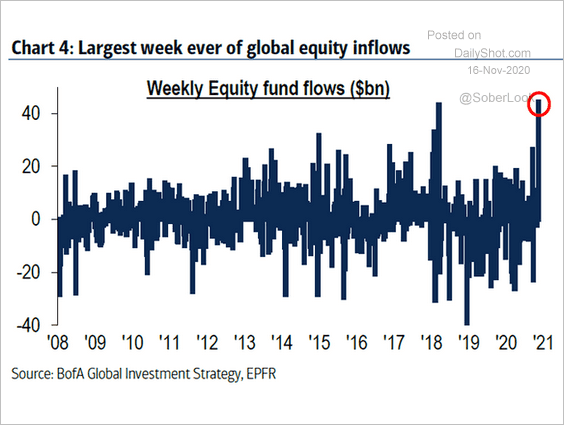
1. The S&P 500 hit a record high amid massive equity inflows.
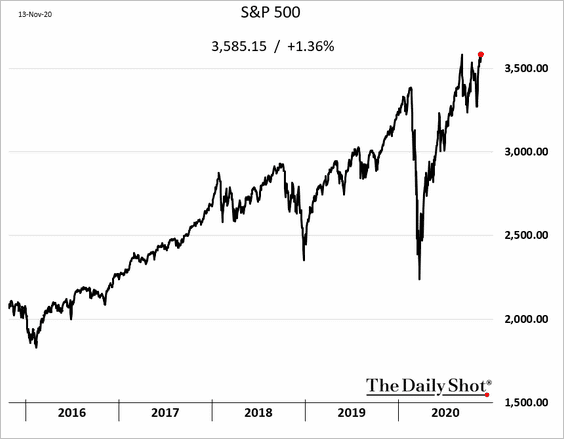
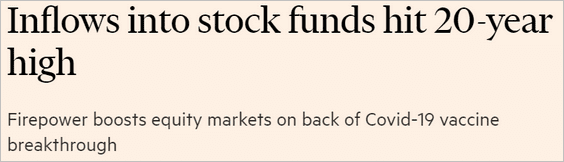 Source: @financialtimes Read full article
 Source: @ISABELNET_SA, @BofAML
——————–
2. Market concentration is now well above the 2000 peak.
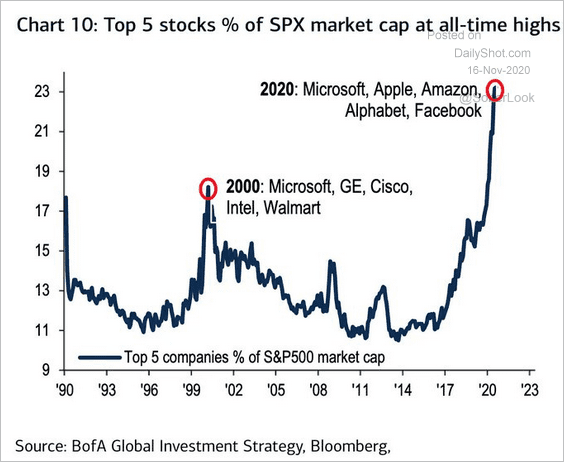 Source: BofA Global Research, @jessefelder, @TruthGundlach Read full article
3. How does the S&P 500 perform after more than 85% of its components climb above their 200-day moving average?
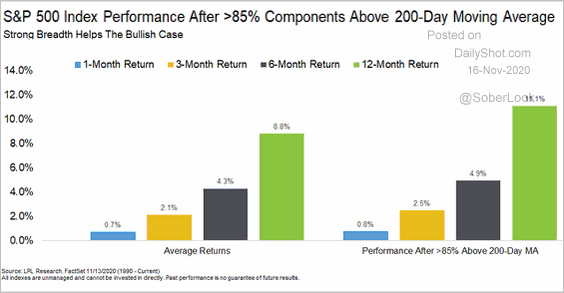 Source: @RyanDetrick
4. Value stocks are particularly sensitive to vaccine news.
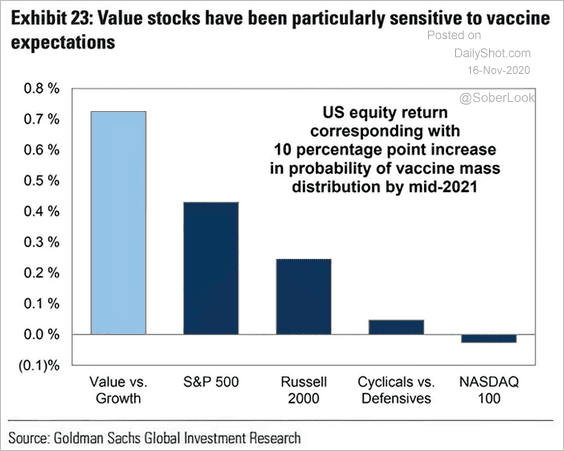 Source: @ISABELNET_SA, @GoldmanSachs
5. Small caps have performed well in recent weeks.
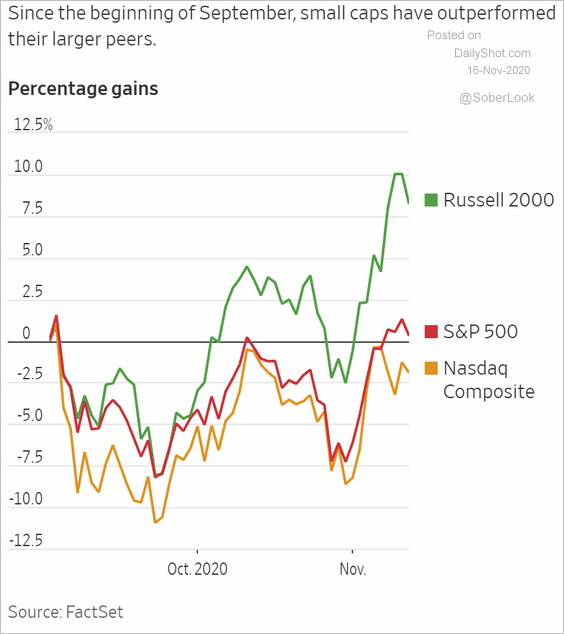 Source: @WSJ Read full article
The rise in small business optimism bodes well for small-cap stocks. However, given the election outcome, the NFIB index will probably decline this month (just as it rose in 2016).
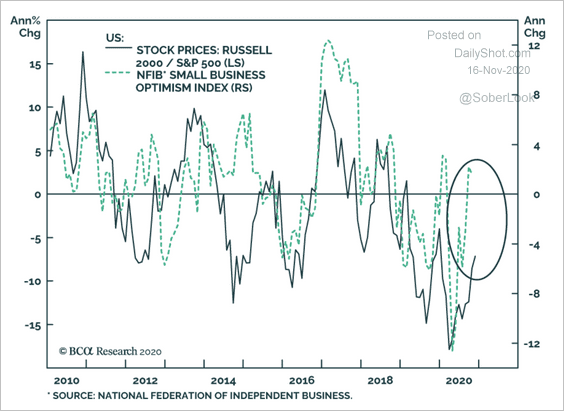 Source: BCA Research
——————–
6. Insiders have been selling into the rally.
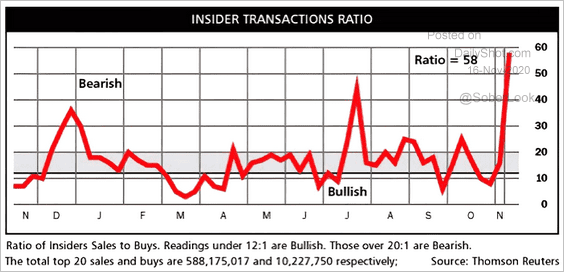 Source: Thomson Reuters, Barron’s, @ISABELNET_SA
Bullish positioning looks stretched.
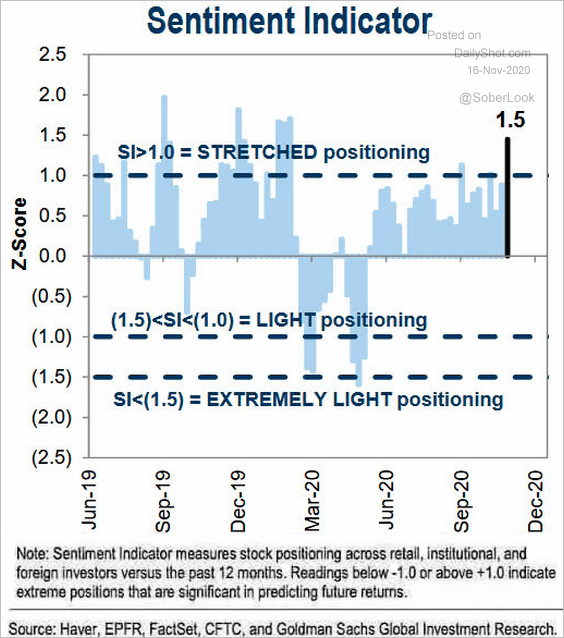 Source: Goldman Sachs, @ISABELNET_SA
——————–
7. This chart shows the S&P 500 CapEx growth.
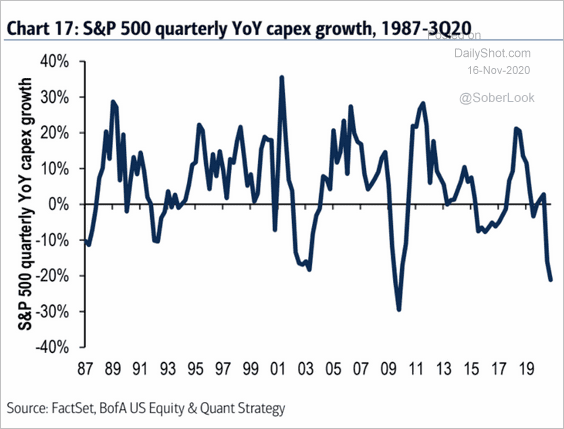 Source: BofA Global Research
Rates
1. US inflation pressures have moderated over the past few months, causing the 10-year breakeven rate (inflation expectations) to flatten.
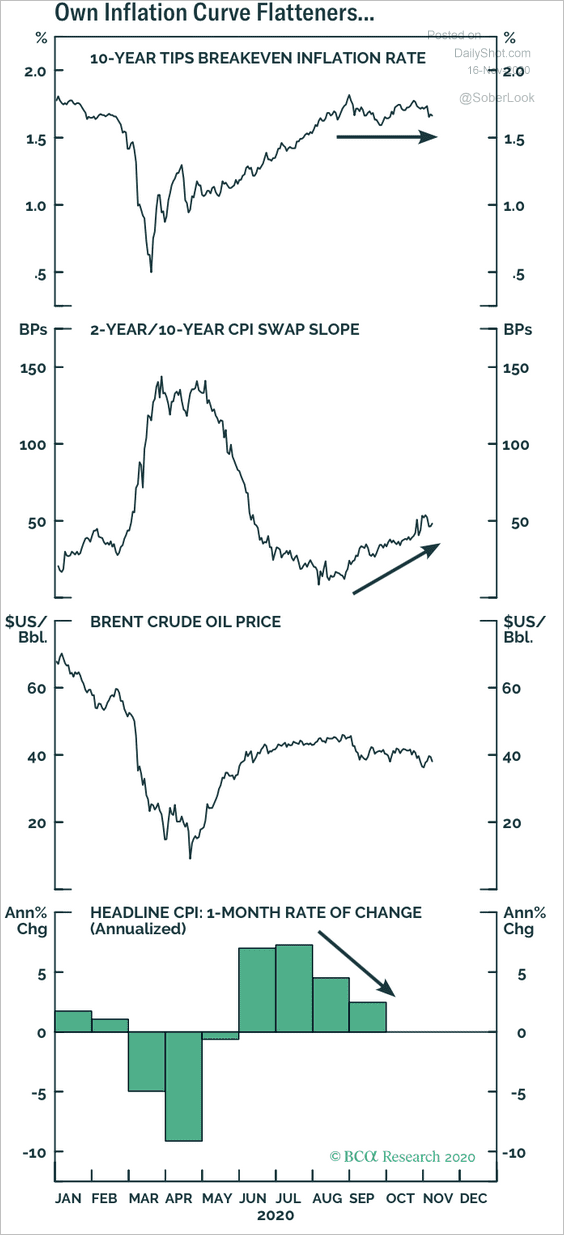 Source: BCA Research
2. The US is leading the way higher in yields.
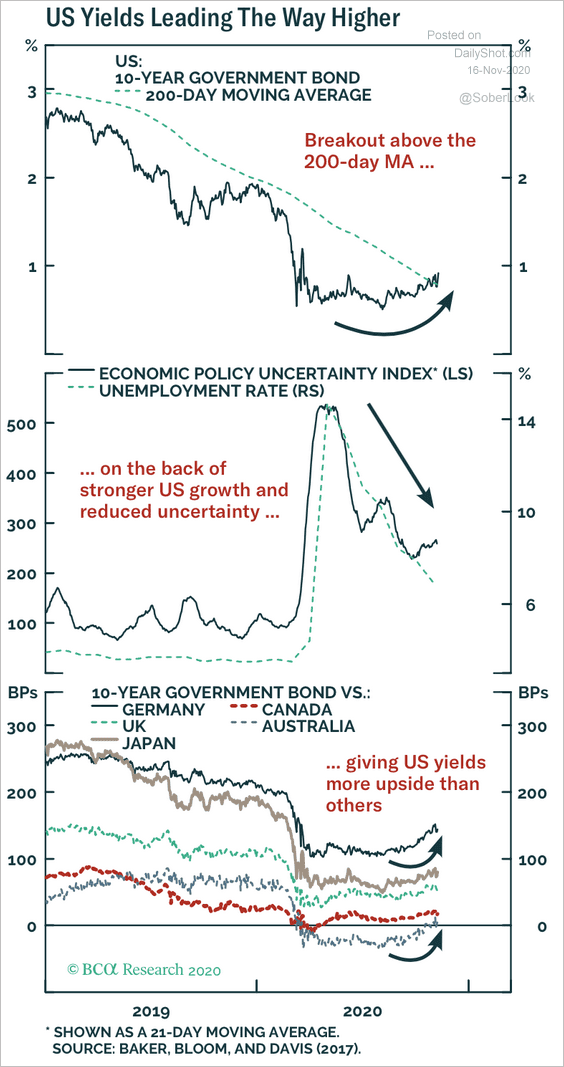 Source: BCA Research
Global Developments
1. Let’s start with Bloomberg’s high-frequency indicators of economic activity.
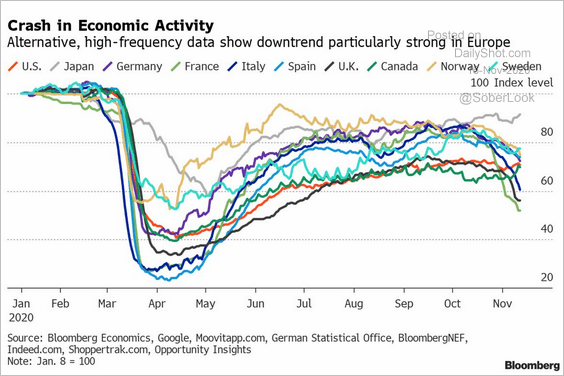 Source: @business Read full article
2. How much of the early-2020 losses have different asset classes recovered?
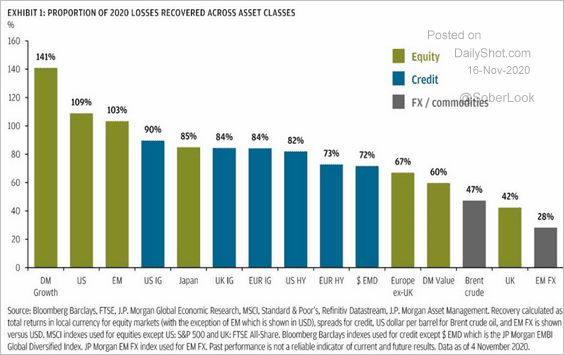 Source: JP Morgan Asset Management, @jsblokland
3. Here is a forecast for the global GDP share by region.
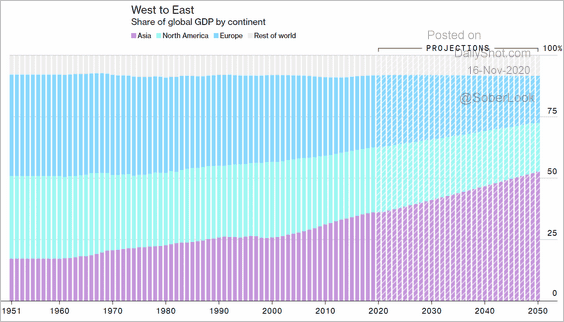 Source: @bw Read full article
4. Stock market capitalization hit another record high.
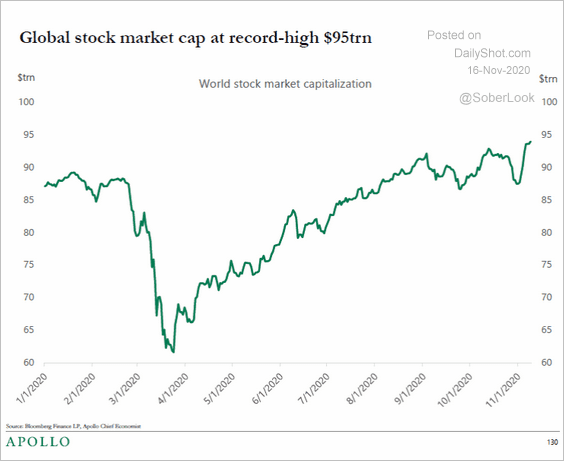 Source: Torsten Slok, Apollo
5. Below is an illustration of the COVID death toll by region.
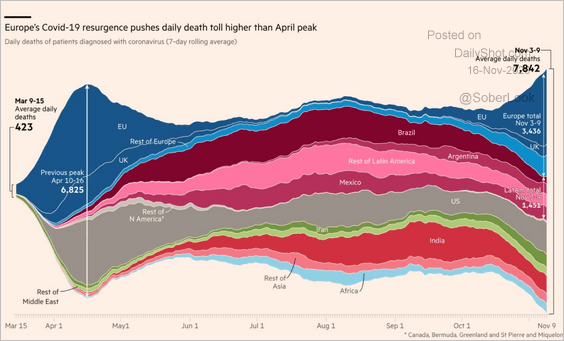 Source: @adam_tooze, @financialtimes Read full article
——————–
Food for Thought
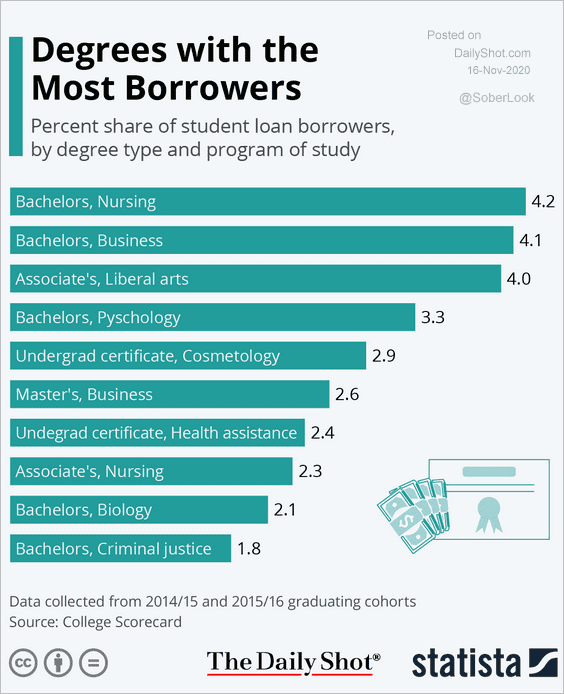
1. College degrees with the highest share of student loan borrowers:
 Source: Statista
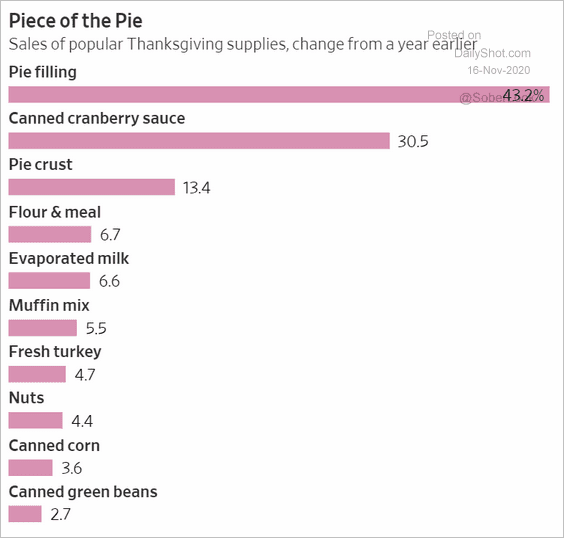
2. Sales of popular Thanksgiving supplies relative to last year:
 Source: @WSJ Read full article
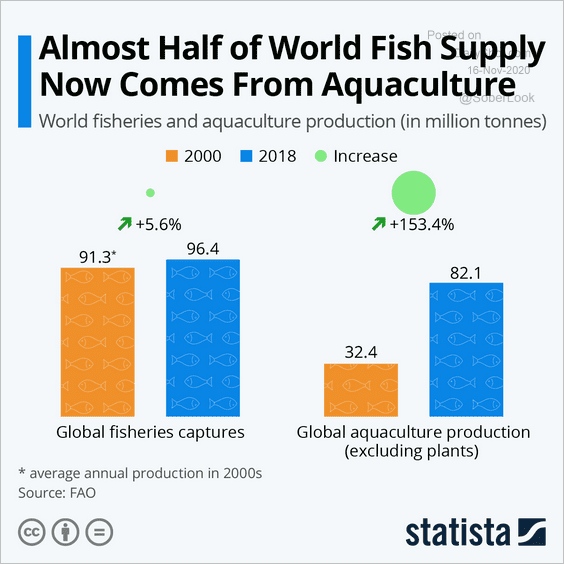
3. Aquaculture:
 Source: Statista
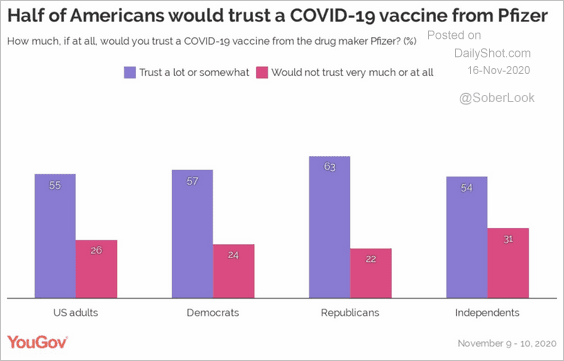
4. Trust in Pfizer’s vaccine:
 Source: YouGov America
5. Vaccine-preventable diseases:
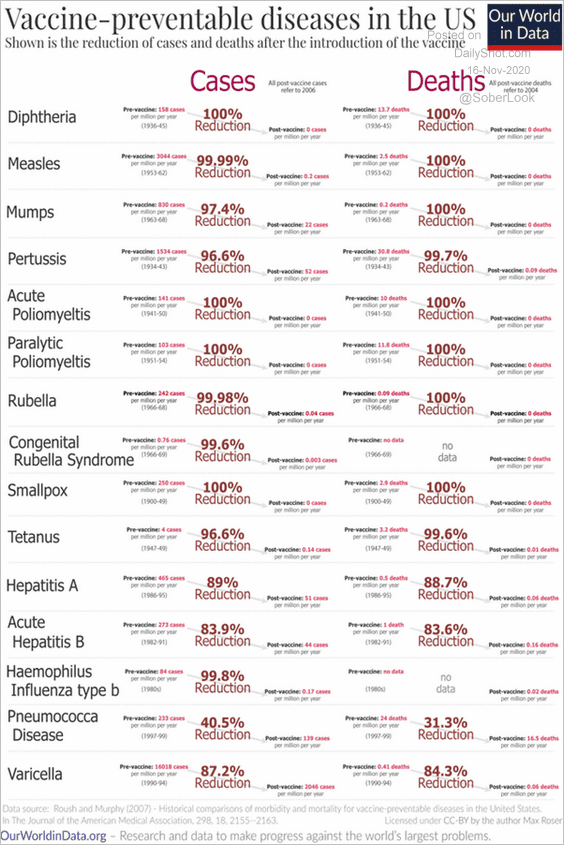 Source: @MaxCRoser Read full article
6. Religious vs. political affiliation:
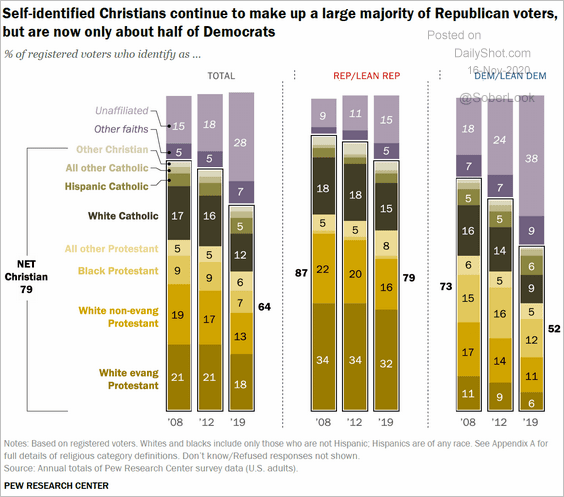 Source: @PewReligion Read full article
7. International opinion of the US pre- and post-elections:
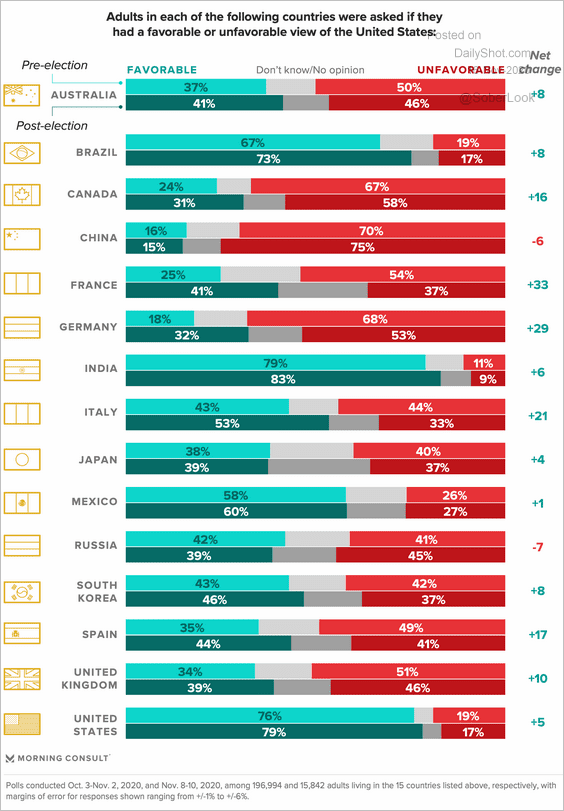 Source: Morning Consult Read full article
8. Natural disasters:
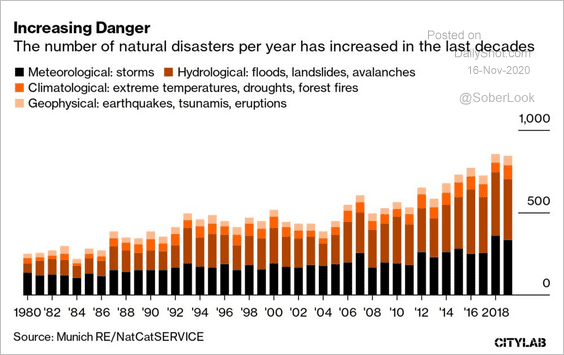 Source: @citylab Read full article
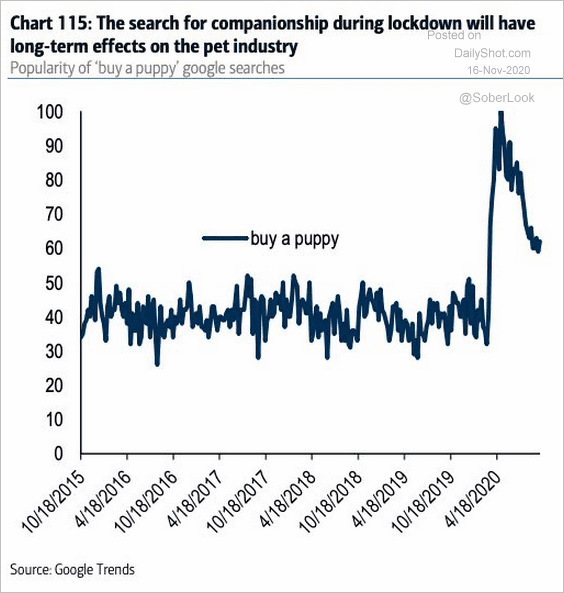
9. Google search activity for “buy a puppy”:
 Source: Goldman Sachs, @pkedrosky
——————–