
The Daily Shot: 30-Nov-20
• Administrative Update
• The United States
• The United Kingdom
• The Eurozone
• Europe
• Japan
• Asia – Pacific
• China
• Emerging Markets
• Cryptocurrency
• Commodities
• Energy
• Equities
• Global Developments
• Food for Thought
Administrative Update
The Google search tool is now operational on the website (TheDailyShot.com).
• It takes a couple of days for new posts to be indexed.
• Just like on Google, use quotes to search for a specific phrase.

• It is possible to sort by date or relevance.

• If you select the “image” page, the search tool will display the most relevant/newest charts.
The United States
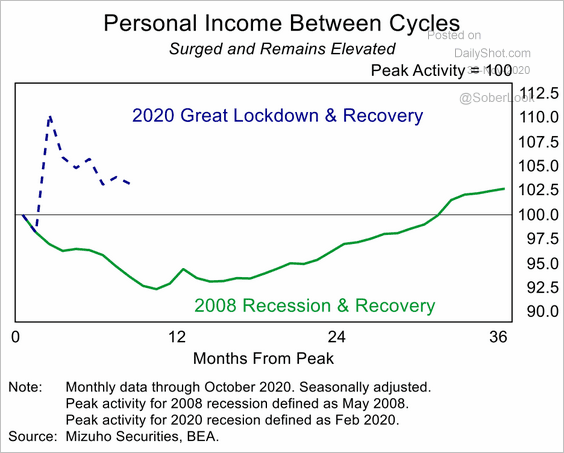
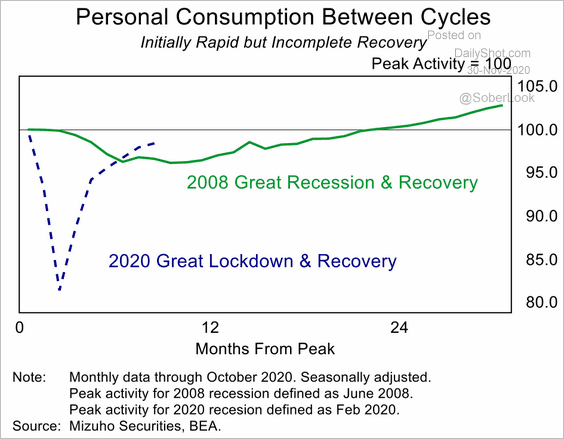
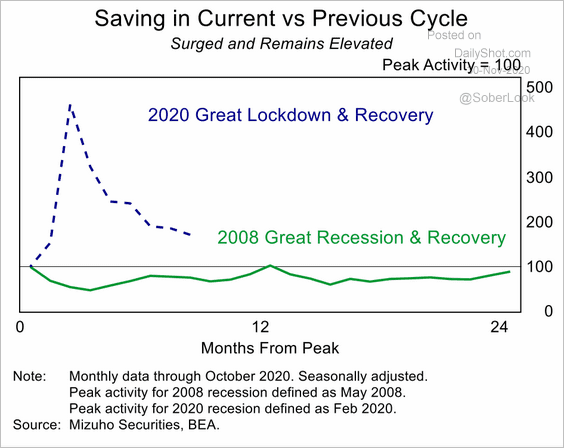
1. Consumer spending growth eased in October as incomes declined.
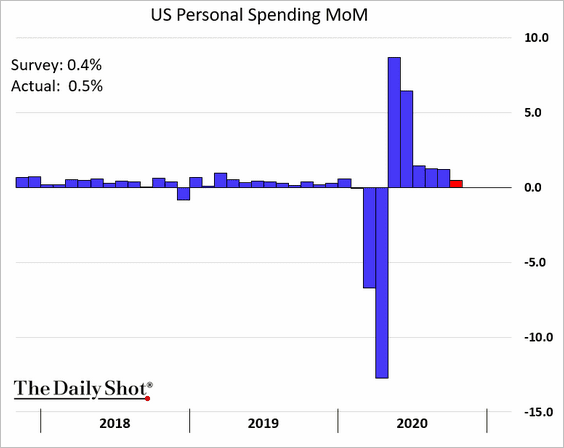
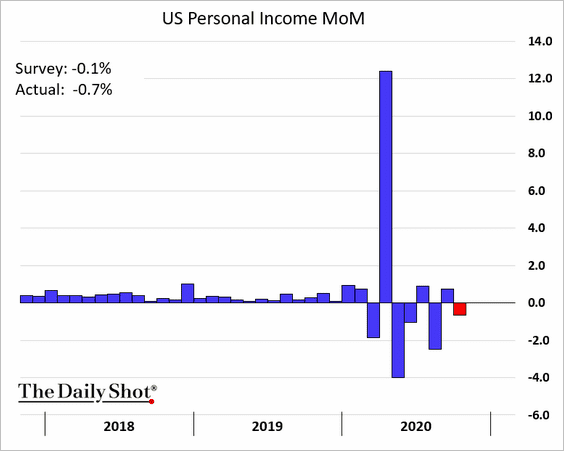
Here are the comparisons vs. 2008 for income, spending, and savings.
 Source: Mizuho Securities USA
 Source: Mizuho Securities USA
 Source: Mizuho Securities USA
This chart shows personal income excluding government transfers.
![]() Source: Mizuho Securities USA
Source: Mizuho Securities USA
——————–
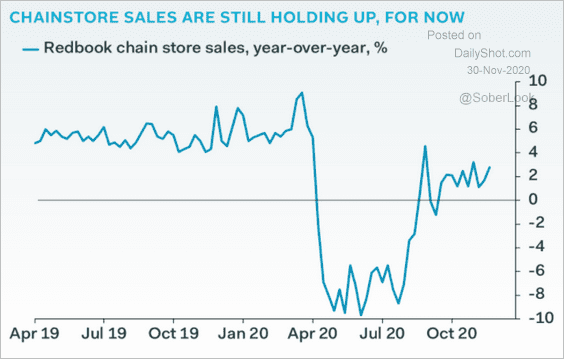
2. High-frequency indicators suggest that spending remained resilient this month.
• Redbook same-store sales:
 Source: Pantheon Macroeconomics
• Bank of America credit/debit card spending:
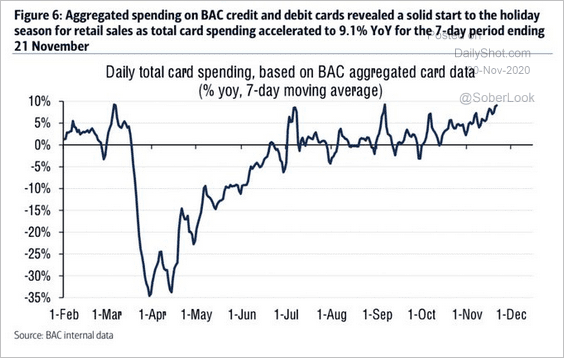 Source: BofA Global Research, @WallStJesus
——————–
3. Despite the warnings, many Americans traveled for Thanksgiving.
• Airport activity:
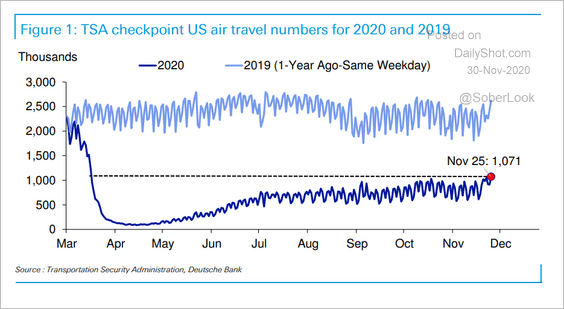 Source: Deutsche Bank Research
• Driving mobility:
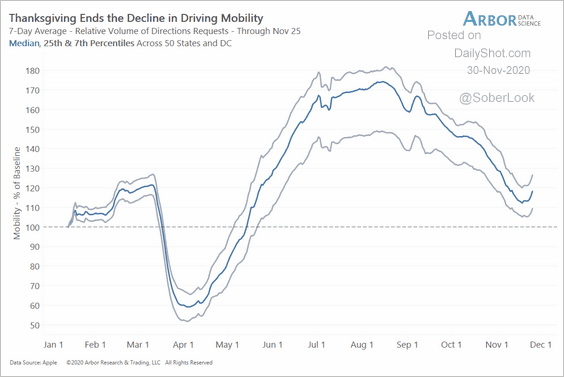 Source: Arbor Research & Trading
——————–
4. Initial jobless claims rose again.
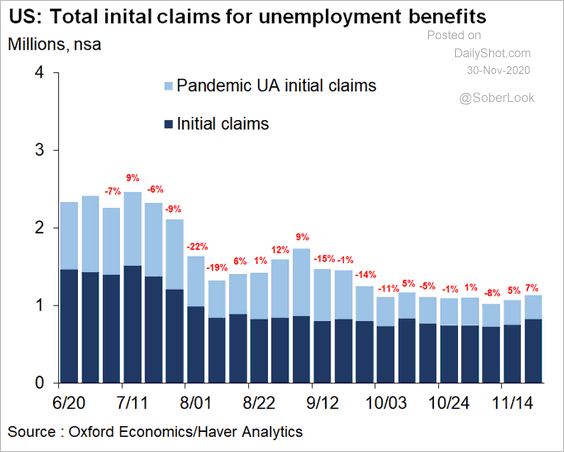 Source: @GregDaco
Many Americans are about to lose their emergency unemployment benefits, widening the “K-shaped” recovery gap.
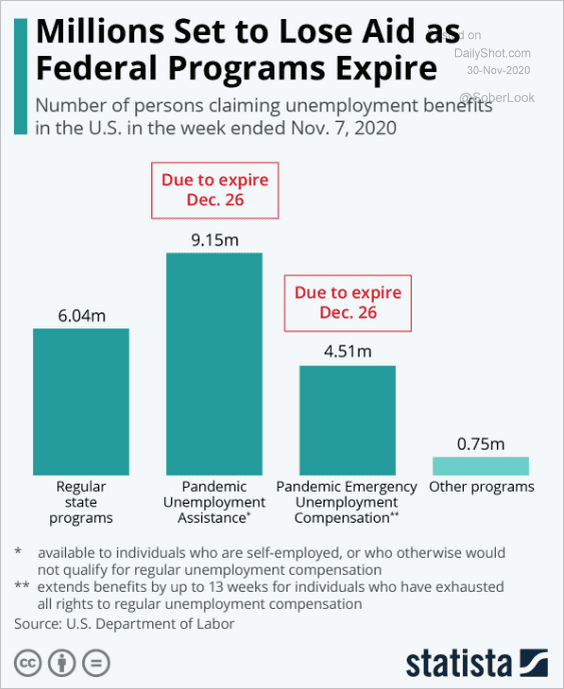 Source: Statista
——————–
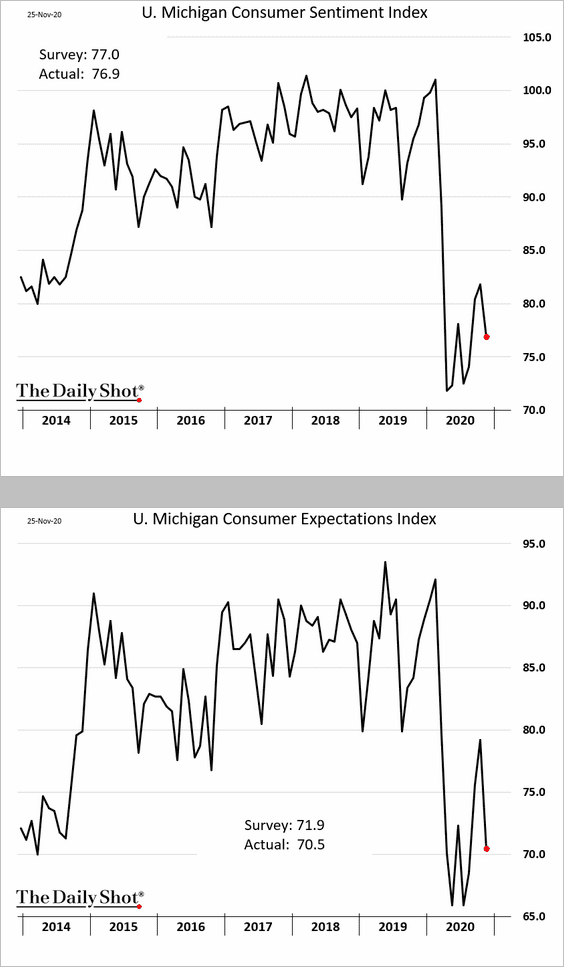
5. Consumer sentiment remains soft.
6. The pandemic continues to pose risks for the recovery.
• COVID-related hospitalizations (a new record):
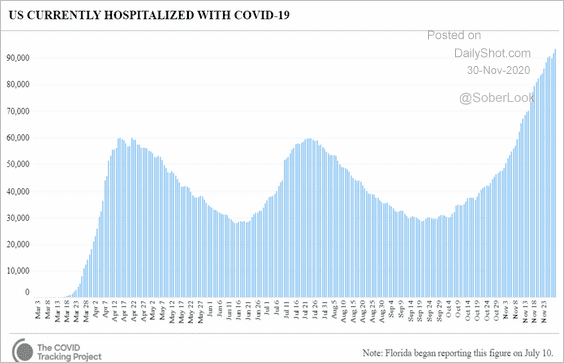 Source: CovidTracking.com
• The ANZ Activity Tracker:
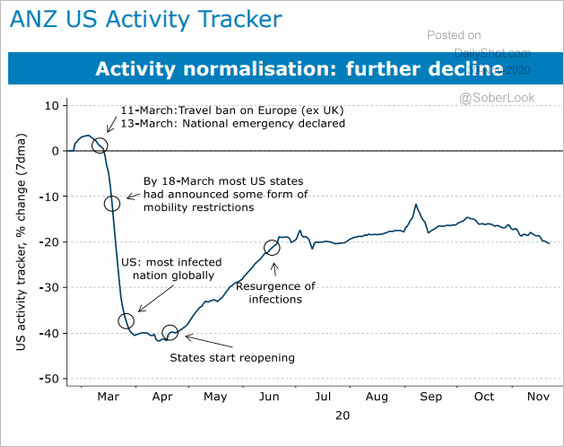 Source: ANZ Research
• The University of Oxford Government Response Stringency index (lockdowns):
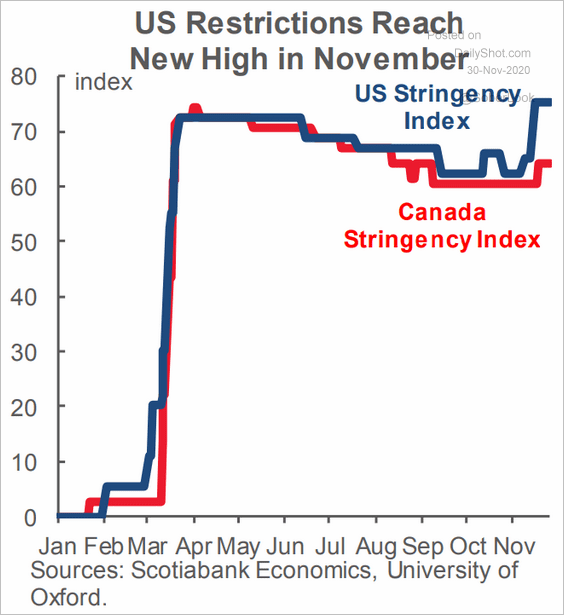 Source: Scotiabank Economics
——————–
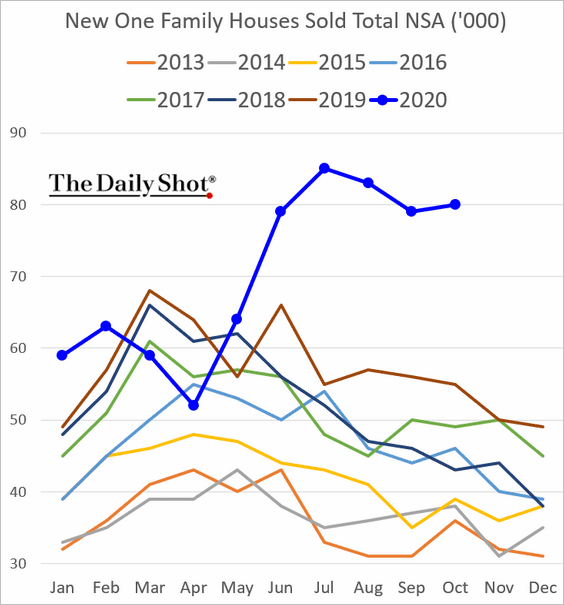
7. Next, we have some updates on the housing market.
• New home sales hit a multi-year high (for this time of the year).
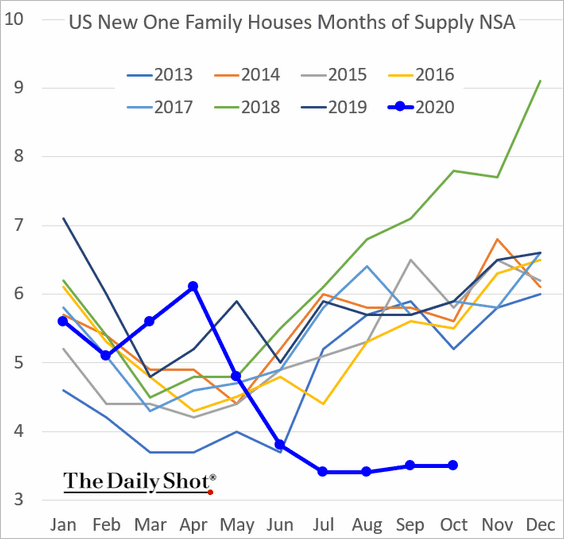
• New home inventories remain depressed.
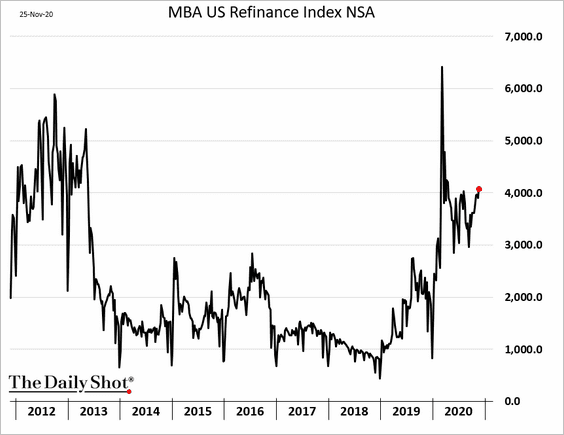
• Mortgage applications to purchase a house are still elevated.
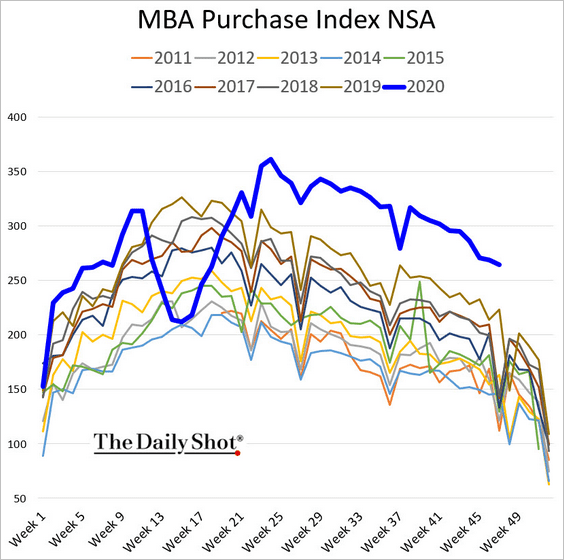
Refi activity is also robust.
——————–
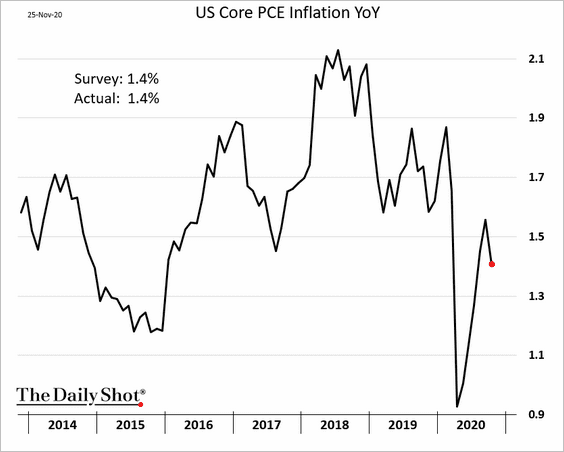
8. The October PCE inflation (the Fed’s preferred measure) declined in line with expectations.
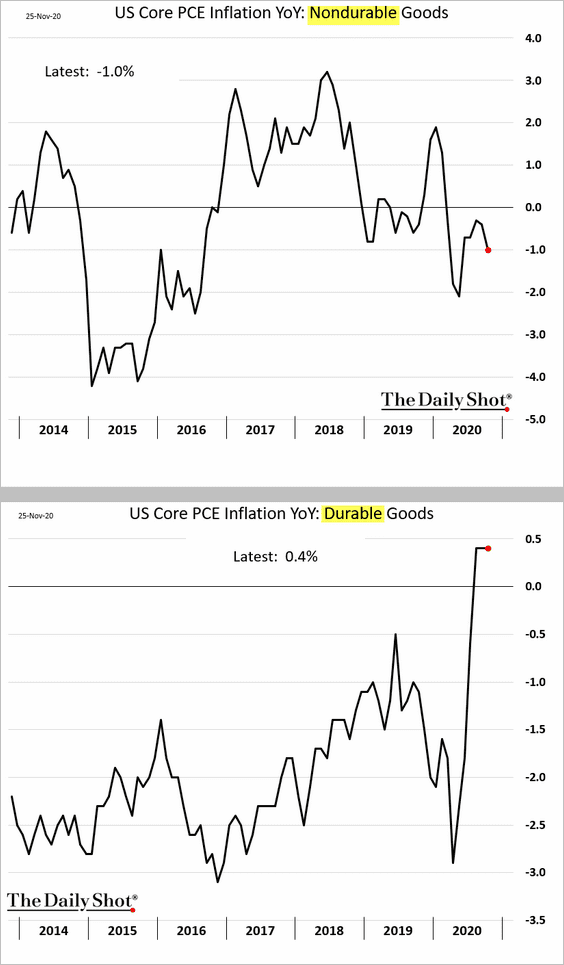
Here is the PCE index for durable and nondurable goods.
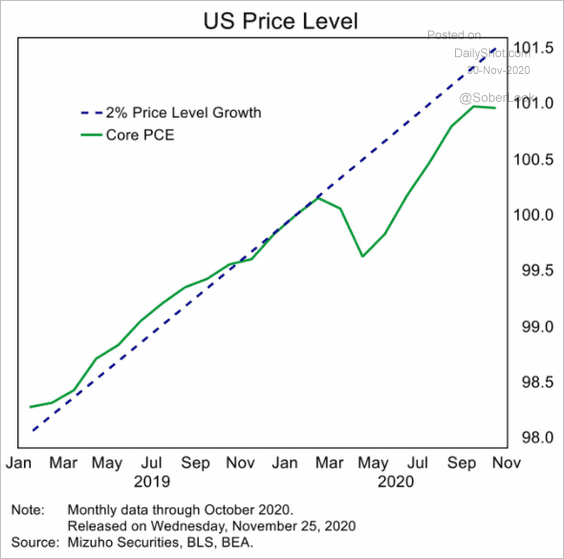
And this chart shows the PCE trajectory relative to the 2% target.
 Source: Mizuho Securities USA
——————–
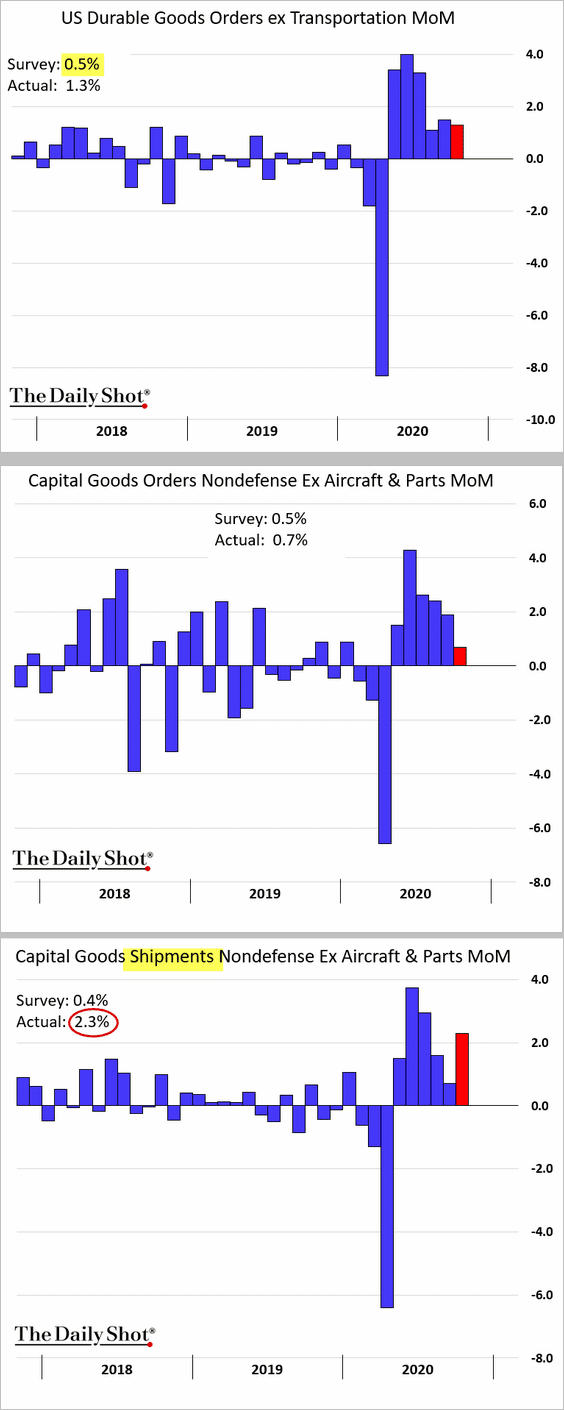
9. The October durable goods orders report surprised to the upside. Shipments of capital goods (machinery, equipment, etc.) were especially strong (third panel below), suggesting a further increase in business spending.
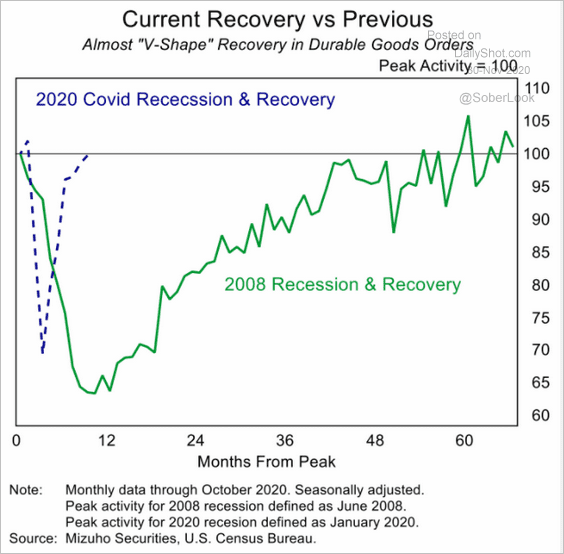
The recovery in durable goods orders has been impressive (V-shape).
 Source: Mizuho Securities USA
——————–
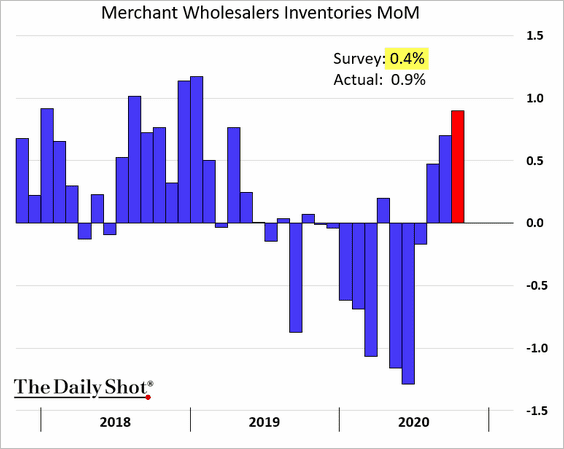
10. Inventory rebuilding accelerated last month, further boosting demand for imports.
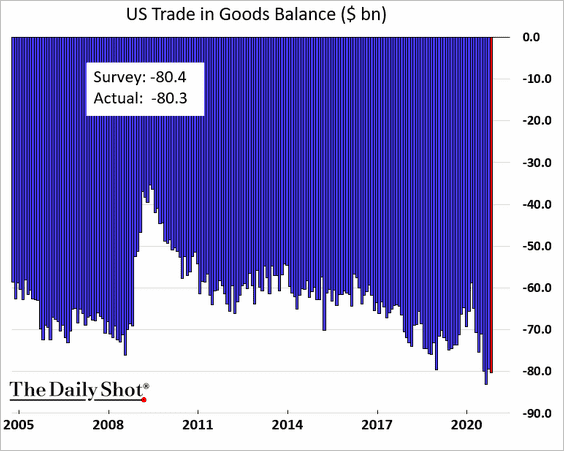
The trade deficit in goods remains near record levels.
——————–
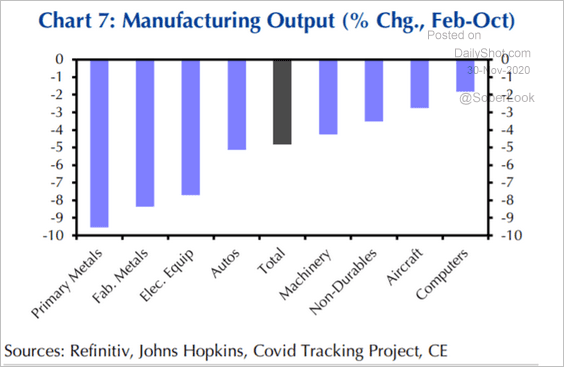
11. This chart shows the nation’s manufacturing output since February by sector.
 Source: Capital Economics
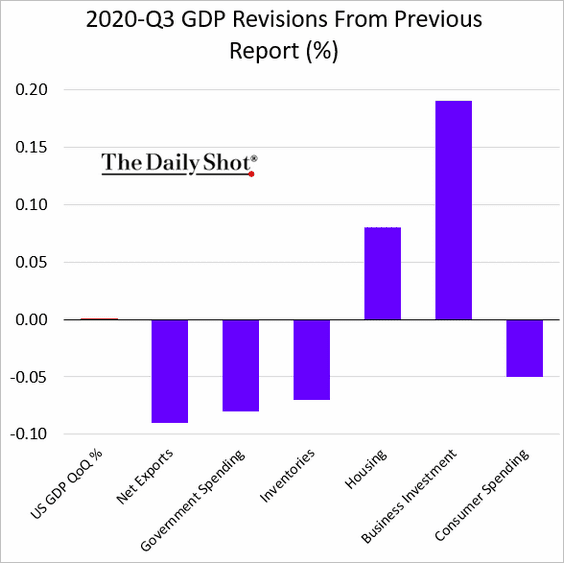
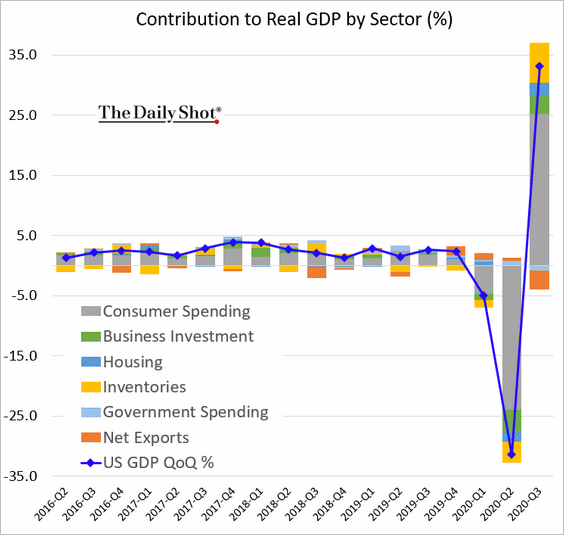
12. The GDP update showed the same overall level of growth in Q3. Here is the breakdown.
The United Kingdom
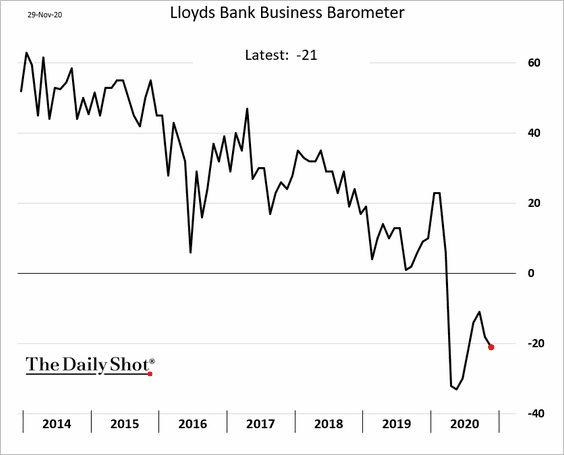
1. The Lloyds Bank Business Barometer remains depressed.
2. Here are some GDP scenarios from Bloomberg Economics.
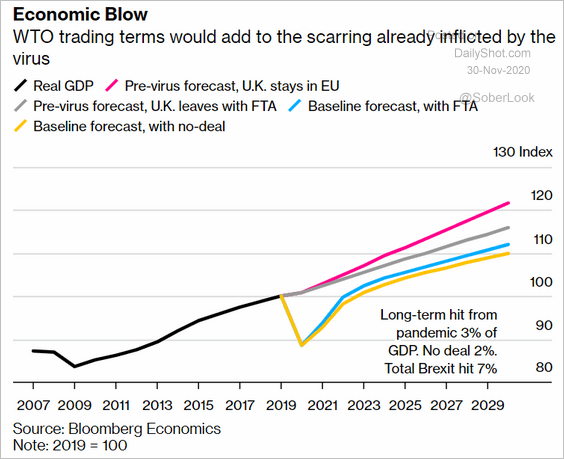 Source: @markets Read full article
3. Black Friday holiday traffic is down nearly 60% vs. 2019.
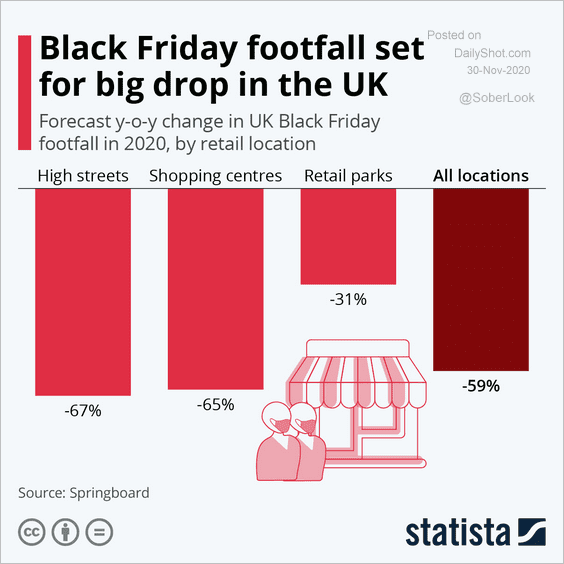 Source: Statista
4. Many UK firms have been running cashless operations.
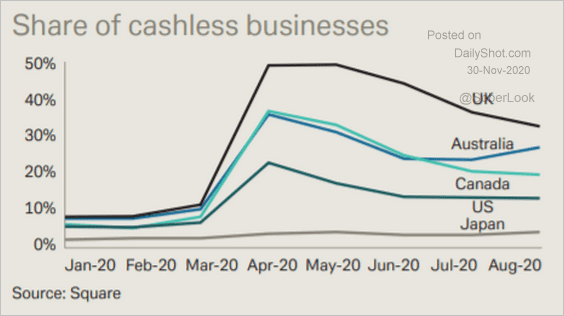 Source: Deutsche Bank Research
5. UK real yields are among the lowest in the G10.
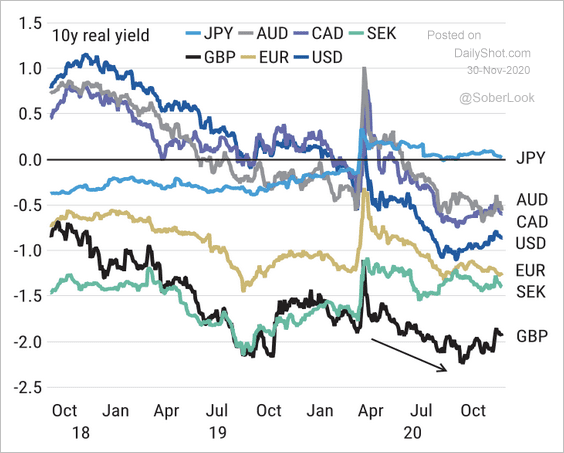 Source: Morgan Stanley Research
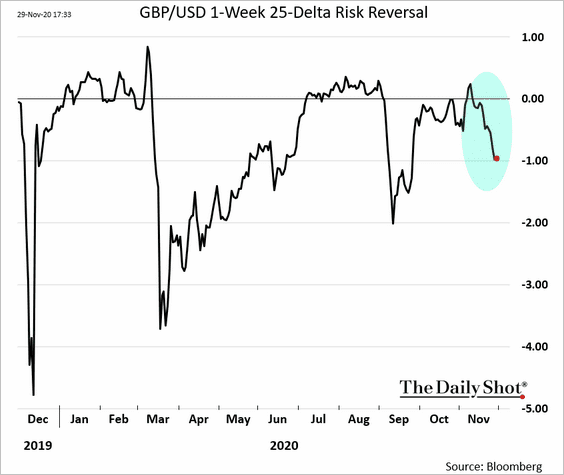
6. Currency options traders are getting nervous about the EU trade negotiations.
The Eurozone
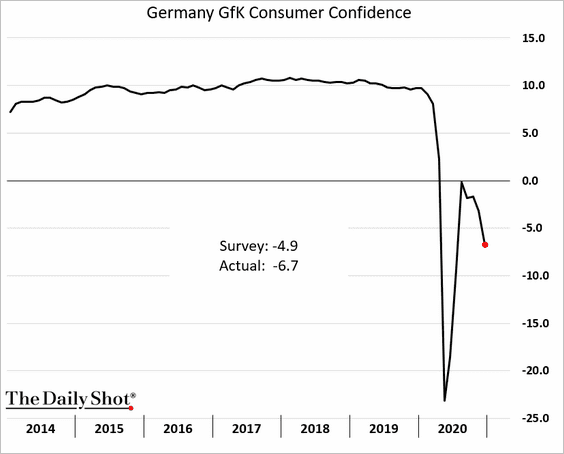
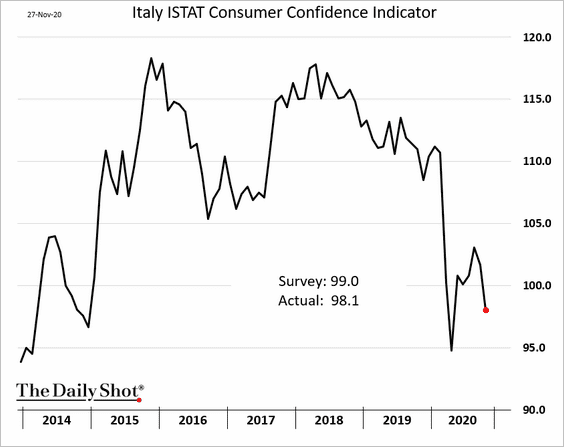
1. Let’s begin with the latest consumer sentiment indicators, which softened further this month.
• Germany:
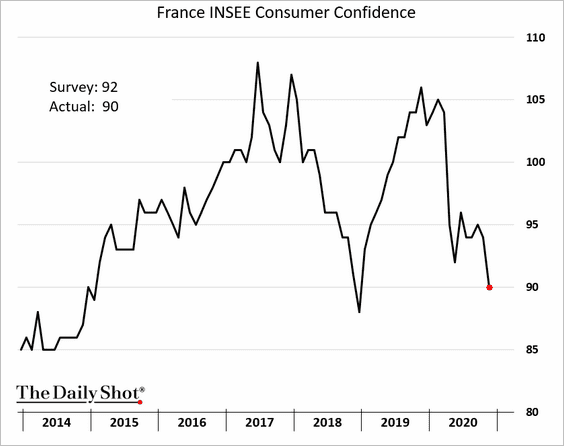
• France:
French consumers expect higher unemployment ahead.
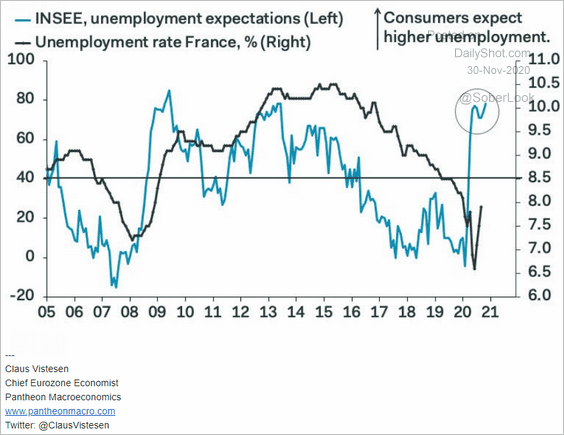 Source: Pantheon Macroeconomics
• Italy:
——————–
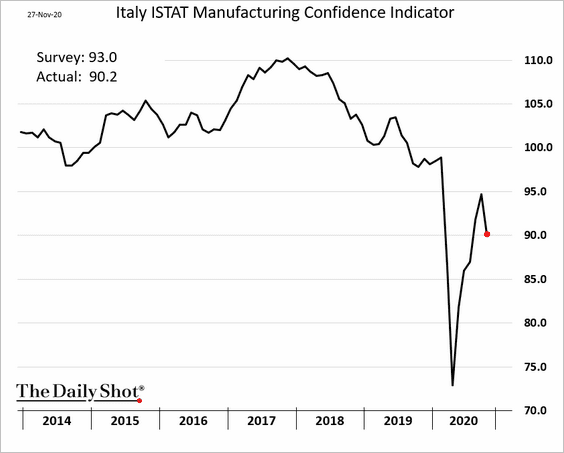
2. Below are some additional updates on Italy.
• Manufacturing confidence:
• Expected debt-to-GDP ratio:
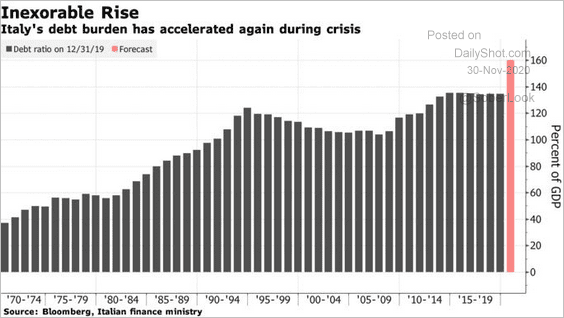 Source: @bpolitics Read full article
• COVID-related hospitalizations:
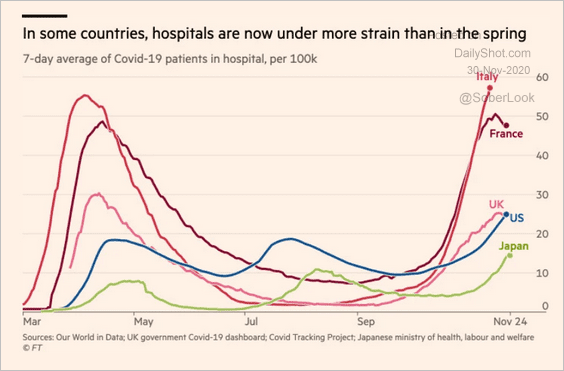 Source: @financialtimes Read full article
——————–
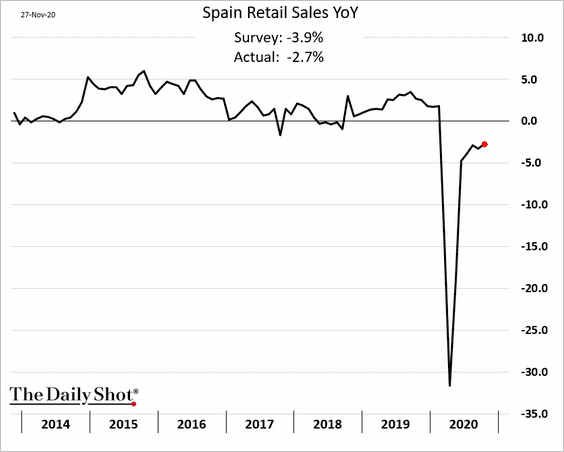
3. And here are some updates on Spain.
• Retail sales (through October):
• Employment losses:
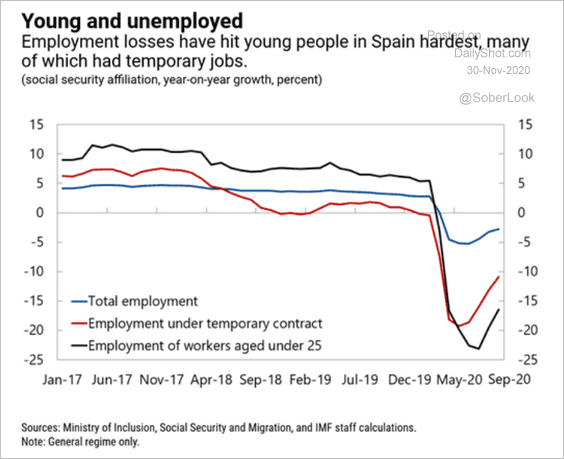 Source: IMF Read full article
• Fiscal stimulus:
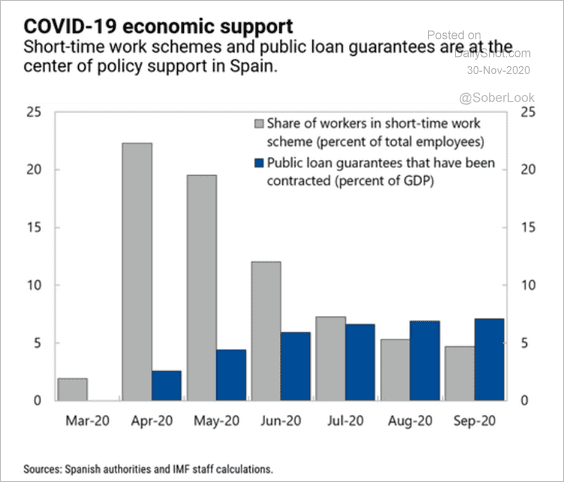 Source: IMF Read full article
——————–
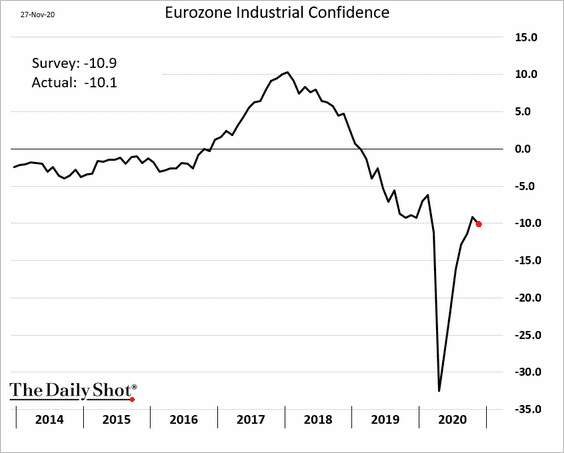
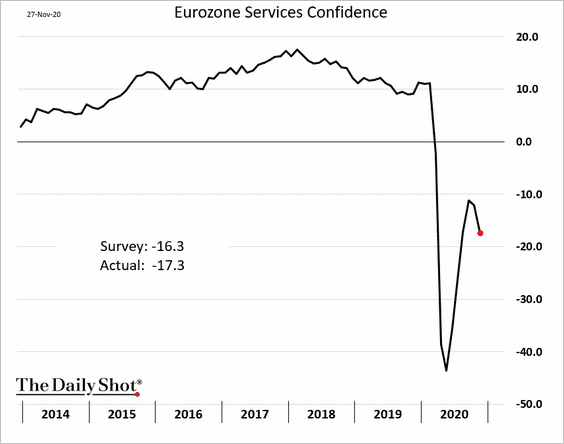
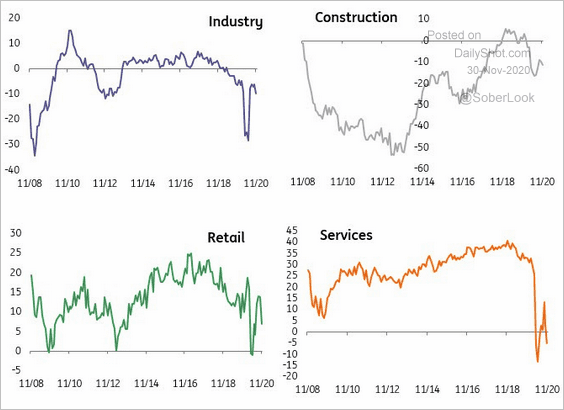
4. At the Eurozone level, industrial and service business confidence diverged this month in response to the pandemic.
——————–
5. The broad money supply (M3) growth continues to climb.
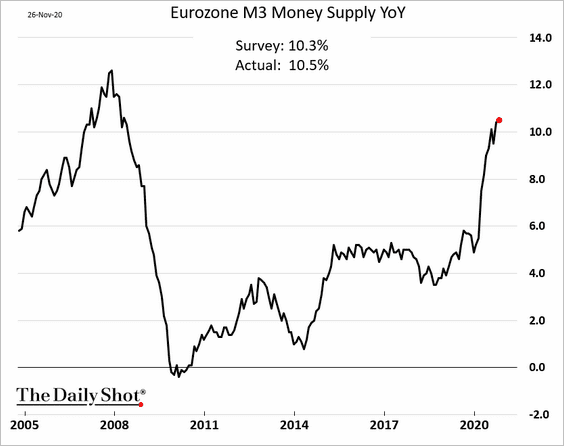
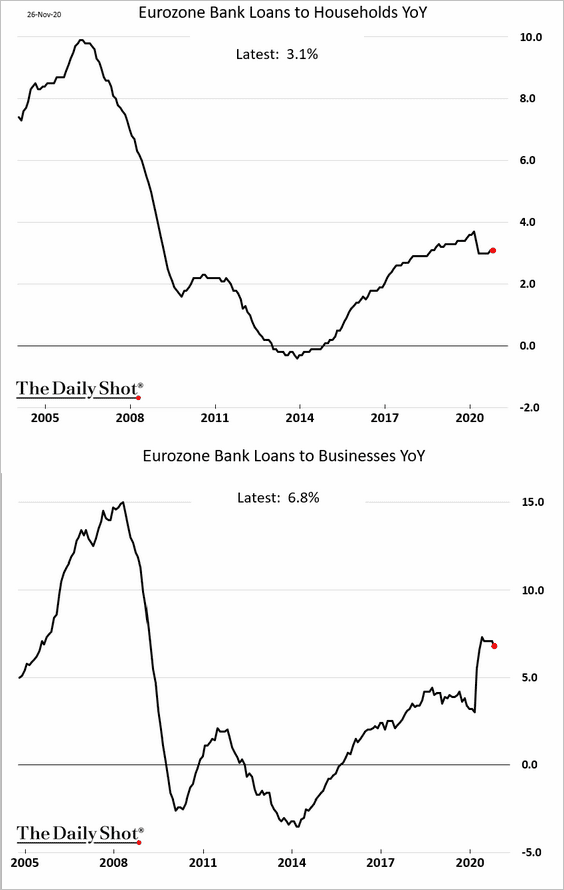
Here are the year-over-year changes in business and consumer loans. The acceleration in M3 has been driven by the ECB, not bank lending.
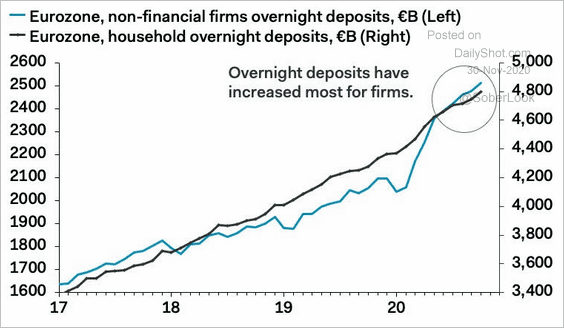
This chart shows the trajectories of business and household deposits.
 Source: Pantheon Macroeconomics
——————–
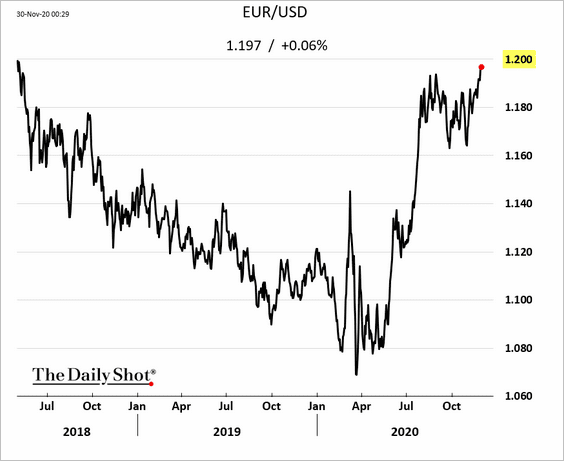
7. The euro is approaching 1.20 vs. USD.
But bullish sentiment on the euro appears stretched.
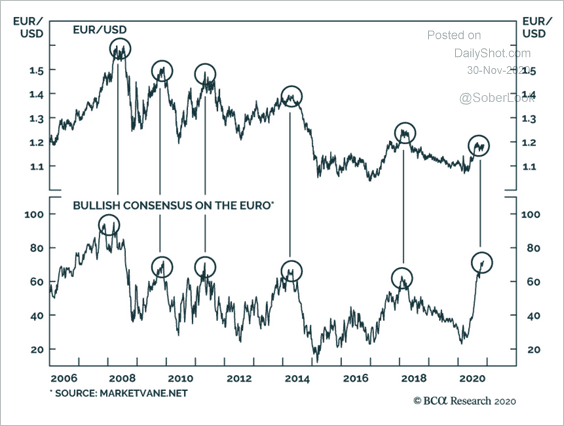 Source: BCA Research
Europe
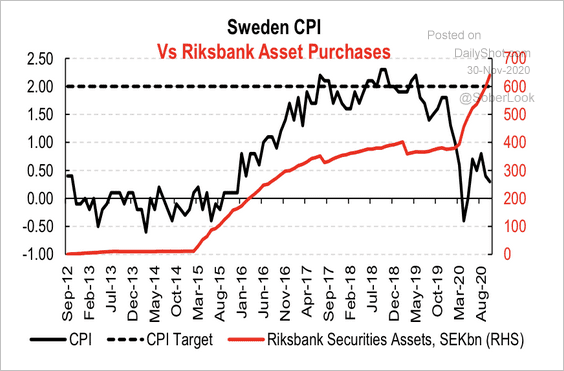
1. Riksbank raised its asset purchases more than expected, surprising the markets. The central bank also suggested that more stimulus is possible.
 Source: @markets Read full article
 Source: Variant Perception
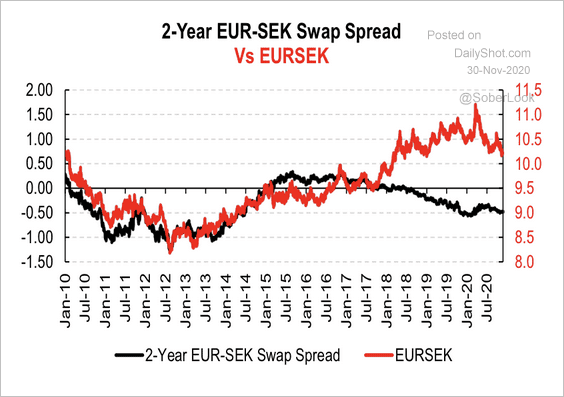
The Swedish krona declined (chart shows the euro gaining against the krona).
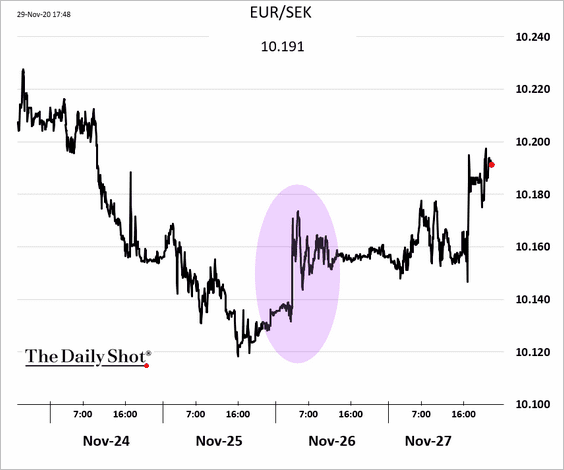
A stronger Swedish Krona relative to the euro (as implied by the 2-year EUR/SEK rate spread) would further dampen Swedish inflation, according to Variant Perception.
 Source: Variant Perception
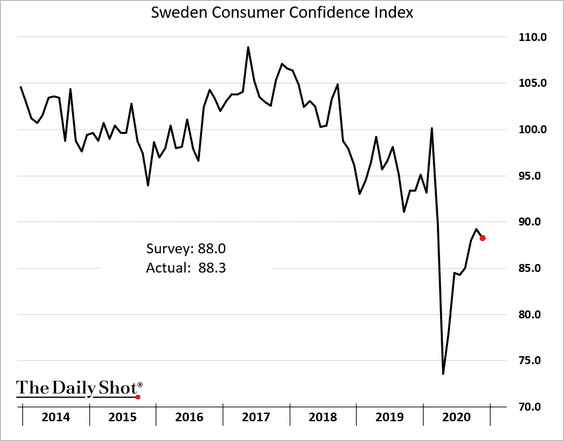
Below are some additional updates on Sweden.
• Consumer confidence:
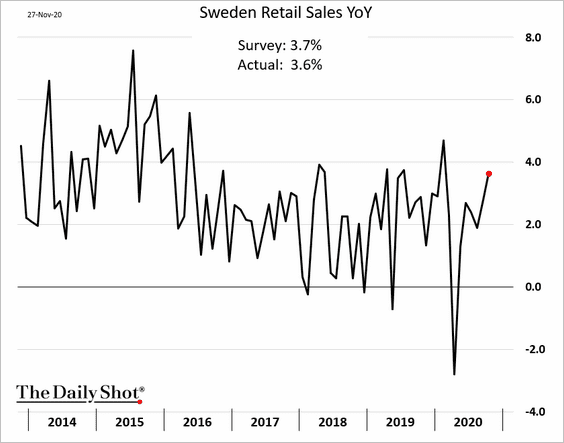
• Retail sales (through October):
——————–
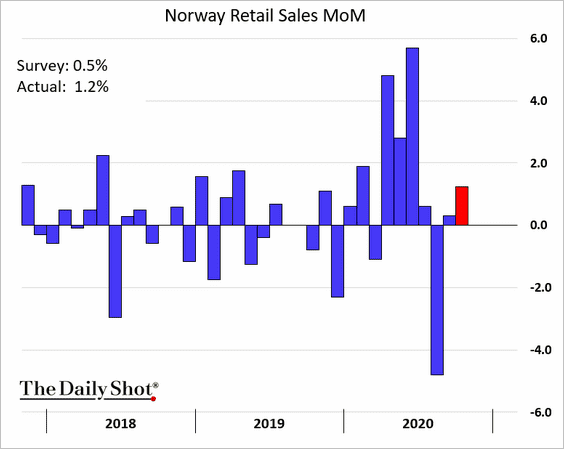
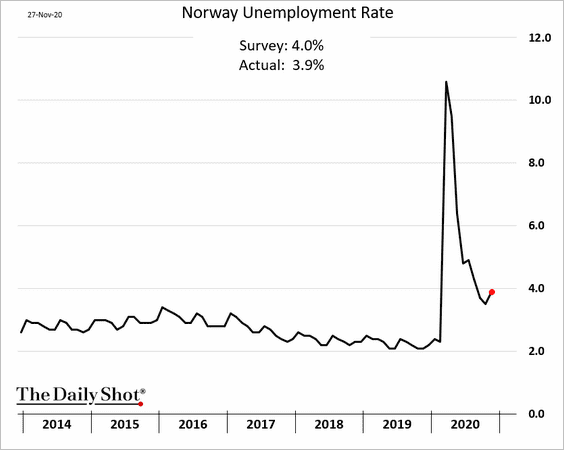
2. Norway’s retail sales surprised to the upside.
Here is Norway’s unemployment rate.
——————–
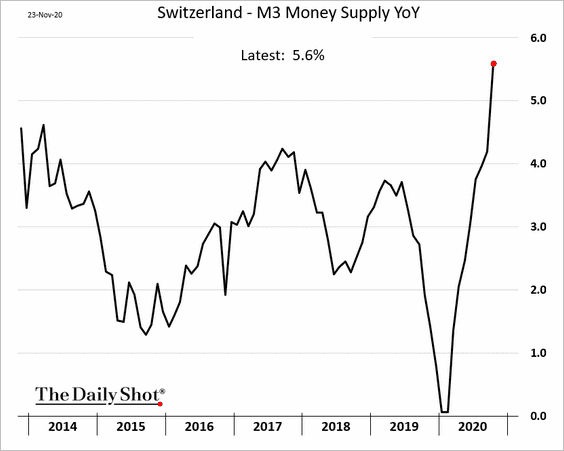
3. The Swiss money supply expansion is accelerating.
4. Next, we have some updates on Central Europe.
• Czech sentiment indicators:
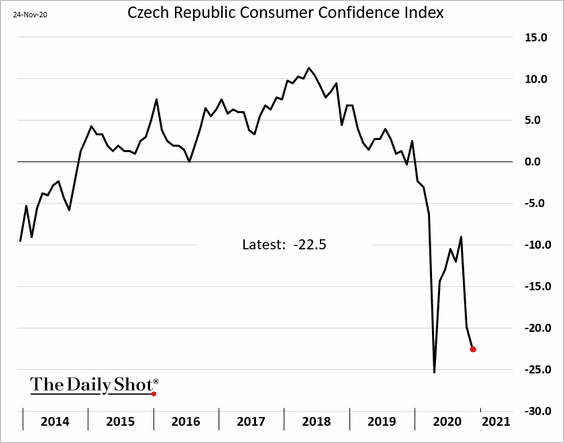
 Source: ING
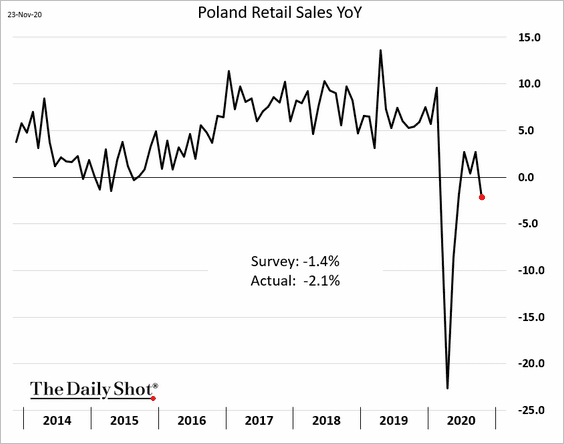
• Poland’s retail sales (back in negative territory vs. last year):
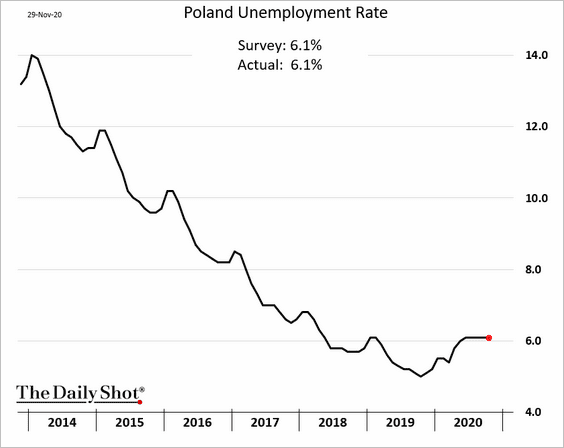
• Poland’s unemployment rate:
——————–
5. European high-frequency indicators are deteriorating again.
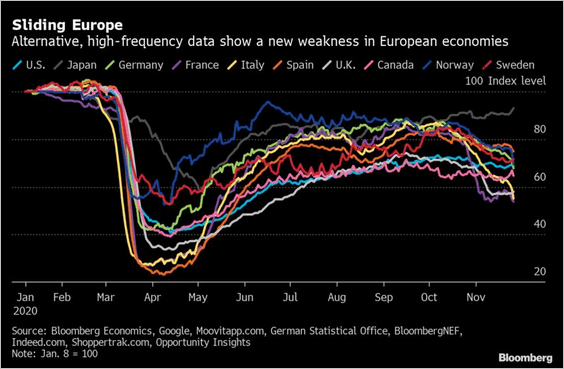 Source: @markets Read full article
Here is foot traffic by sector.
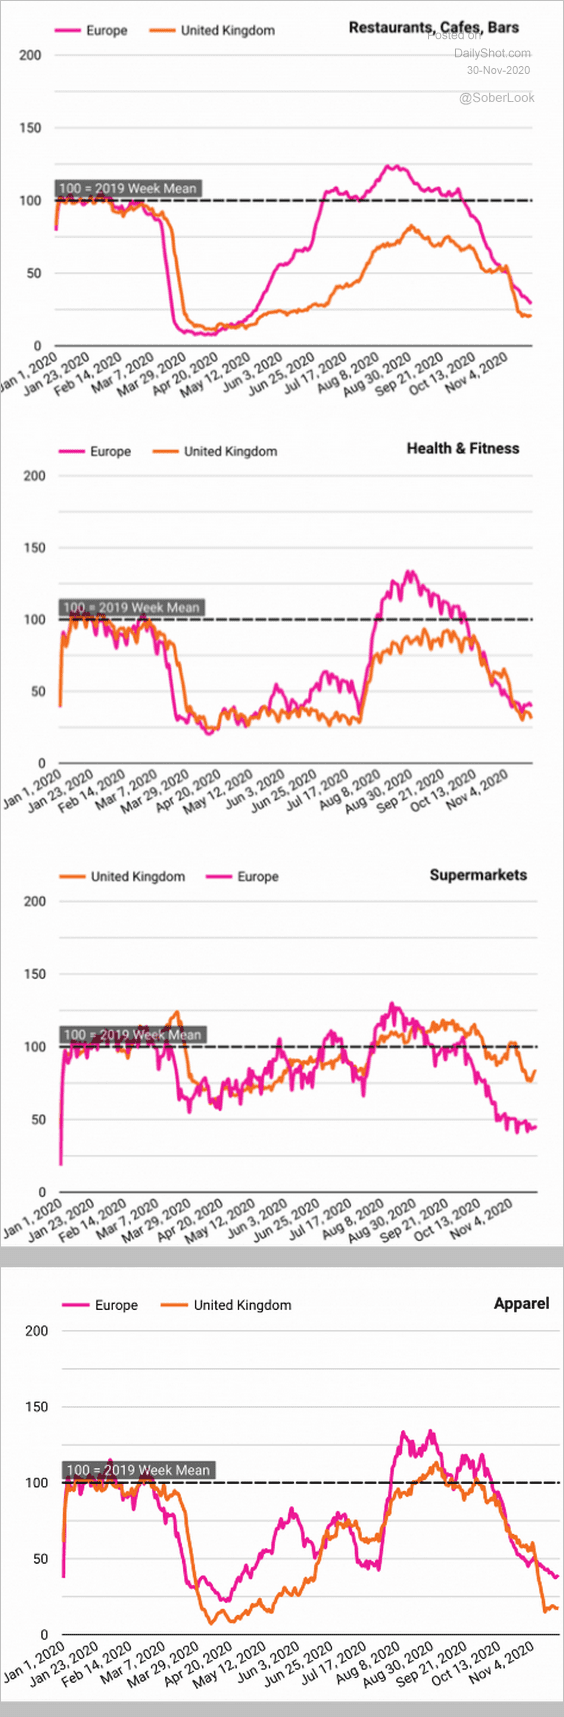 Source: Huq Read full article
——————–
6. European stocks outperformed global peers in November.
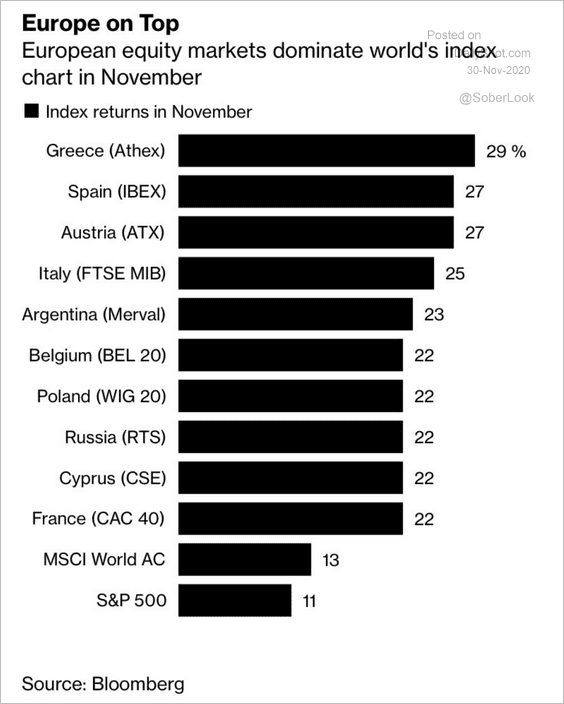 Source: @markets Read full article
7. Given the pollution levels, this lockdown is not as extreme as the one in March.
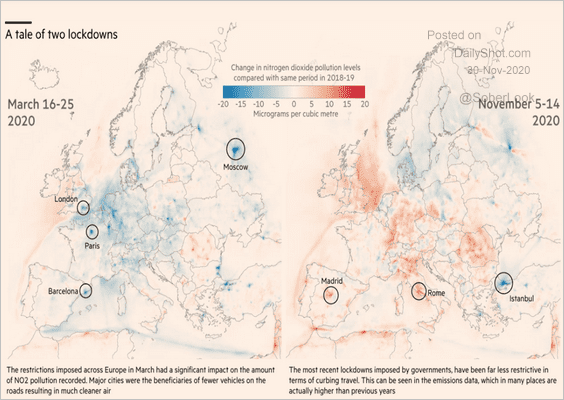 Source: @financialtimes Read full article
Japan
1. The stock market rally looks stretched.
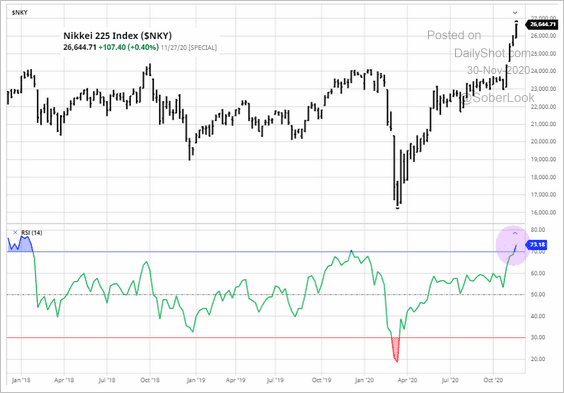 Source: barchart.com
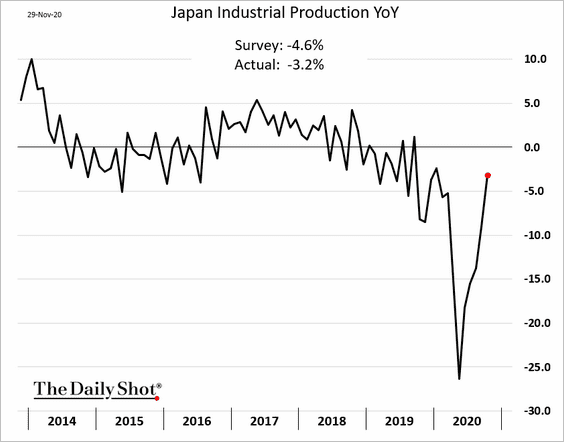
2. Industrial production is recovering faster than expected.
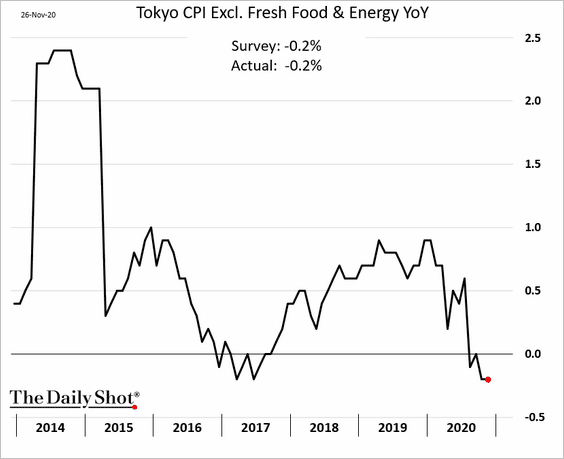
3. The Tokyo CPI index points to persistent deflationary pressures.
4. As long as inflation remains subdued, the BoJ will hold down bond yields, keeping the government’s debt service costs under control.
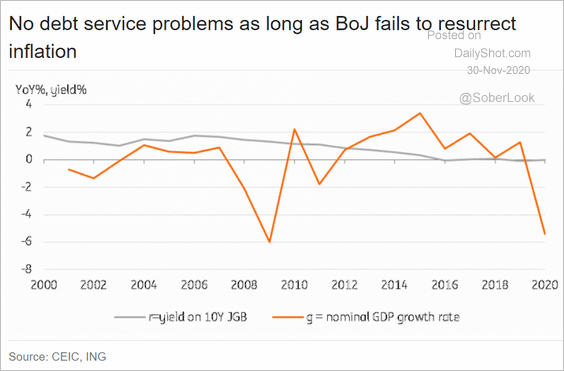 Source: ING
Asia – Pacific
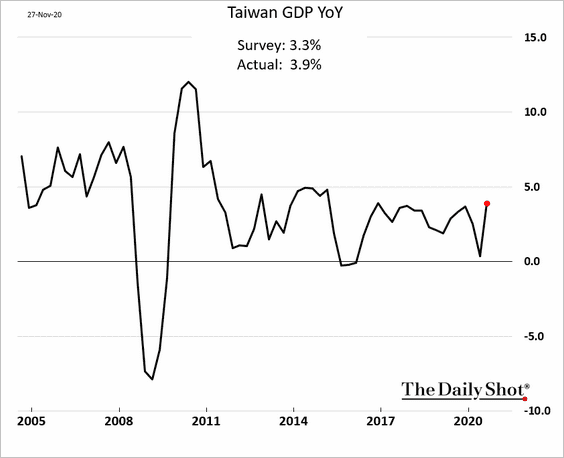
1. Taiwan’s GDP report was stronger than expected. One can barely spot the pandemic in the chart below.
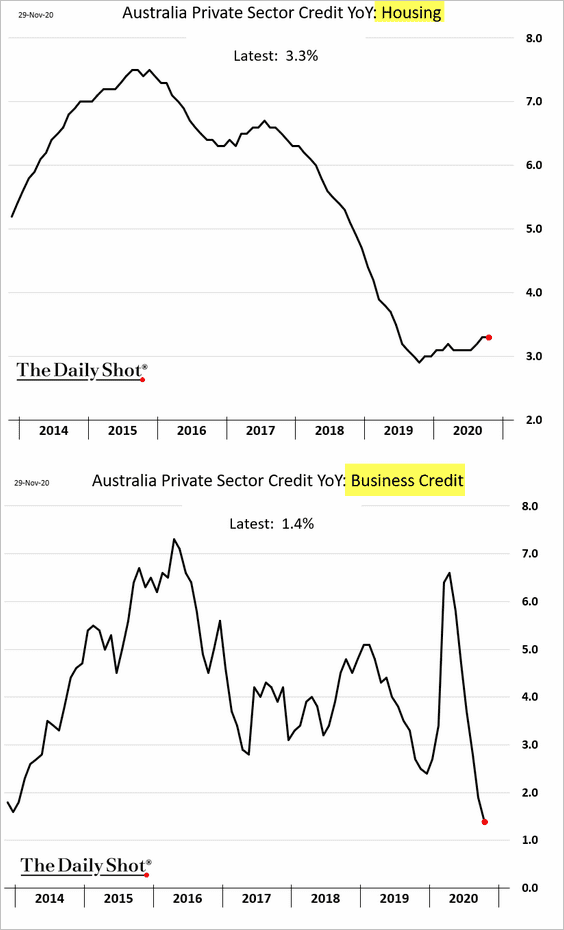
2. Next, we have some updates on Australia.
• Credit growth (housing and business loans):
• Corporate profits (Q3 spike):
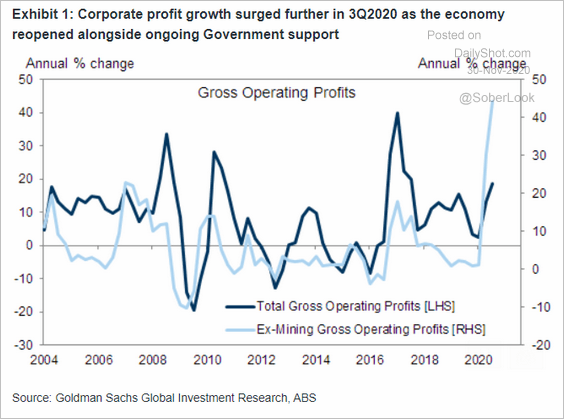 Source: Goldman Sachs
• China’s trade retaliation (to this):
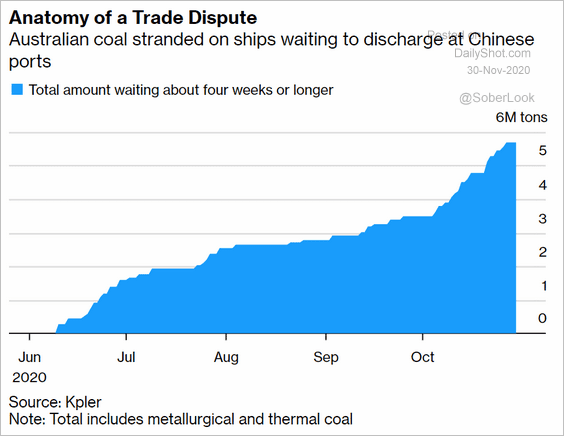 Source: @bpolitics Read full article
• Foreign ownership of Australian fixed income has been rising, …
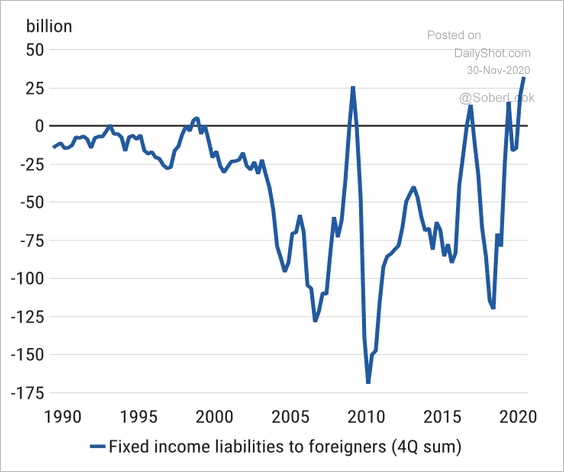 Source: Morgan Stanley Research
… in large part due to inflows from Japanese investors.
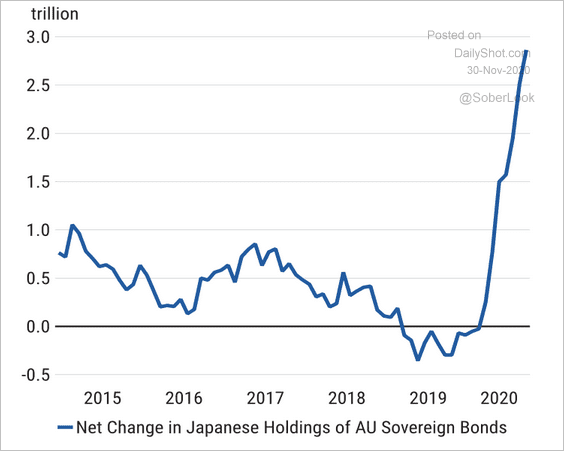 Source: Morgan Stanley Research
——————–
3. Morgan Stanley’s forecasts show New Zealand bond yields rising and converging with Australian bond yields.
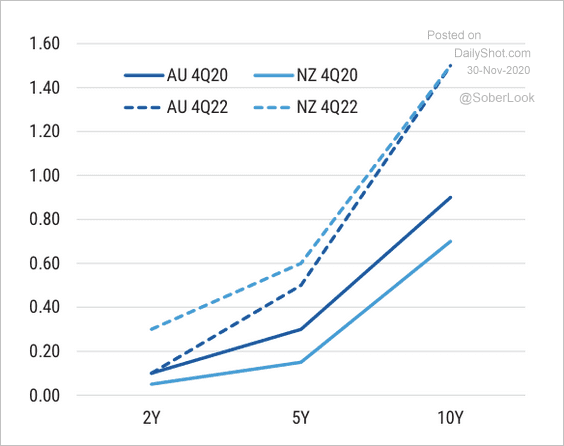 Source: Morgan Stanley Research
China
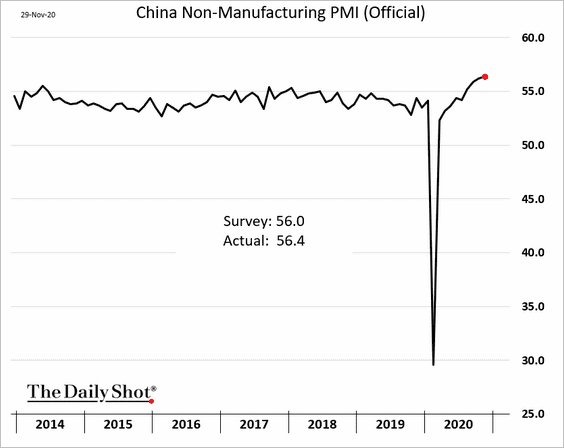
1. The official November PMI report shows business activity strengthening further.
• Manufacturing:
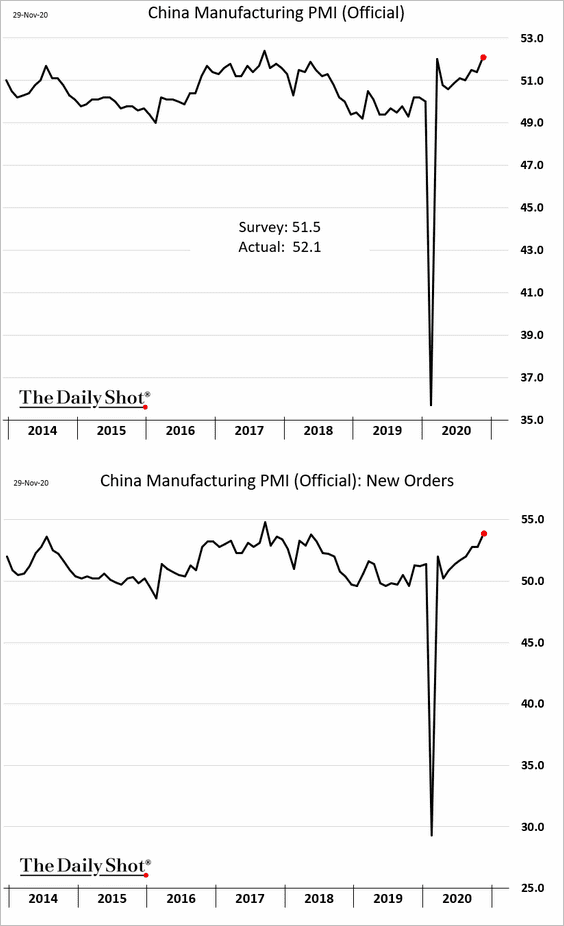
• Non-manufacturing:
——————–
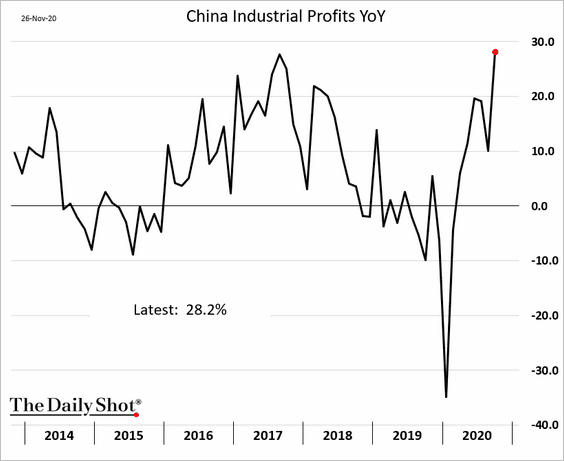
2. Growth in industrial profits hit a multi-year high.
3. Renminbi gains have outstripped other currencies this year.
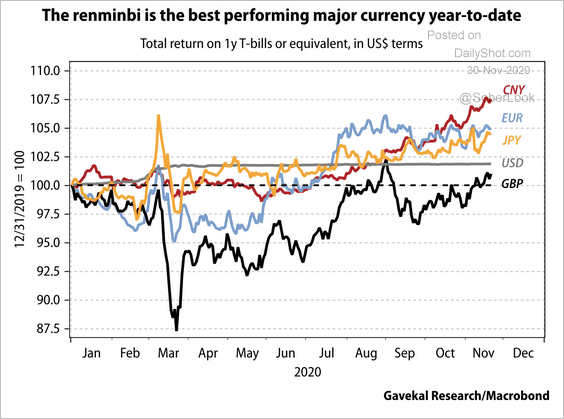 Source: Gavekal
The stock market has also outperformed.
——————–
4. Hong Kong is not getting many visitors.
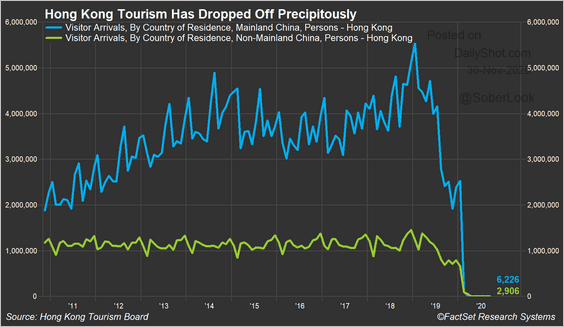 Source: @FactSet Read full article
Here are the contributions to Hong Kong’s GDP.
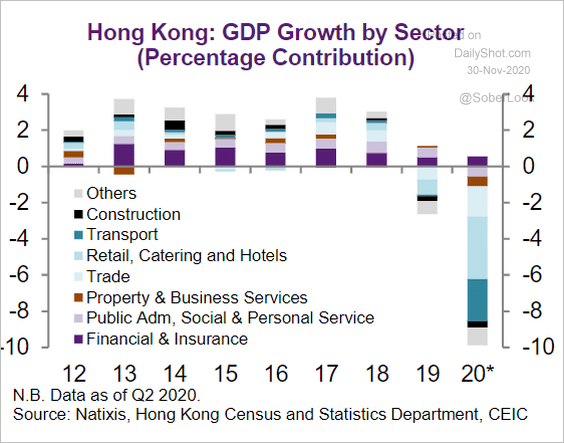 Source: Natixis
Emerging Markets
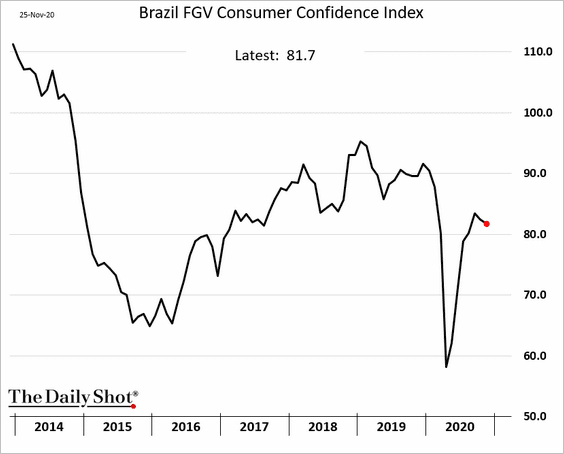
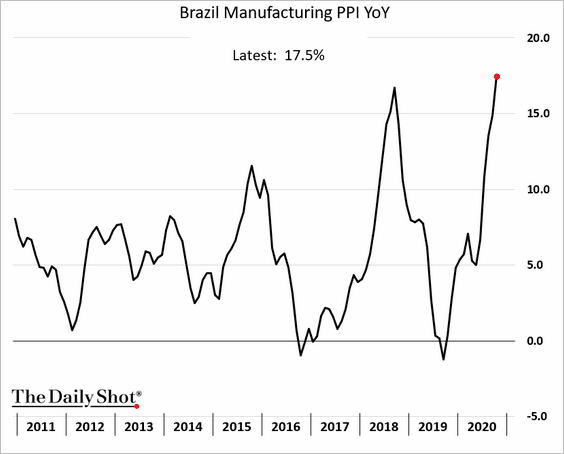
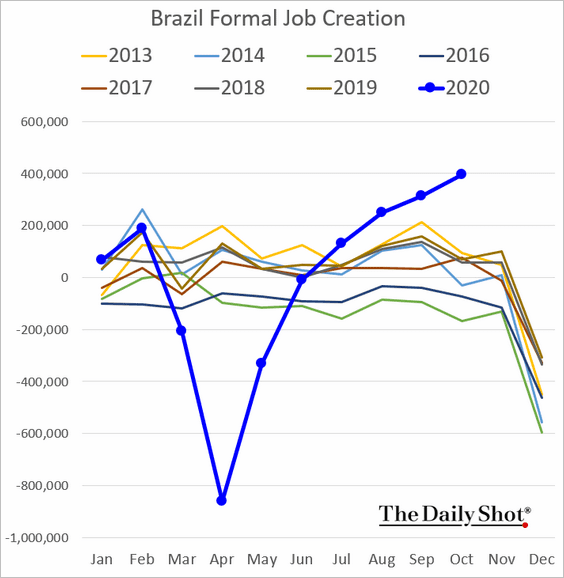
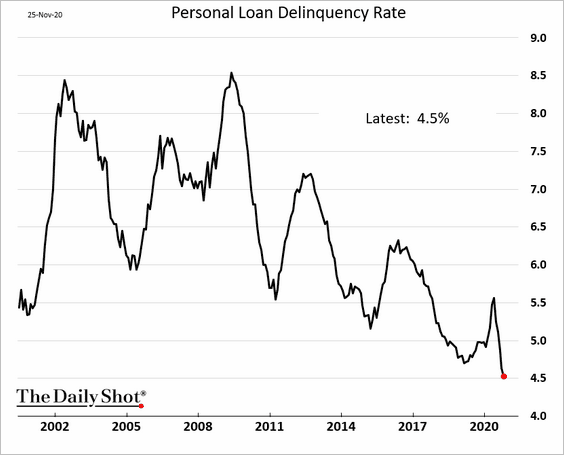
1. Let’s begin with Brazil.
• Consumer confidence:
• Manufacturing PPI:
• Formal job creation:
• Household loan delinquency rate:
——————–
2. Rising copper prices should support the Chilean peso.
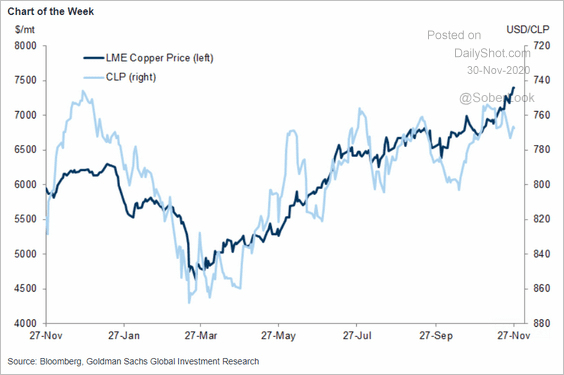 Source: Goldman Sachs
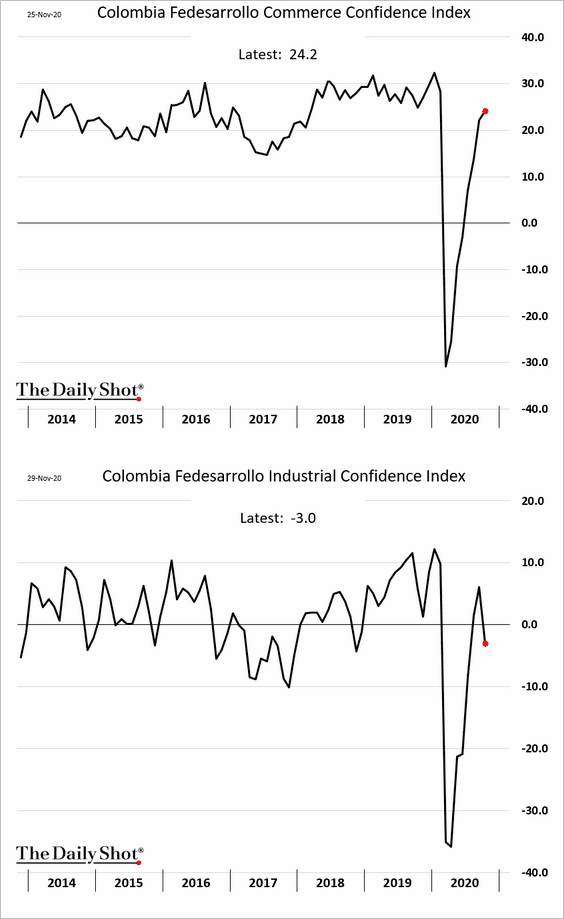
3. Colombia’s consumer-focused business confidence continues to recover, but industrial sentiment deteriorated.
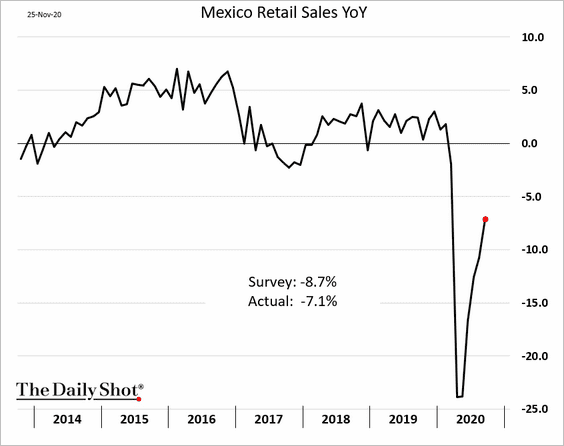
4. Mexican retail sales are recovering.
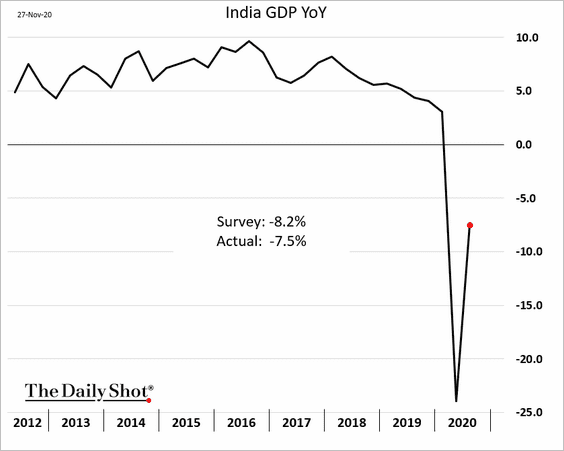
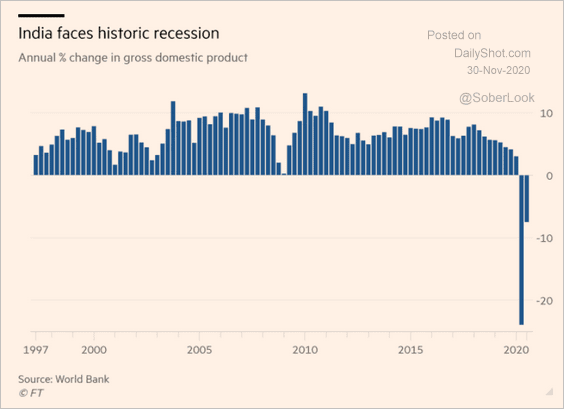
5. Next, we have some updates on India.
• The GDP growth:
– Year-over-year:
– Quarter-over-quarter:
 Source: @financialtimes Read full article
– Contributions:
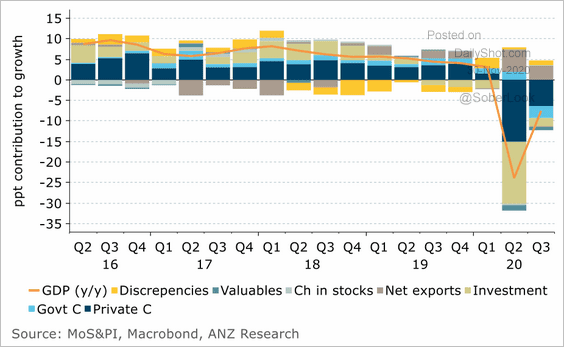 Source: ANZ Research
• The World Economics SMI report (business activity is still in contraction territory):
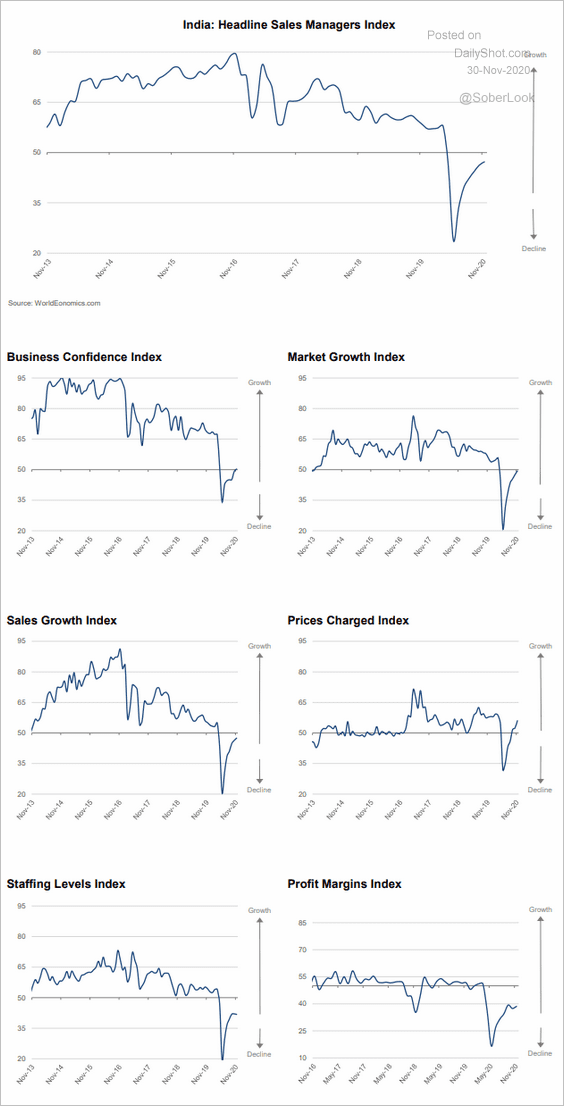 Source: World Economics
• India’s transport activity:
![]() Source: Goldman Sachs
Source: Goldman Sachs
——————–
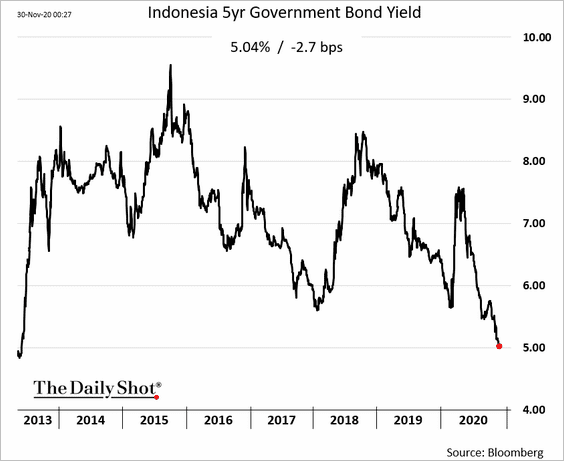
6. Indonesian local-currency bond yields are at multi-year lows.
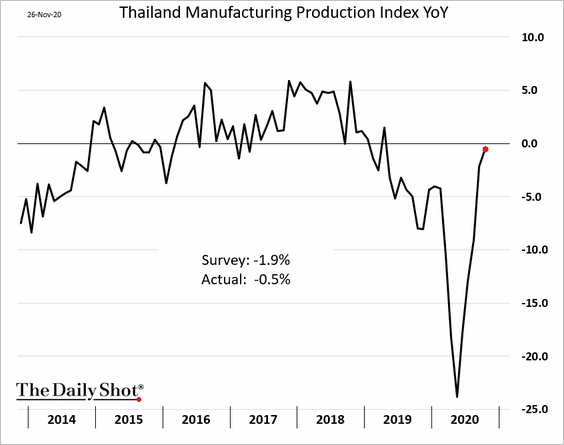
7. Thailand’s manufacturing output is almost flat vs. last year.
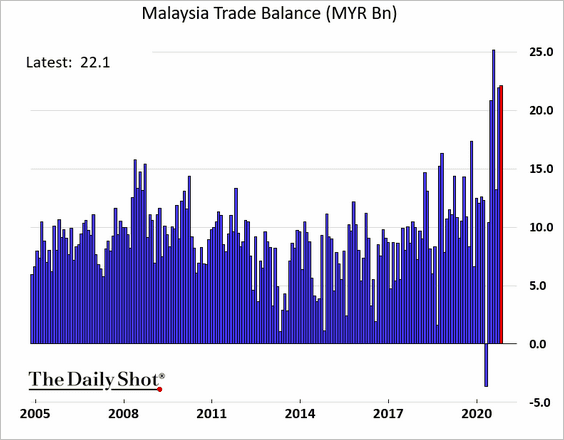
8. Malaysia’s trade surplus remains close to record highs.
USD/MYR is nearing support.
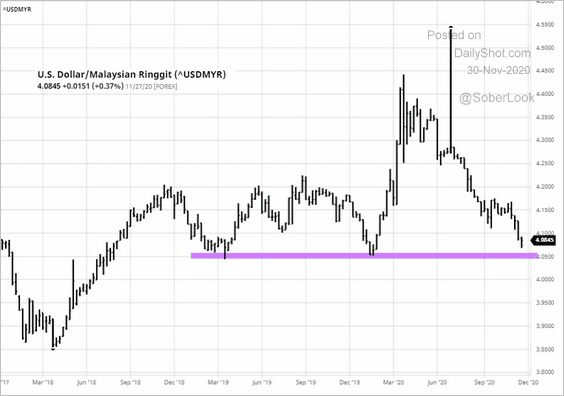 Source: barchart.com
Cryptocurrency
1. Bitcoin held resistance, declining sharply after the Coinbase news.
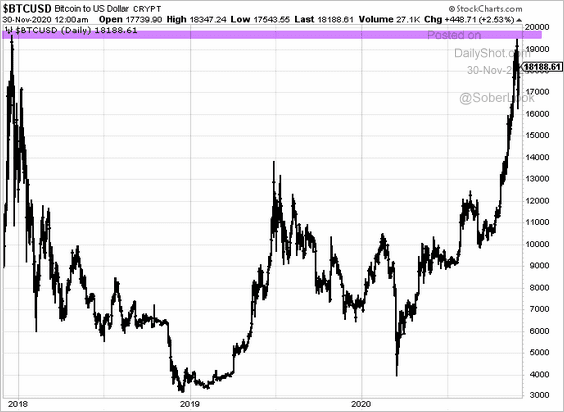
 Source: Reuters Read full article
But the news from Guggenheim helped reverse some of the losses.
 Source: @markets Read full article
——————–
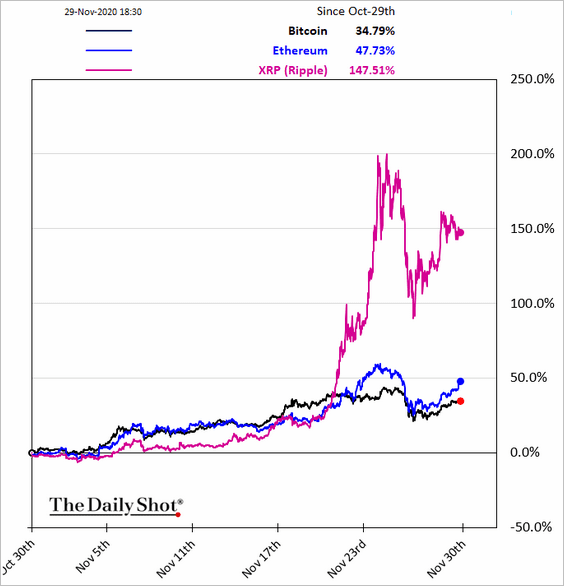
2. XRP continues to outperform.
3. Central banks are embracing their own digital currencies (CBDCs). Note that these are still fiat currencies, just in digital form.
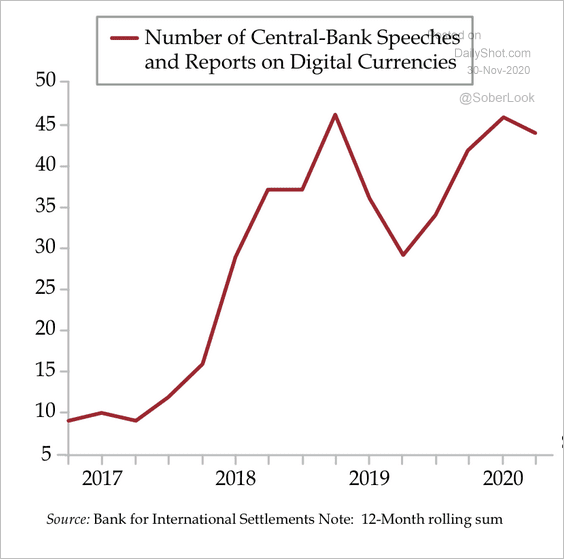 Source: Quill Intelligence
4. Credit cards still have a speed advantage over cryptos.
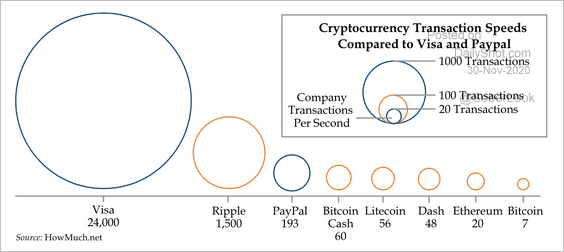 Source: Quill Intelligence
Commodities
1. Copper is soaring.
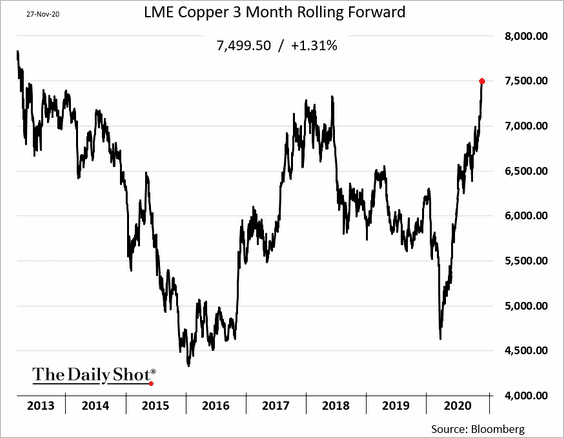
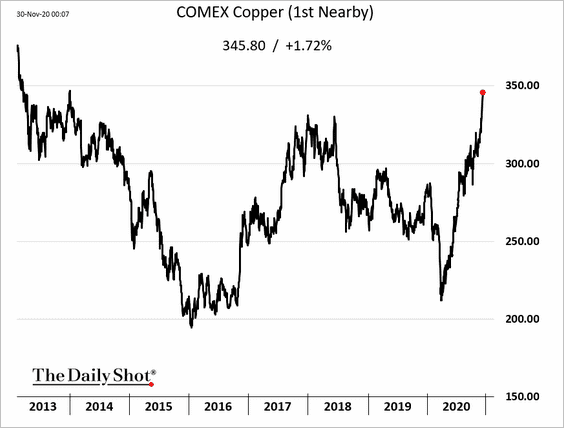
Speculative positioning looks stretched.
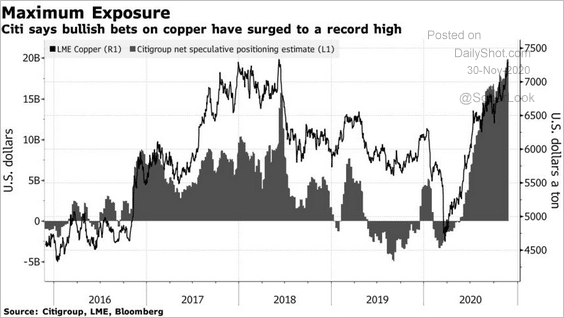 Source: @markets Read full article
——————–
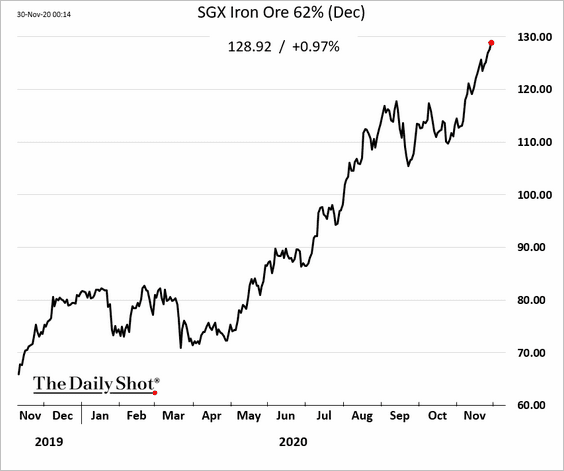
2. Iron ore futures continue to climb.
3. Gold’s 1-month risk reversals are on the verge of turning negative for the first time since March. A deterioration in risk reversals was the precursor to gold’s last bear cycle, according to Deutsche Bank.
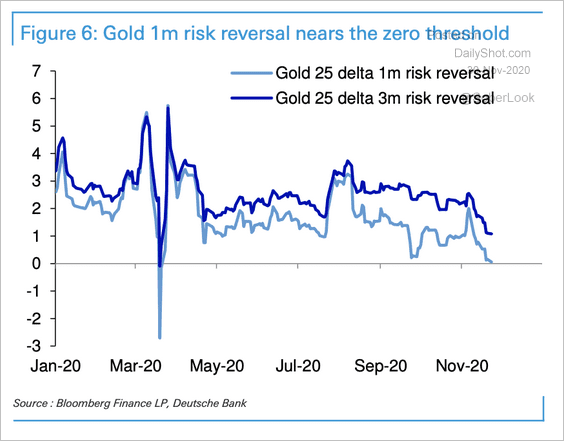 Source: Deutsche Bank Research
——————–
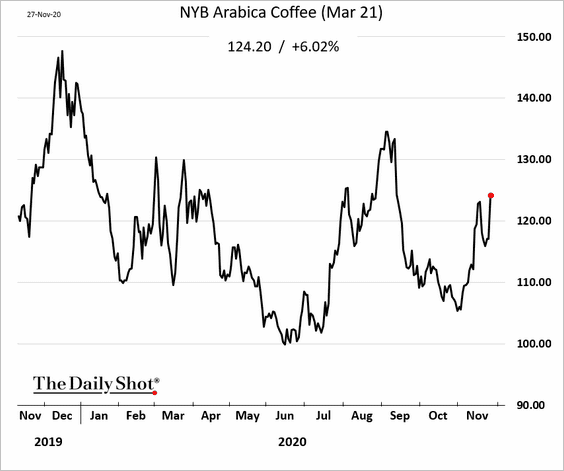
4. Arabica coffee futures spiked last week amid forecasts for sharp declines in Brazil’s output (due to dry weather).
5. US soybean meal futures are at resistance. China’s growing pig herd will require a great deal of feed.
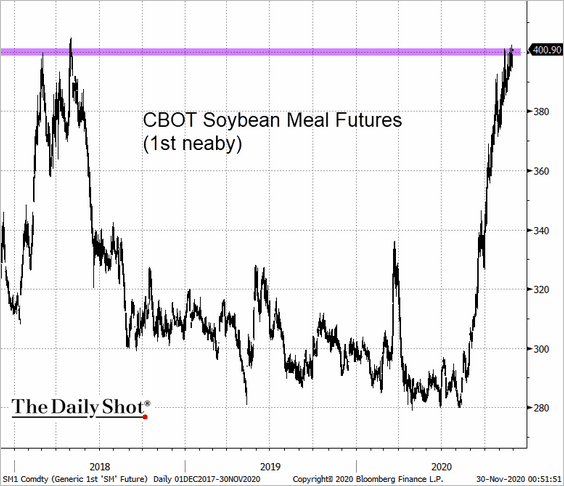 Source: @TheTerminal, Bloomberg Finance L.P.
Energy
1. OPEC+ still doesn’t have an agreement on production targets.
 Source: @markets Read full article
Here is OPEC’s production vs. quota.
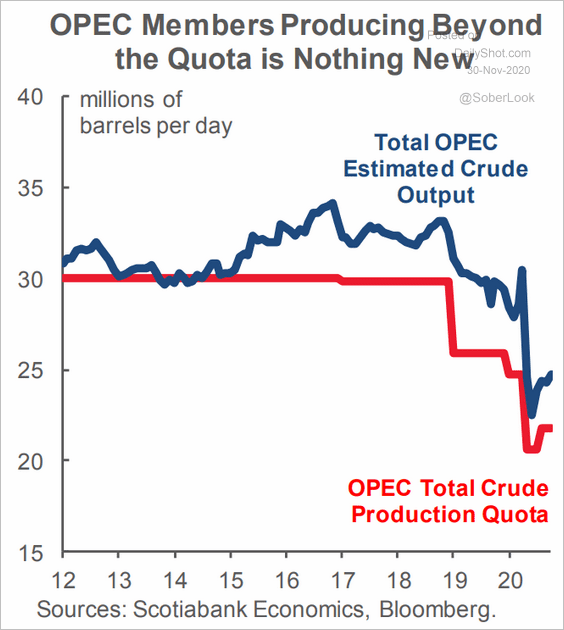 Source: Scotiabank Economics
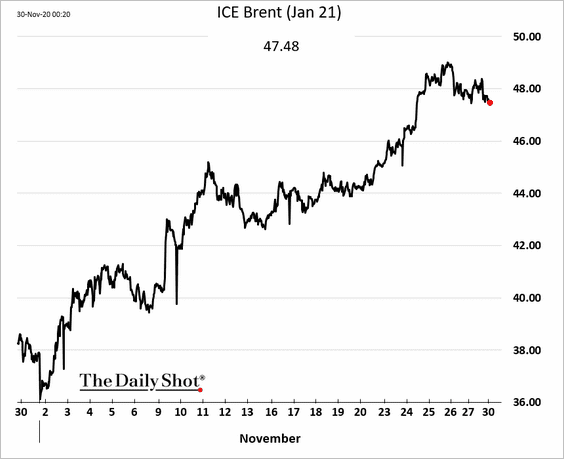
Brent is below $48 again.
——————–
2. US gasoline demand remains soft.
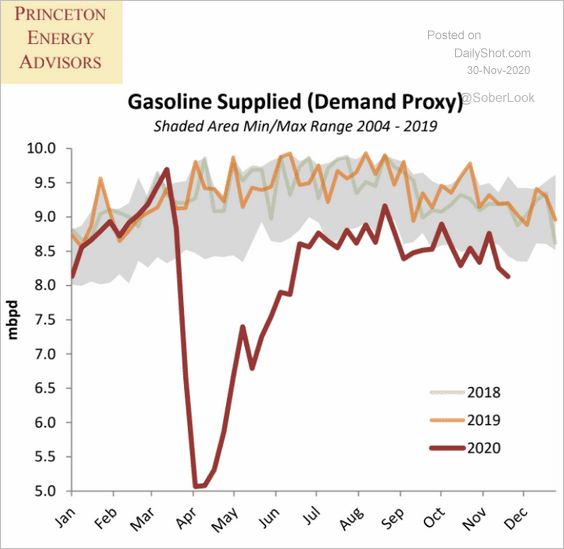 Source: Princeton Energy Advisors
3. The US energy sector has been in its deepest and longest stock market drawdown since the great depression.
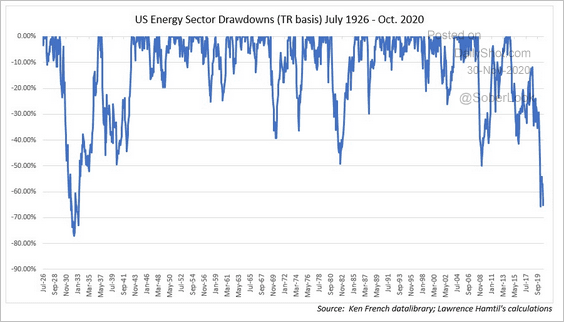 Source: @lhamtil
But a vaccine-driven rebound appears to be on the way.
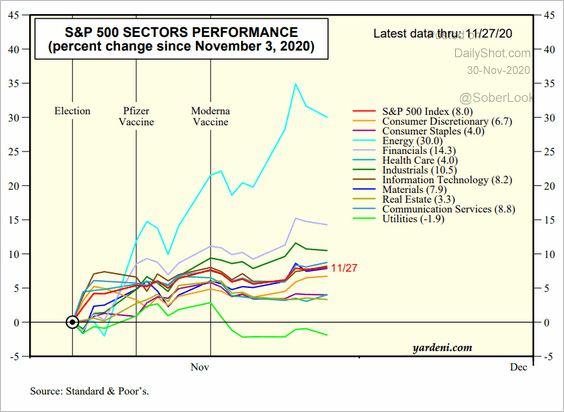 Source: Yardeni Research
——————–
4. US MLPs (pipeline companies) have lagged the rebound in oil prices from March lows.
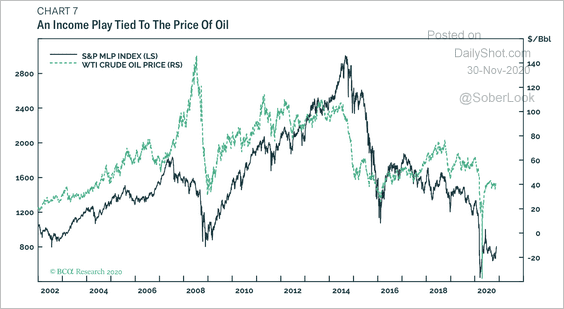 Source: BCA Research
Equities
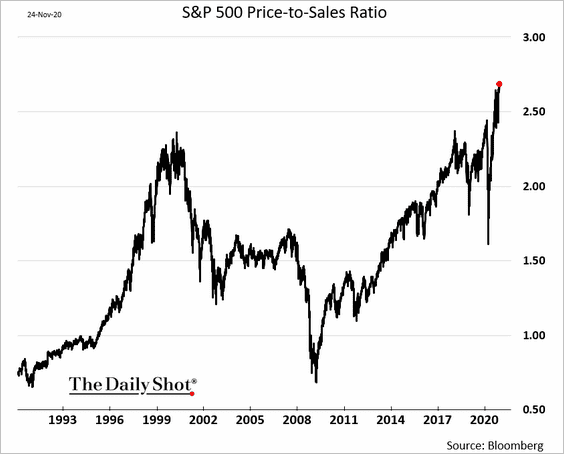
1. Valuations look stretched.
The market is betting on a massive rebound in corporate earnings.
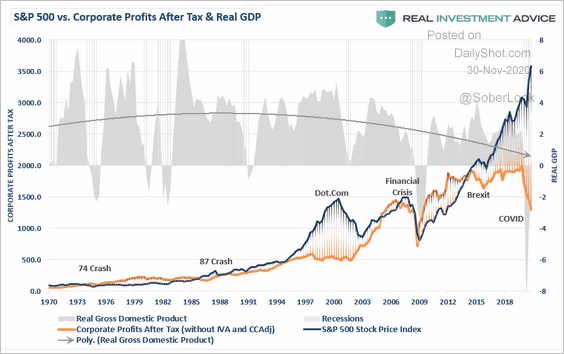 Source: @ISABELNET_SA
——————–
2. Nasdaq trading volume hit the highest level since 2004.
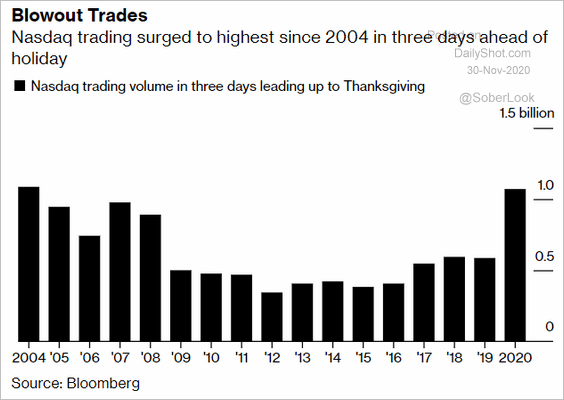 Source: @markets Read full article
3. Here is the S&P 500 overlaid on top of the Nikkei-225 index in the late 1980s.
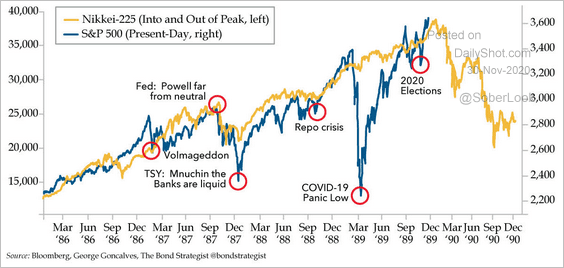 Source: Quill Intelligence
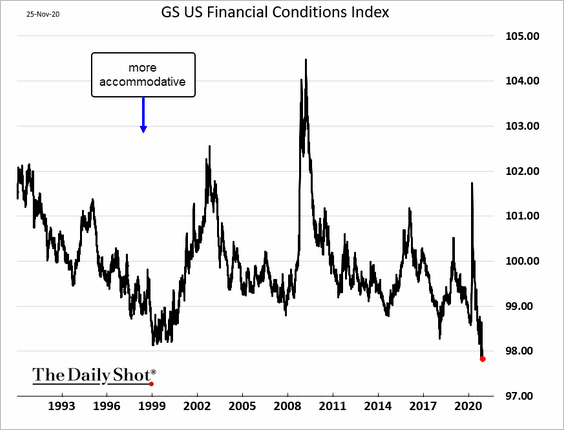
4. Improving financial conditions are supportive of US small caps.
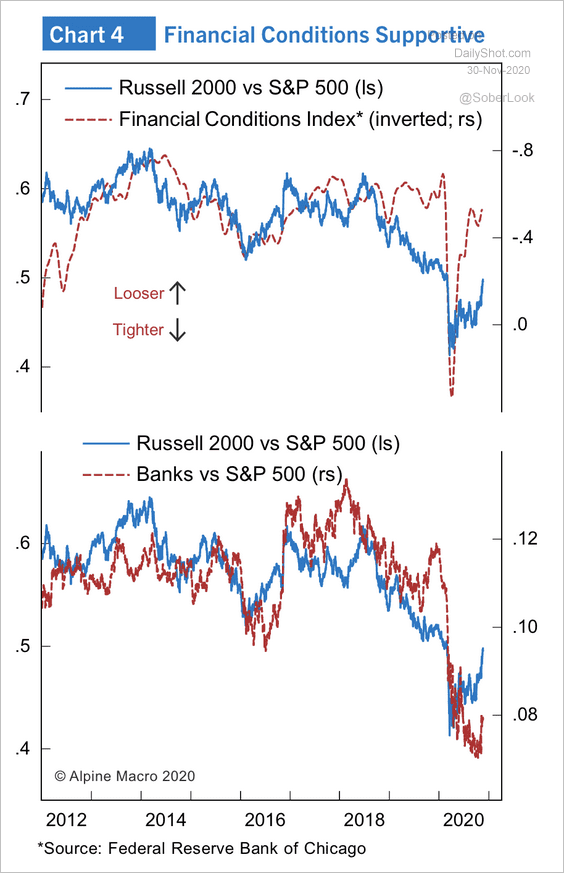 Source: Alpine Macro
——————–
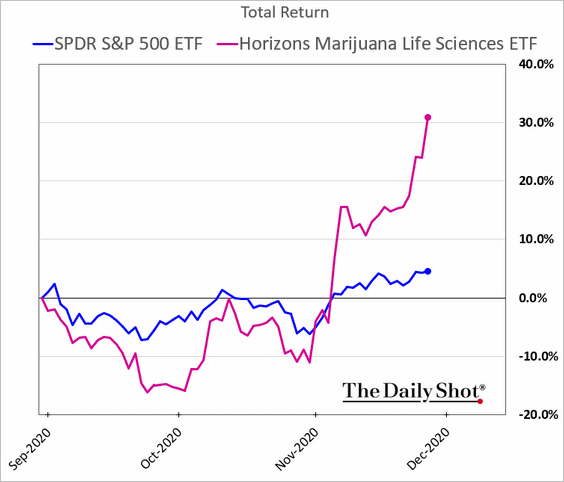
5. Cannabis stocks have been outperforming.
 Source: The Washington Times Read full article
——————–
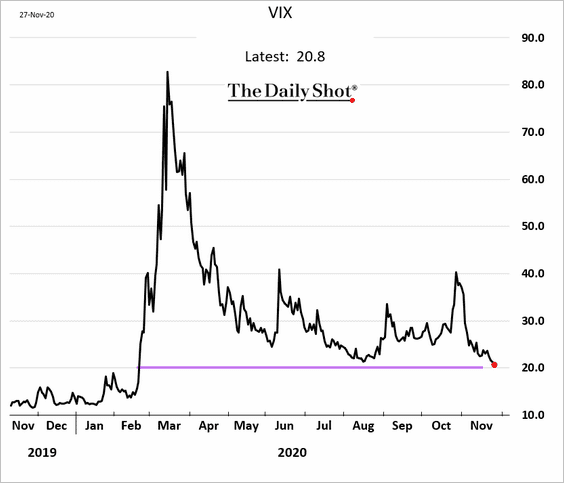
6. VIX is nearing 20 (lowest since February).
Global Developments
1. Here is a look at FX market performance since April.
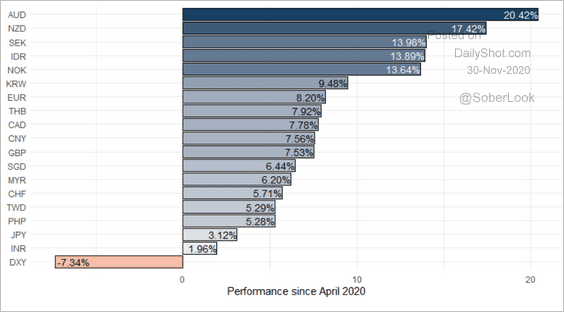 Source: ANZ Research
2. The euro is once again the top payment currency.
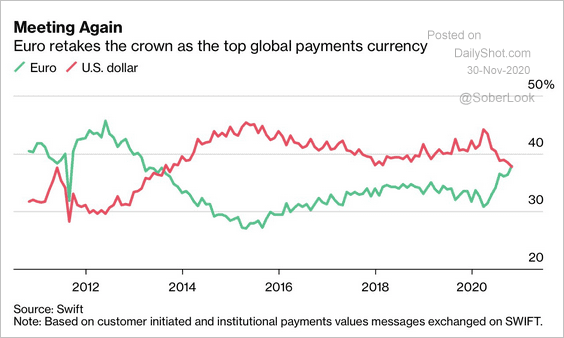 Source: @markets, h/t @jessefelder Read full article
3. This is IIF’s forecast for global debt growth.
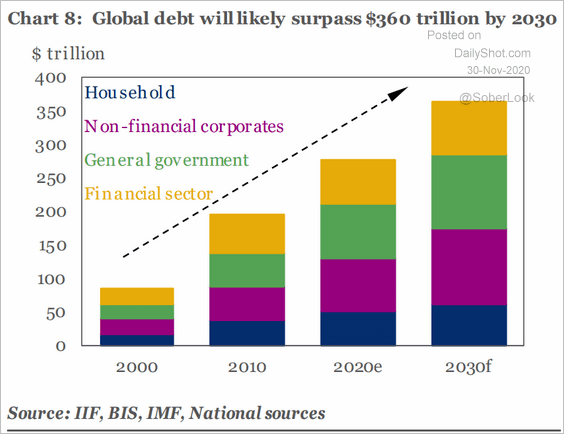 Source: IIF
——————–
Food for Thought
1. Thanksgiving grocery bill:
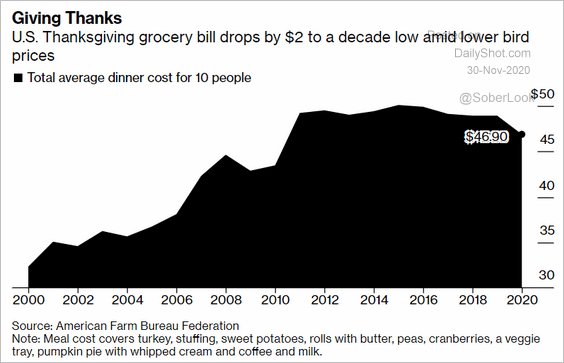 Source: @business Read full article
2. Top agricultural product by state:
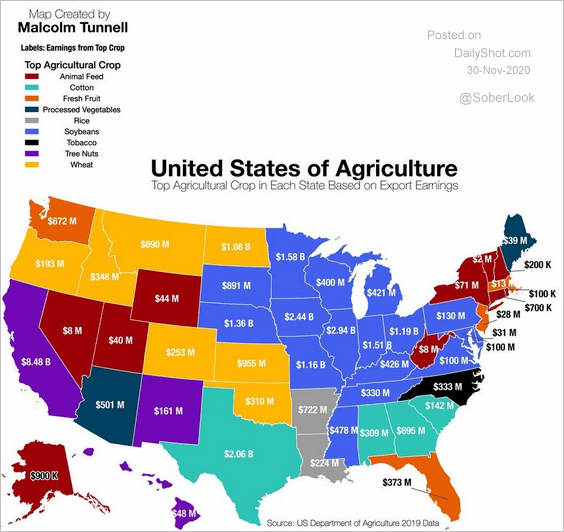 Source: @simongerman600 Read full article
3. Each country’s top import:
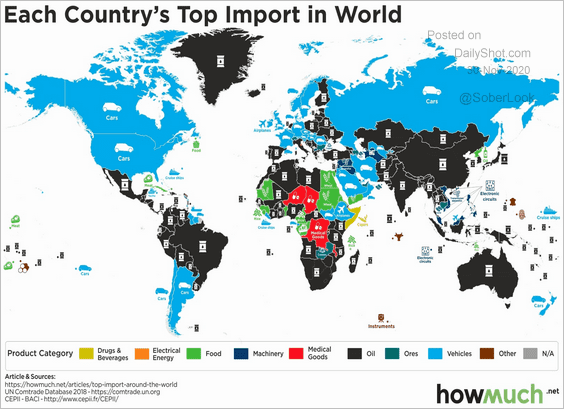 Source: @howmuch_net Read full article
4. Top US trading partners:
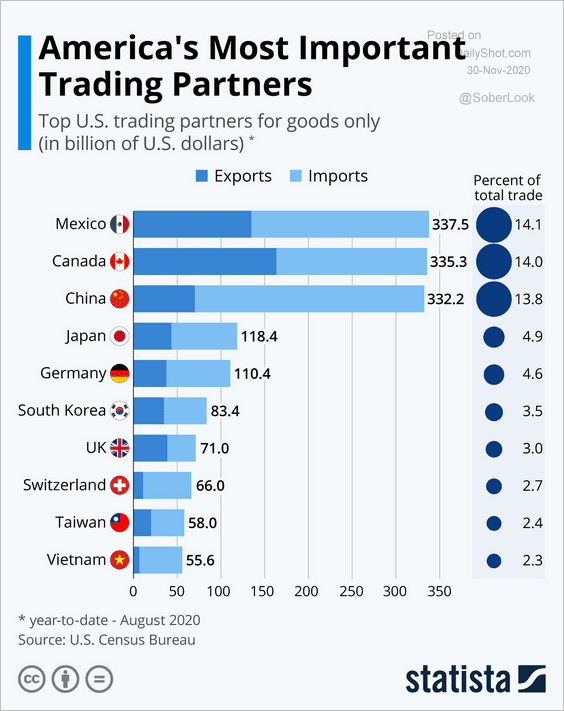 Source: Statista
5. Wartime military service by birth cohort:
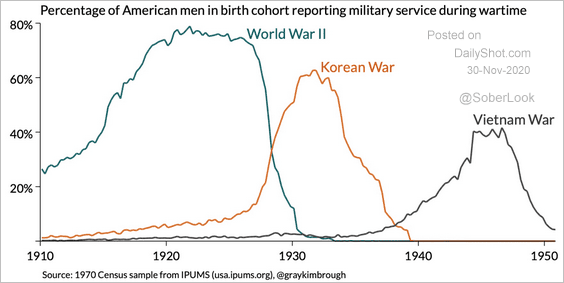 Source: @graykimbrough
6. Changes in US business school (MBA) applications:
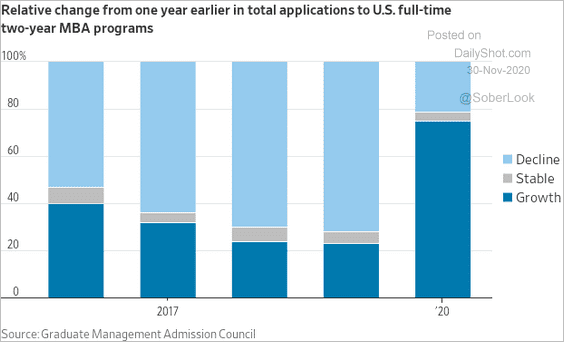 Source: @WSJ Read full article
7. US nursing home deaths:
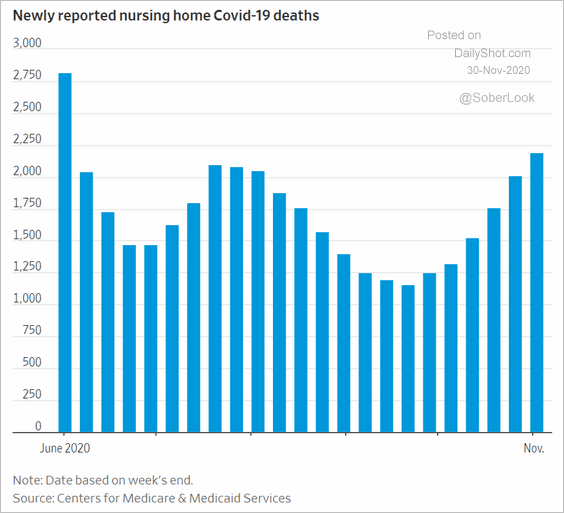 Source: @WSJ Read full article
8. Employed US mothers changing their work situation due to COVID:
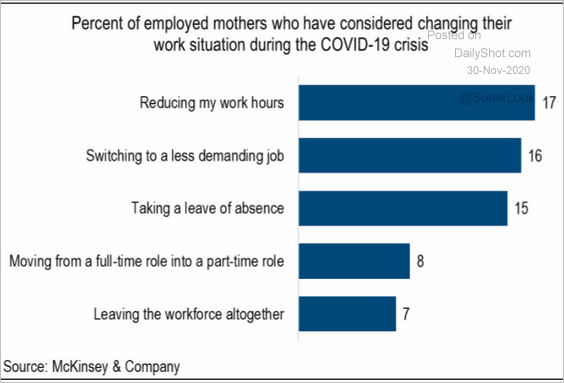 Source: McKinsey & Company, Stifel
9. Who should host Jeopardy?
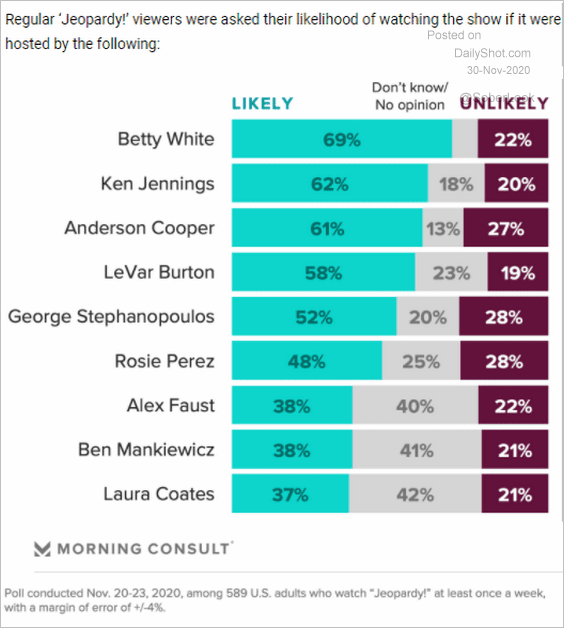 Source: Morning Consult Read full article
——————–