
The Daily Shot: 14-Dec-20
• The United States
• Canada
• The United Kingdom
• The Eurozone
• Europe
• Asia – Pacific
• China
• Emerging Markets
• Commodities
• Energy
• Equities
• Credit
• Global Developments
• Food for Thought
The United States
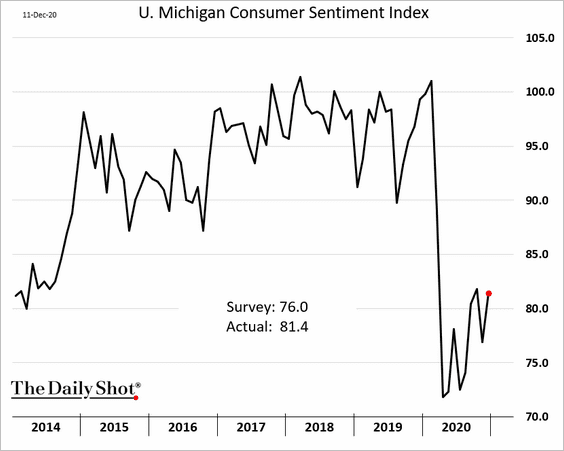
1. The U. Michigan consumer sentiment index surprised to the upside despite the worsening pandemic. Economists attributed the improvement to the vaccine news and higher stock prices.
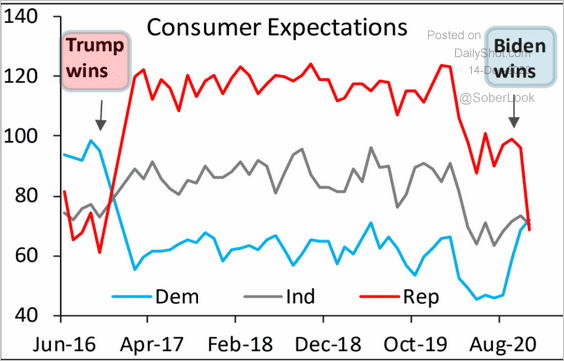
The expectations index continues to show partisan divergence.
 Source: Piper Sandler
——————–
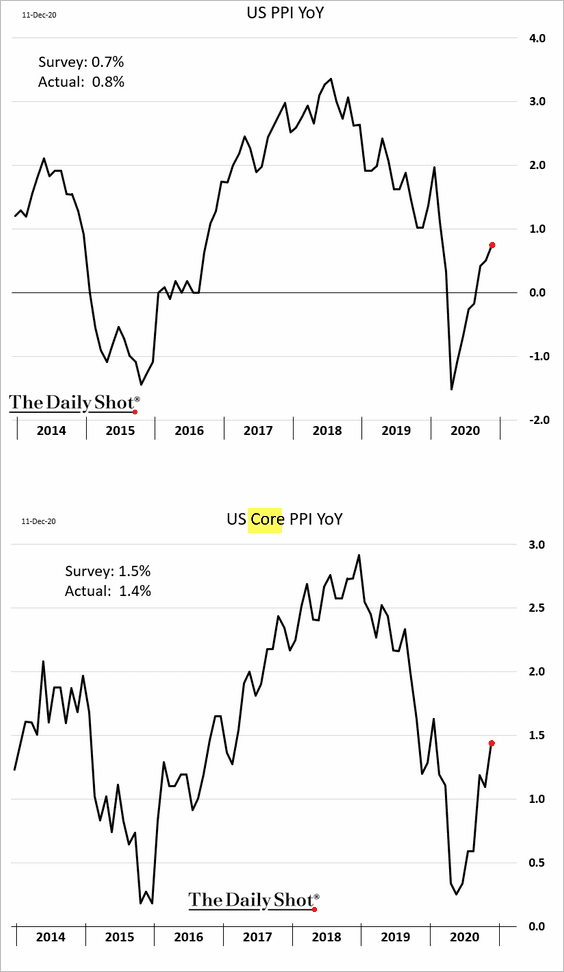
2. Next, we have some updates on inflation.
• The PPI showed a modest increase on a year-over-year basis.
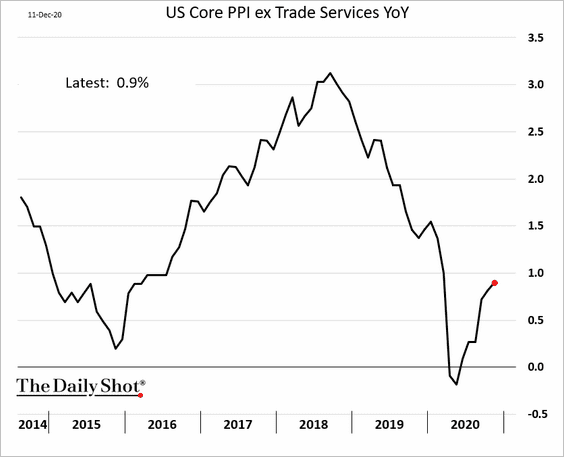
Here is the core PPI excluding trade services (business markups).
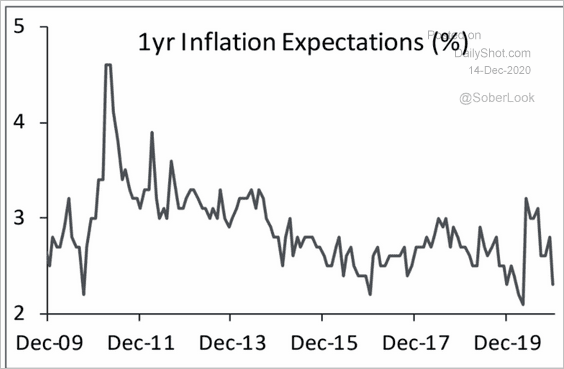
• The U. Michigan consumer inflation expectations continue to moderate.
 Source: Piper Sandler
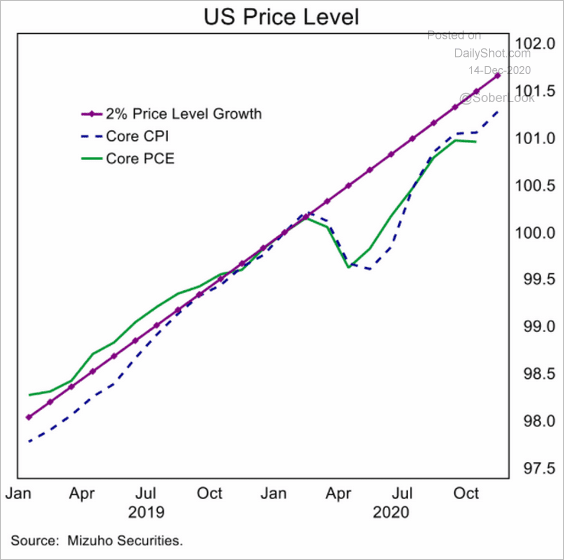
• Below are some additional updates on Friday’s CPI report.
– The CPI and the PCE inflation (price levels) relative to the 2% target:
 Source: Mizuho Securities USA
– CPI components that are sensitive to the pandemic:
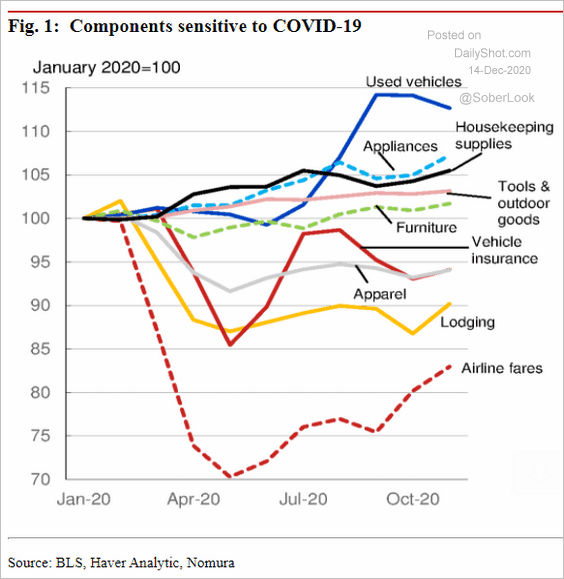 Source: Nomura Securities
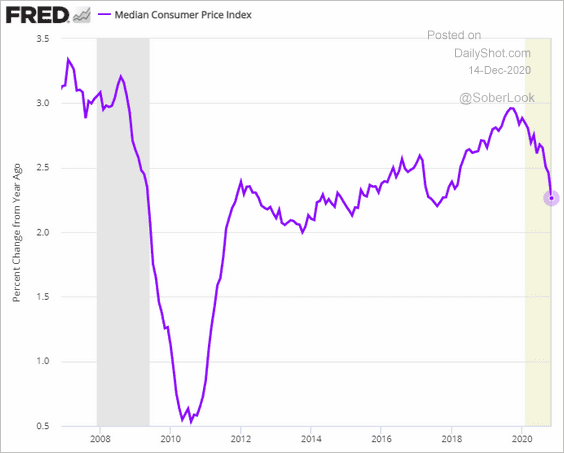
– The median CPI index:
– The core CPI vs. unit labor costs (pointing to further upside for inflation):
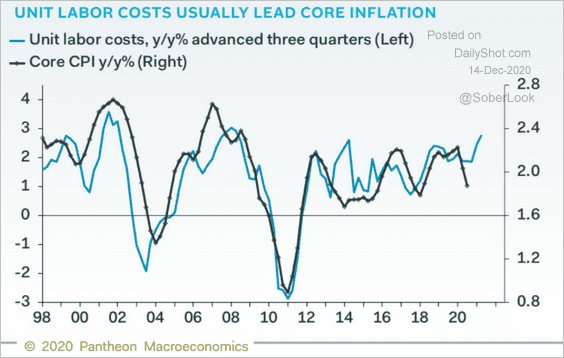 Source: Pantheon Macroeconomics
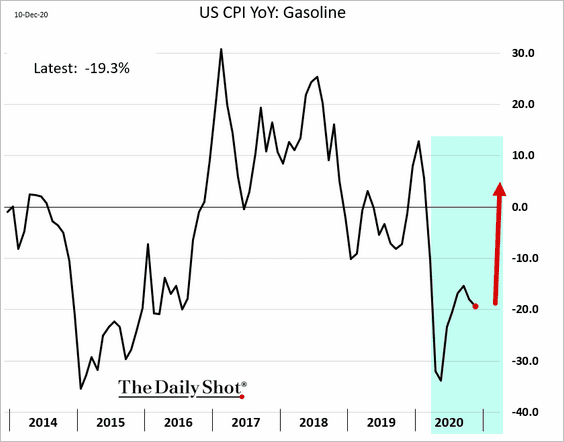
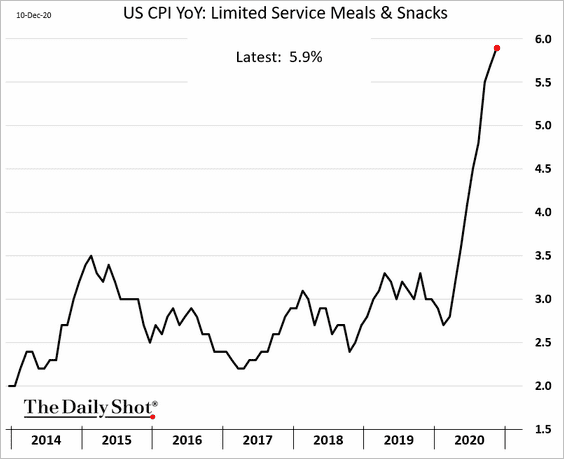
• Finally, we have a select set of CPI components.
– Gasoline (even if gasoline prices stay stable, the base effects should boost its contribution to the CPI early next year):
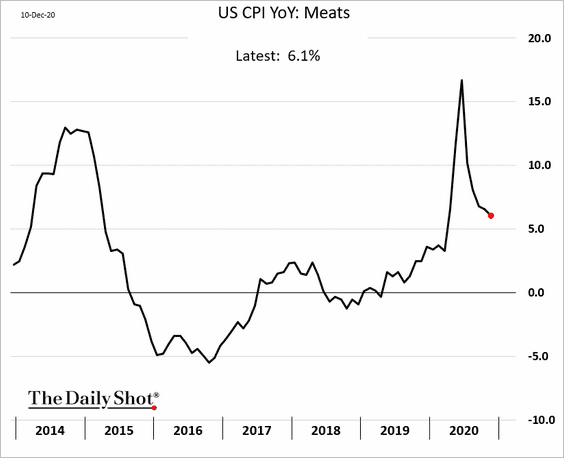
– Meats:
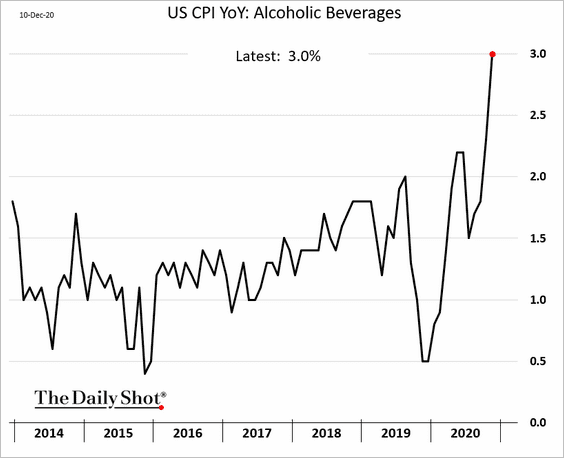
– Alcohol:
– Fast food restaurants:
– Airline fares:
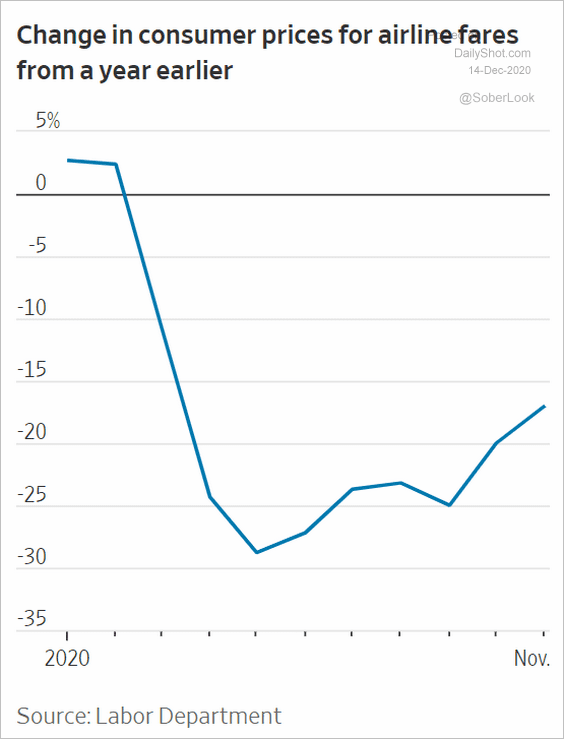 Source: @WSJ Read full article
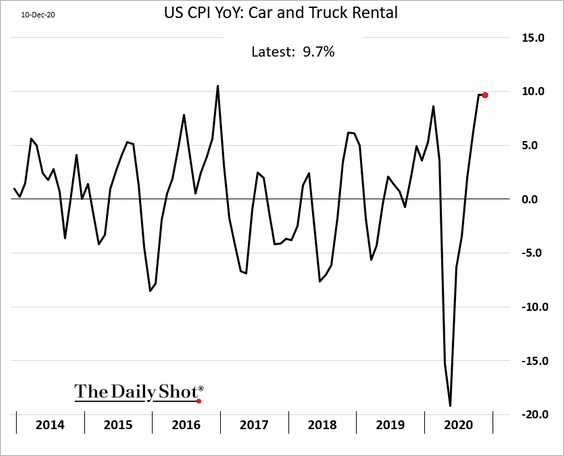
– Car rentals:
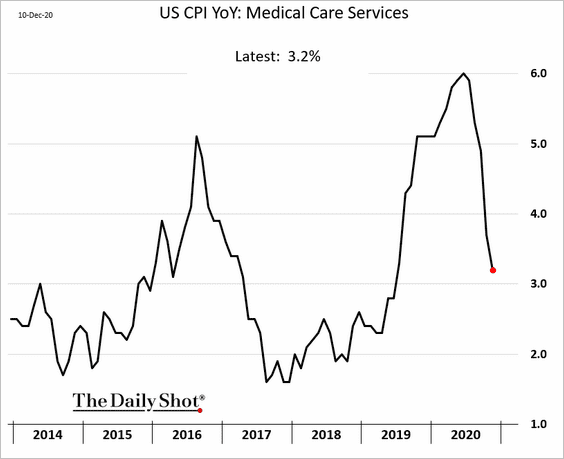
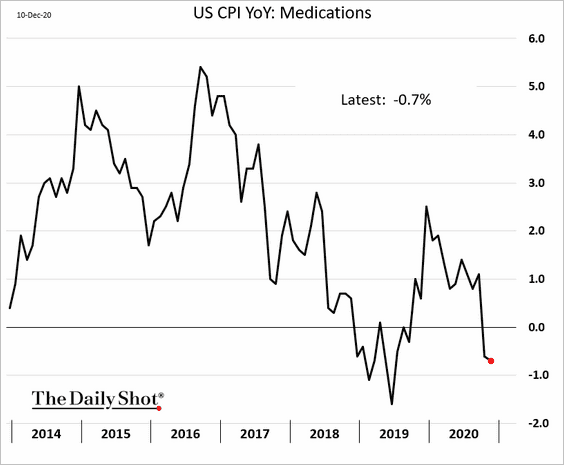
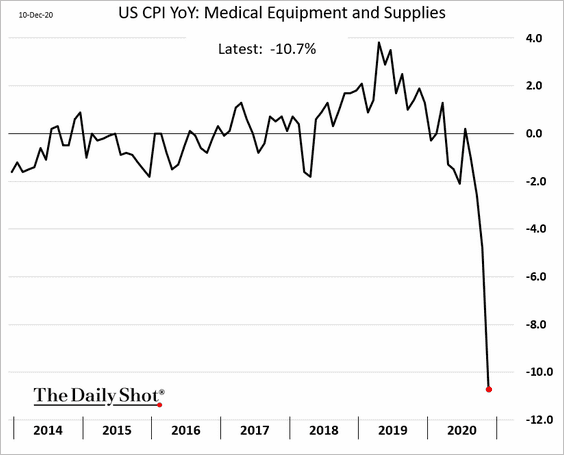
– Medical care and medications (3 charts):
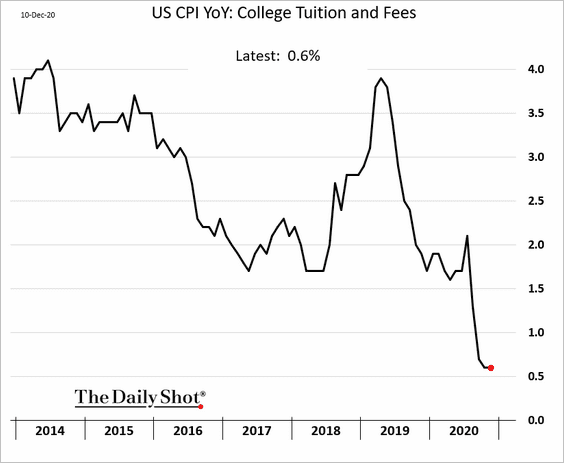
– College tuition:
——————–
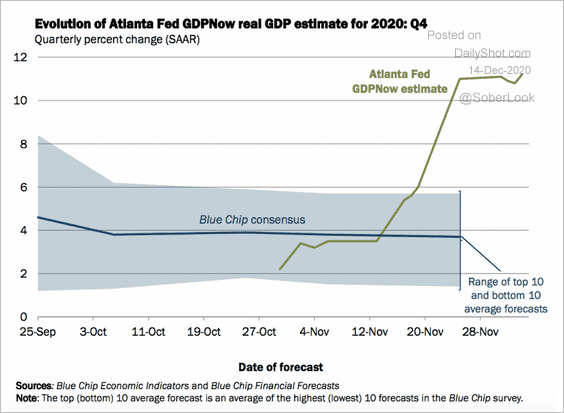
3. The Atlanta Fed’s GDP model forecast for Q4 has increased over the past few weeks and now sits at 11.2% (annualized).
 Source: Atlanta Fed
• Economists increasingly see upside risks to GDP forecasts for the next twelve months.
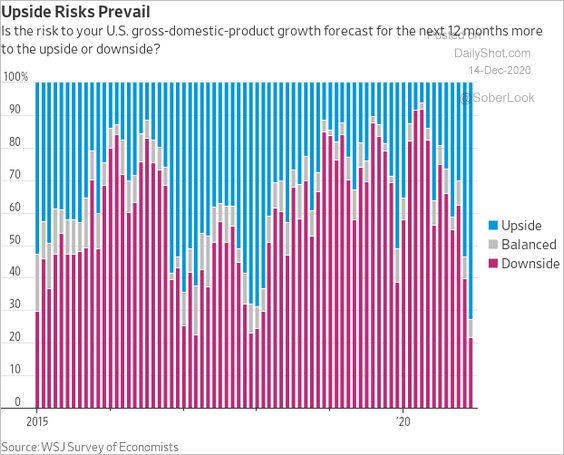 Source: @WSJ Read full article
But the recovery is expected to be uneven.
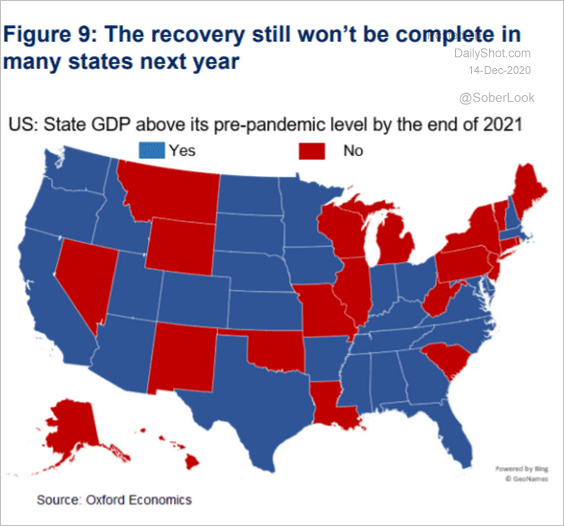 Source: Oxford Economics
——————–
4. This chart shows the growth in real wages relative to previous economic downturns.
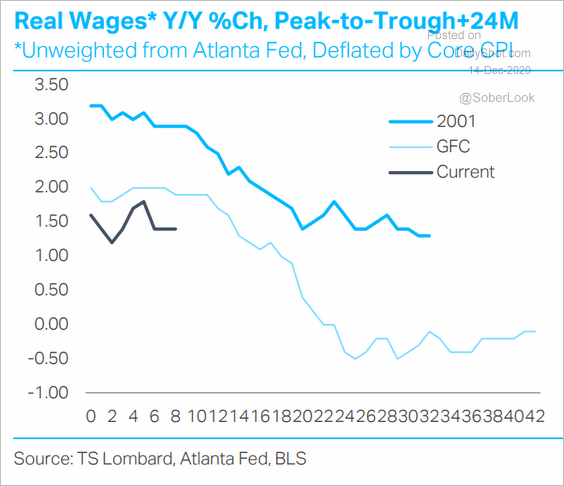 Source: TS Lombard
And here is personal income (which got a boost from government benefits).
 Source: Morgan Stanley Research
Excluding government support, household incomes have now fully recovered.
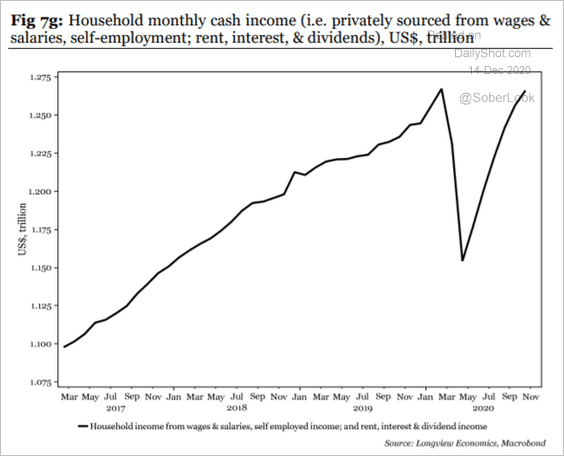 Source: Longview Economics
——————–
5. Consumer spending weakened in recent days.
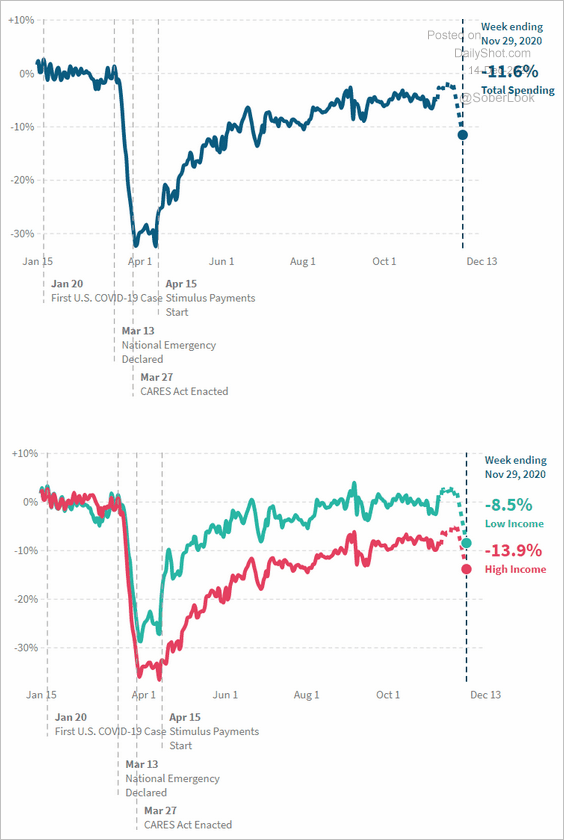 Source: @OppInsights
Here is a breakdown of the pandemic recovery by city (economic activity). Houston is taking the lead.
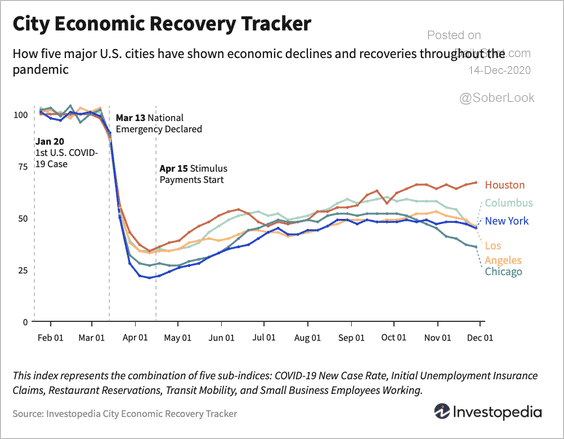 Source: Investopedia Read full article
——————–
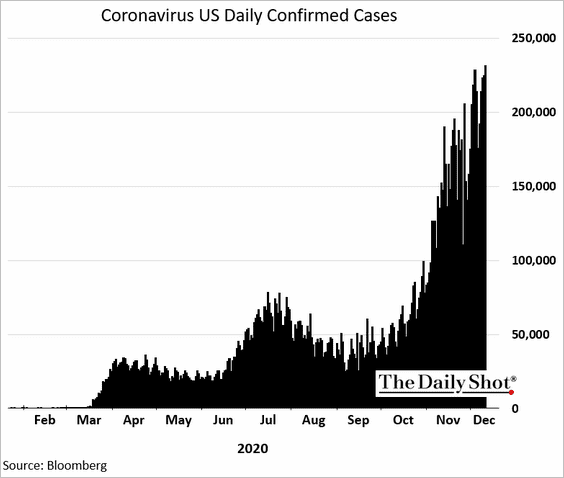
6. Finally, we have some updates on the worsening COVID situation. The vaccines couldn’t come soon enough.
• Daily new cases:
• Test positivity:
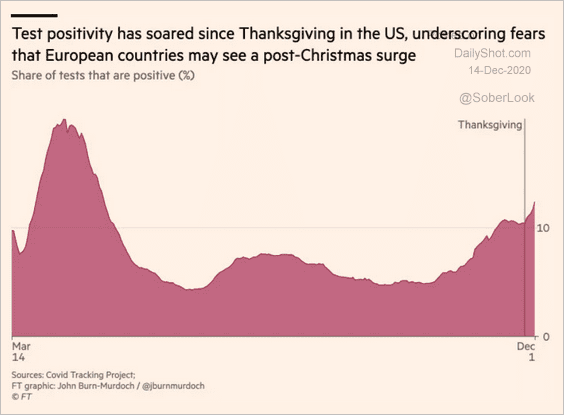 Source: @financialtimes Read full article
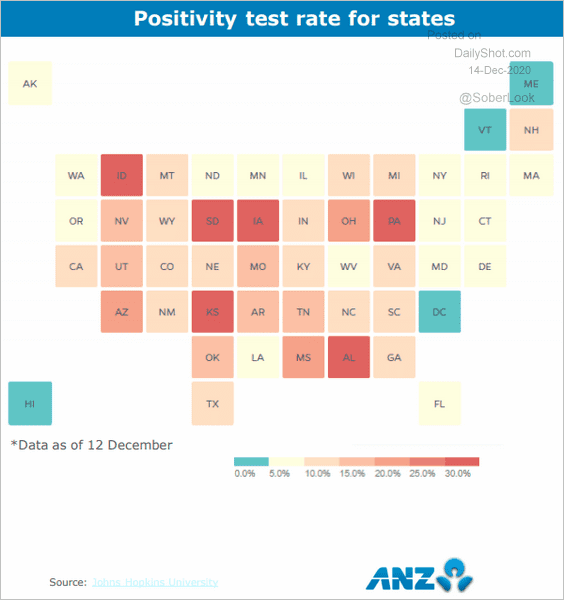 Source: ANZ Research
• Hospitalizations:
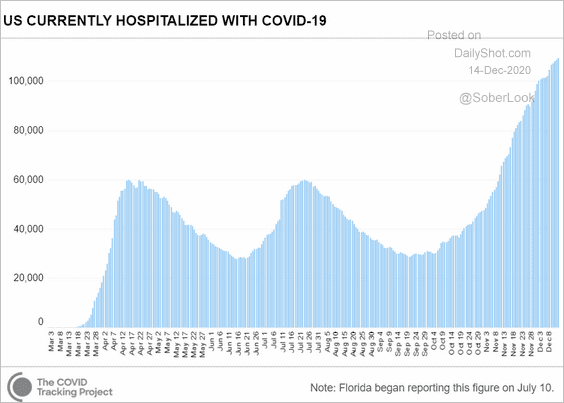 Source: CovidTracking.com
• ICU beds:
 Source: Statista
• Deaths:
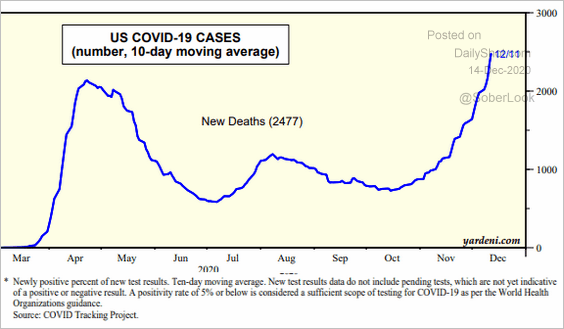 Source: Yardeni Research
Canada
1. Widespread deferral programs led to a 6% drop in total household debt payments in Q2.
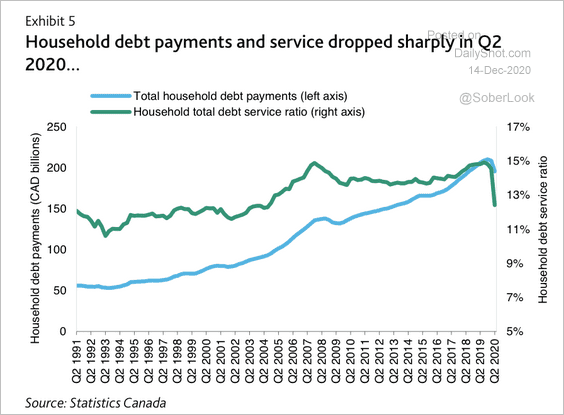 Source: Moody’s Investors Service
Fiscal support sharply decreased the debt-to-income ratio.
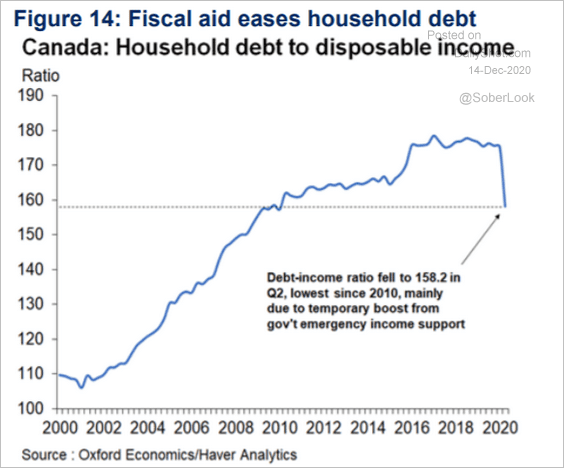 Source: Oxford Economics
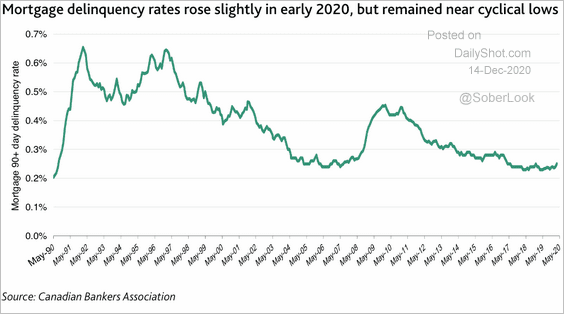
The residential mortgage 90+ day delinquency rate is near a 30 year low.
 Source: Moody’s Investors Service
——————–
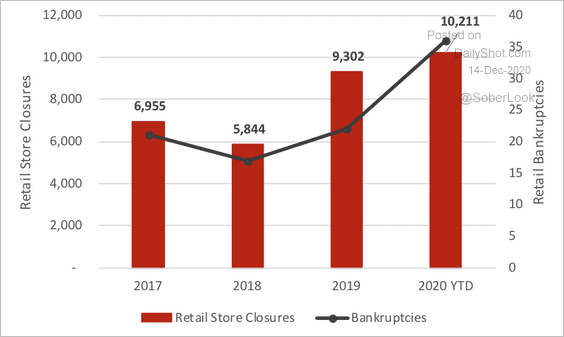
2. Retail bankruptcies and store closures accelerated this year.
 Source: Scotiabank Economics
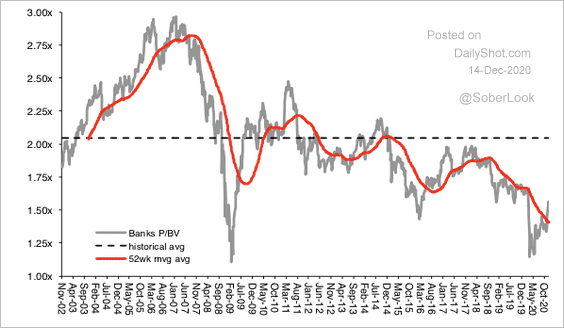
3. Bank valuations still have room to normalize.
 Source: Scotiabank Economics
The United Kingdom
1. The pound jumped on renewed hopes for a deal.
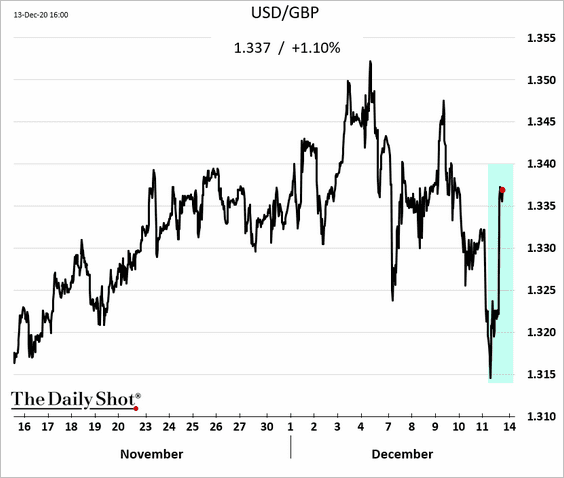
 Source: NBC News Read full article
——————–
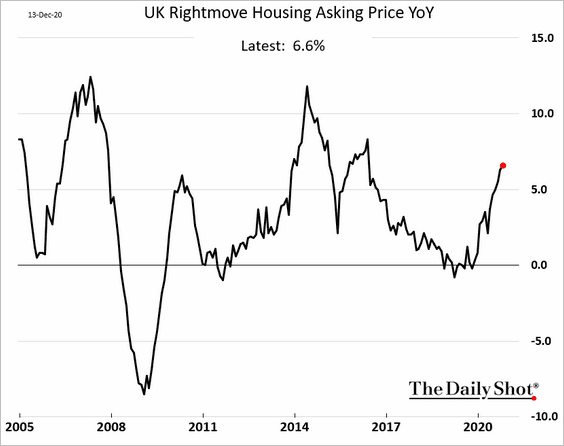
2. Asking prices point to further gains in the housing market.
The Eurozone
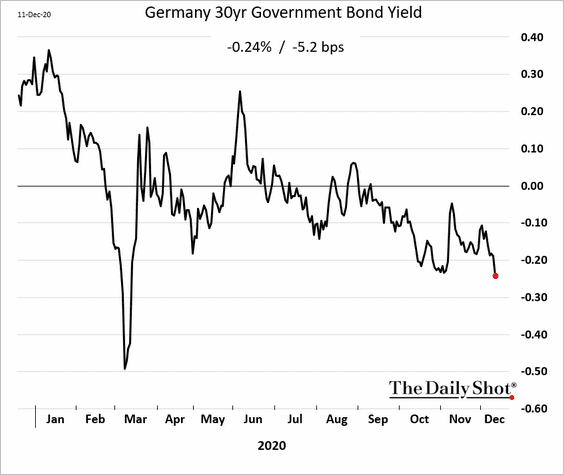
1. Let’s begin with Germany.
• Consumer inflation:
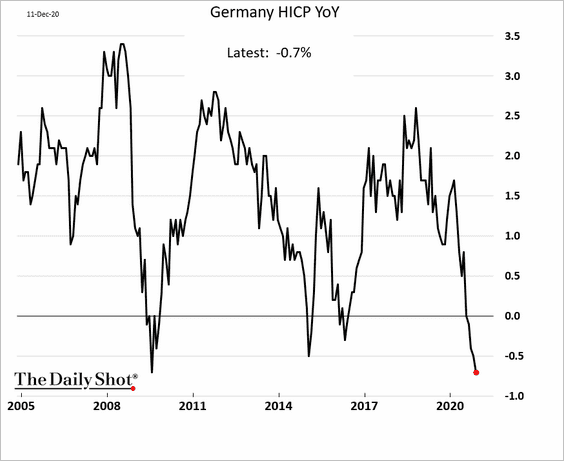
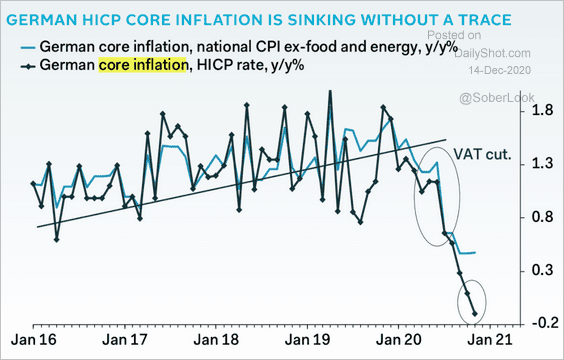 Source: Pantheon Macroeconomics
• The 30yr Bund yield:
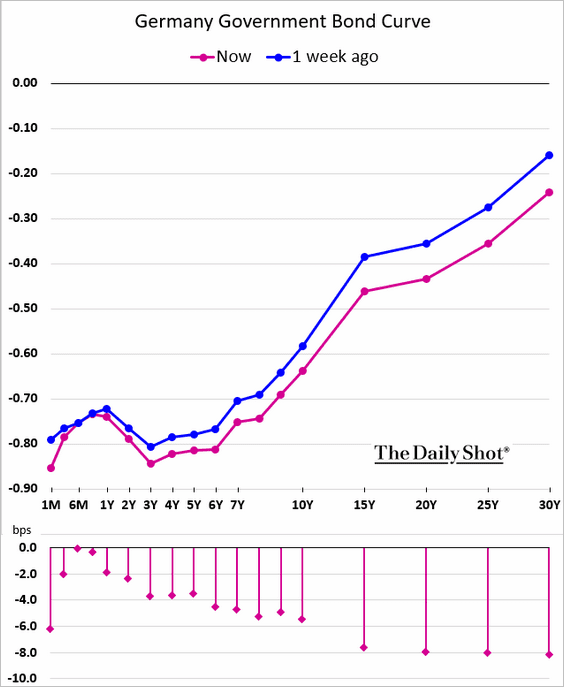
• The flattening yield curve:
• Labor market recovery:
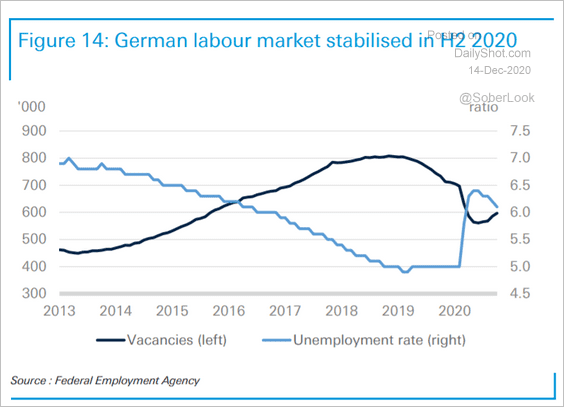 Source: Deutsche Bank Research
• Deutsche Bank’s forecast for short-time workers:
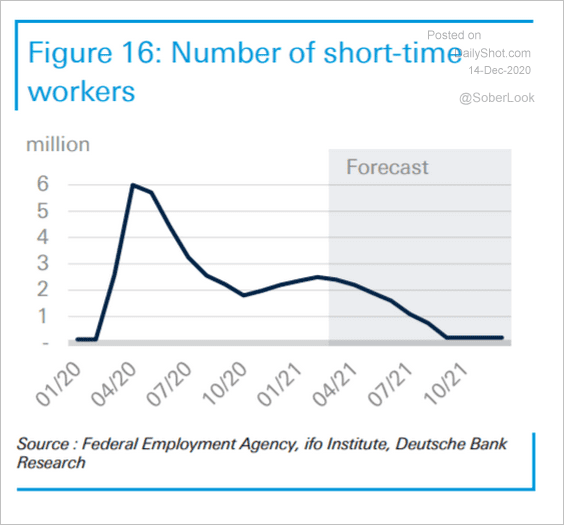 Source: Deutsche Bank Research
• Consumption changes by sector:
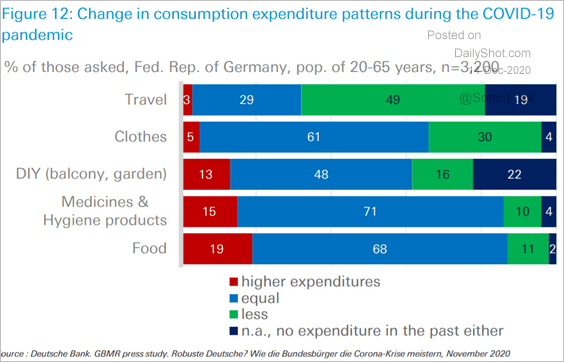 Source: Deutsche Bank Research
——————–
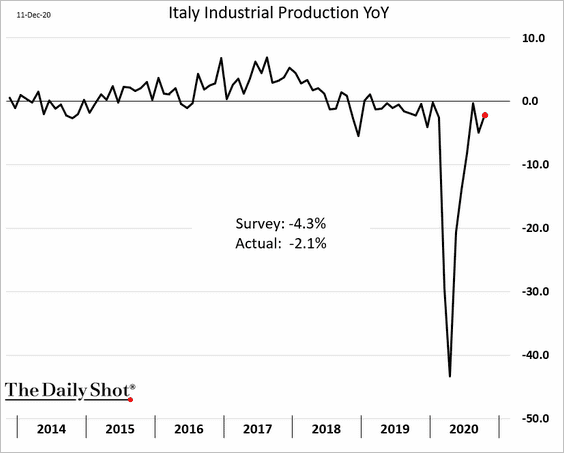
2. Italy’s industrial production has stabilized.
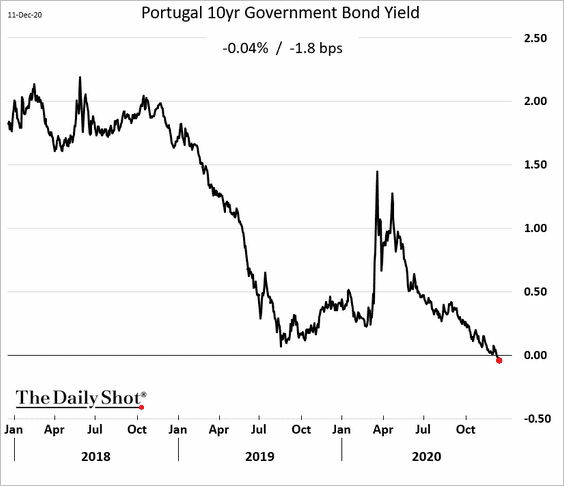
3. This is Portugal’s 10-year government bond yield.
4. Here is the breakdown of the ECB’s balance sheet.
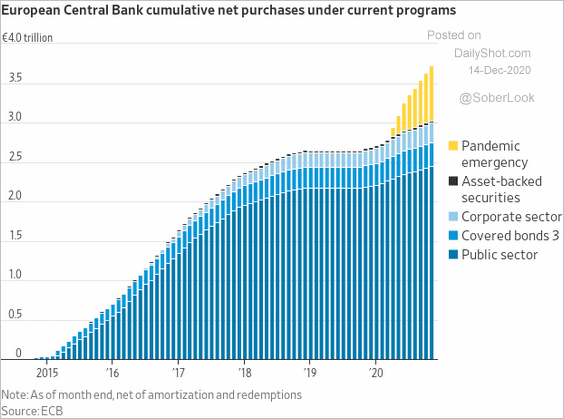 Source: @WSJ Read full article
5. “Periphery” countries have been large beneficiaries of the ECB’s TLTRO program.
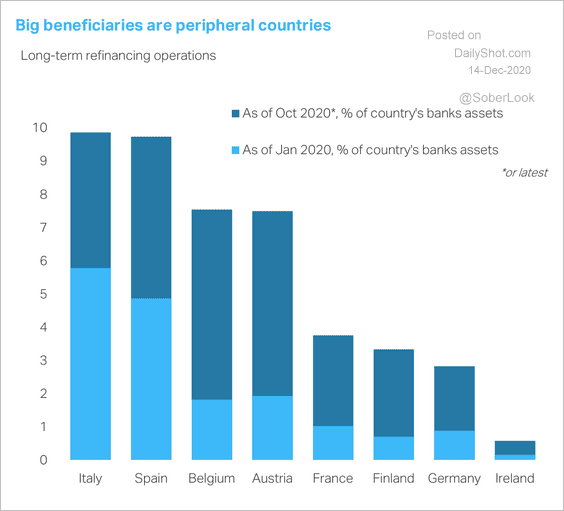 Source: TS Lombard
6. Will we see a tightening in the euro-area credit conditions due to lockdowns?
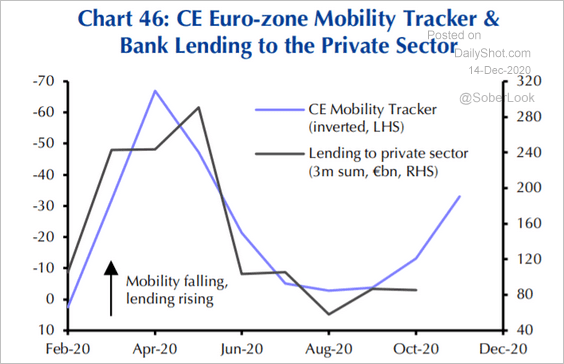 Source: Capital Economics
Europe
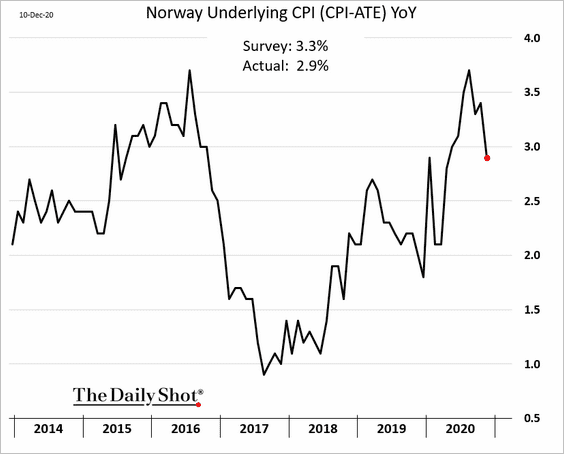
1. Norway’s CPI is moderating.
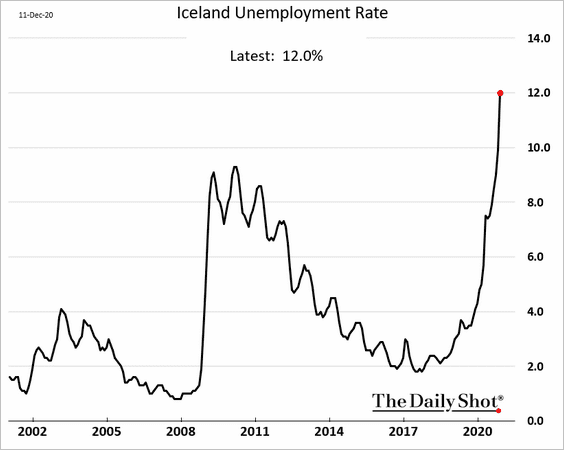
2. Iceland’s unemployment rate has exploded due to the collapse in tourism.
3. Unemployment rates across Western Europe are expected to climb further.
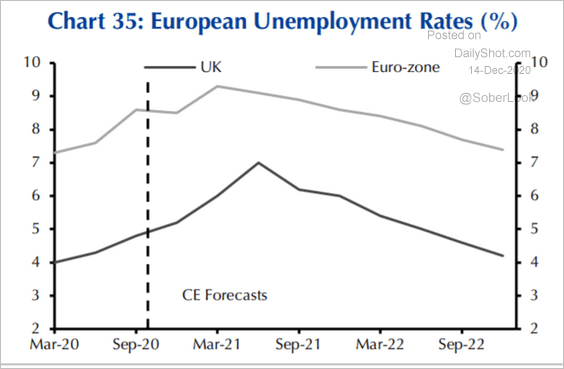 Source: Capital Economics
4. How do voters view the EU recovery fund?
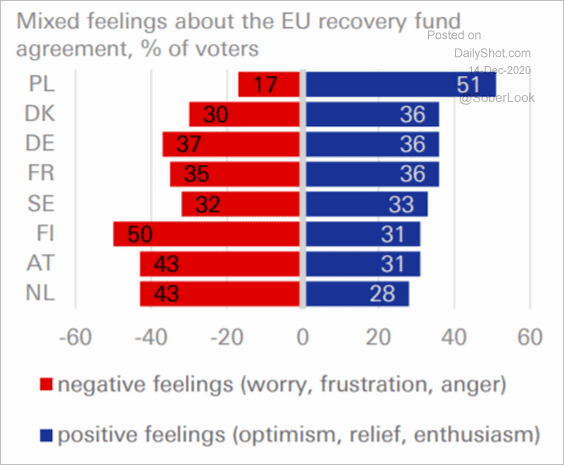 Source: Deutsche Bank Research
5. Borrowing costs have not been a constraint to spending.
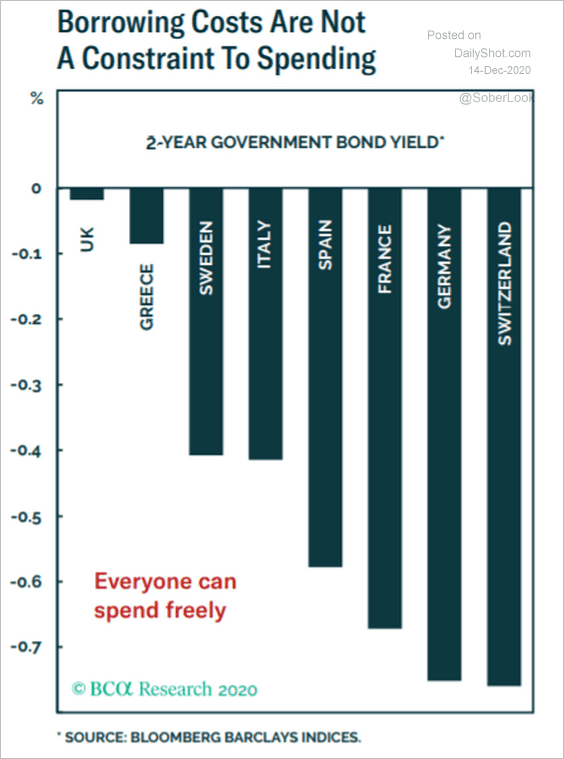 Source: BCA Research
Asia – Pacific
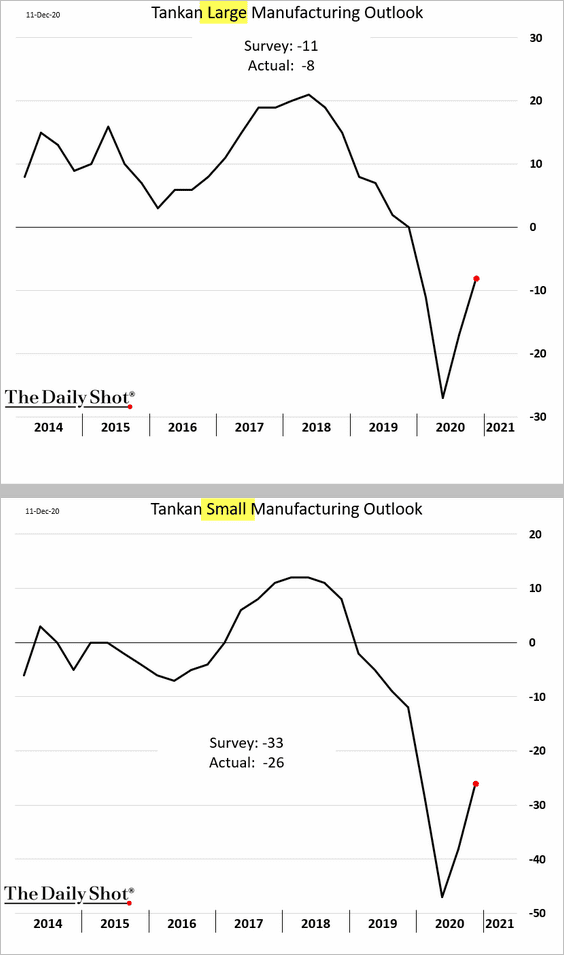
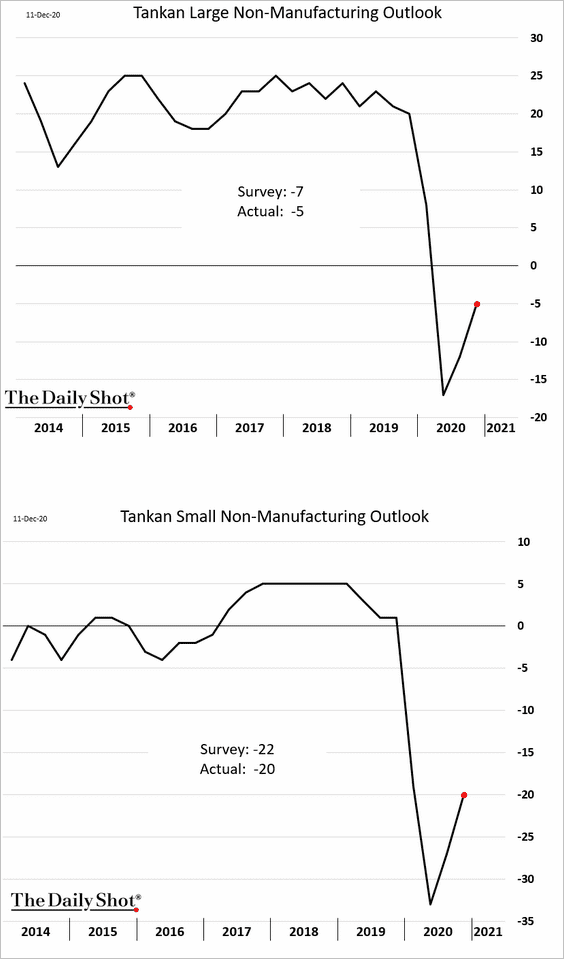
1. Japan’s Tankan survey topped economists’ forecasts.
• Manufacturing:
• Nonmanufacturing:
——————–
2. Here is South Korea’s third wave:
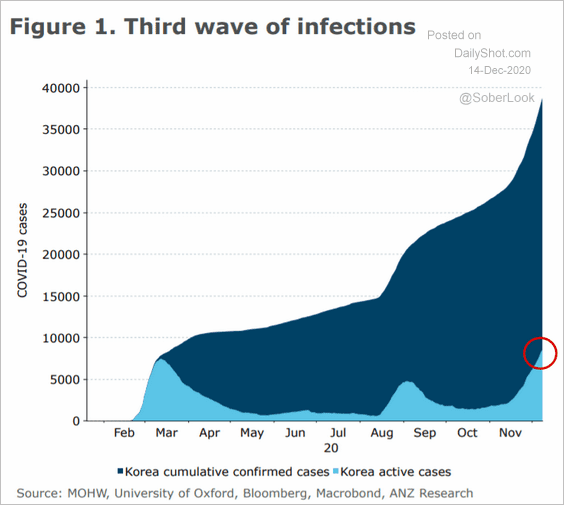 Source: ANZ Research
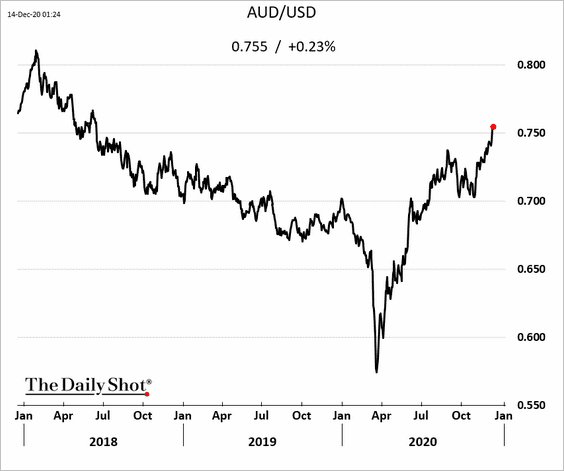
4. The Aussie dollar continues to climb.
China
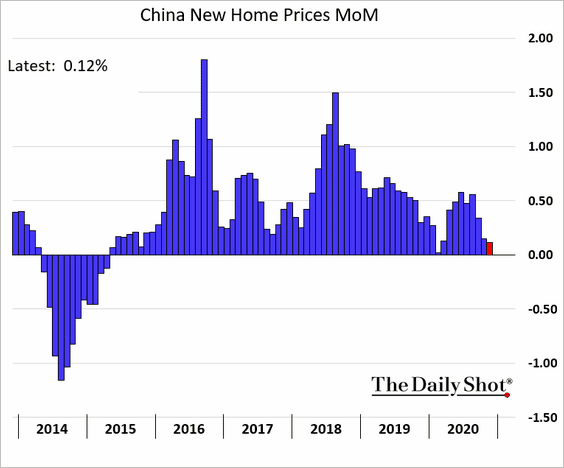
1. Home price appreciation has slowed.
2. Car sales have recovered.
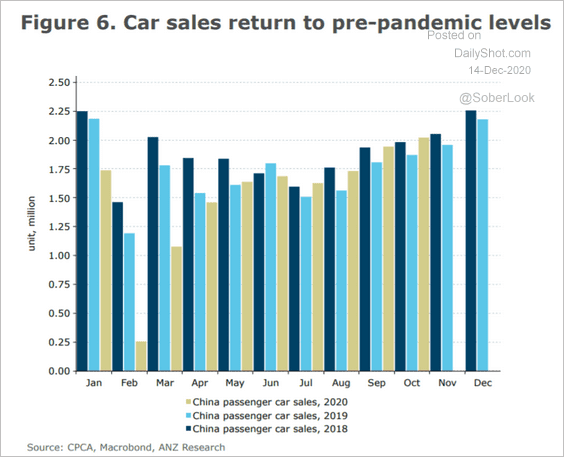 Source: ANZ Research
3. Credit growth is expected to slow next year.
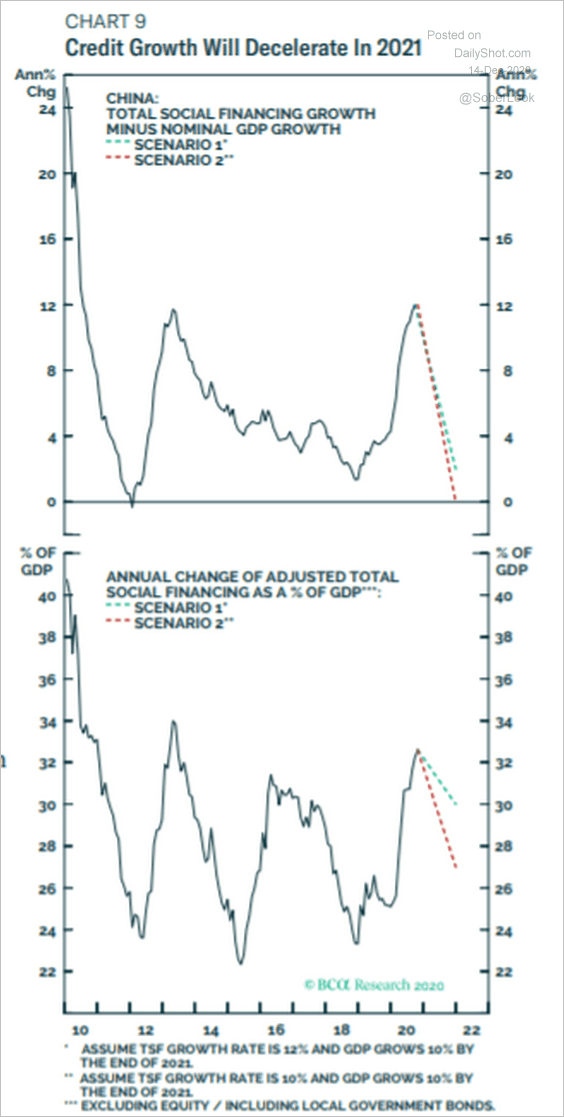 Source: BCA Research
The PBoC is de-risking some of the “shadow” credit activities.
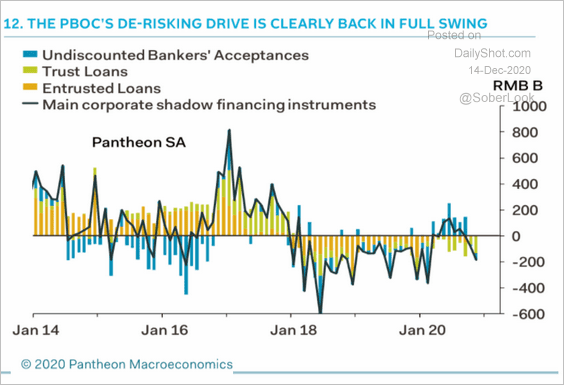 Source: Pantheon Macroeconomics
——————–
4. The Shanghai Stock Exchange Composite held support.
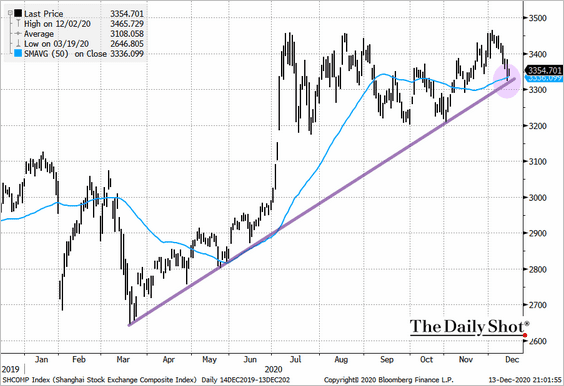 Source: @TheTerminal, Bloomberg Finance L.P.
5. Growth in China’s labor productivity has been slowing.
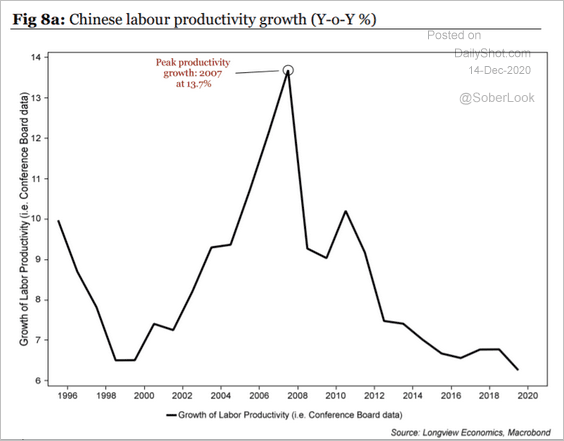 Source: Longview Economics
Emerging Markets
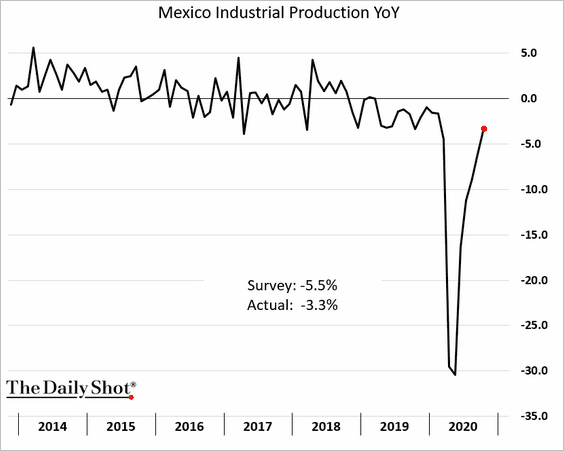
1. Mexico’s industrial production surprised to the upside.
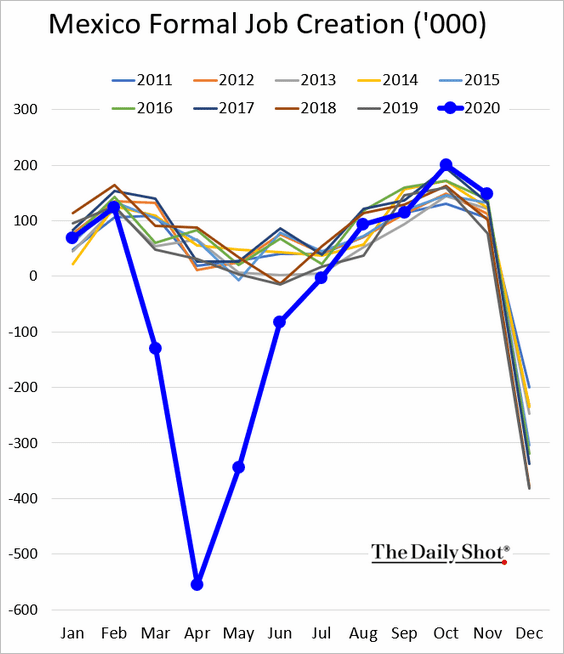
Formal job creation is holding above last year’s levels.
——————–
2. Here are some trends in Latin America.
• Scotiabank’s policy rate forecast:
 Source: ANZ Research
• Current real rates:
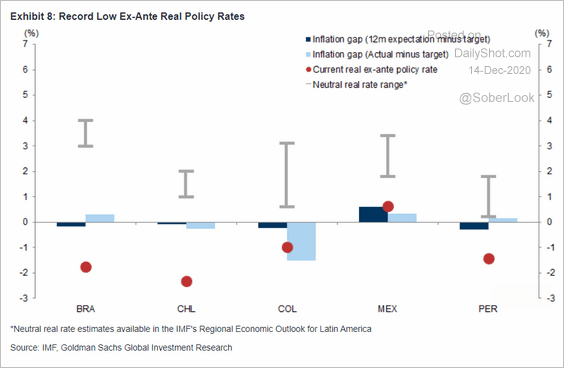 Source: Goldman Sachs
• Goldman’s inflation forecasts:
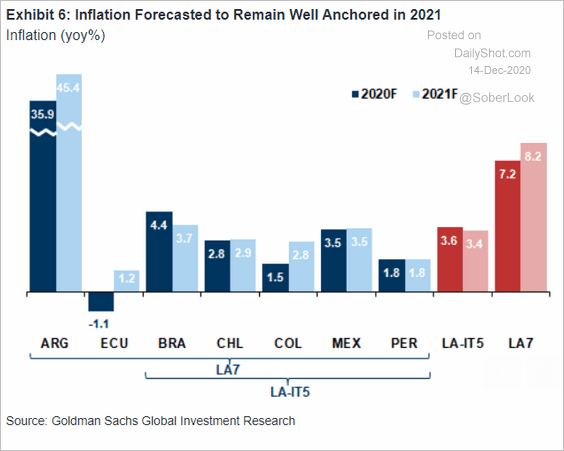 Source: Goldman Sachs
• Scotiabank’s GDP growth forecasts:
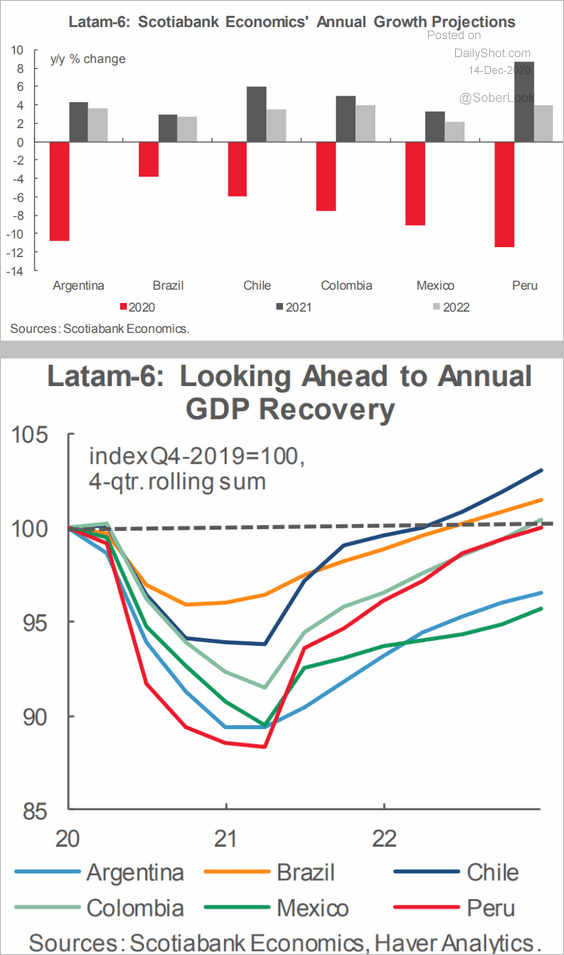 Source: Scotiabank Economics
——————–
3. Next, we have some updates on India.
• Industrial production through October (better than expected):
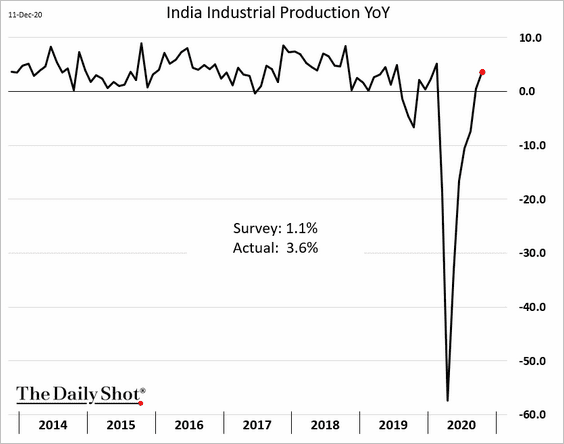
• Industrial trends through November:
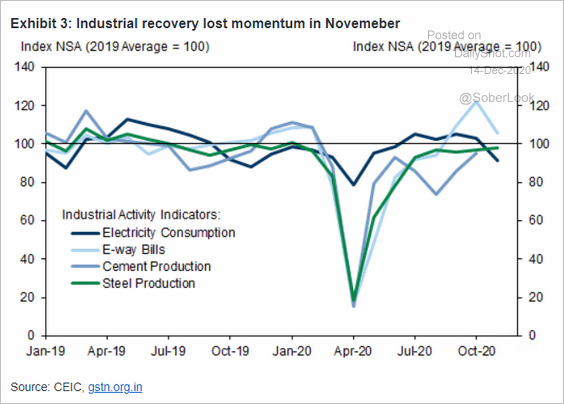 Source: Goldman Sachs
• Credit growth by business size:
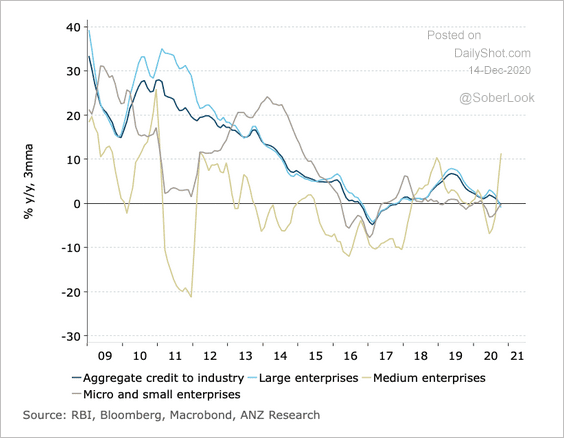 Source: ANZ Research
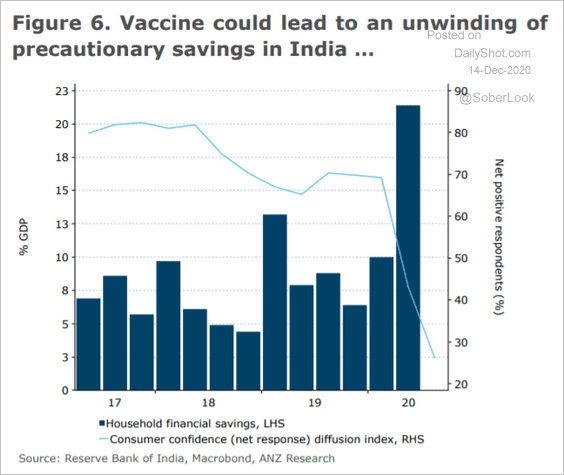
• Consumer confidence in India has collapsed, contributing to a surge in precautionary savings.
Source: ANZ Research
——————–
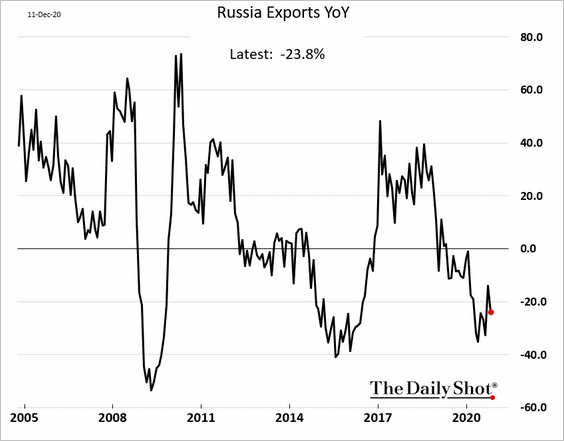
4. Russia’s exports remain depressed (in part due to weaker energy prices).
5. How have budget balances changed over the past 12 months?
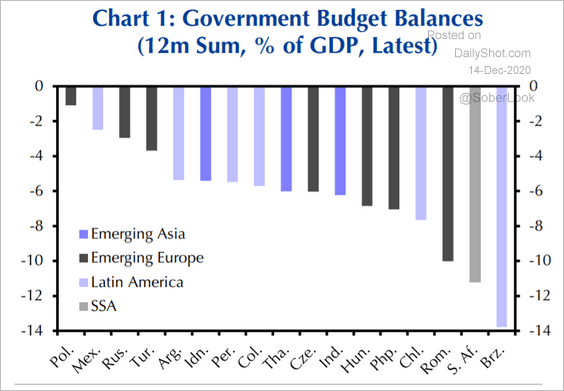 Source: Capital Economics
Commodities
1. Iron ore prices seem to be too high relative to inventories at China’s ports.
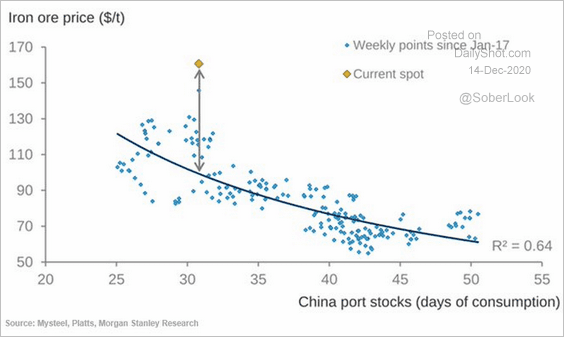 Source: Morgan Stanley Research, @Scutty
2. Fitch expects limited upside for most industrial metals (especially iron ore) and agriculture commodities.
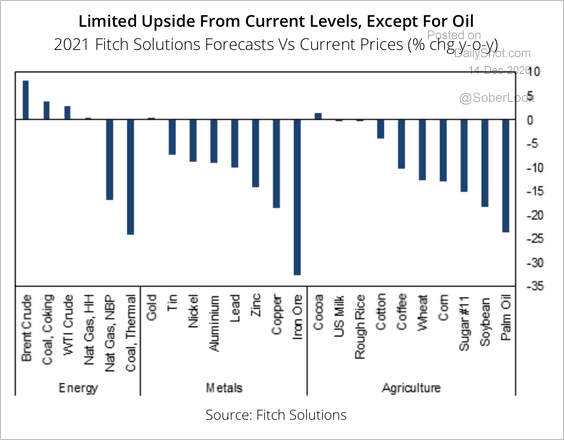 Source: Fitch Solutions Macro Research
3. European carbon credit prices keep climbing due to the EU’s aggressive emissions plan.
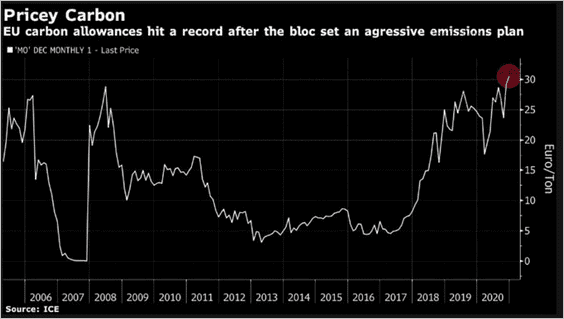 Source: @SStapczynski
4. US wheat prices are up sharply.
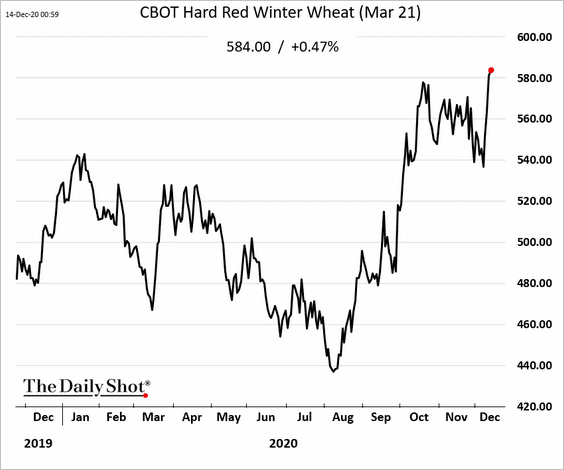
 Source: Enidnews.com Read full article
——————–
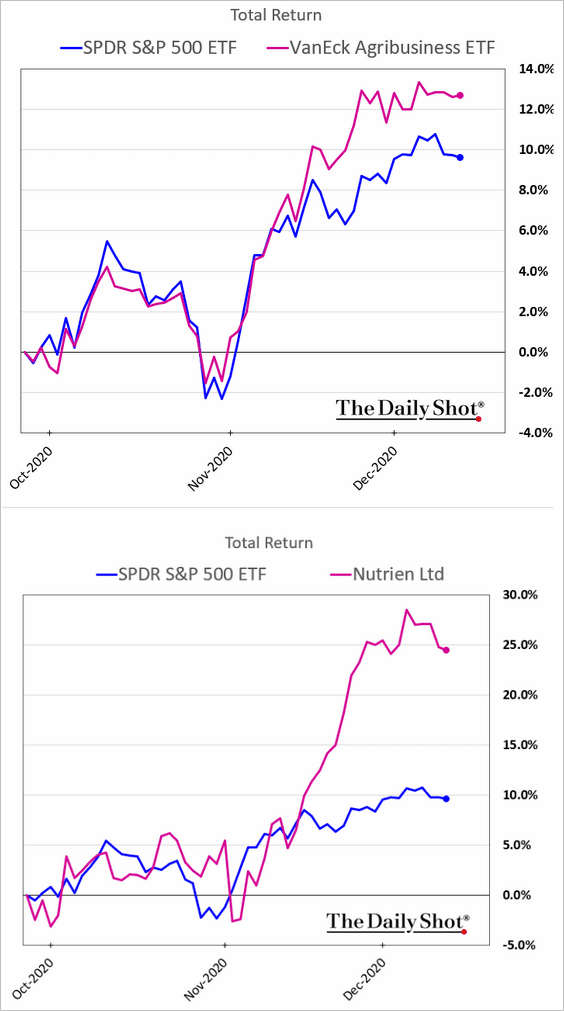
5. Fertilizer producers’ shares have been rising with agricultural commodities.
Energy
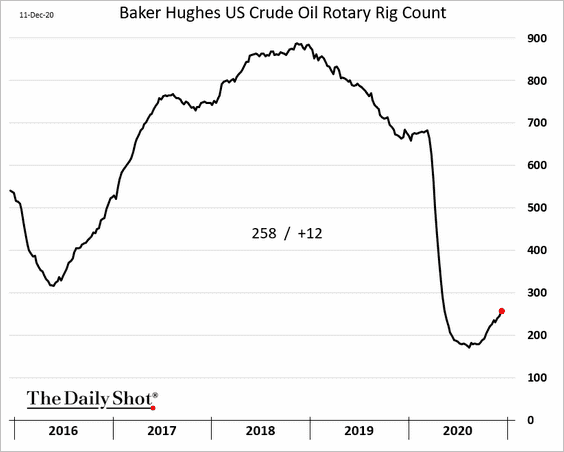
1. US rig count continues to recover.
2. Oil demand is expected to increase substantially next year.
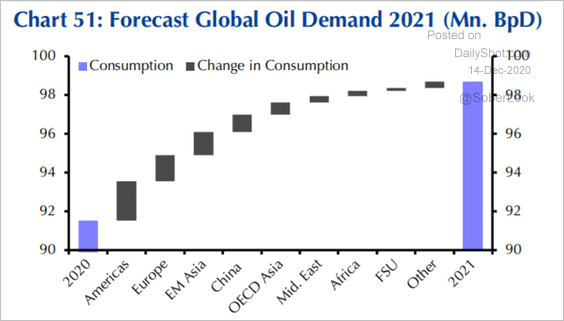 Source: Capital Economics
3. Fitch expects energy to outperform the commodities complex next year.
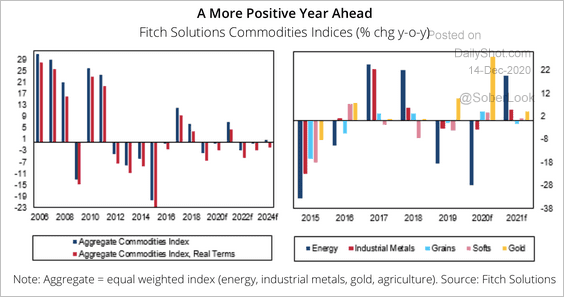 Source: Fitch Solutions Macro Research
4. US energy stocks now pay higher dividends than utilities.
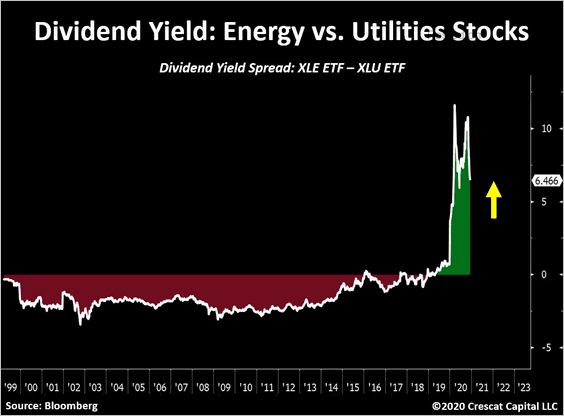 Source: @TaviCosta
5. Asian LNG prices are up sharply.
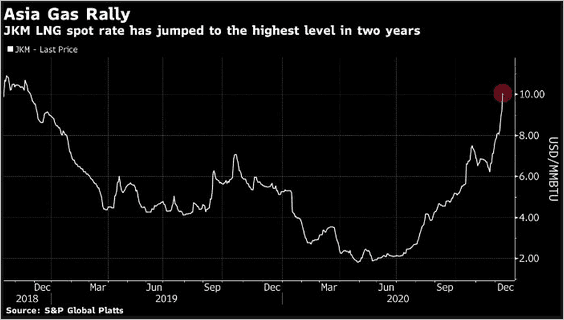 Source: @SStapczynski
Here is the LNG spread to US natural gas.
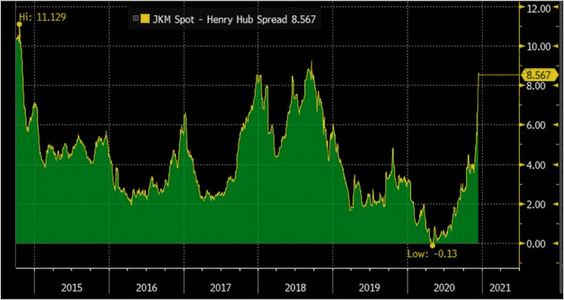 Source: @merrillmatter, @SStapczynski
——————–
6. The March-April US natural gas futures spread has collapsed due to warmer weather expectations.
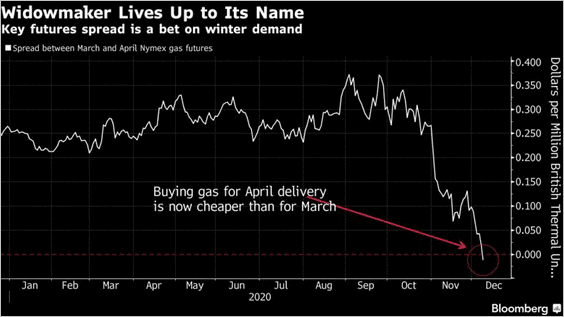 Source: @markets Read full article
7. Uranium prices are higher this year.
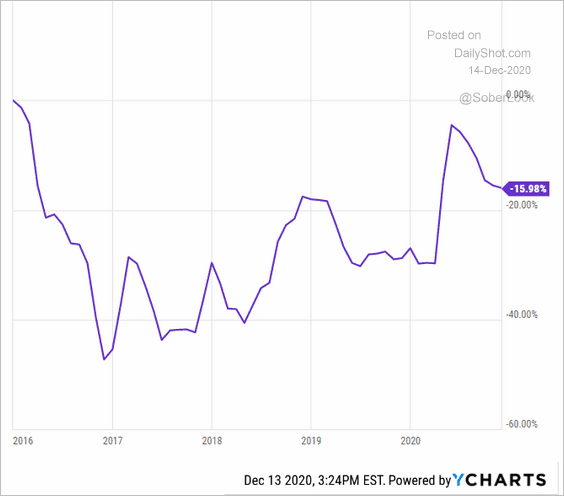 h/t Walter
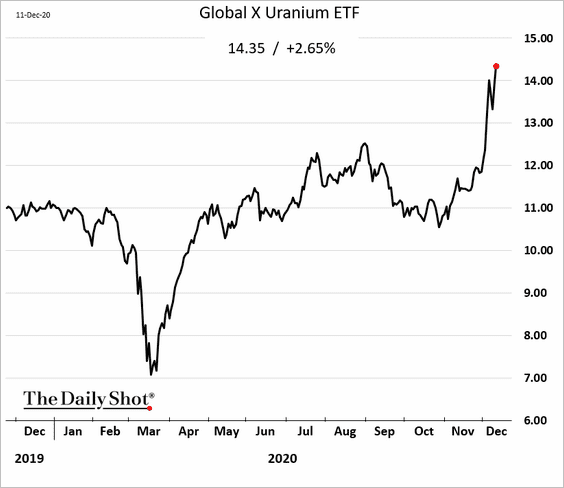
Uranium stocks are soaring.
 h/t Walter
 Source: Small Caps Read full article
Equities
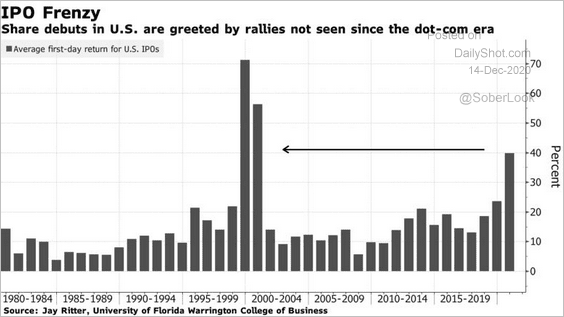
1. It’s been a good year for IPOs
 Source: @markets Read full article
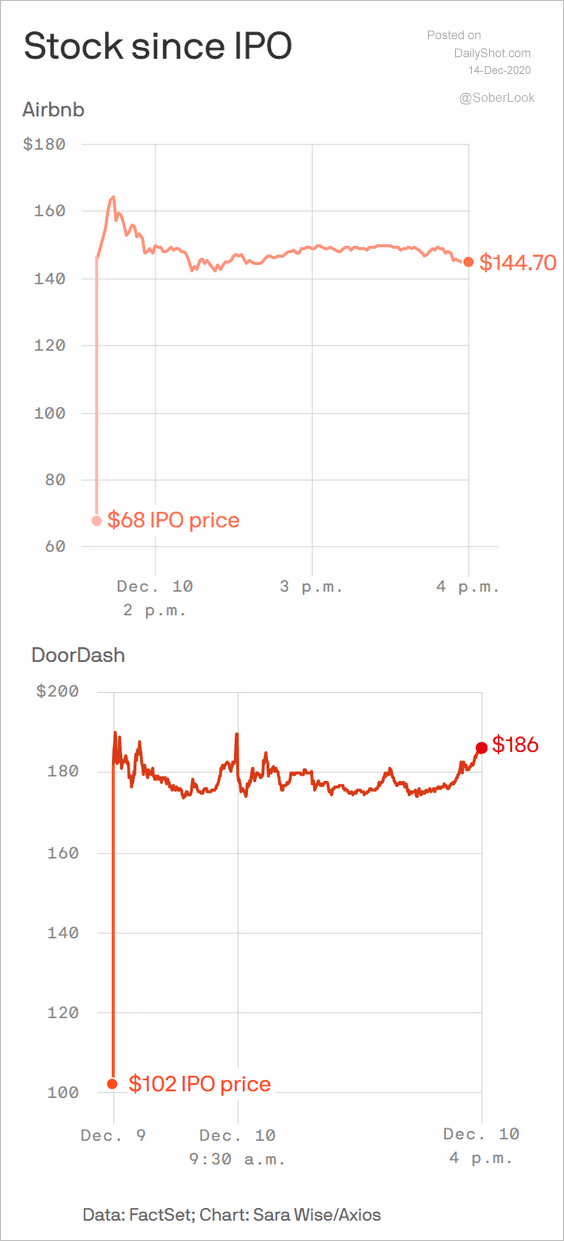 Source: @axios Read full article
• Post-IPO stocks are following the 1995 trend.
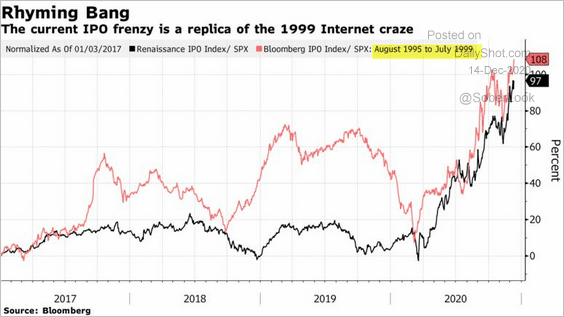 Source: @business Read full article
• The volume of SPAC sales has been unprecedented.
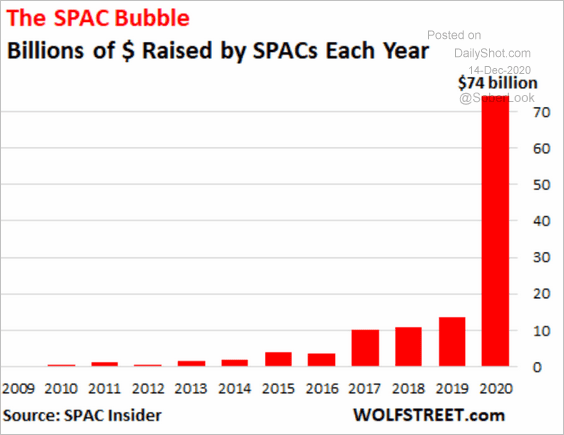 Source: Wolf Street Read full article
• Equity issuance has been outpacing share buybacks.
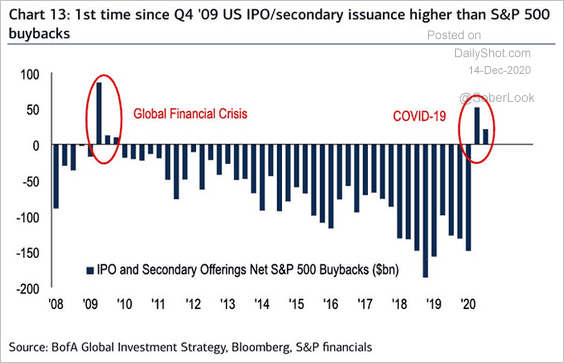 Source: @ISABELNET_SA, @BofAML
——————–
2. Dividend yields are attractive versus government bonds.
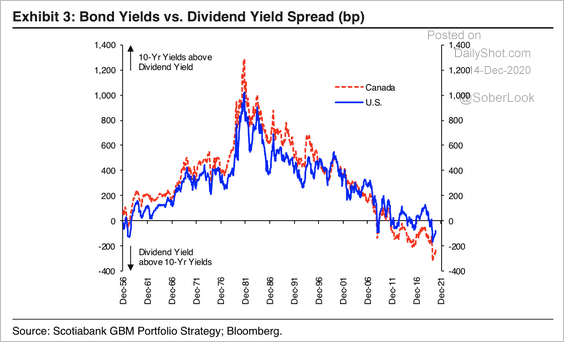 Source: Hugo Ste-Marie, Portfolio & Quantitative Strategy Global Equity Research, Scotia Capital
Here is the relative performance of the Dividend Aristocrats index.
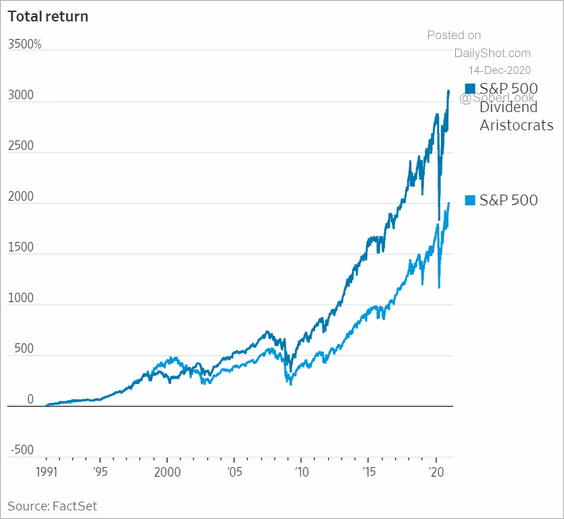 Source: @WSJ Read full article
——————–
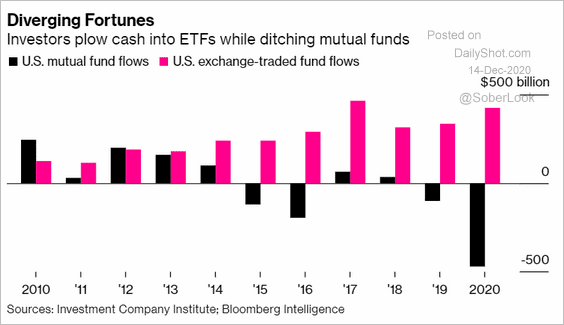
3. Mutual funds saw significant outflows this year, even as ETFs continue to attract capital.
 Source: @business Read full article
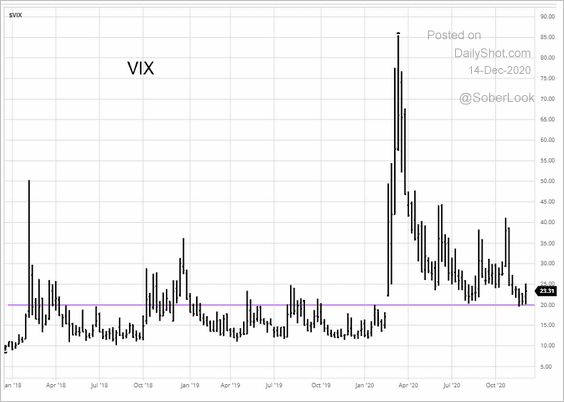
4. VIX is holding above 20 for now.
 Source: barchart.com
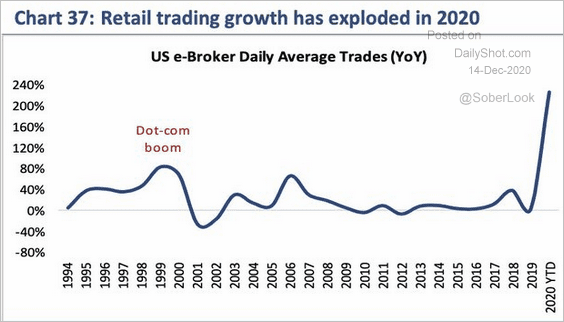
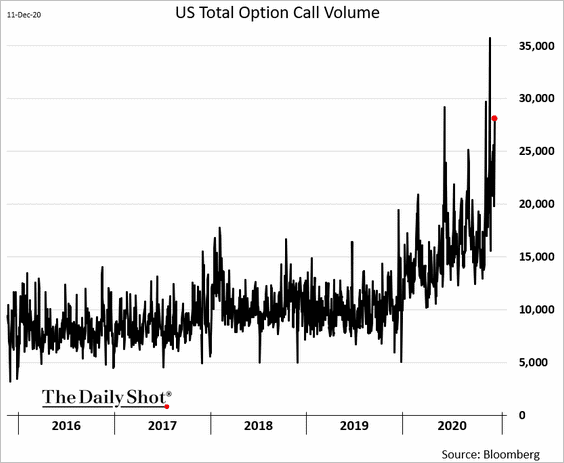
5. Retail speculative activity remains elevated.
• Electronic broker volume:
 Source: @jtepper2
• Call option volume:
Credit
1. Corporate debt-to-GDP ratio rose sharply this year.
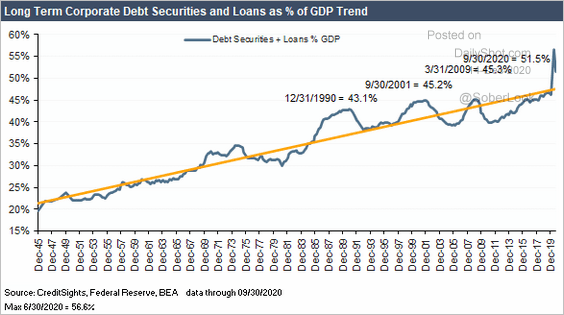 Source: CreditSights
Leverage increased at many European investment-grade firms.
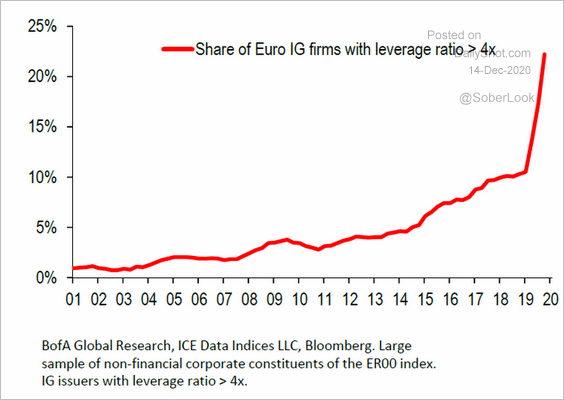 Source: @jsblokland
——————–
2. Corporate bond funds saw massive inflows in 2020.
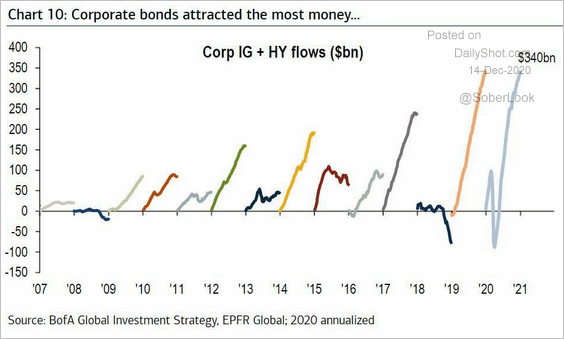 Source: BofA Global Research
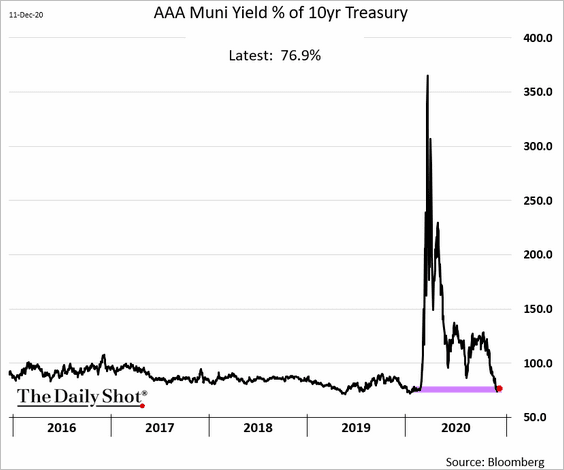
3. Despite a weakened financial situation for many states and municipalities, AAA muni yields are back at pre-crisis levels (relative to Treasuries).
Global Developments
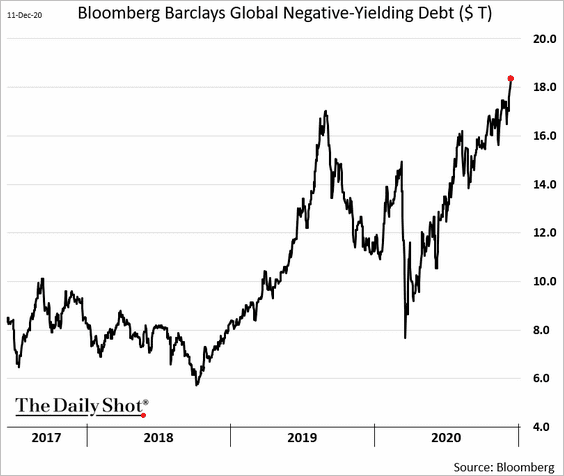
1. The amount of negative-yielding debt keeps hitting new records.
2. This chart shows asset classes with the largest fund inflows each year.
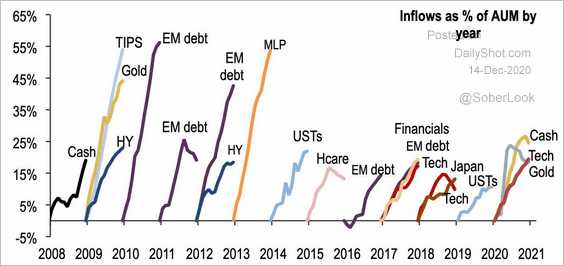 Source: BofA Global Research
3. Asset managers continue to press their bets against the dollar.
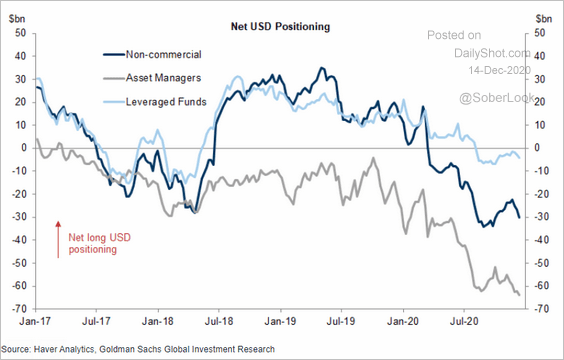 Source: Goldman Sachs
——————–
Food for Thought
1. The biggest private employer in each state:
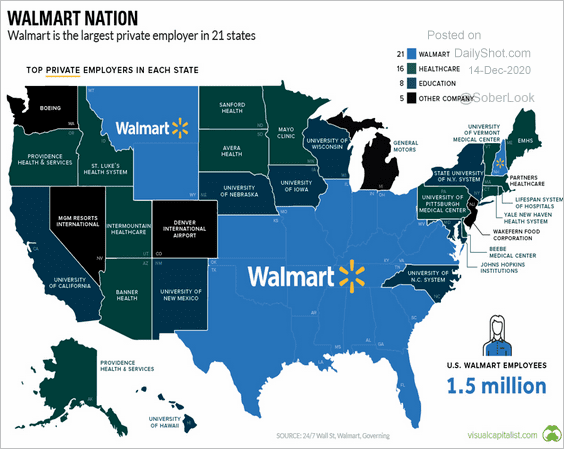 Source: Visual Capitalist Read full article
2. US credit card spending trends:
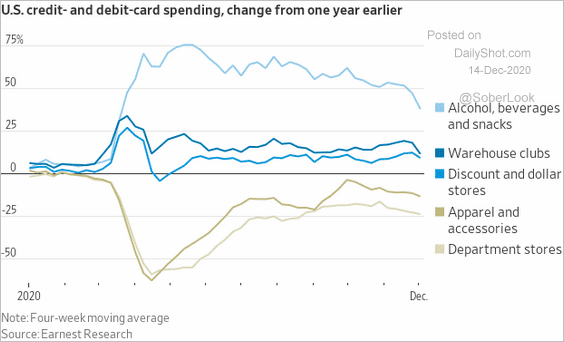 Source: @WSJ Read full article
3 The IRS budget:
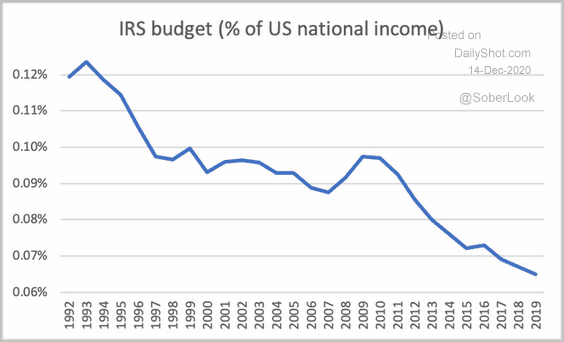 Source: @gabriel_zucman
4. Elevated payment delinquencies long before borrowers’ Alzheimer’s diagnosis:
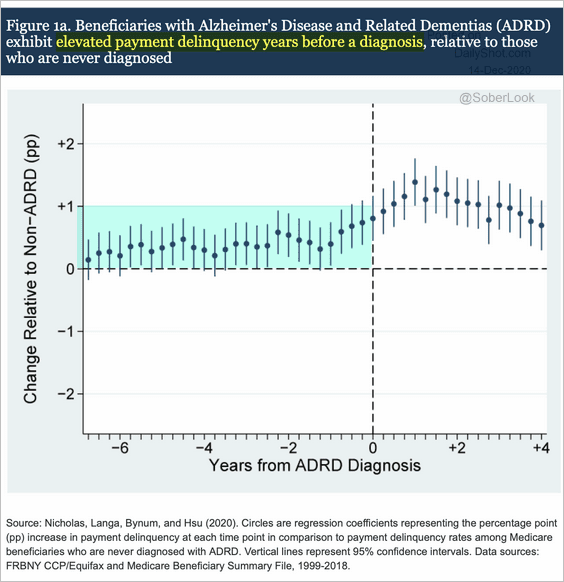 Source: Federal Reserve Read full article
5. The vaccine distribution timeline in the US:
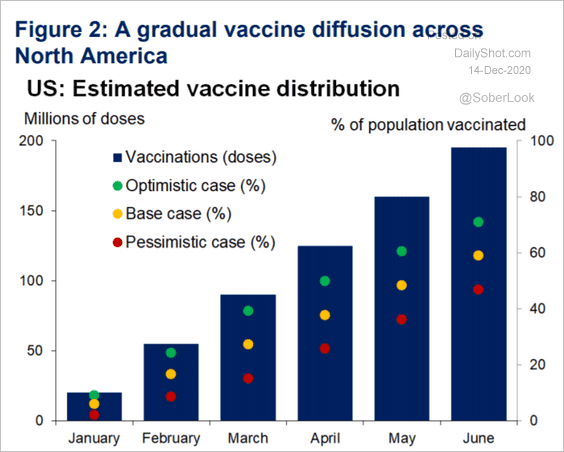 Source: Oxford Economics
 Source: @WSJ Read full article
——————–
6. Social distancing:
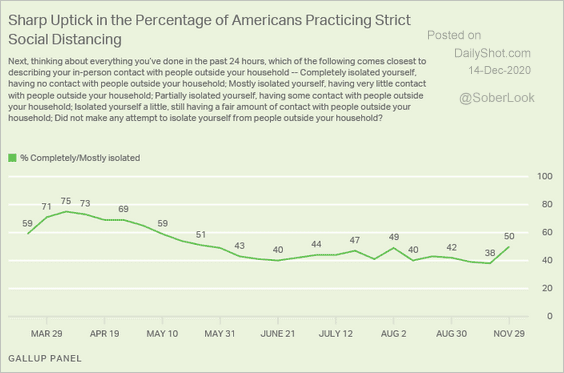 Source: Gallup Read full article
7. Total US executions:
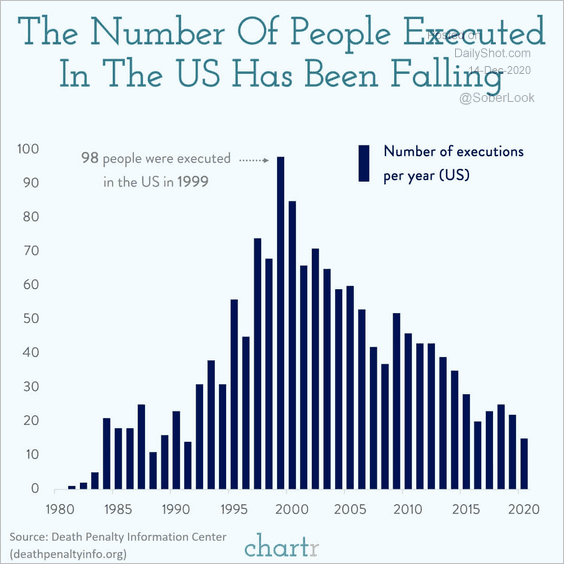 Source: @chartrdaily
——————–
8. Hotel and restaurant jobs:
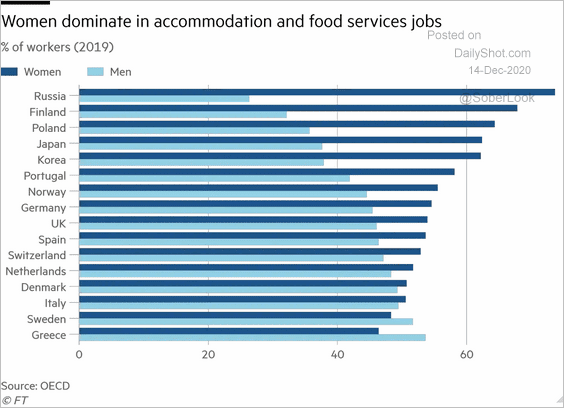 Source: @financialtimes Read full article
9. Greek words in the English language:
 Source: Eurotalk Read full article
——————–