
The Daily Shot: 15-Dec-20
• The United States
• Canada
• The Eurozone
• Europe
• Asia – Pacific
• China
• Emerging Markets
• Energy
• Equities
• Alternatives
• Credit
• Rates
• Global Developments
• Food for Thought
The United States
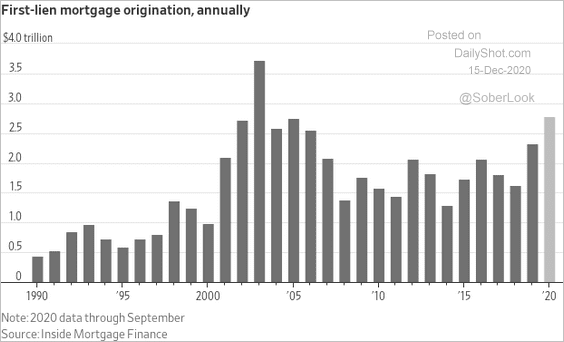
1. Let’s begin with housing.
• Mortgage originations hit the highest level since the peak of the housing bubble …
 Source: @WSJ Read full article
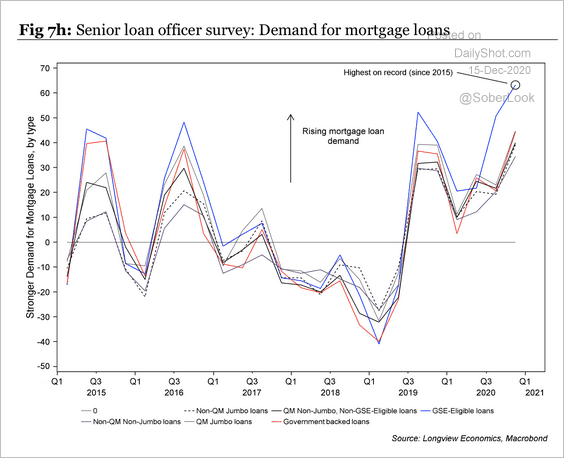
… as demand soars.
 Source: Longview Economics
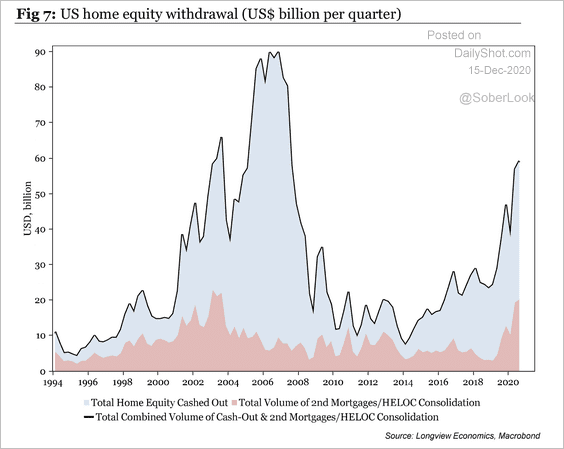
• Home equity withdrawals have increased in recent years.
 Source: Longview Economics
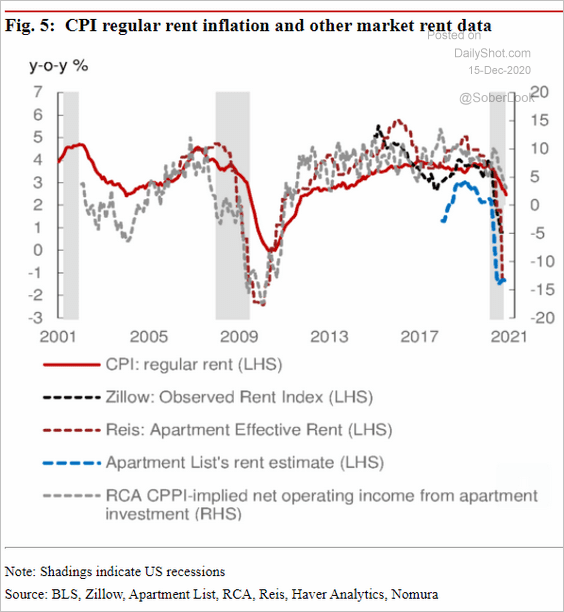
• Will rents continue to face downward pressure?
 Source: Nomura Securities
• Rents on single-family housing (as opposed to apartments) have bottomed, according to CoreLogic.
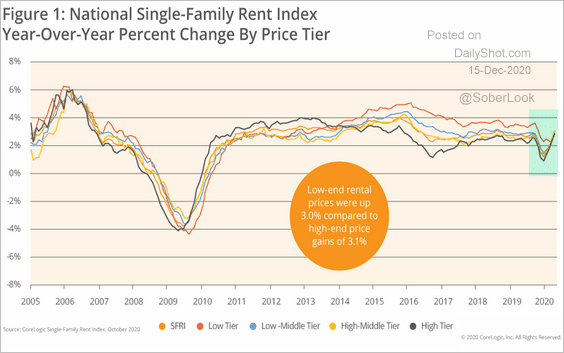 Source: CoreLogic
——————–
2. Here is the breakdown of changes in household income.
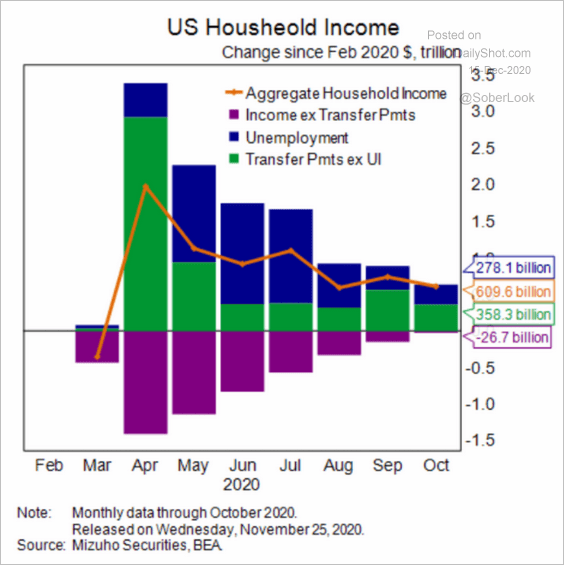 Source: Mizuho Securities USA
Income reductions for lower-paid workers have been due to job loss rather than cuts in pay/hours.
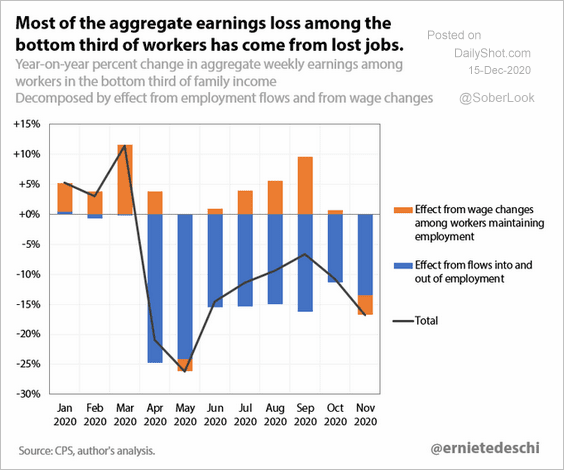 Source: @ernietedeschi
——————–
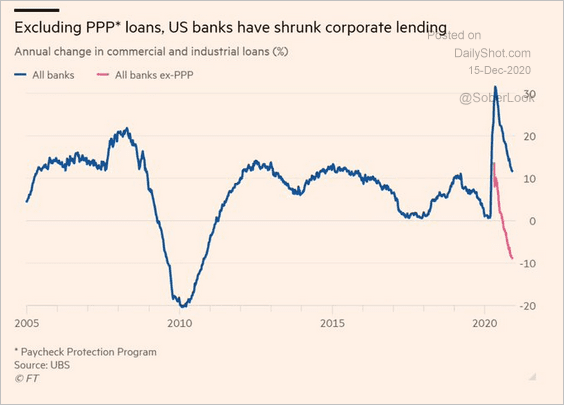
3. Business loans held on banks’ balance sheets continue to decline, driven primarily by companies paying down their revolving facilities (and in some cases term loans).
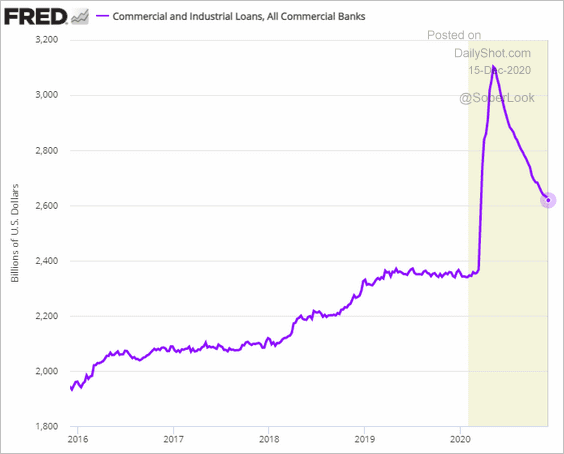
Adjusted for PPP loans, banks’ holdings of corporate debt is now down nearly 10% vs. last year.
 Source: @lisaabramowicz1 Read full article
——————–
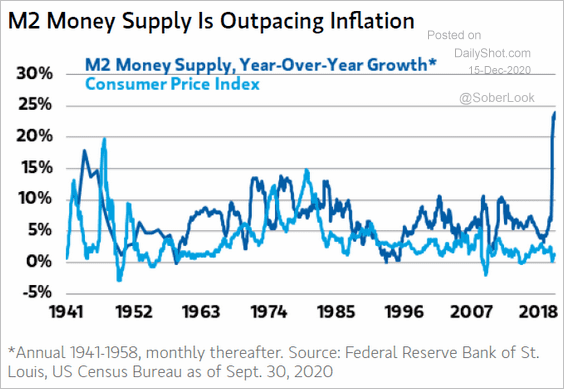
4. Will the rapid increase in the money supply (#3 here) put upward pressure on consumer prices?
 Source: @ISABELNET_SA, @MorganStanley
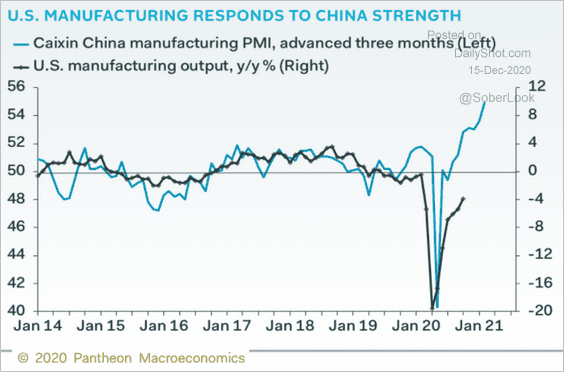
5. Manufacturing strength in China points to further improvements in US factory output.
 Source: Pantheon Macroeconomics
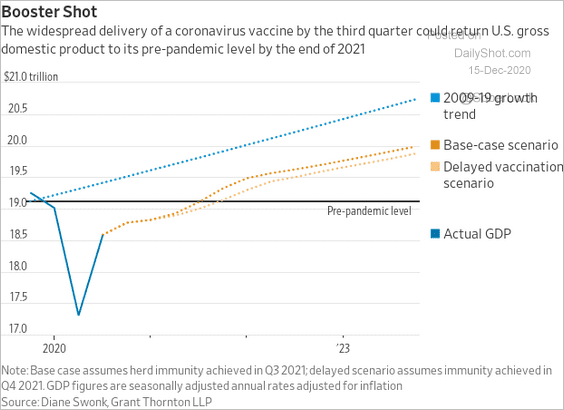
6. When will the GDP return to pre-pandemic levels?
 Source: @jeffsparshott
Canada
1. When will the BoC’s balance sheet peak, and when will the central bank begin raising rates?
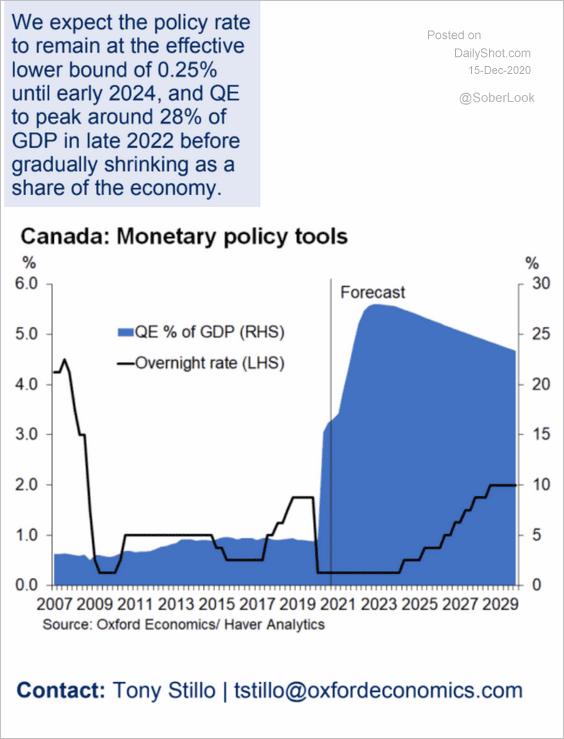 Source: Oxford Economics
2. The 2-year rate differential with the US points to further upside for the loonie.
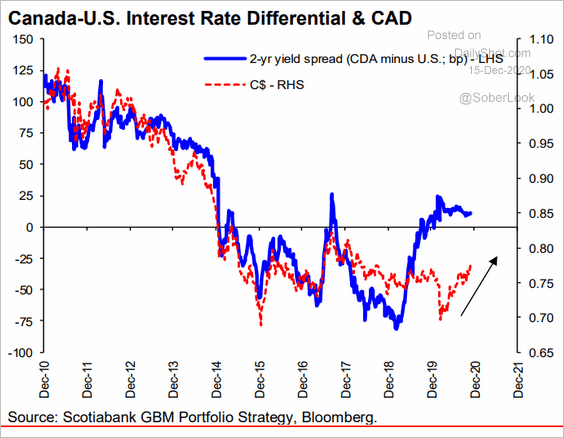 Source: Hugo Ste-Marie, Portfolio & Quantitative Strategy Global Equity Research, Scotia Capital
3. National wealth (the value of non-financial assets in the economy) increased during Q3, driven by residential property gains and improving energy prices.
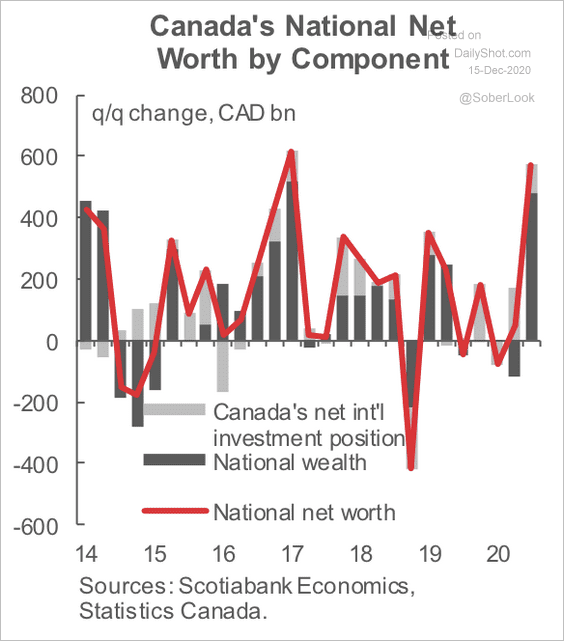 Source: Scotiabank Economics
Here is national wealth on a per-capita basis.
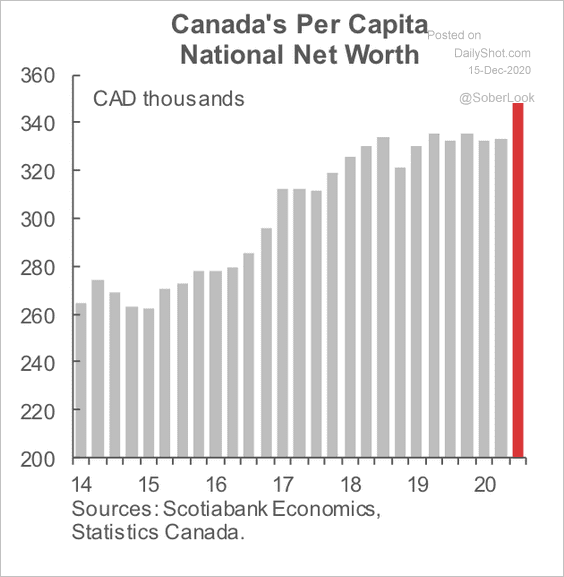 Source: Scotiabank Economics
The Eurozone
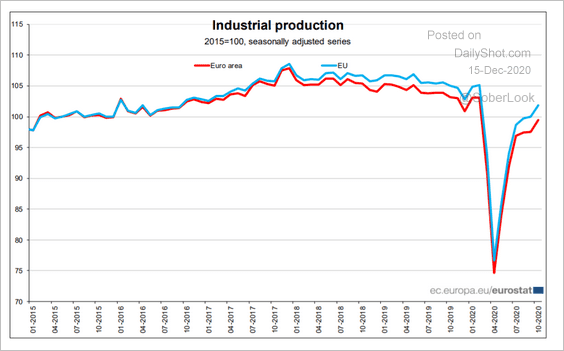
1. Industrial production continues to recover, with the October report coming in ahead of expectations.
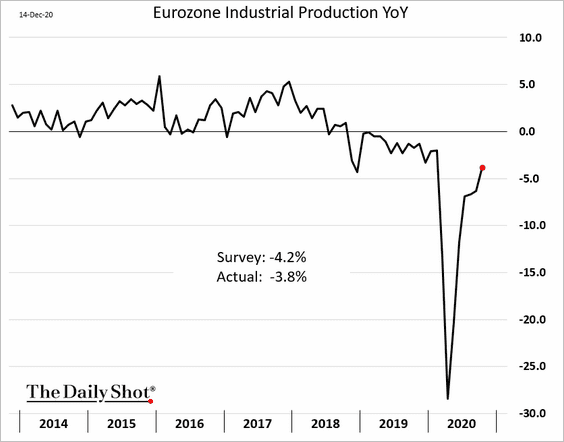
The Eurozone industrial output is still underperforming the EU.
 Source: Eurostat Read full article
——————–
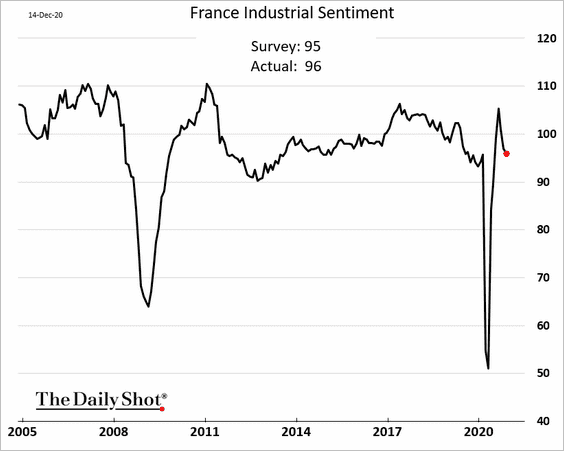
2. French industrial sentiment has pulled back from the highs.
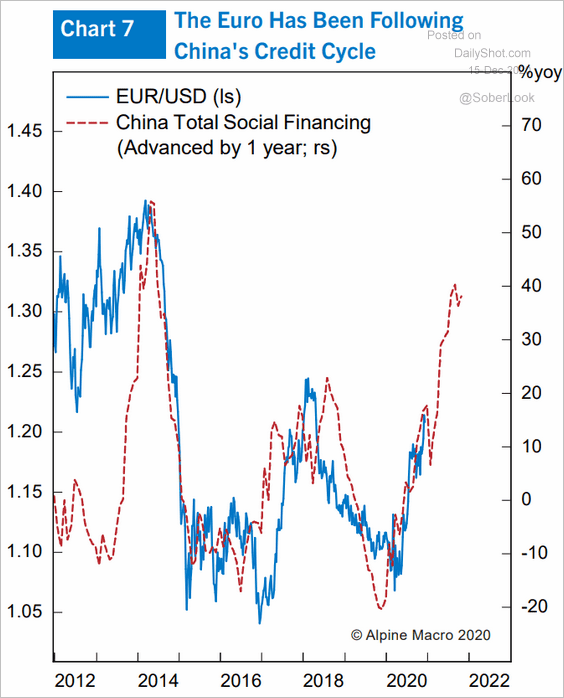
3. The euro is correlated with China’s credit cycle, which points to further upside for the bloc’s currency.
 Source: Alpine Macro
4. Nordea expects rising oil prices (plus the base effects) to provide a positive contribution to inflation during the first half of 2021.
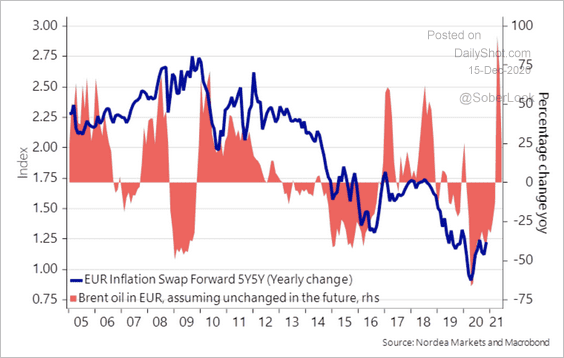 Source: Nordea Markets
5. Favorable credit conditions contributed to the rise in corporate cash holdings, but profits and earnings remain weak.
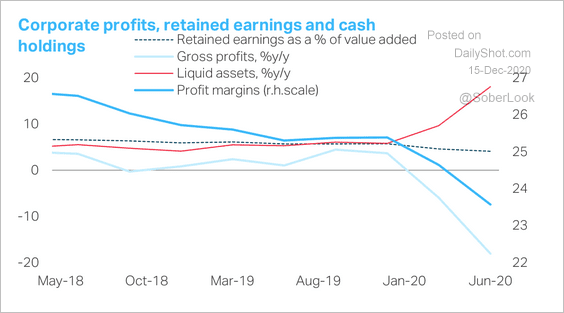 Source: TS Lombard
6. This scatterplot shows the relationship between the fiscal balance (an indication of fiscal stimulus) and the output gap.
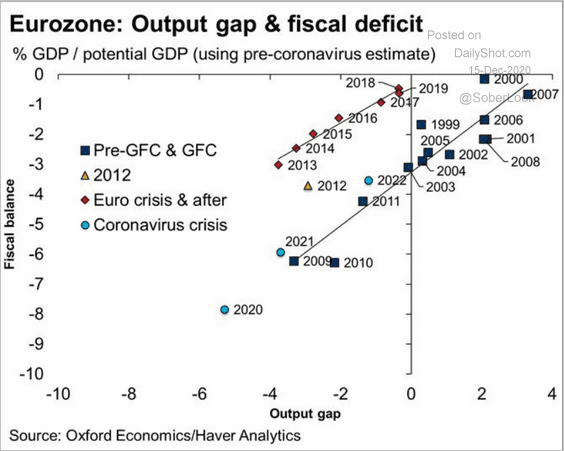 Source: @atalaveraEcon
Europe
1. Sweden’s unemployment rate is moderating.
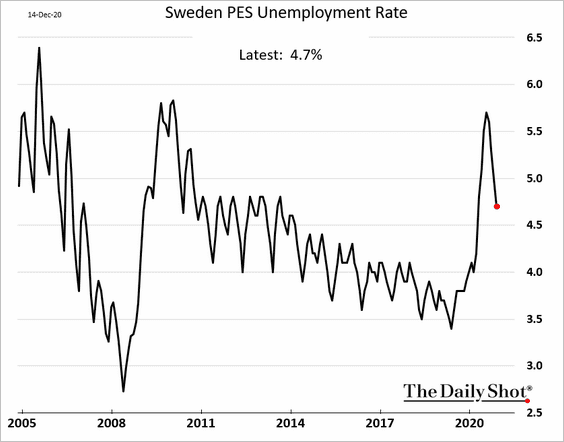
The COVID situation in Sweden continues to worsen.
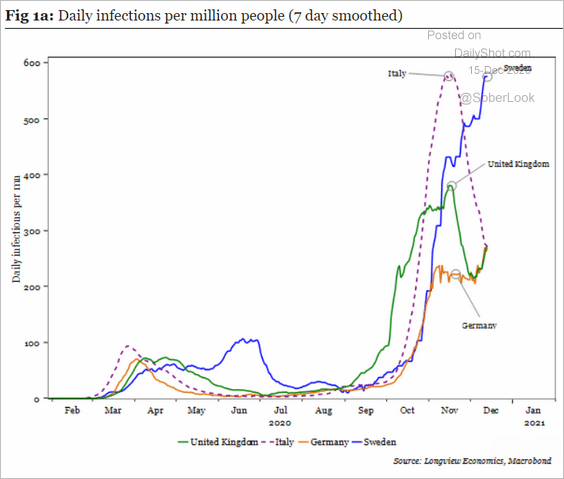 Source: Longview Economics
——————–
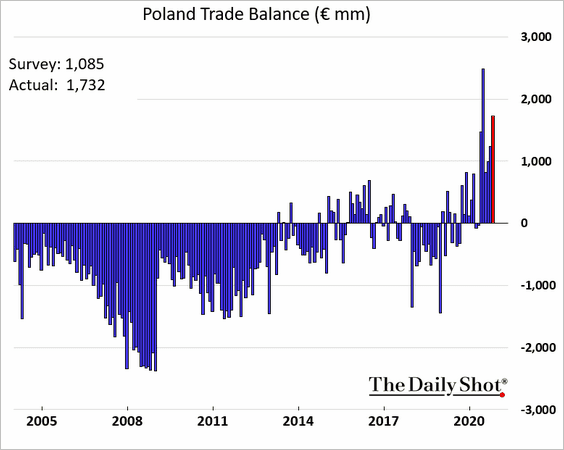
2. Poland’s trade surplus remains elevated amid soft import demand.
3. Which EU countries have the highest percentage of low-wage earners?
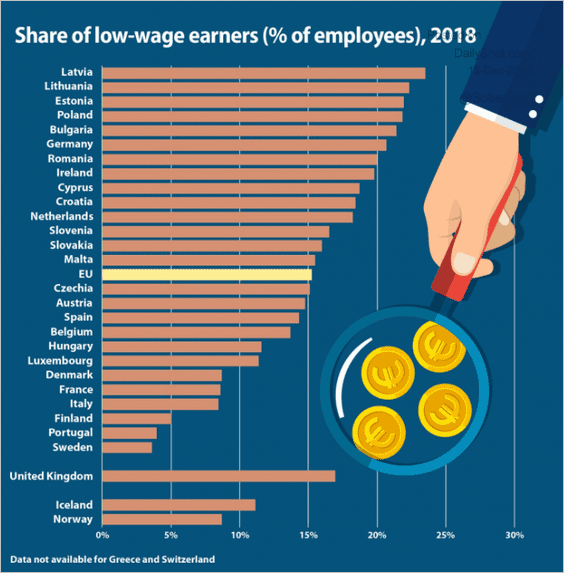 Source: Eurostat Read full article
4. This chart shows the EU’s labor productivity growth and its components (see ECB’s description below).
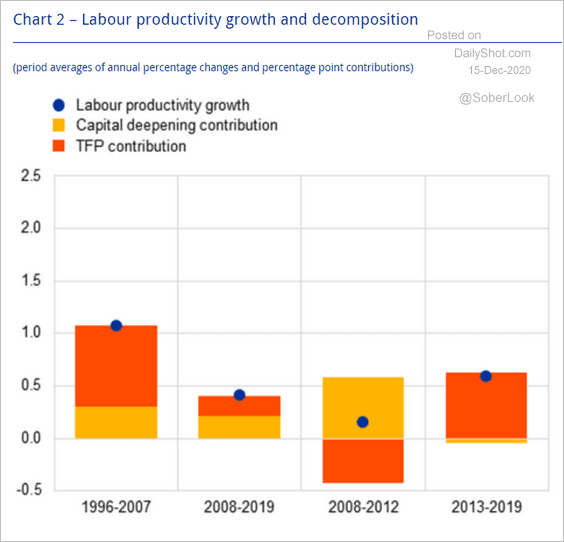 Source: ECB Read full article
Productivity is measured in terms of output per person employed. Percentage point contributions are computed using a Cobb-Douglas production function, with capital deepening contributions estimated using two-period average factor shares. The total factor productivity (TFP) contribution is taken as the residual.
Asia – Pacific
1. Barclays expects the Japanese government’s fiscal policy stance to turn contractionary next year. Economic growth could stall from a ‘fiscal cliff’ as stimulus runs dry.
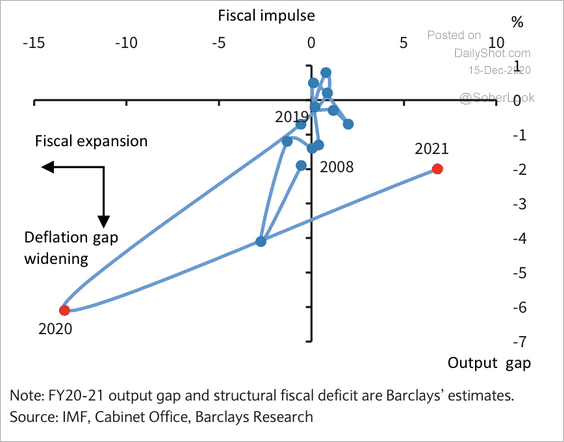 Source: Barclays Research
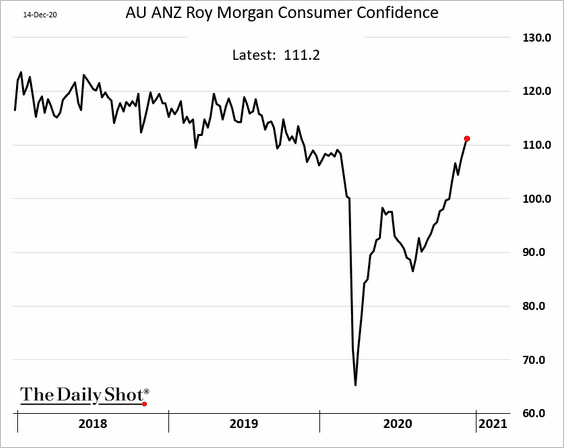
2. The ANZ Australia consumer confidence index is now above pre-COVID levels.
3. New Zealand banks have significantly increased their capital ratios since the 2008 financial crisis.
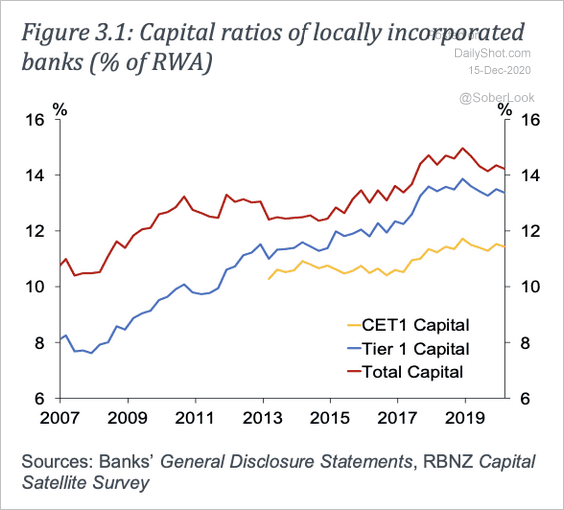 Source: RBNZ
The RBNZ implemented two new stress tests for banks in response to the pandemic: The Pessimistic Baseline Scenario (PBS) and the Very Severe Scenario (VSS). These are much more strict than previous stress tests.
 Source: RBNZ
China
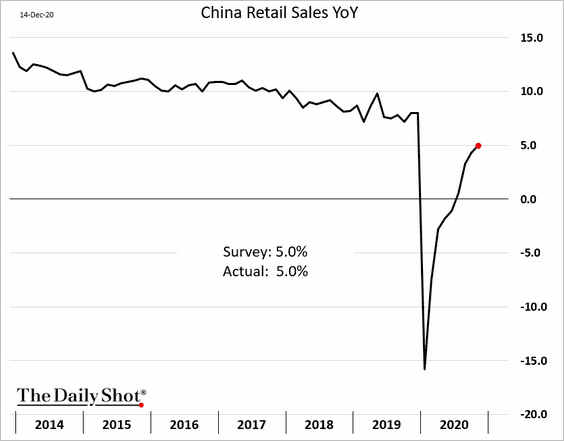
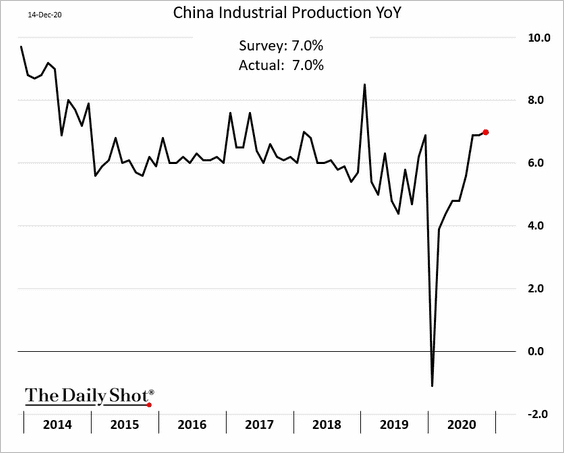
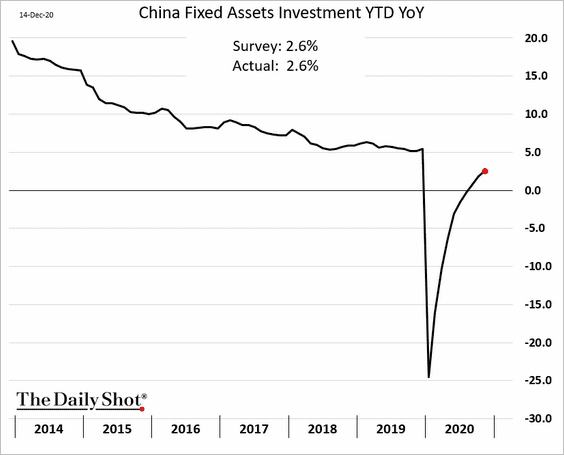
1. China’s economy continues to strengthen.
• Retail sales:
• Industrial production (7% above last year’s levels):
• Fixed asset investment:
– State vs. private investment:
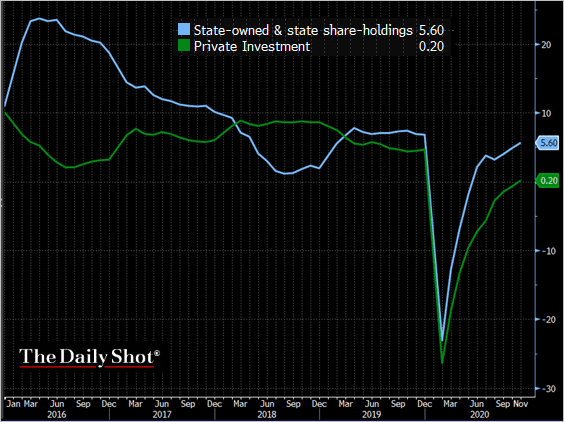 Source: @TheTerminal, Bloomberg Finance L.P.
——————–
2. Freight rates point to robust export activity.
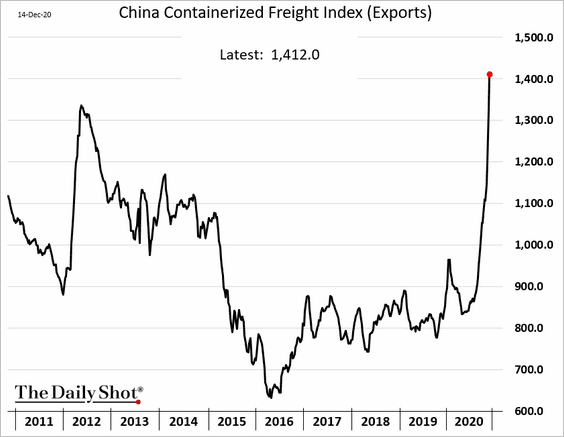
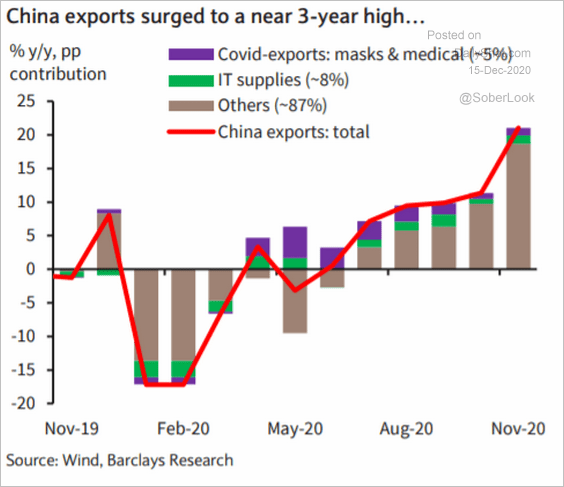 Source: Barclays Research
——————–
3. Banks have increasingly relied on yuan loans to build assets.
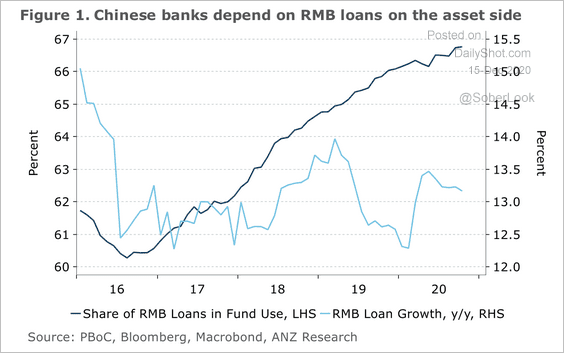 Source: ANZ Research
• Net interest margins are at historic lows.
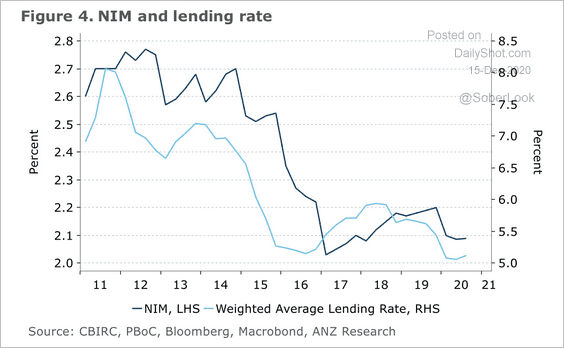 Source: ANZ Research
• A significant round of capital raising began last year when regulators allowed banks to issue perpetual bonds, according to ANZ Research.
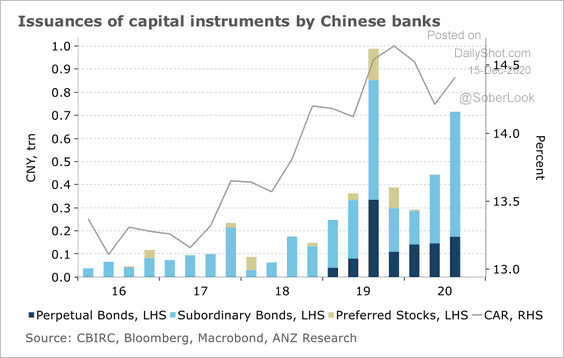 Source: ANZ Research
——————–
4. China’s overseas lending has collapsed.
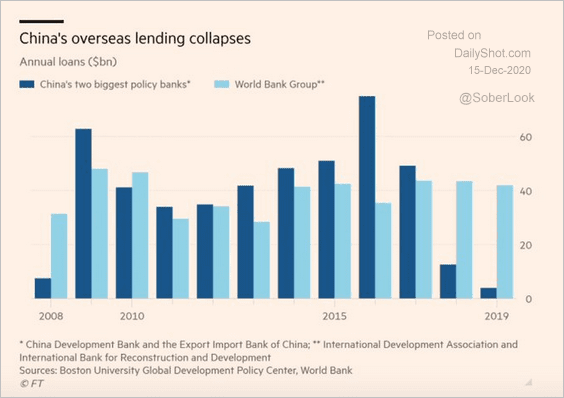 Source: @adam_tooze, @JKynge, @Jonthn_Wheatley, @KevinPGallagher Read full article
5. How many companies cite Xi Jinping in their annual reports?
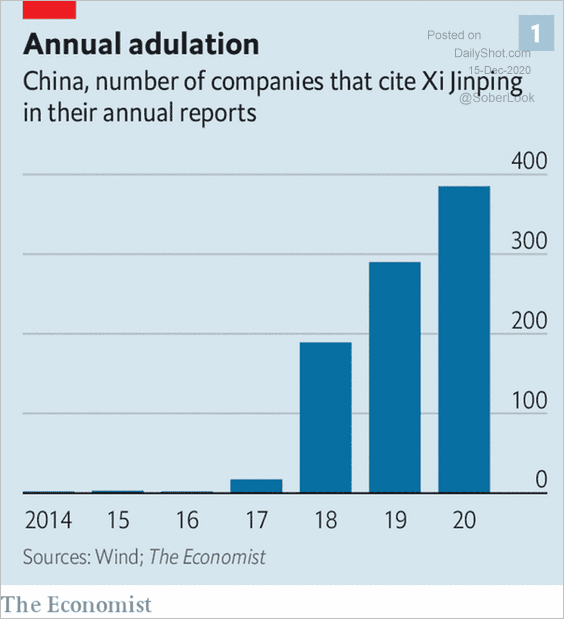 Source: The Economist Read full article
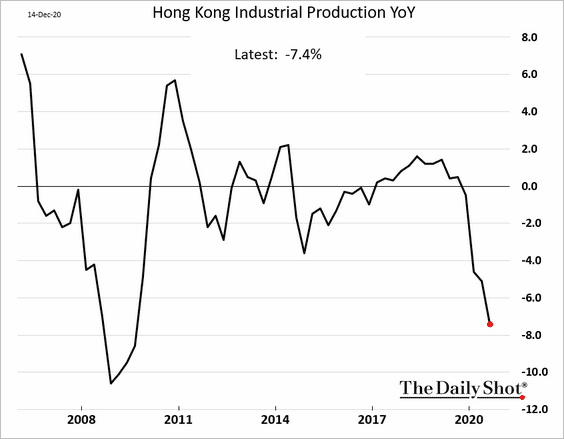
6. Hong Kong’s industrial production deteriorated further in Q3.
Emerging Markets
1. India’s inflation is starting to moderate, …
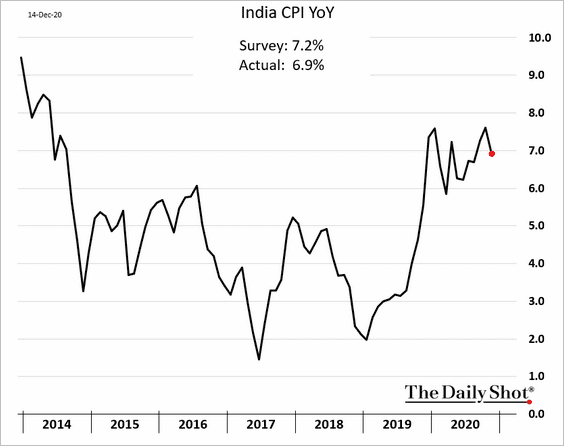
… as food prices ease.
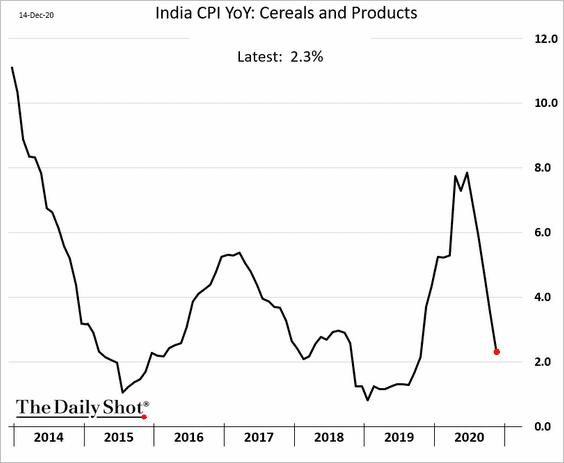
But inflation remains above RBI’s target.
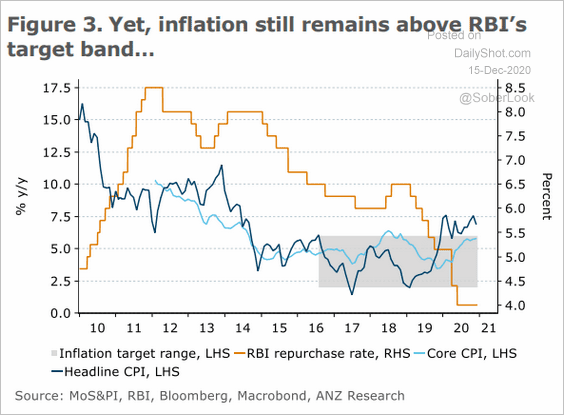 Source: ANZ Research
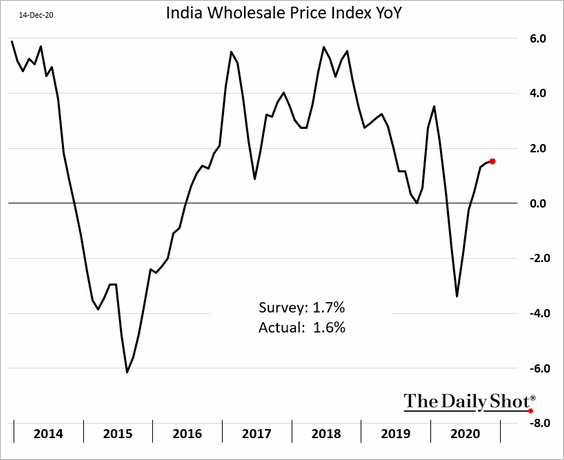
Separately, gains in wholesale inflation are slowing.
——————–
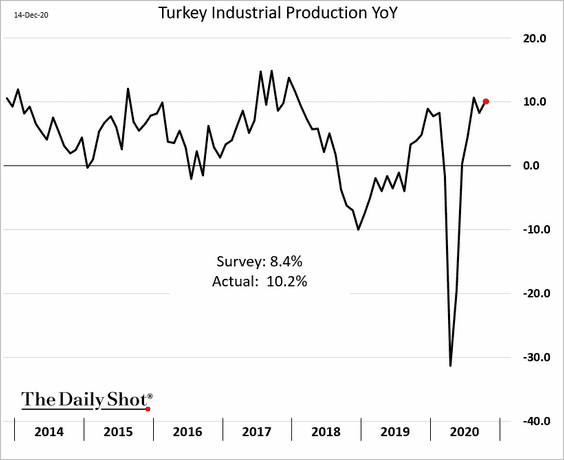
2. Will new US sanctions put pressure on the lira?
 Source: AP Read full article
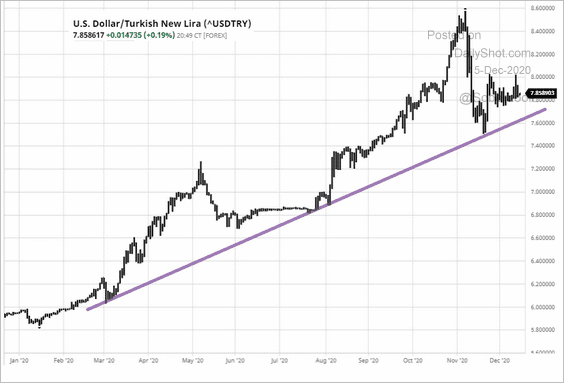 Source: barchart.com
Turkey’s industrial production remains robust (up 10% from last year).
——————–
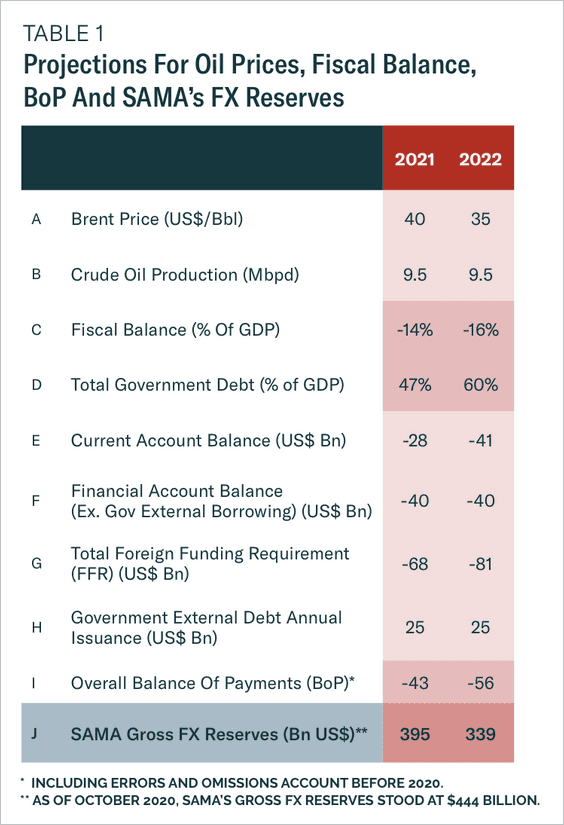
3. Despite undergoing substantial fiscal tightening, Saudi Arabia could still see a wide budget deficit over the next two years. BCA Research expects the government to issue US dollar-denominated government bonds to finance the deficit.
 Source: BCA Research
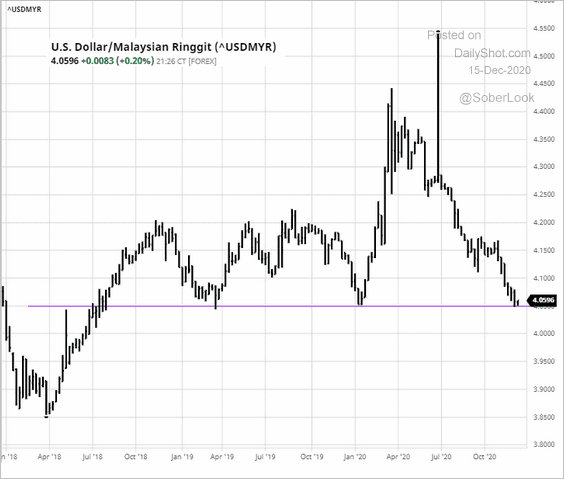
4. USD/MYR (Malaysian ringgit) is holding support.
 Source: barchart.com
5. Brazil’s economic activity weakened in October.
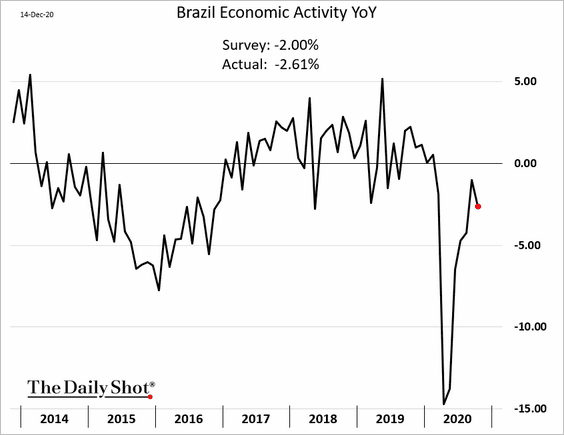
Massive precautionary savings this year should support Brazil’s recovery in the months ahead.
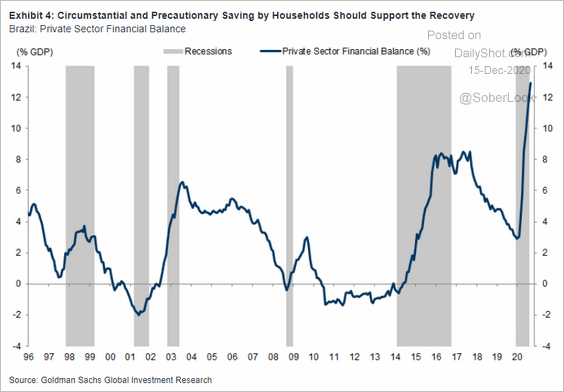 Source: Goldman Sachs
——————–
6. LatAm economies should benefit from the most accommodative financial conditions in years (chart shows Goldman’s financial conditions index).
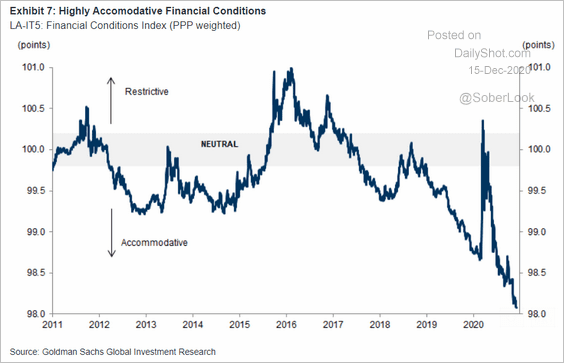 Source: Goldman Sachs
7. How have EM economies dealt with capital flow volatility?
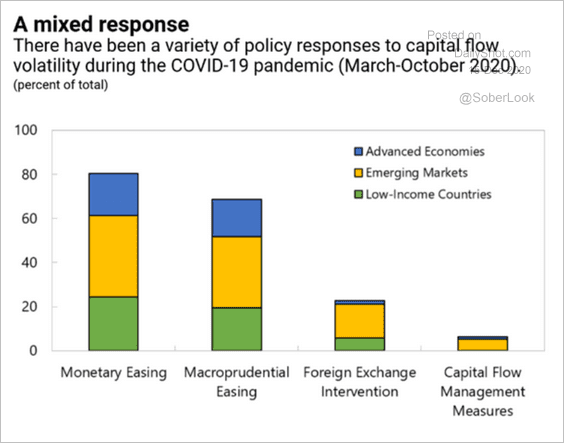 Source: IMF Read full article
Energy
1. OPEC cut its oil demand forecast for 2021. Crude oil dipped in response but then rebounded.
 Source: MarketWatch Read full article
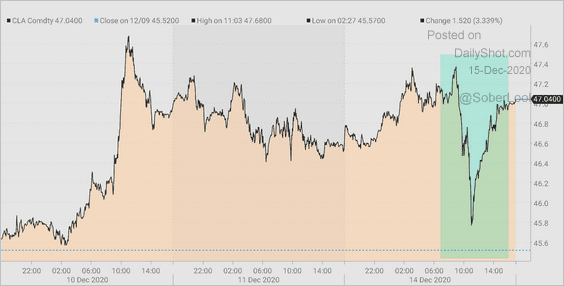 Source: @TheTerminal, Bloomberg Finance L.P.
——————–
2. This chart shows the US DUC inventory (measured in weeks).
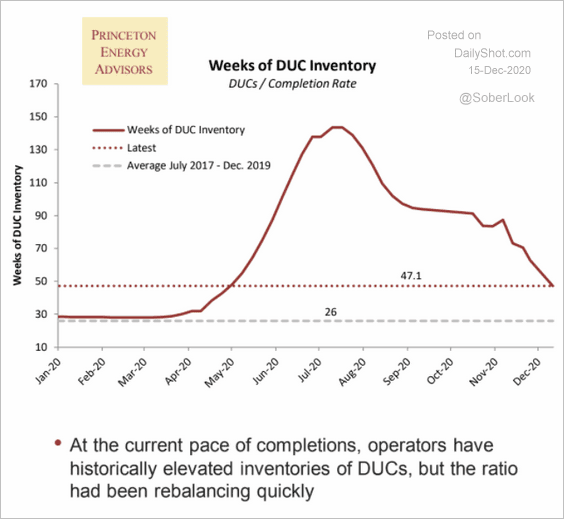 Source: Princeton Energy Advisors
Equities
1. Bottom-up consensus 2021 target for the S&P 500 is now 4,000, nearly a 10% gain from current levels.
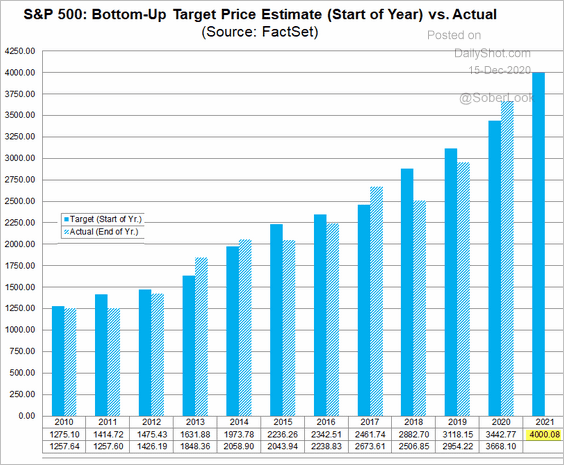 Source: @FactSet Read full article
2. Flows into equity funds outside of the US are accelerating.
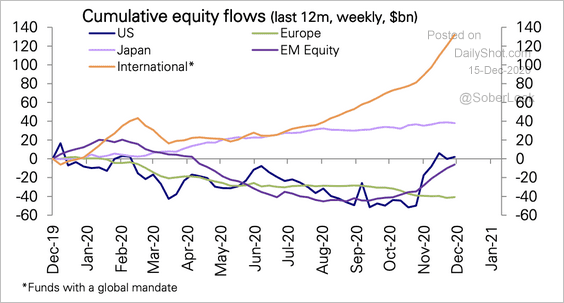 Source: Deutsche Bank Research
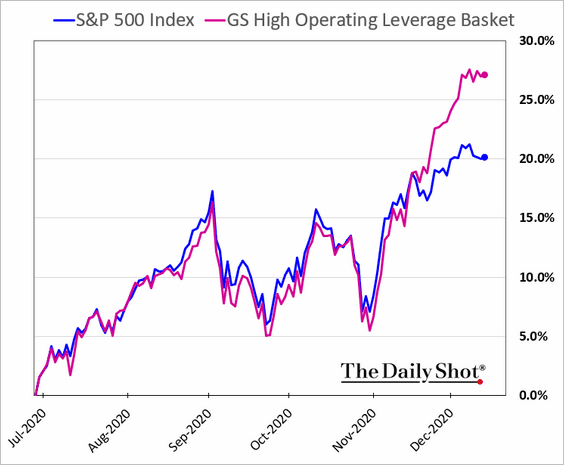
3. Companies with high operating leverage have outperformed over the past month.
4. Managed money long positioning in S&P 500 futures has risen over the past six months but remains below prior extremes.
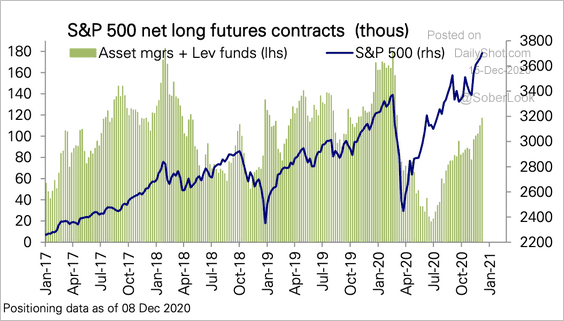 Source: Deutsche Bank Research
5. Liquidity in the S&P 500 futures market remains relatively low.
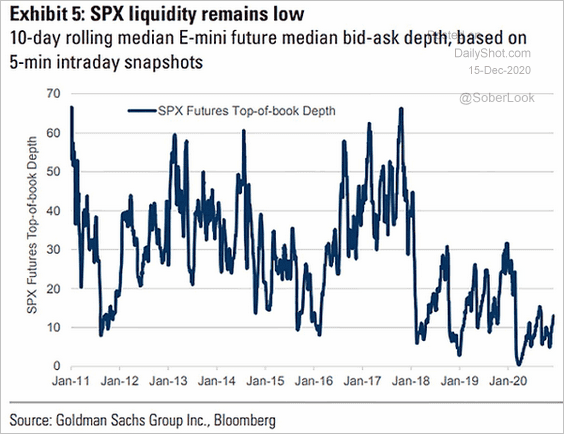 Source: @ISABELNET_SA, @GoldmanSachs
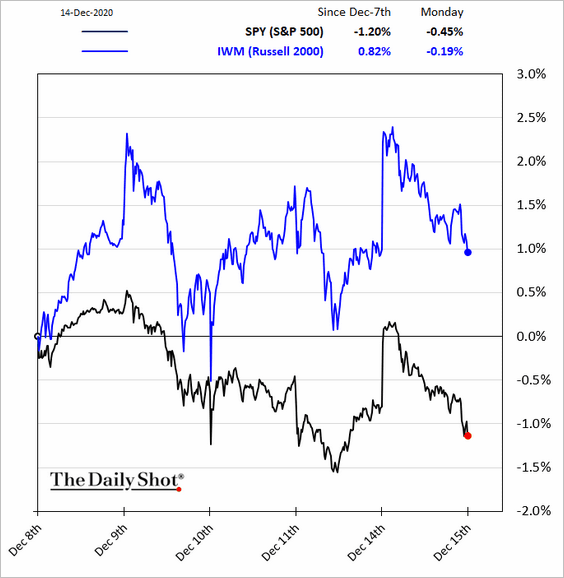
6. Small caps continue to outperform.
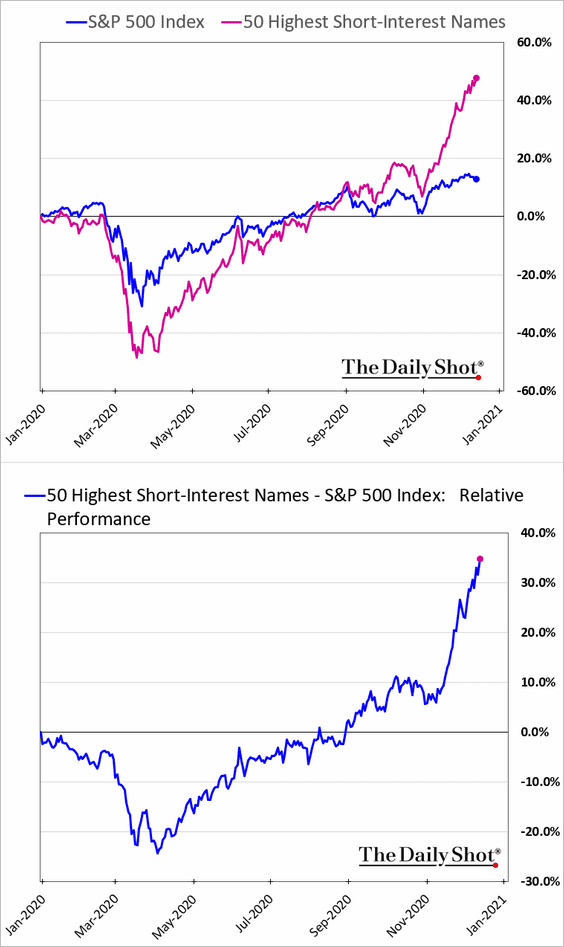
7. Here is the relative performance of stocks with the highest short interest (short-sellers’ capitulation).
8. Next, we have some sector trends.
• US financials and energy stocks tend to perform well when rates rise.
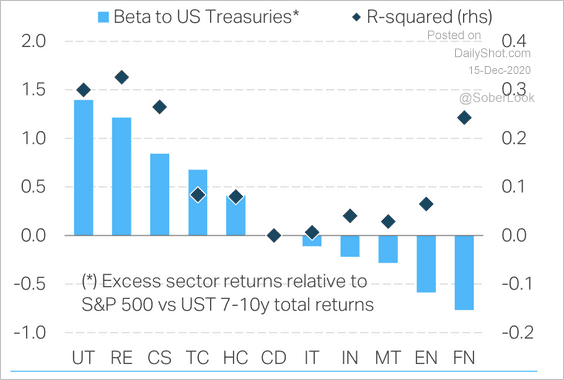 Source: TS Lombard
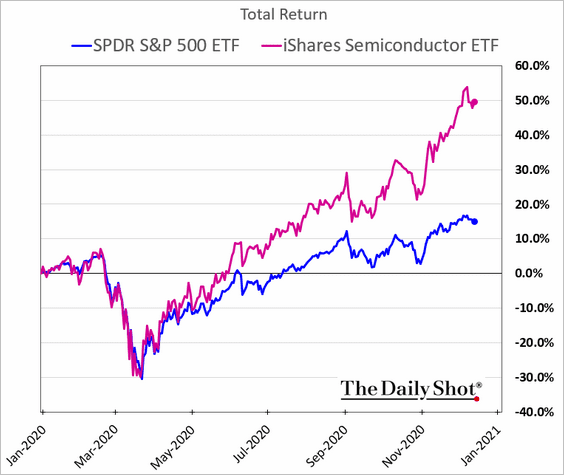
• It’s been a good year for semiconductor shares.
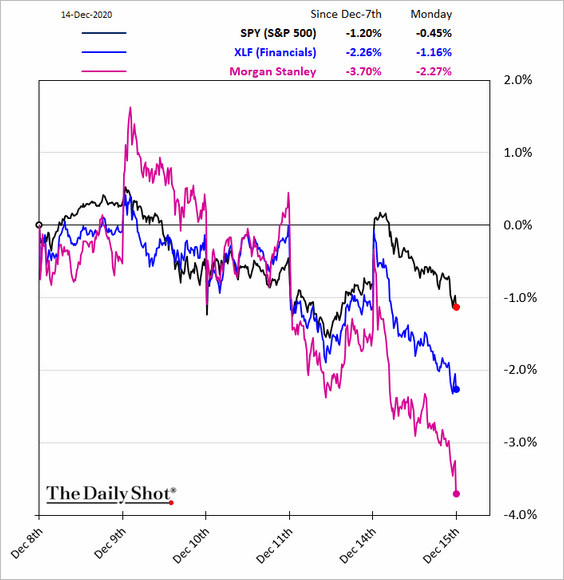
• Below are some sector performance charts covering the past five business days.
• Financials:
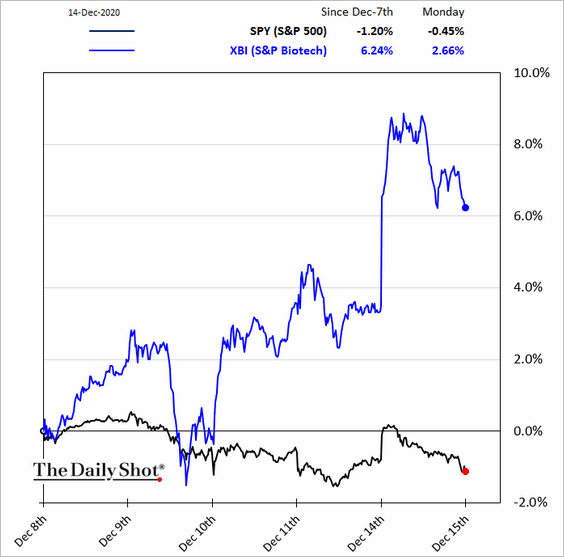
• Biotech:
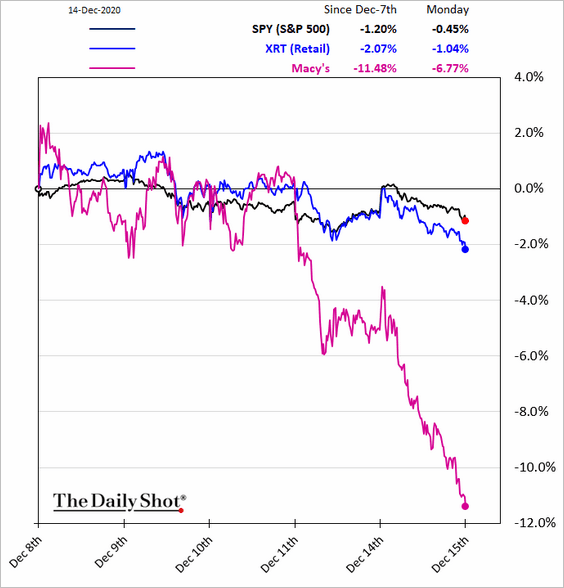
• Retail:
• Transportation:
![]()
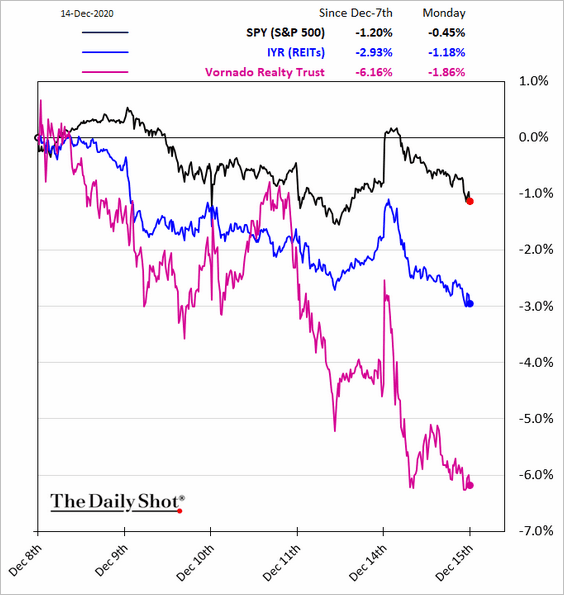
• REITs:
Alternatives
1. Hedge funds are running significant leverage.
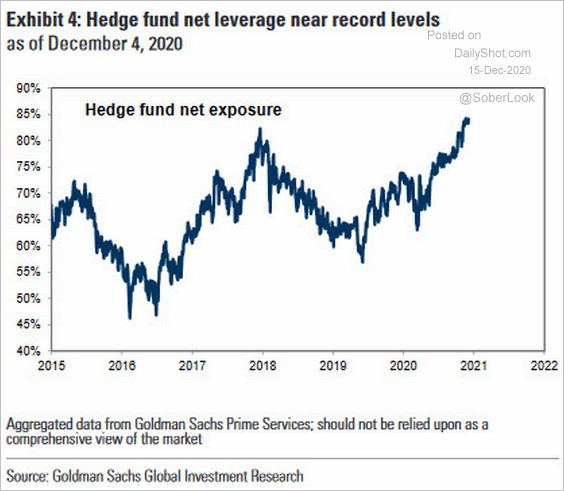 Source: Goldman Sachs, @ISABELNET_SA
2. How has the pandemic impacted the global private equity industry?
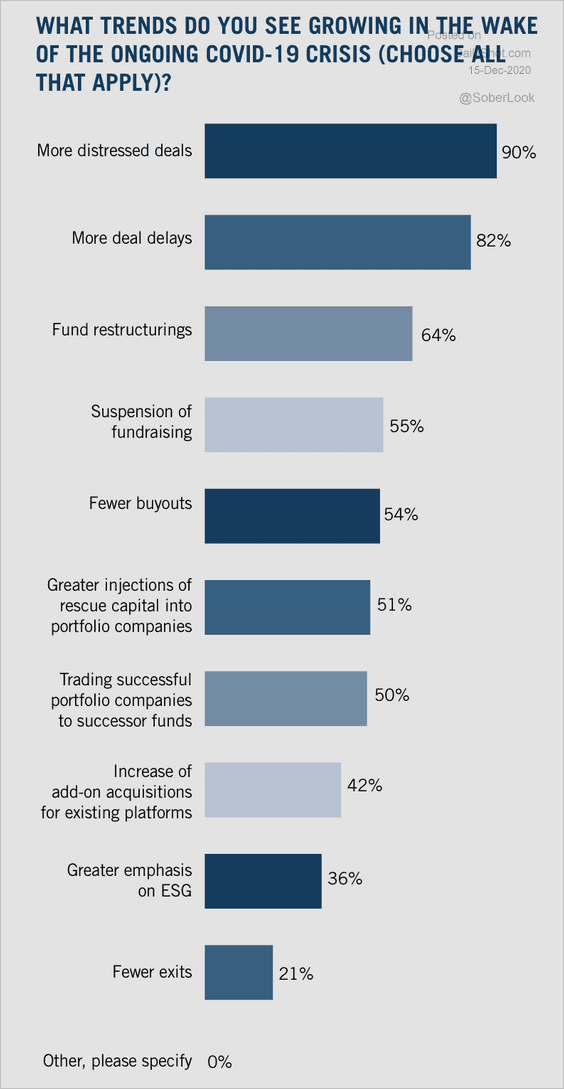 Source: Dechert
3. Co-investing, whereby private-equity limited partners invest directly into deals alongside the fund, has increased over the past year.
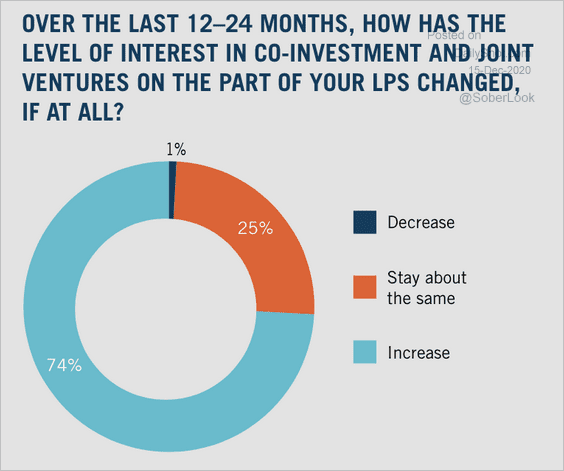 Source: Dechert
4. US venture capital funds have raised a combined $69.1 billion this year.
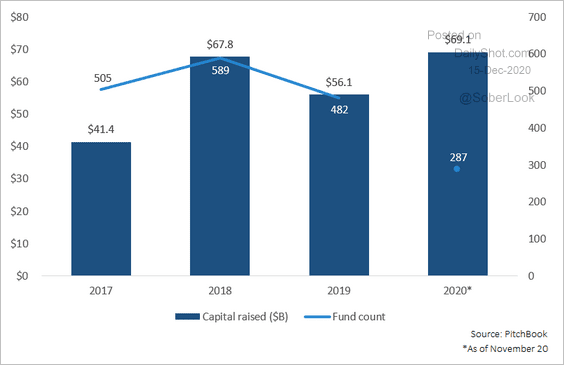 Source: PitchBook Read full article
Giant funds are increasingly dominating the VC landscape.
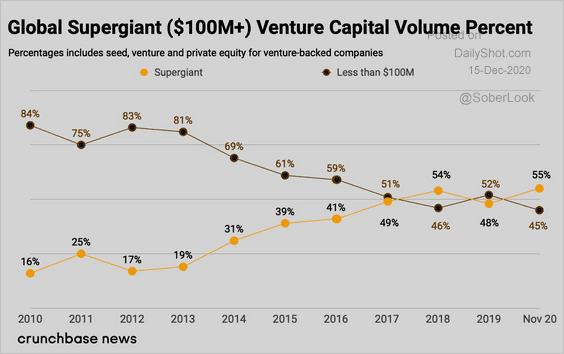 Source: @abnormalreturns Read full article
Credit
1. There was a modest rise in the US investment-grade CDX spread last week. FHN Financial expects the move to remain capped within its declining trend.
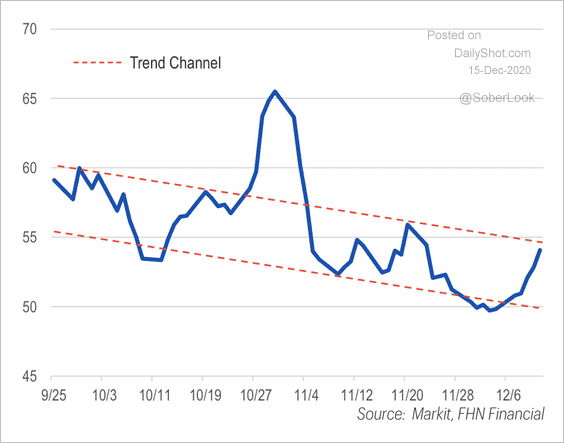 Source: FHN Financial
2. Fitch revised its US leveraged finance default rate forecast sharply higher through 2022.
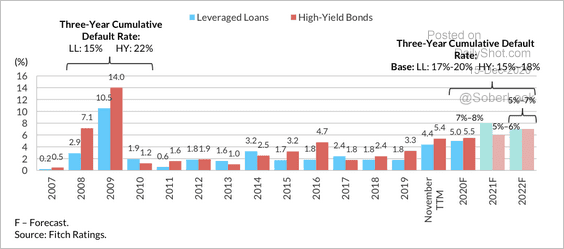 Source: Fitch Ratings
This chart shows the median forecasted interest coverage ratio by sector for 2021.
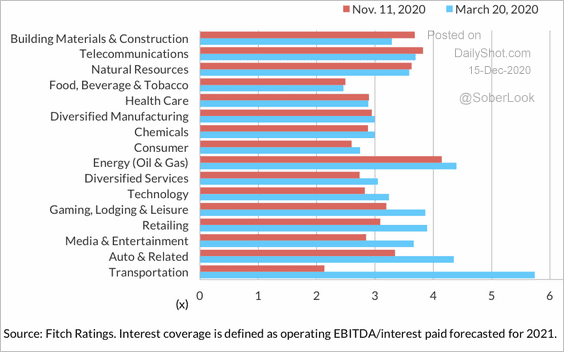 Source: Fitch Ratings
——————–
3. High-quality US bonds provide a stabilizing force during periods of stock market weakness (shaded areas of the chart), according to SunTrust.
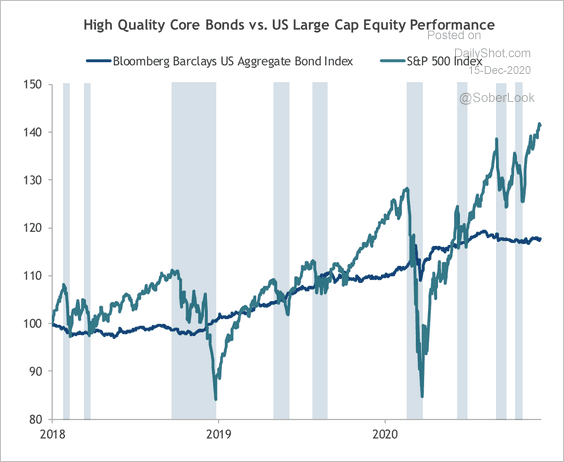 Source: SunTrust Private Wealth Management
4. US fiscal stimulus has been good for small banks as their net interest margin outperforms the overall industry.
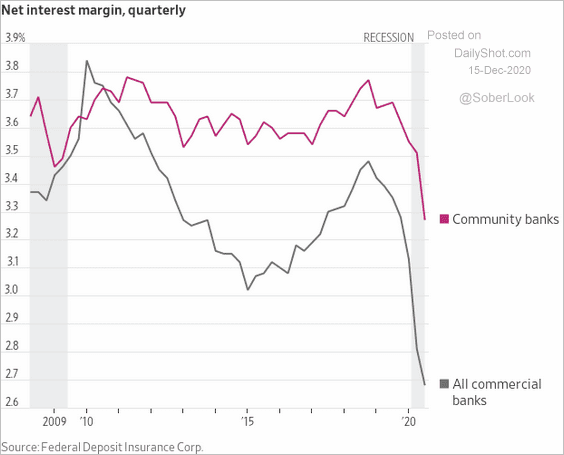 Source: @WSJ Read full article
Rates
1. Interest rate sensitivity (duration) of major fixed income indices has grown significantly.
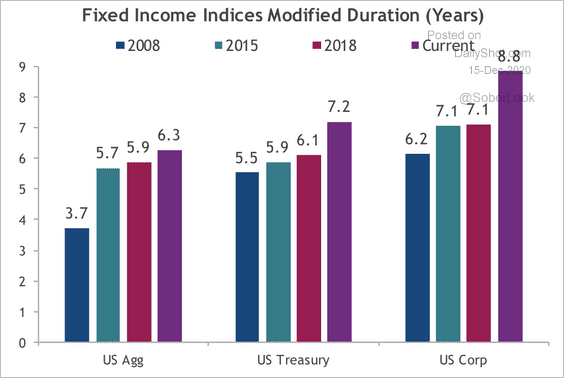 Source: SunTrust Private Wealth Management
2. Will elevated unemployment levels push US real rates deeper into negative territory?
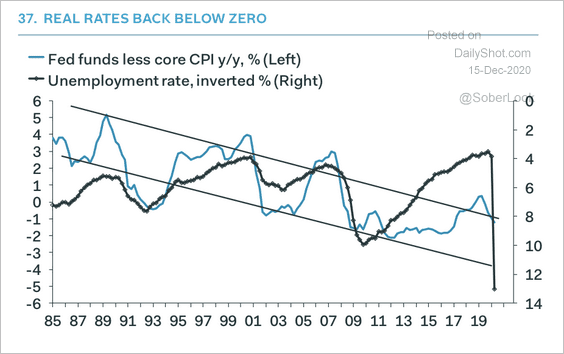 Source: Pantheon Macroeconomics
3. The weighted average maturity (WAM) of Fed purchases has risen in recent months. This is likely due to the Fed owning close to the limit in 2036-2042 maturities, which means its purchases are being pushed further out the curve, according to Deutsche Bank.
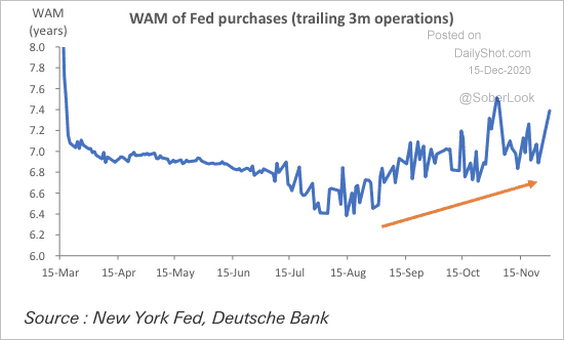 Source: Deutsche Bank Research
4. Additional stimulus spending could cause the Treasury general account (at the Fed) to fall sharply in Q1 next year. That reduction will release a massive amount of liquidity (cash moving from the Fed into private deposits), boosting demand for short-term rate products.
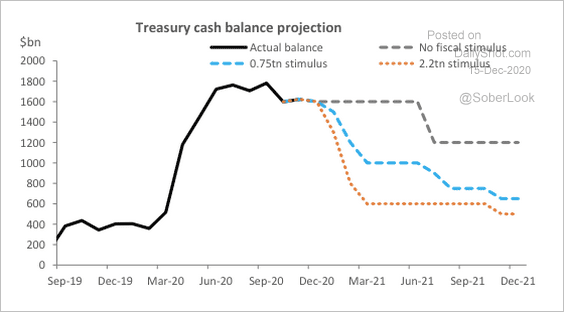 Source: Deutsche Bank Research
Global Developments
1. All single-country equity markets within the S&P Developed Broad Market Index are positive this month, except for China and Saudi Arabia (all in dollar terms).
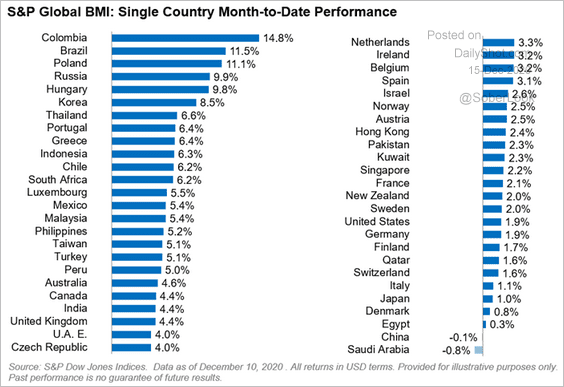 Source: S&P Global Market Intelligence
2. 93% of economies went into recession this year.
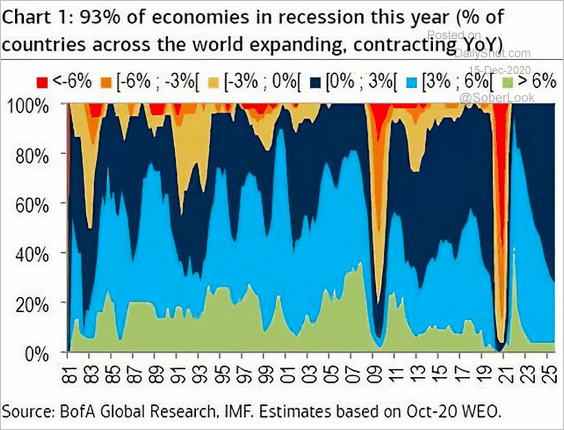 Source: @ISABELNET_SA, @BofAML
3. According to McKinsey, “global banks have provisioned $1.15 trillion for loan losses through third quarter 2020.”
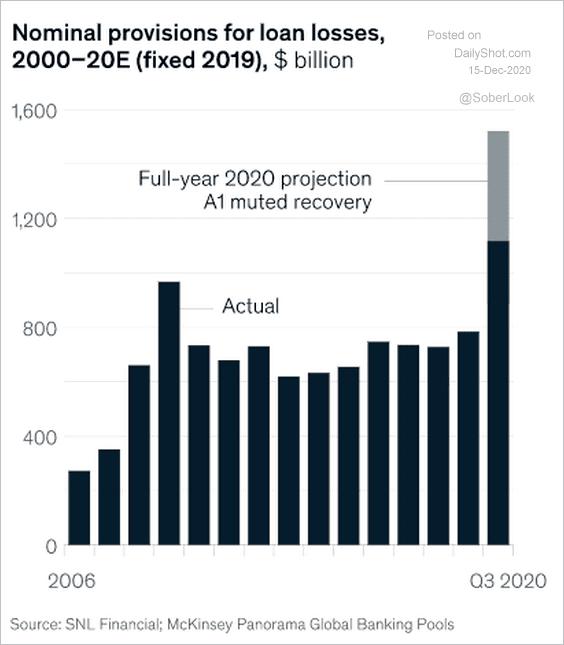 Source: McKinsey
4. Here are the changes in consumption across developed economies.
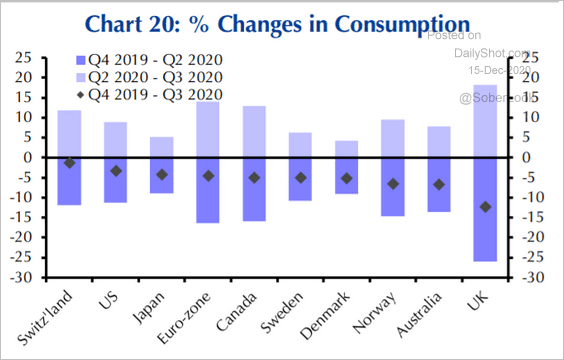 Source: Capital Economics
5. What are the biggest risks to global financial markets?
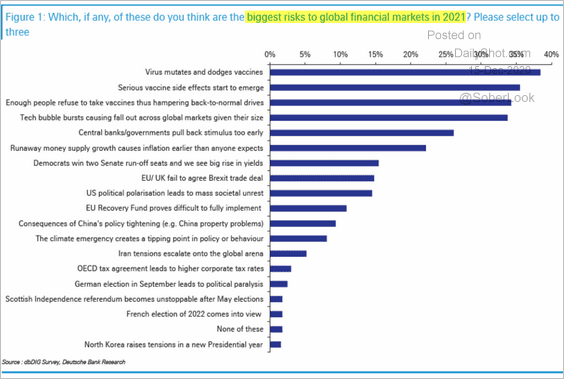 Source: Deutsche Bank Research
——————–
Food for Thought
1. The ability to telework:
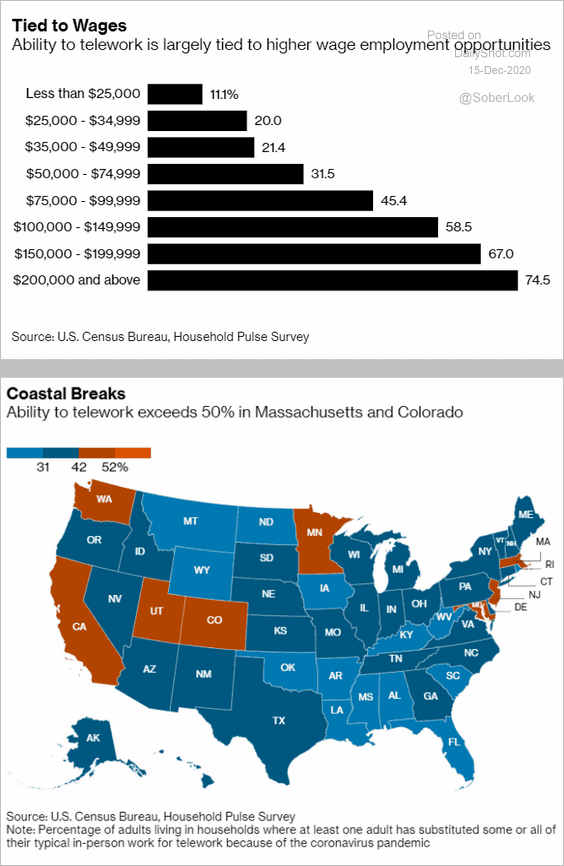 Source: @markets Read full article
2. Global tech platforms:
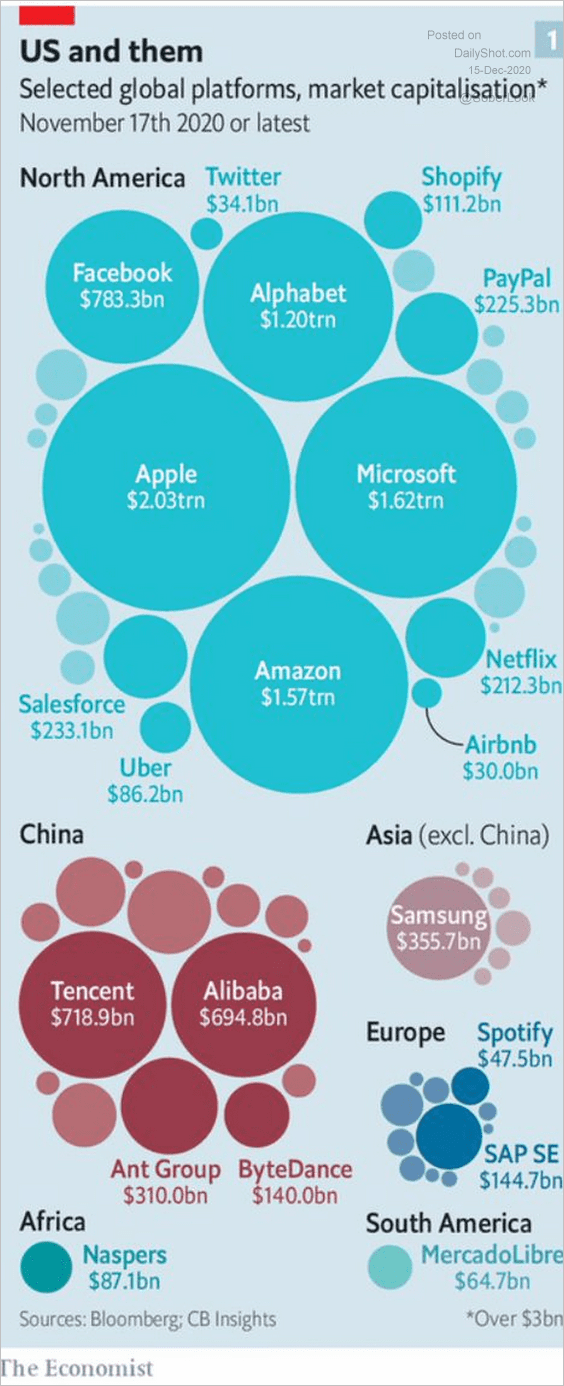 Source: @adam_tooze, @TheEconomist Read full article
3. Airbnb’s revenues and spending:
 Source: @chartrdaily
4. Women in the US Congress:
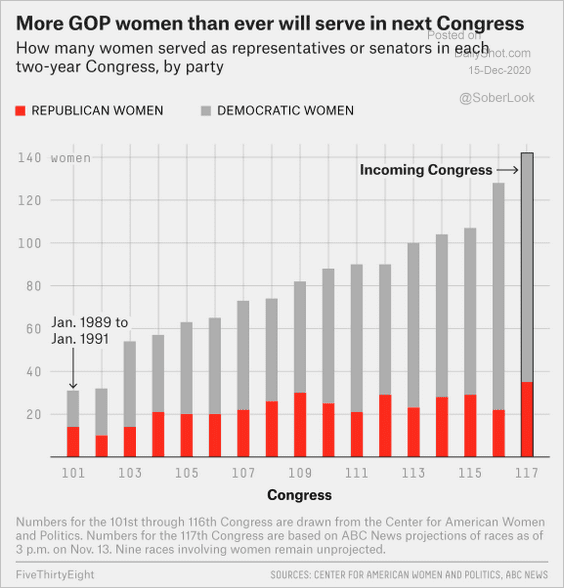 Source: @FiveThirtyEight Read full article
5. Is the US on the right track?
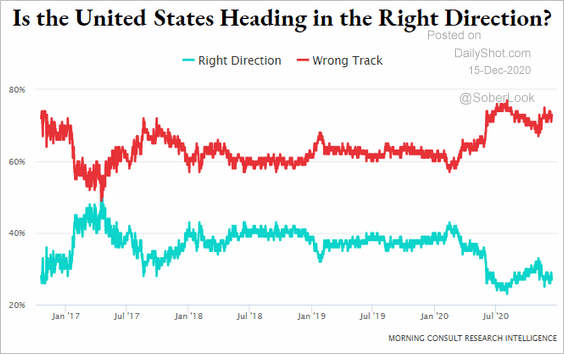 Source: @MorningConsult Read full article
6. Projections for the top-10 vaccines:
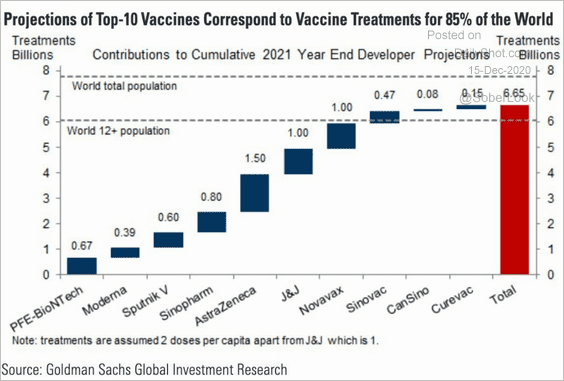 Source: Goldman Sachs
7. Online searches for theme parks:
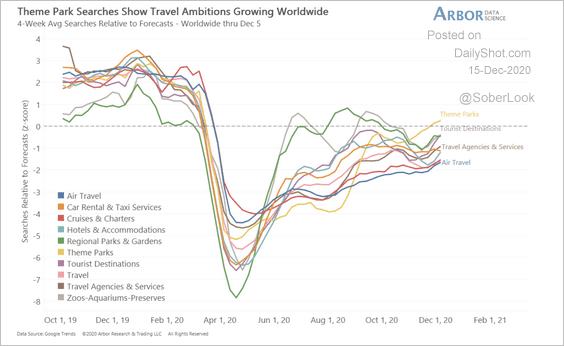 Source: Arbor Research & Trading
8. Which US businesses are struggling to pay rent?
 Source: @Alignable
9. Abandoned railroads in North America:
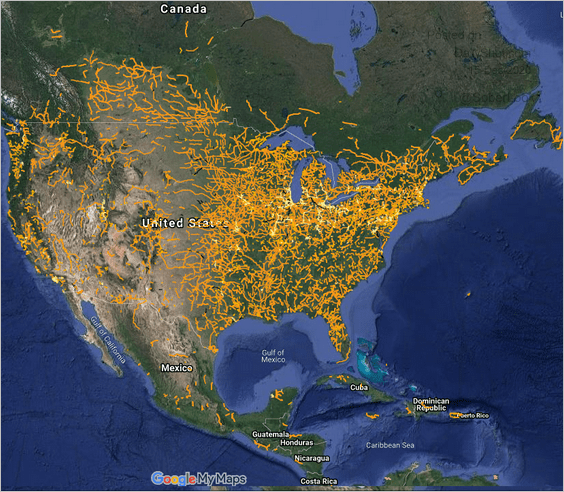 Source: Andrew Grigg
——————–