
The Daily Shot: 13-Jan-21
• Equities
• Credit
• Rates
• Commodities
• Energy
• Emerging Markets
• China
• Asia – Pacific
• Japan
• The Eurozone
• The United Kingdom
• The United States
• Global Developments
• Food for Thought
Equities
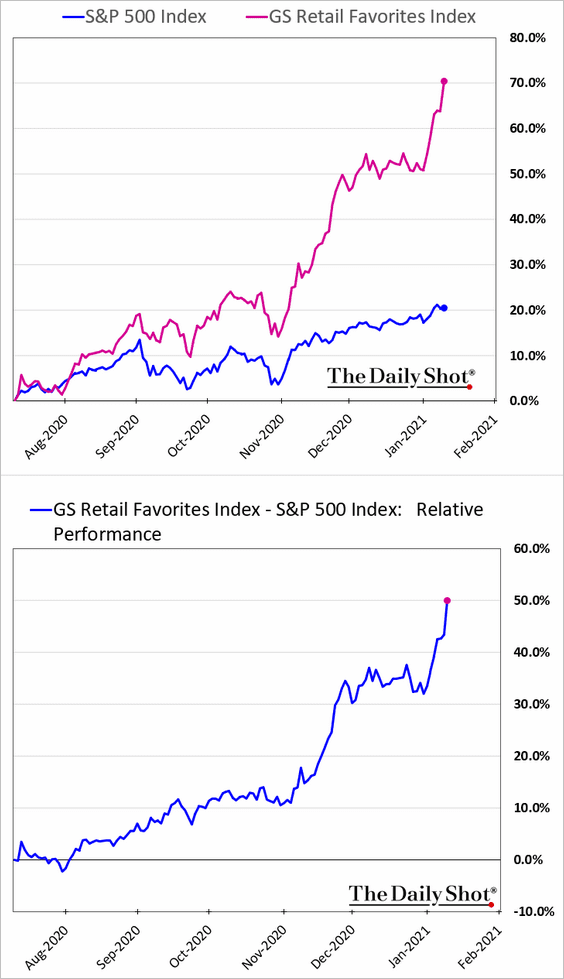
1. Frenzied buying continues, with retail investors pumping up their favorite stocks.
 Source: Mike Thompson/Creators Syndicate, @DiMartinoBooth
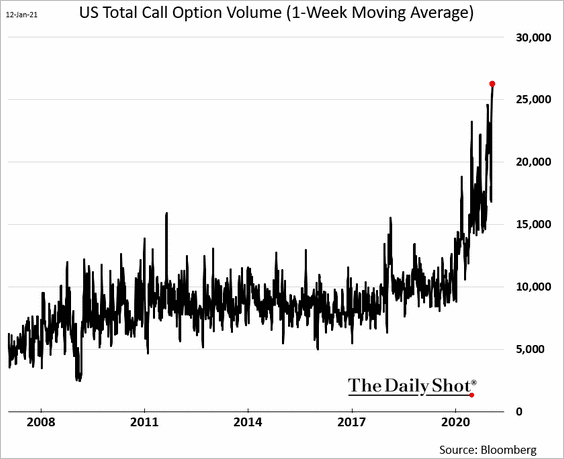
The volume of call options is hitting unprecedented levels. These are effectively leveraged bets that allow retail investors to punch above their weight.
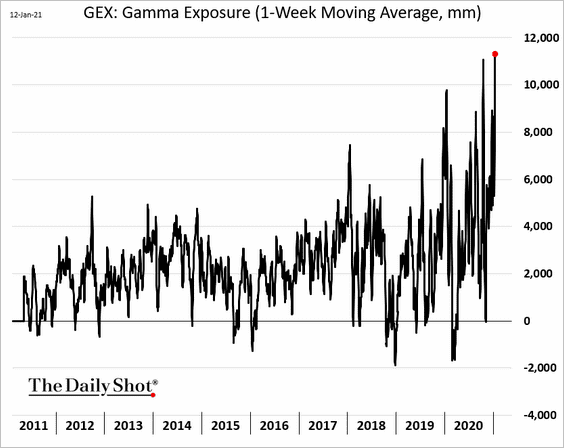
Dealers are increasingly short gamma as they sell more options to clients. This tends to exacerbate volatility, especially during selloffs. Here is the GEX index, which is a rough estimate of gamma exposure.
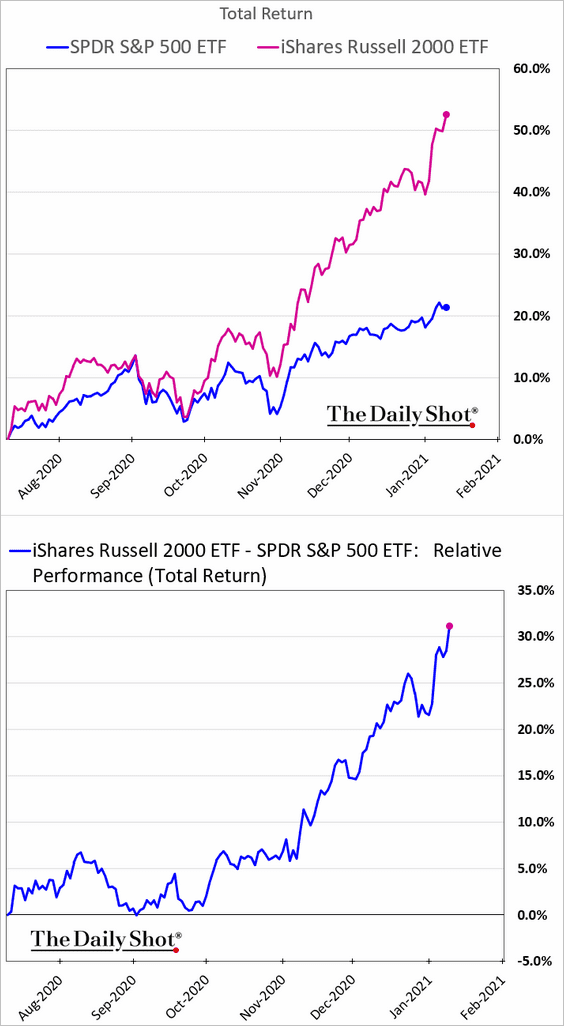
2. Small-cap shares have been soaring.
But now, investors are chasing even smaller firms, including penny stocks.
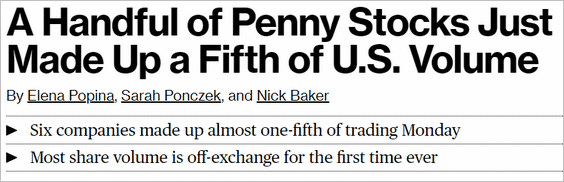 Source: @business Read full article
The lowest-price shares have outperformed since the start of the year.
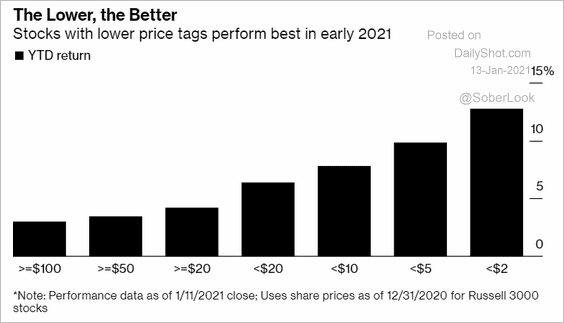 Source: @business Read full article
——————–
3. Staying with small caps, the S&P small-cap 600 index has consistently outperformed the Russell 2,000 index since 2009.
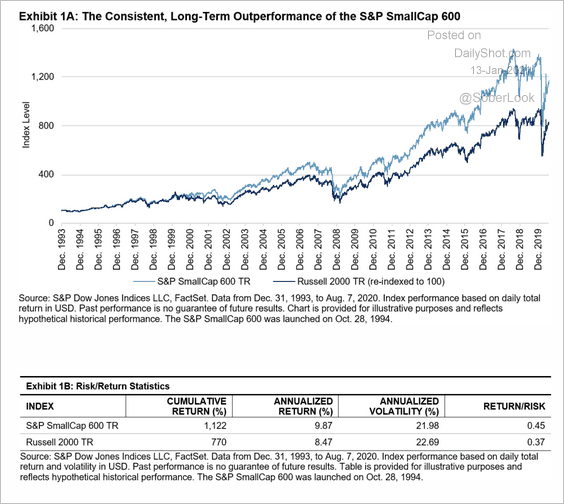 Source: S&P Global Market Intelligence Read full article
The average monthly outperformance of the S&P 600 index is particularly notable in July.
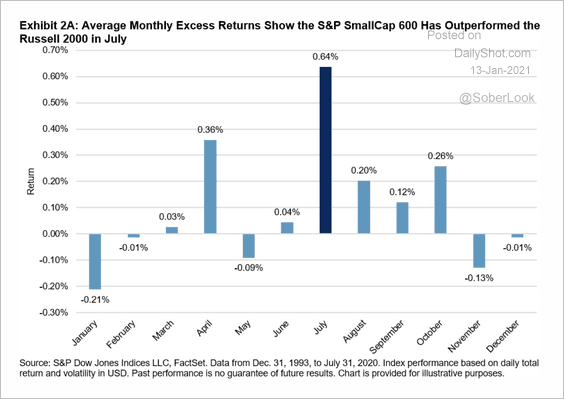 Source: S&P Global Market Intelligence Read full article
——————–
4. This chart compares the price-to-sales ratios for the S&P 500, the Nasdaq Composite, and the Russell 2000.
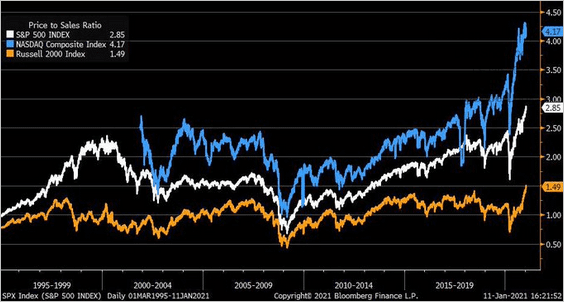 Source: @LizAnnSonders
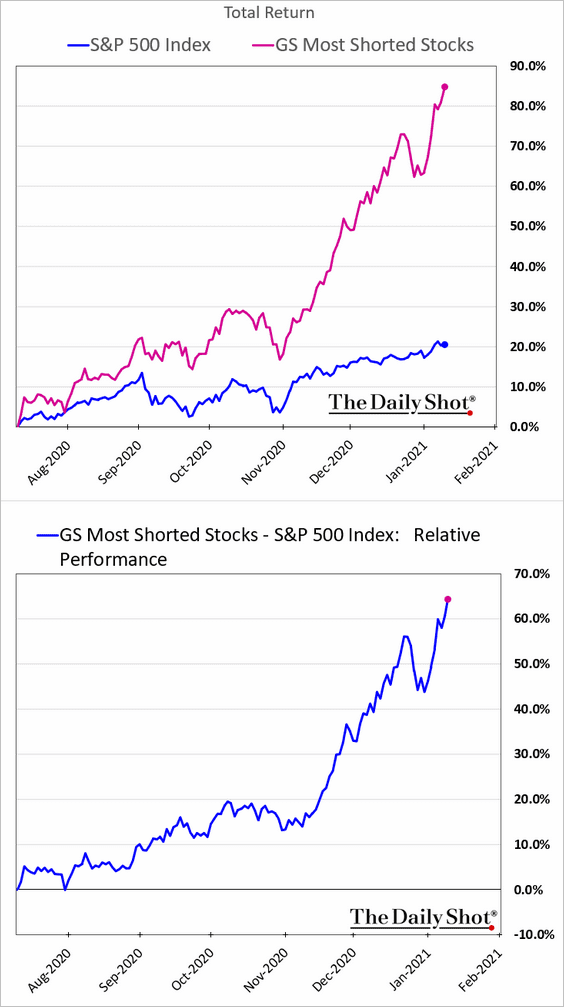
5. Most-shorted stocks continue to surge.
6. Investors have piled into ESG and large-cap growth funds over the past year.
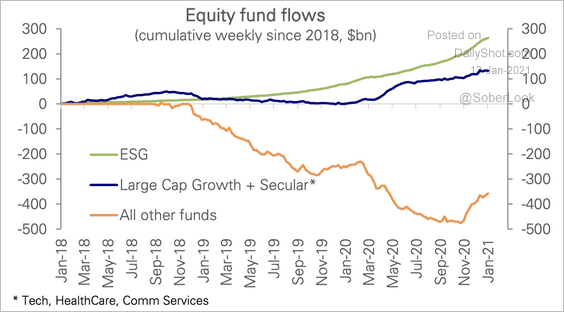 Source: Deutsche Bank Research
7. US active managers that focused on growth stocks outperformed last year, while active value and blend managers underperformed.
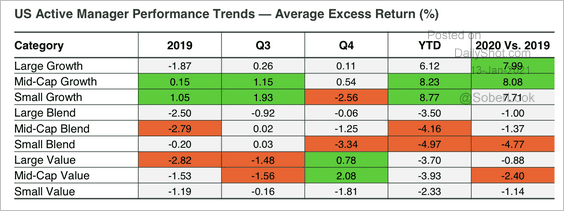 Source: SPDR Americas Research, @mattbartolini
8. The next chart shows the forward P/E ratios for growth and value stocks.
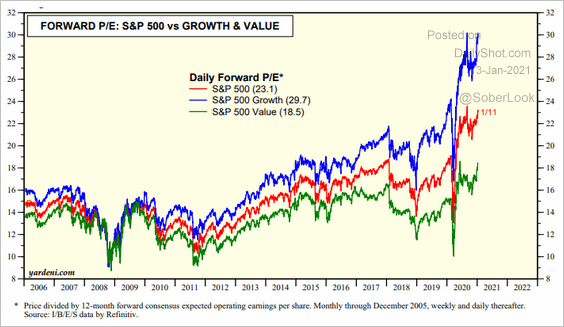 Source: Yardeni Research
9. Analysts have been more optimistic about financial sector earnings.
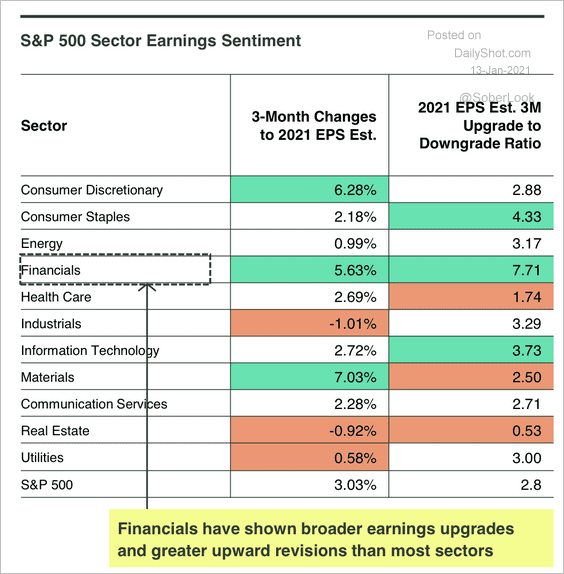 Source: SPDR Americas Research, @mattbartolini
10. Here is a look at post-financial crisis sector returns.
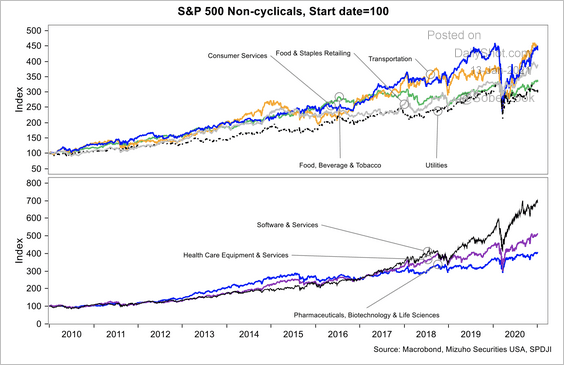 Source: Mizuho Securities USA
11. Global growth prospects bode well for equity fund inflows.
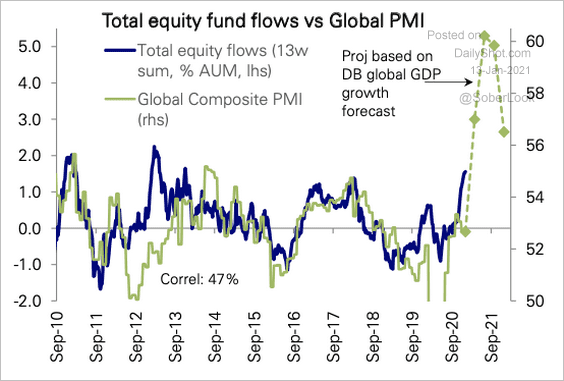 Source: Deutsche Bank Research
Back to Index
Credit
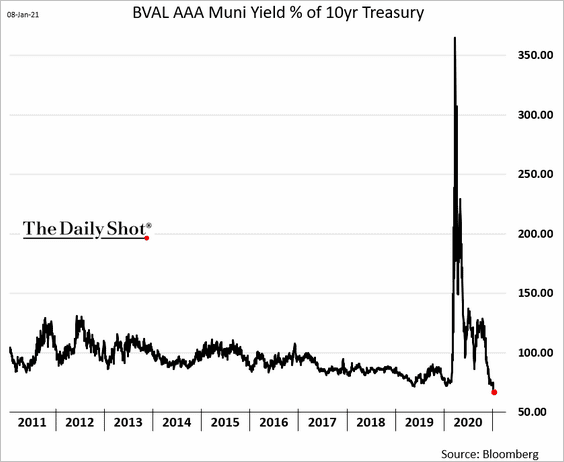
1. High-rated muni yields hit a new low relative to Treasuries on expectations of additional support from the federal government.
Muni borrowing has been elevated in recent years.
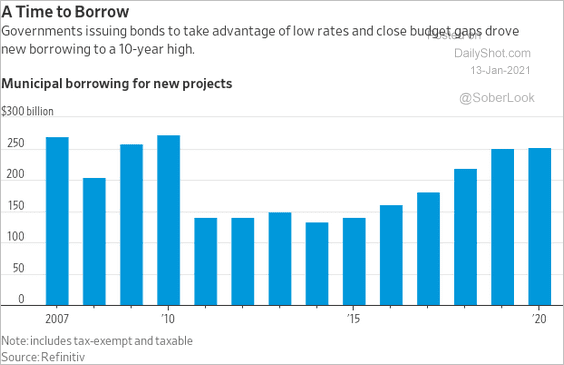 Source: @WSJ Read full article
——————–
2. US corporate short-term debt has risen substantially over the past two years.
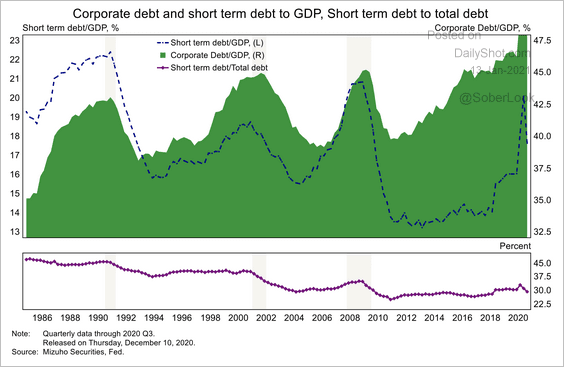 Source: Mizuho Securities USA
But US investment-grade duration is still the longest in 40 years.
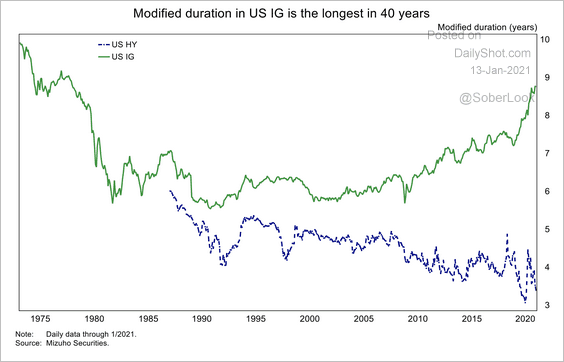 Source: Mizuho Securities USA
——————–
3. The amount of non-financial commercial paper outstanding tumbled last year as companies locked in cheap long-term financing.
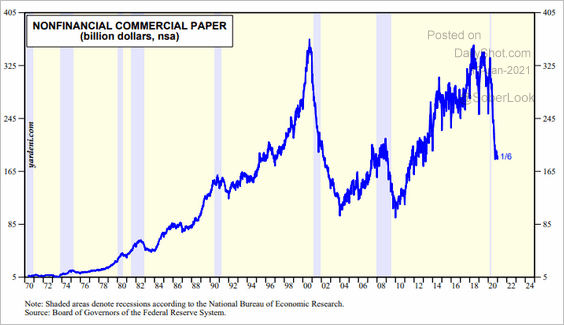 Source: Yardeni Research
Back to Index
Rates
1. Non-US banks account for most of the fed funds trading.
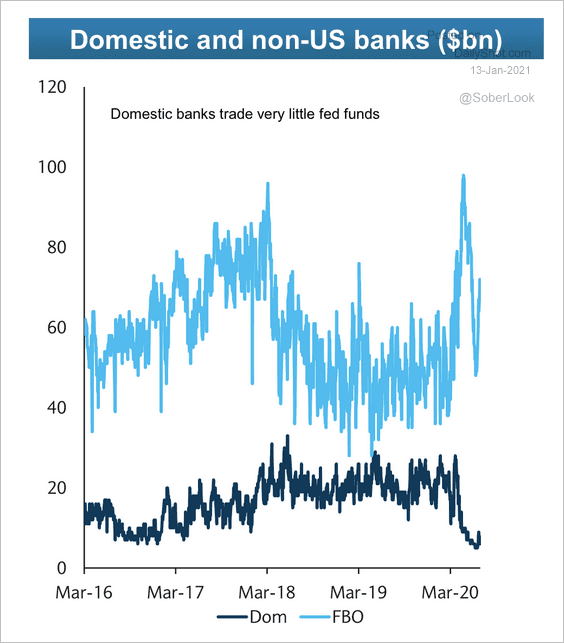 Source: Barclays Research
Trading volumes in the fed funds market have declined since 2017.
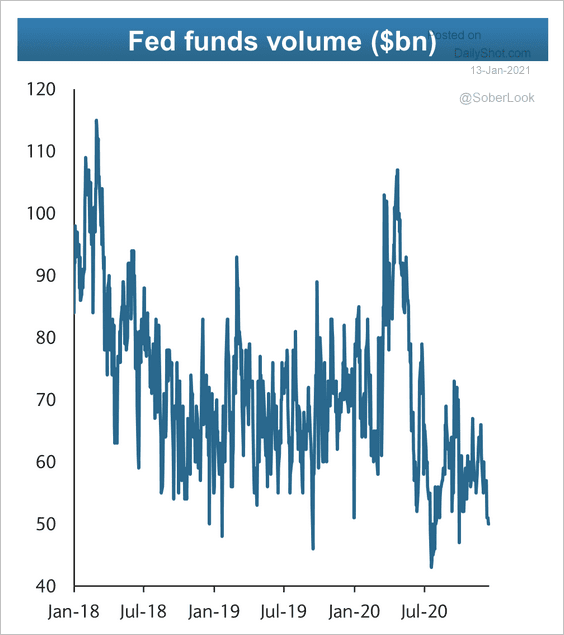 Source: Barclays Research
——————–
2. This chart shows the history of the Fed’s forward guidance since the GFC.
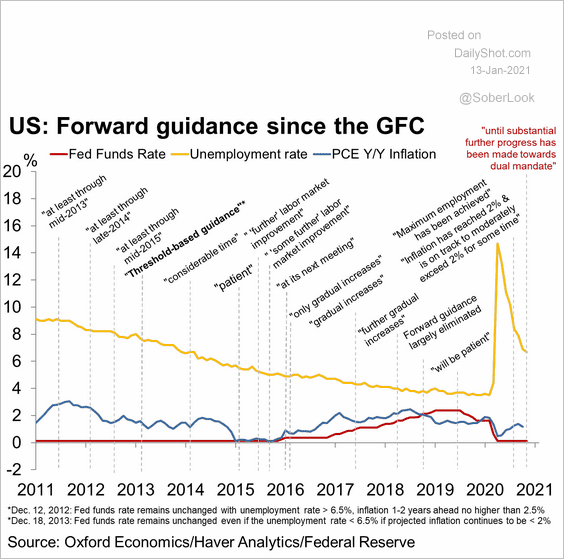 Source: Oxford Economics
Back to Index
Commodities
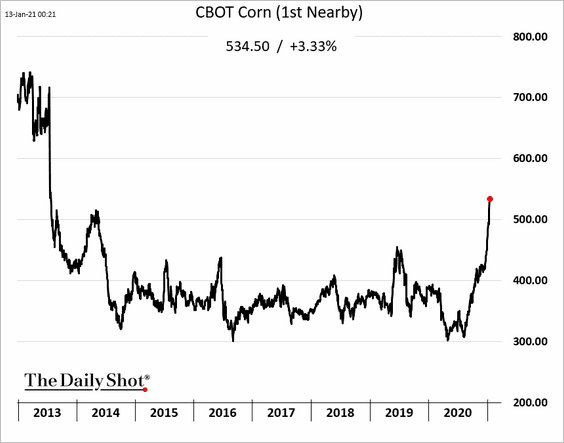
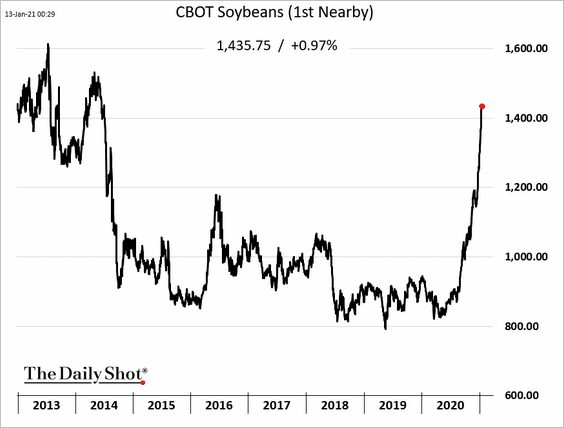
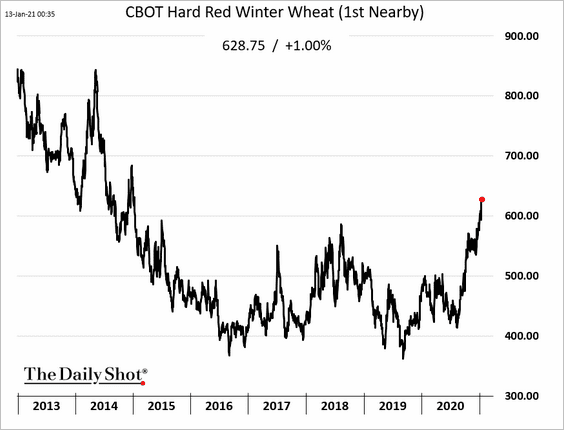
US grain futures are surging. Below is a quote from Bloomberg.
The U.S. Department of Agriculture [WASDE Report] surprised traders with bigger-than-expected cuts in its monthly outlook, forecasting corn stockpiles will fall to a seven-year low at the end of this season amid lower yields. The U.S. corn output estimate came in almost 2% below the average from analysts surveyed by Bloomberg.
• Corn:
• Soybeans:
• Wheat:
Back to Index
Energy
1. Is the rally in crude oil ready for a pause?
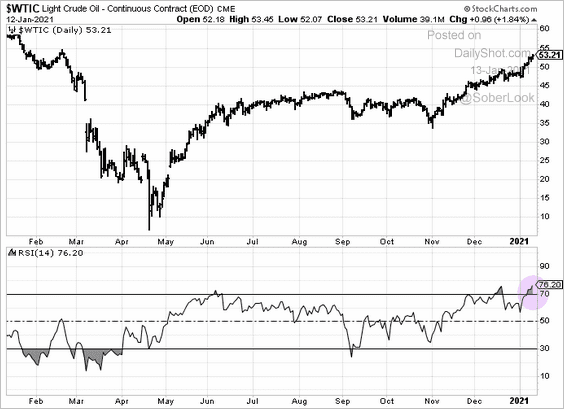
Long positioning in oil futures does not appear stretched, even though the dollar is heavily shorted.
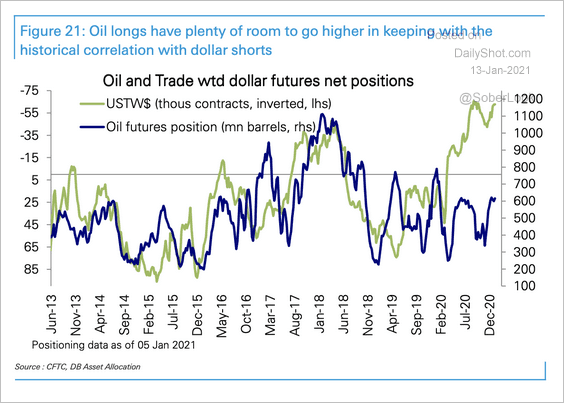 Source: Deutsche Bank Research
——————–
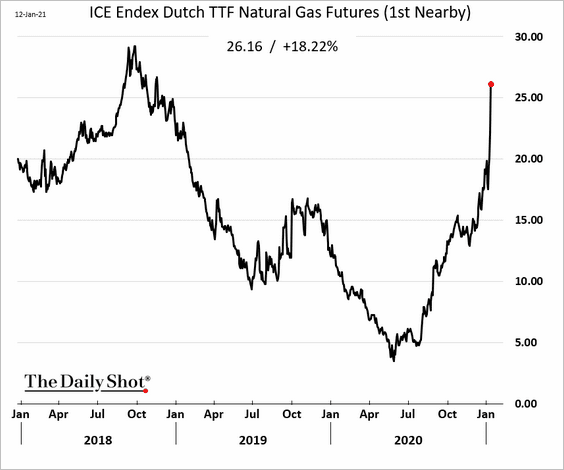
2. European natural gas prices spiked this week (following Asia’s markets).
3. Shale firms need further price gains to reduce their leverage.
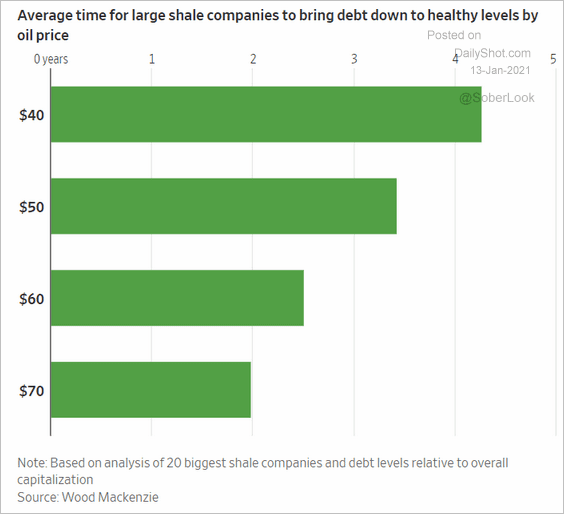 Source: @WSJ Read full article
Back to Index
Emerging Markets
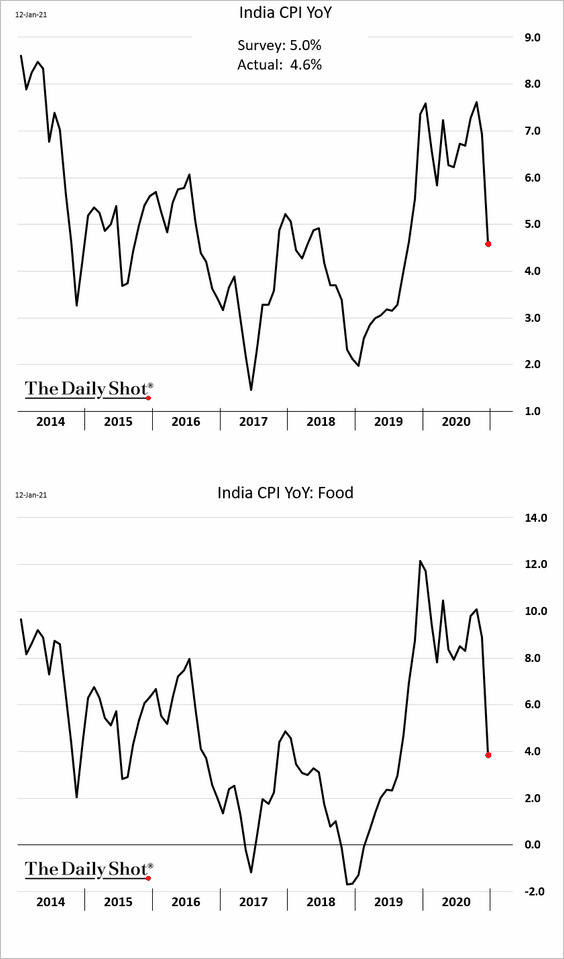
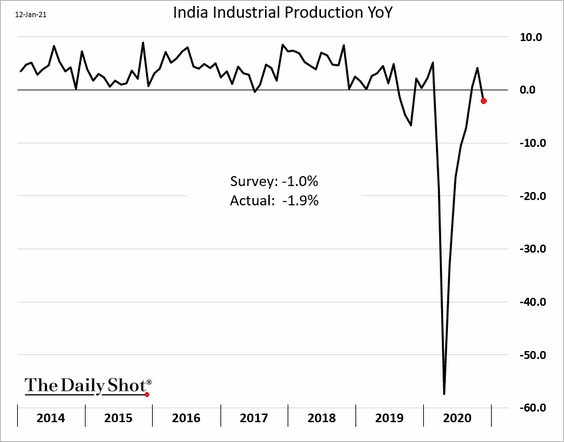
1. Let’s begin with India.
• The CPI continues to moderate, driven by food prices.
• The November industrial production print was disappointing.
• The Sensex (equity) index hit 50k.
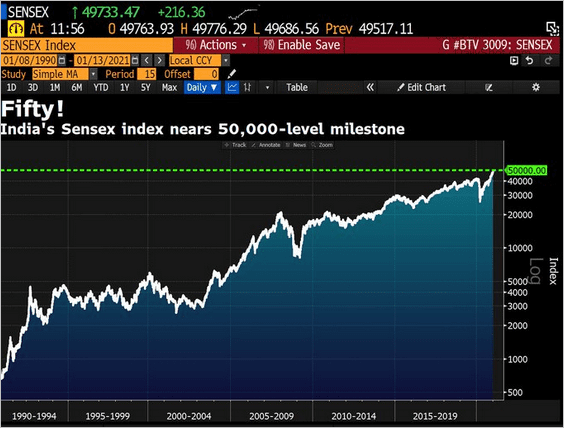 Source: @DavidInglesTV
——————–
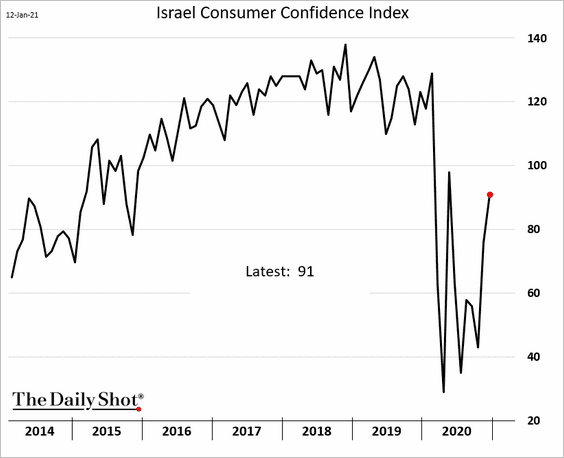
2. Israel’s consumer confidence is rebounding.
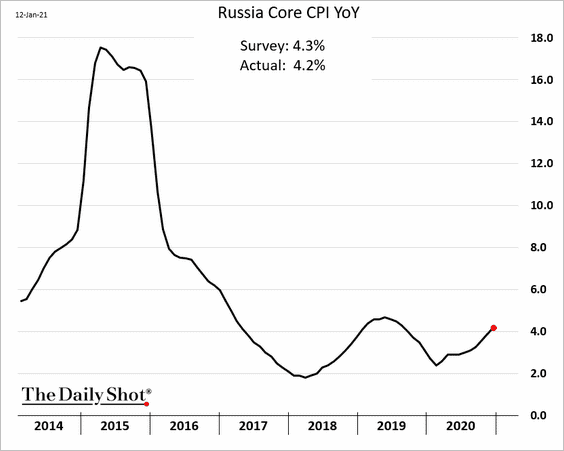
3. Russia’s inflation is grinding higher.
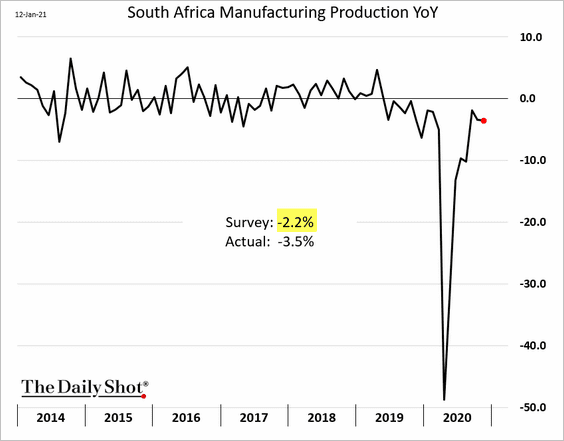
4. South Africa’s manufacturing recovery stalled in November.
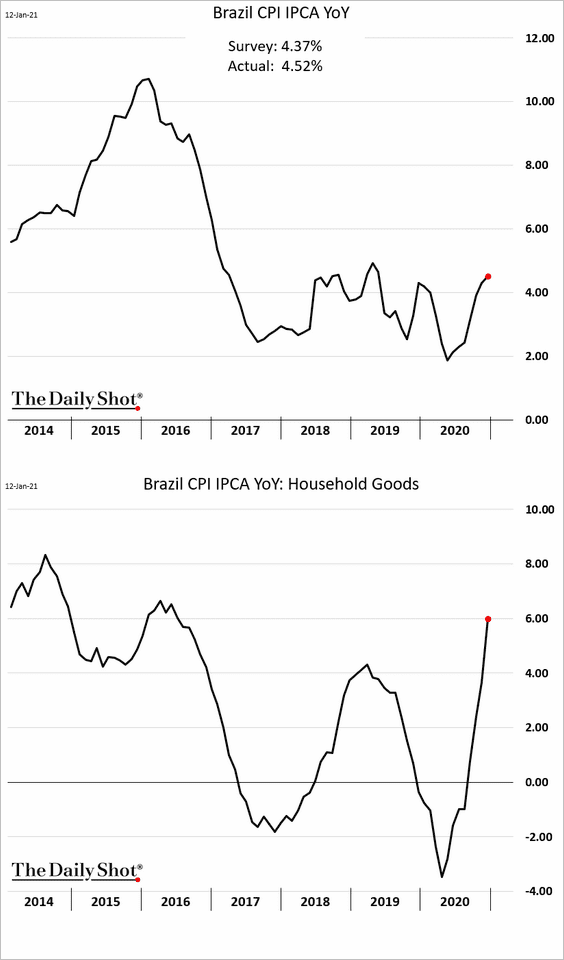
5. Brazil’s CPI is on the rise.
6. Brazil’s economic recovery is expected to keep outperforming Mexico’s growth.
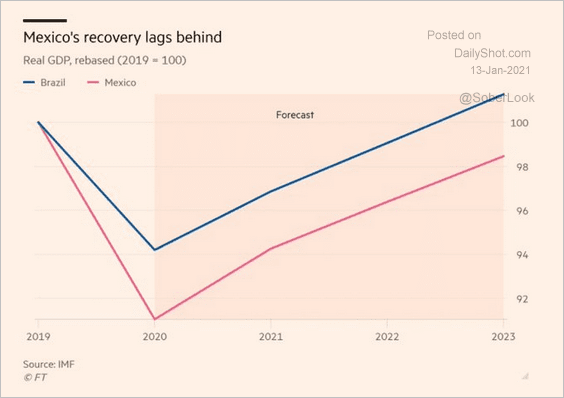 Source: @adam_tooze Read full article
Back to Index
China
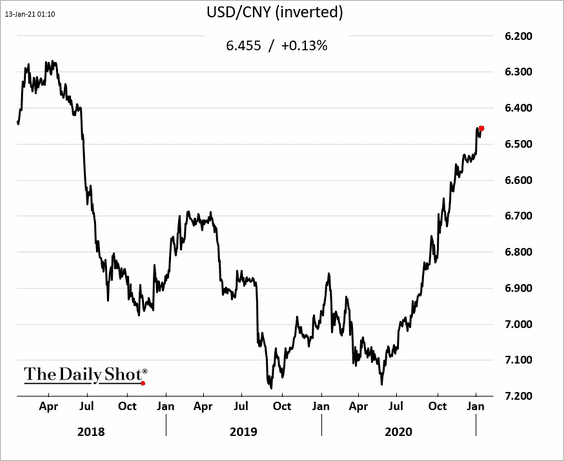
1. The renminbi continues to climb against the dollar.
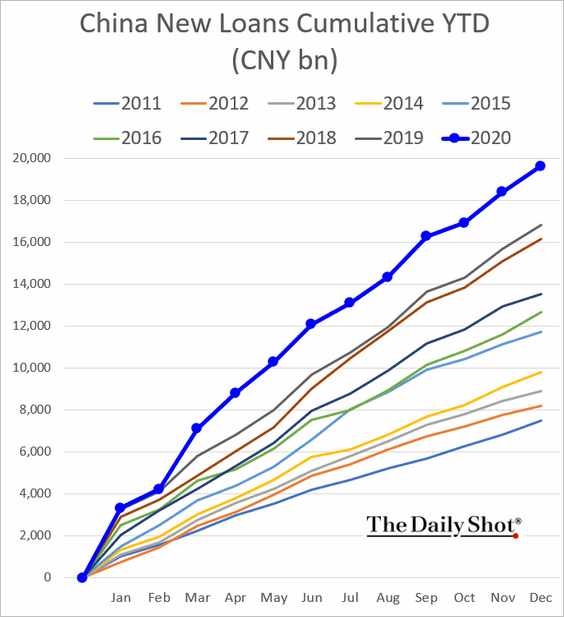
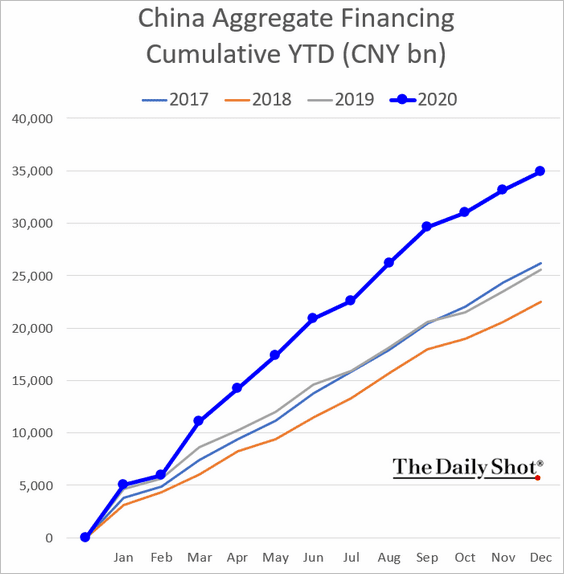
2. 2020 was a good year for China’s credit expansion.
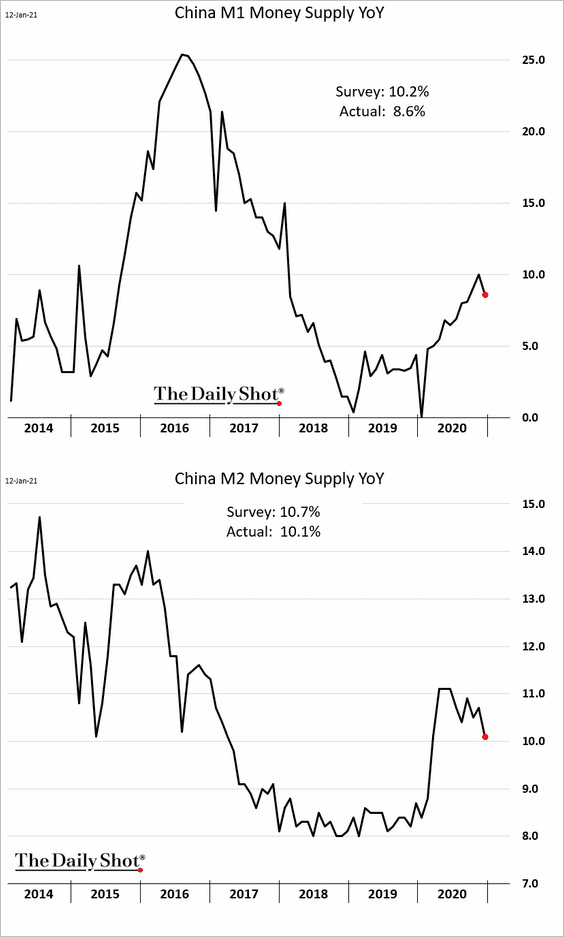
3. China’s money supply growth slowed last month.
4. Foreign investors fell in love with Chinese bonds last year.
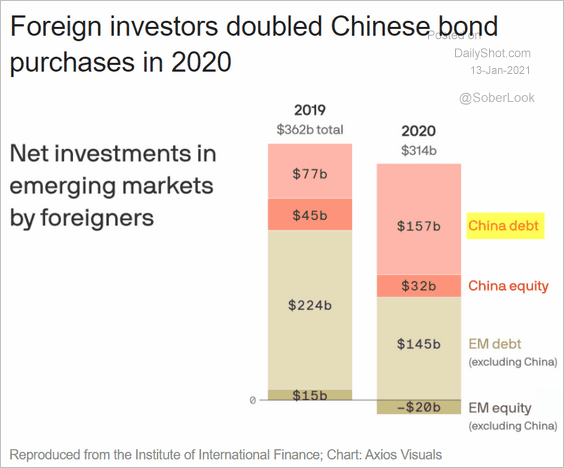 Source: @axios Read full article
Back to Index
Asia – Pacific
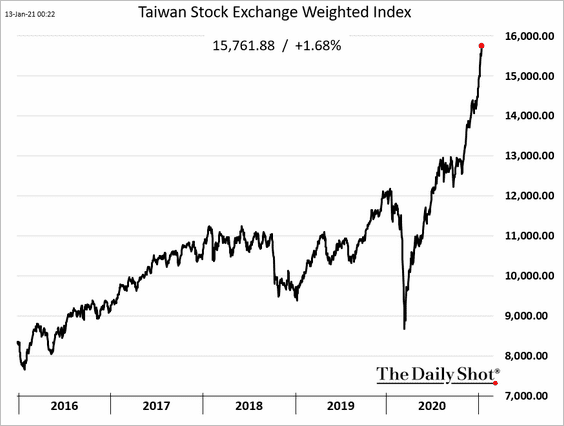
1. Taiwan’s stock market continues to soar.
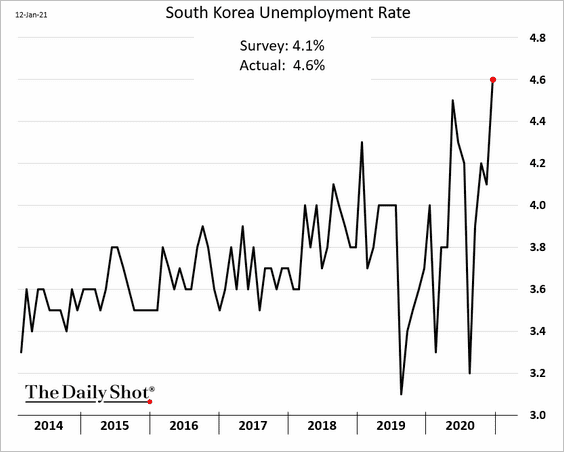
2. South Korea’s unemployment rate remains elevated.
3. Next, we have some updates on Australia.
• Job vacancies spiked.
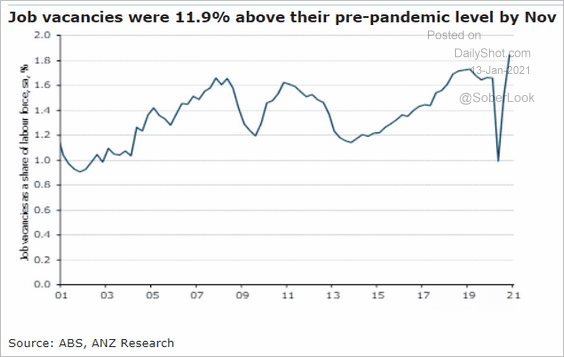 Source: ANZ Research
• Australian households preferred using debit rather than credit cards last year.
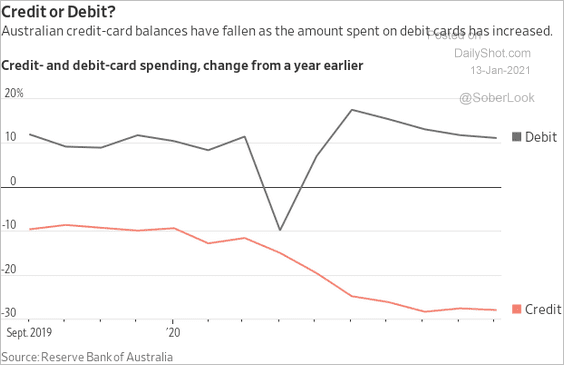 Source: @WSJ Read full article
• Aussie dollar sentiment looks stretched.
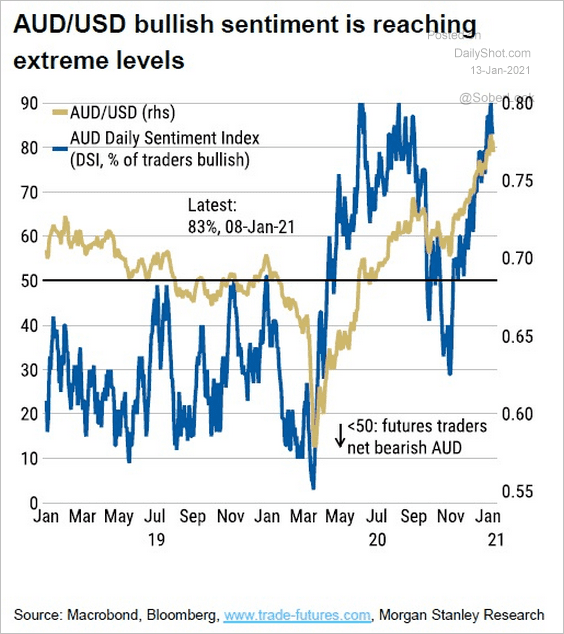 Source: Morgan Stanley Research, @Scutty
Back to Index
Japan
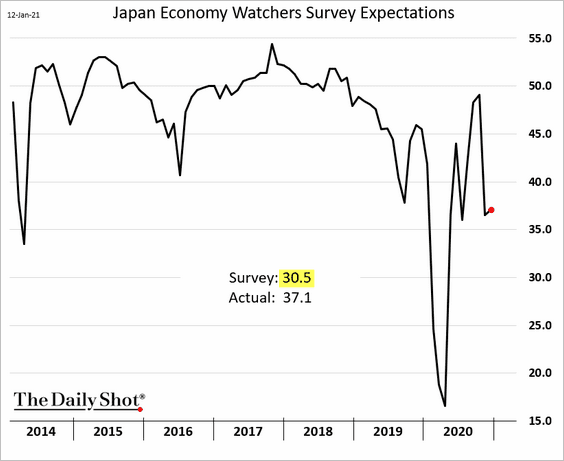
1. The December Economy Watchers survey surprised to the upside.
2. The nominal GDP has been relatively flat since the late 1990s.
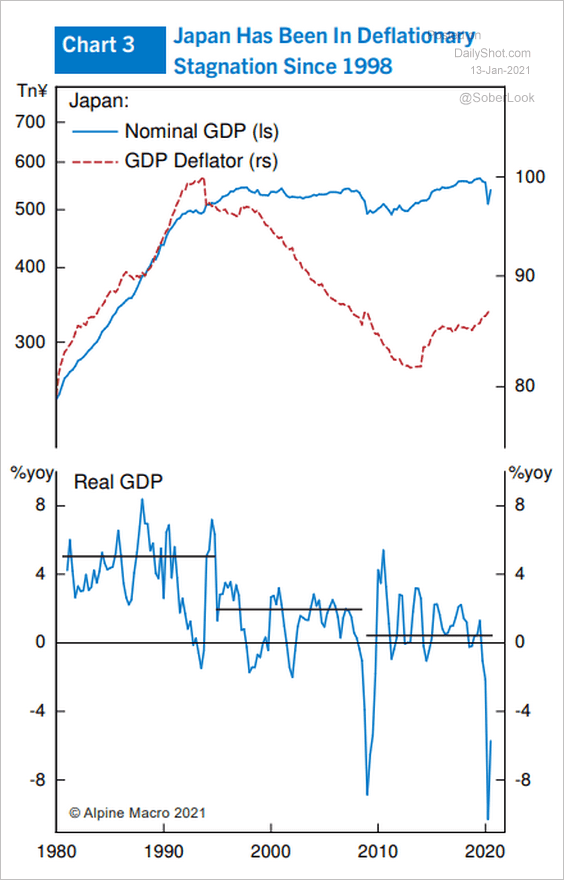 Source: Alpine Macro
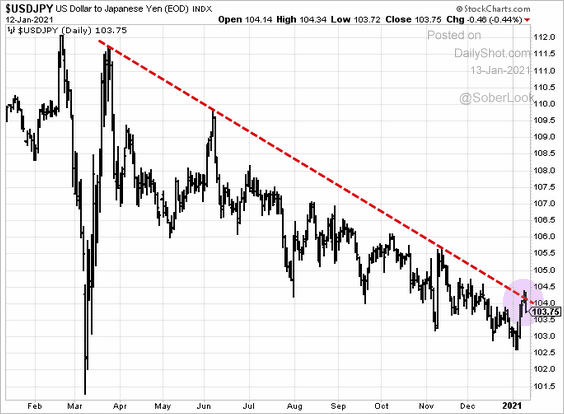
3. Dollar-yen held resistance this week.
Back to Index
The Eurozone
1. Market-based inflation expectations are rebounding.
• EUR 5yr, 5yr forward inflation swap:
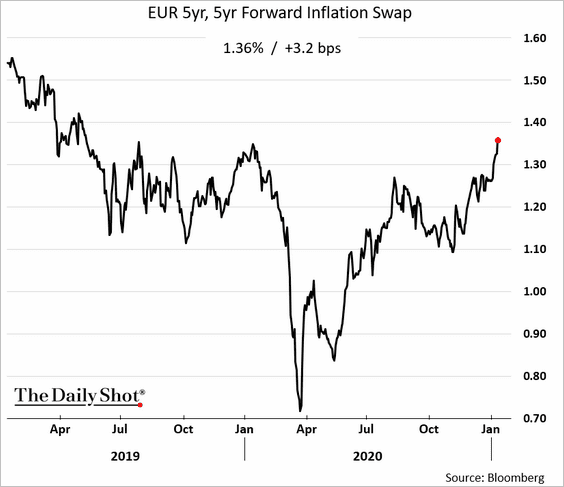
• Germany’s 10yr breakeven:
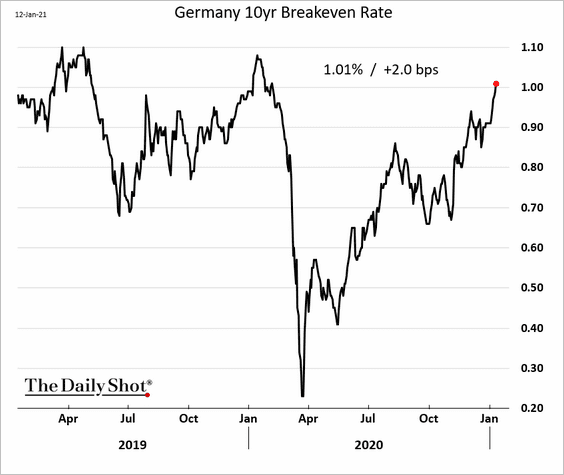
Inflation should begin recovering in the months ahead.
 Source: Alpine Macro
——————–
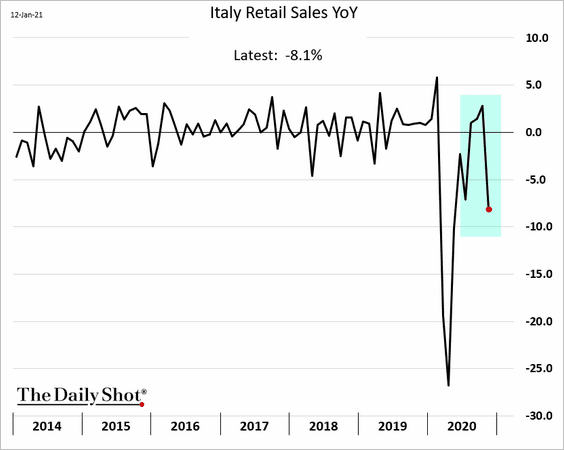
2. Italian retail sales tumbled in November.
3. Who will replace Angela Merkel? Analysts suggest that it will be Friedrich Merz.
 Source: The Guardian Read full article
But polls show a preference for Markus Söder, which would change the direction for Germany’s leadership.
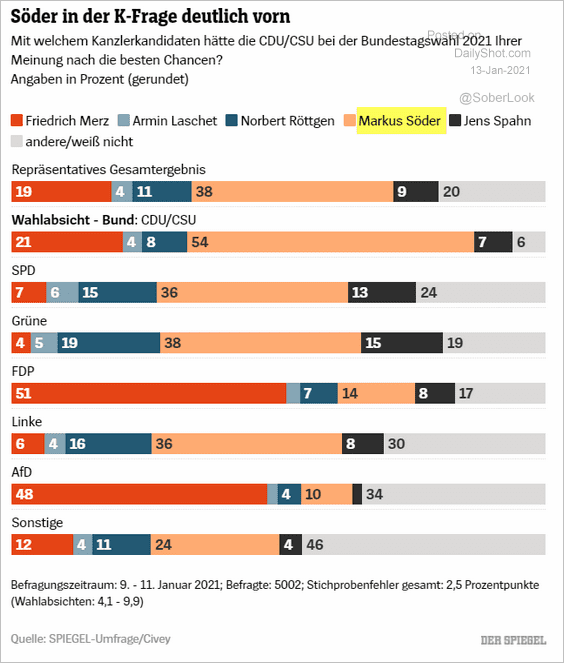 Source: Der Spiegel, @adam_tooze Read full article
Back to Index
The United Kingdom
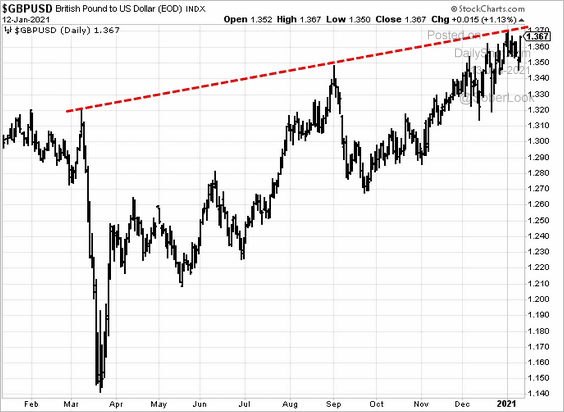
1. The pound is at resistance.
2. What are the corporate priorities for this year?
 Source: Statista
3. This chart shows UK transportation usage.
![]() Source: Pantheon Macroeconomics
Source: Pantheon Macroeconomics
4. Two-thirds of COVID critical care patients are below the age of 70.
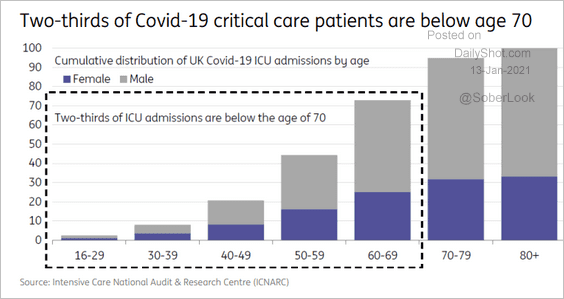 Source: ING
Back to Index
The United States
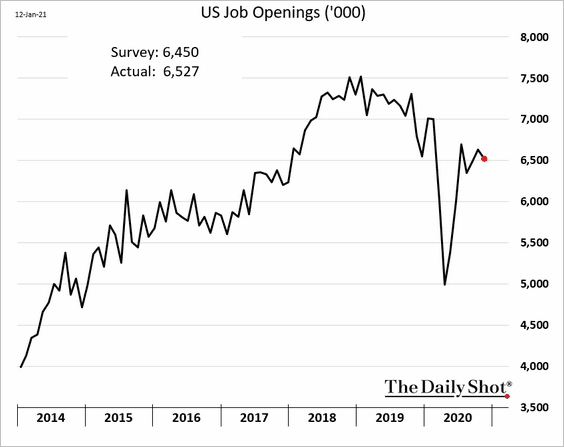
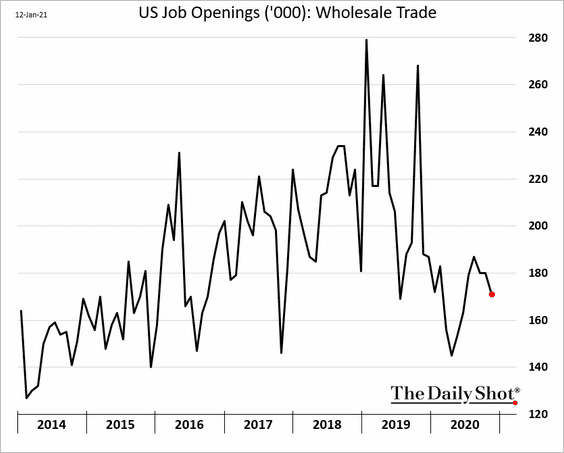
1. Job openings held steady in November.
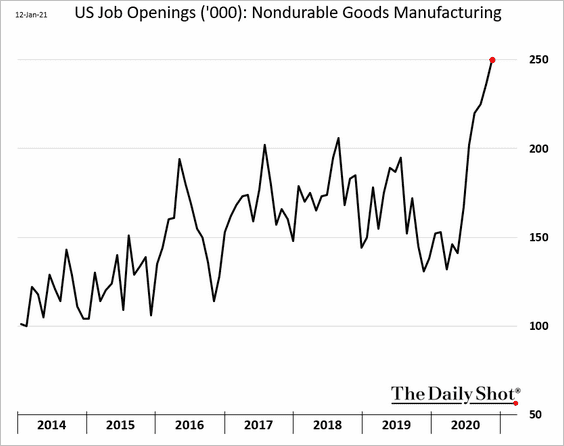
The report showed a mixed picture across sectors.
• Wholesale trade:
• Nondurable goods manufacturing (labor shortages):
The quits rate (voluntary separations) is almost back to pre-pandemic levels.
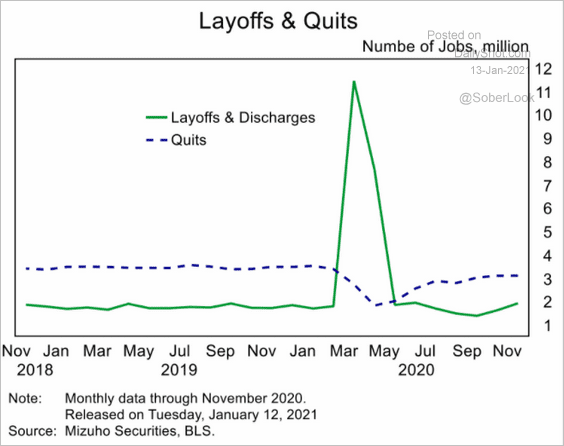 Source: Mizuho Securities USA
Here is the Beveridge curve.
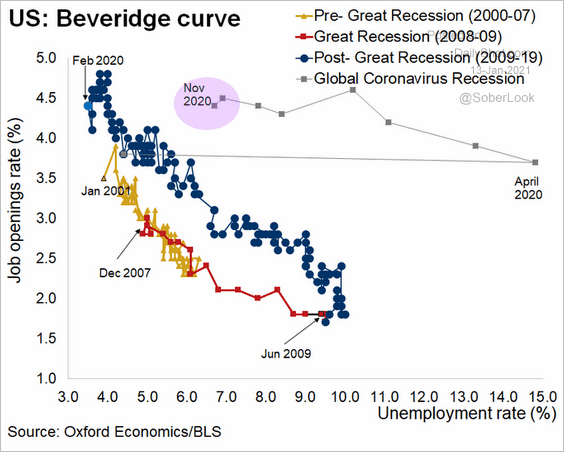 Source: @GregDaco
By the way, job postings on Indeed have not recovered.
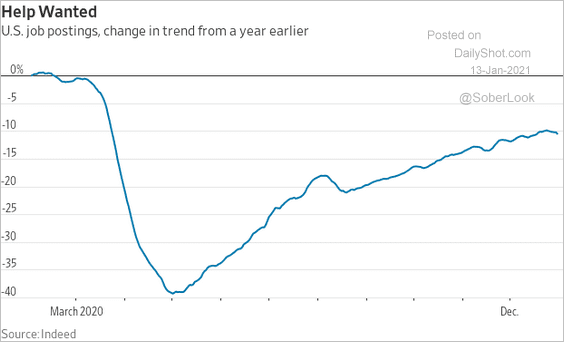 Source: @WSJ Read full article
——————–
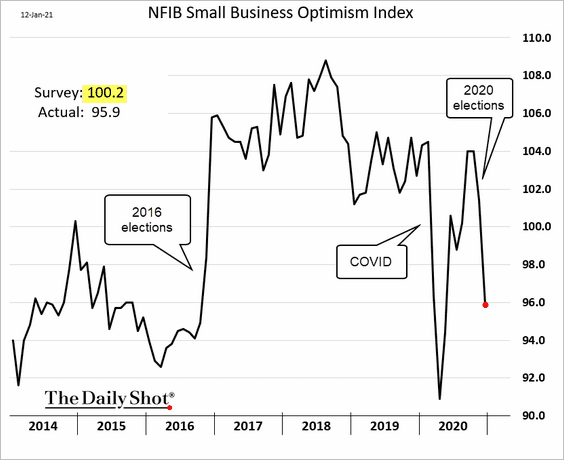
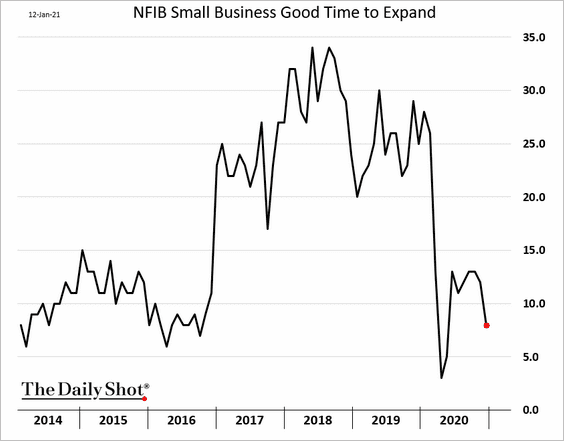
2. The NFIB small business optimism index tumbled last month. As discussed previously, this index is highly sensitive to politics at the national level.
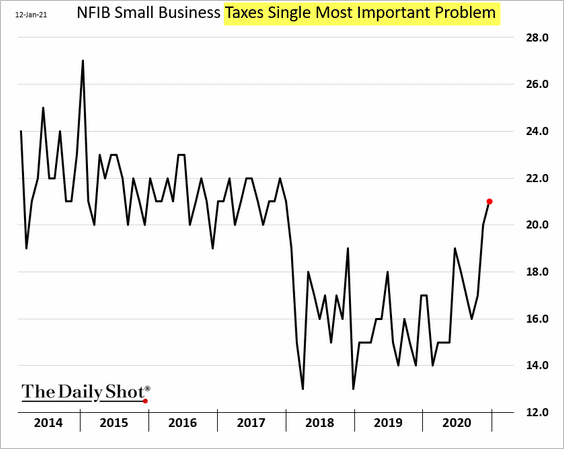
For example, while the US tax laws have not changed in recent months, more small businesses now see taxes as the most important problem.
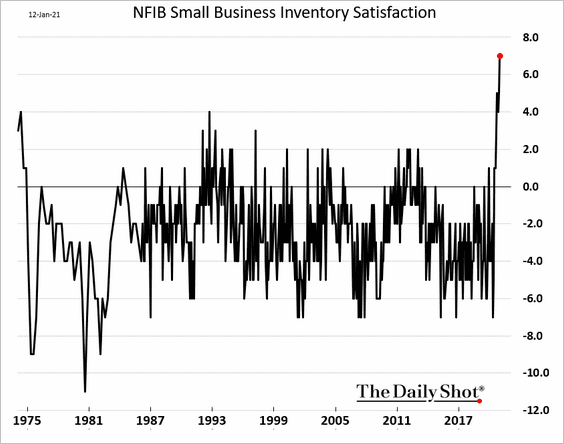
• The net percentage of firms who view current inventories as too low hit a record level.
• Here are a few other trends from the NFIB report.
– Good time to expand:
– Views on the economy:
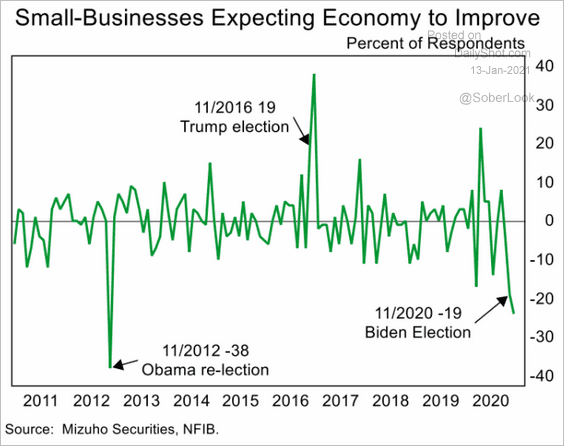 Source: Mizuho Securities USA
– General business conditions:
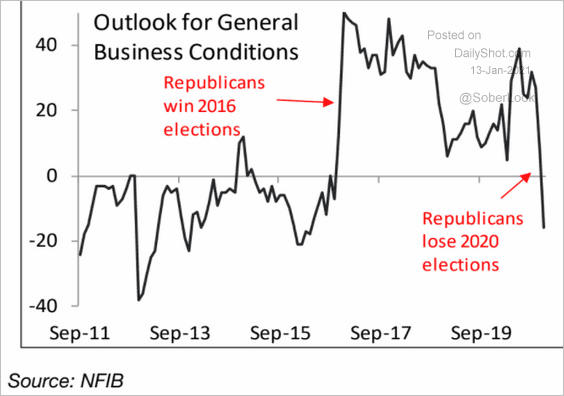 Source: Piper Sandler
– CapEx expectations:
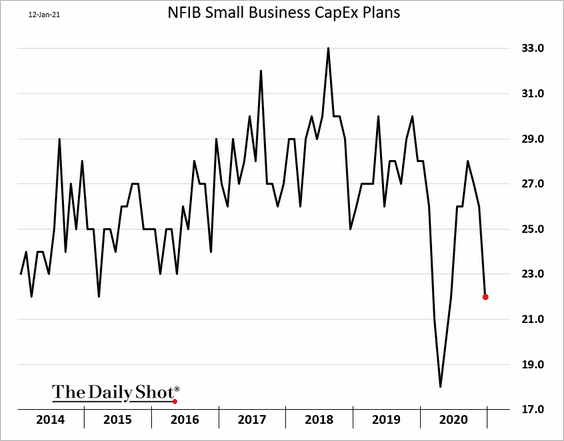
Note that US capital goods orders paint a different picture.
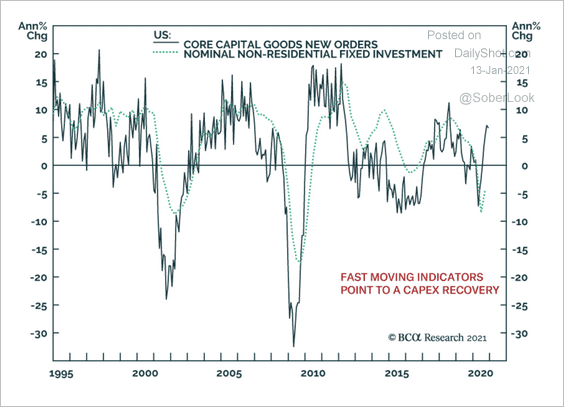 Source: BCA Research
——————–
3. Permanent local business closures continue to rise, according to Yelp data.
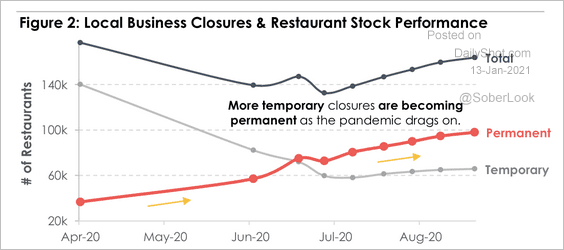 Source: MarketDesk Research
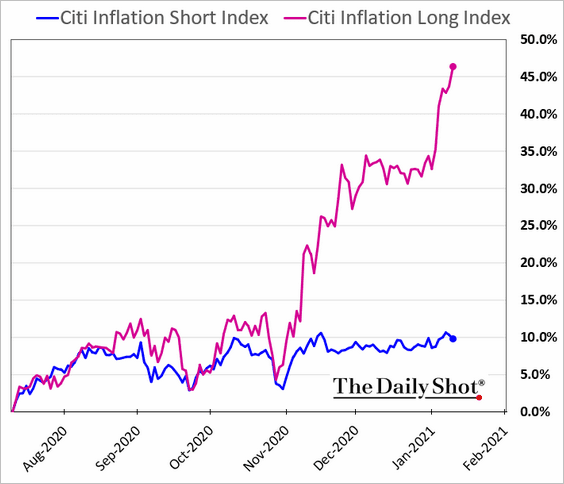
4. Next, we have some updates on inflation.
• The stock market is increasingly pricing in higher inflation, as shares of firms that would benefit from rising prices outperform sharply.
• The NFIB small business report (above) points to higher prices ahead (2 charts), …
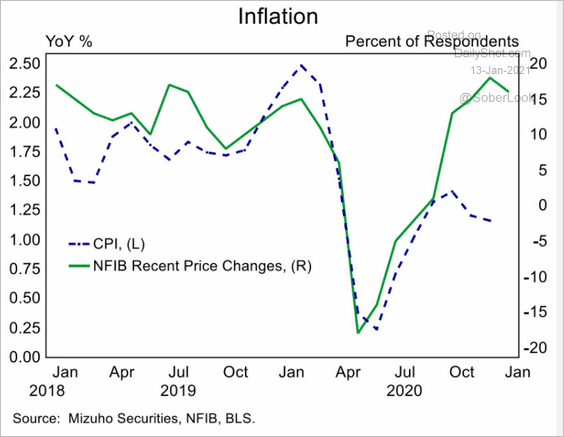 Source: Mizuho Securities USA
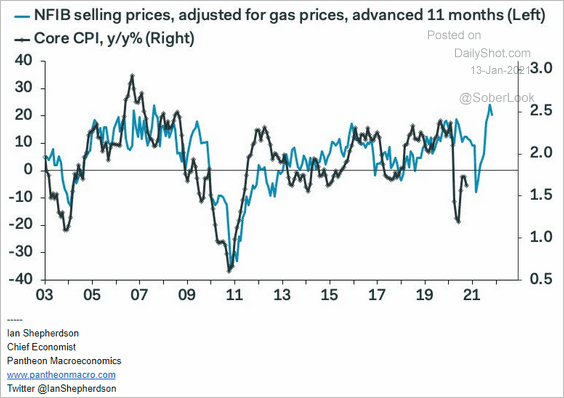 Source: Pantheon Macroeconomics
… and so do other surveys.
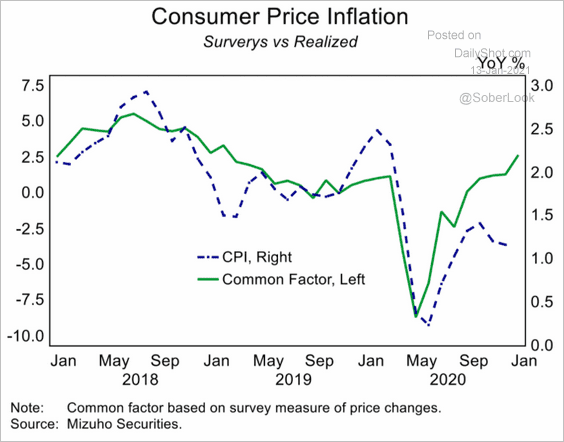 Source: Mizuho Securities USA
• Also, take a look at the commodities section.
Back to Index
Global Developments
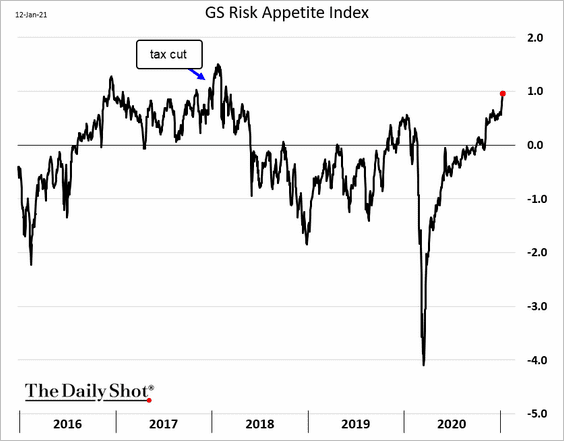
1. Let’s start with Goldman’s risk appetite index, which hit the highest level since the US tax cut.
2. New COVID cases continue to climb.
 Source: Statista
3. The rebound in global profits has been impressive.
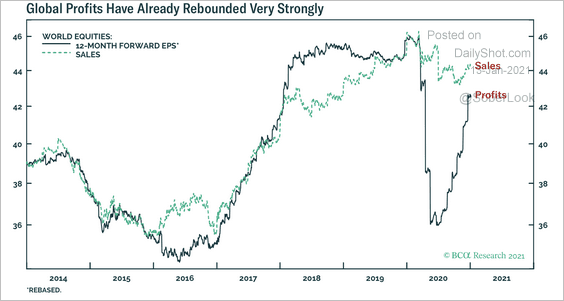 Source: BCA Research
4. Risk asset implied volatility declined last month. But currency volatility increased due to Brexit uncertainty.
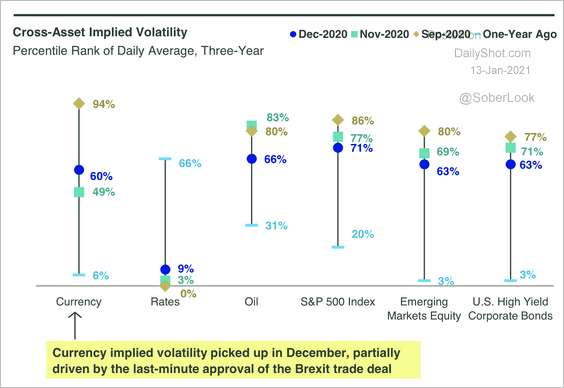 Source: SPDR Americas Research, @mattbartolini
5. This chart shows nominal and real government bond yields.
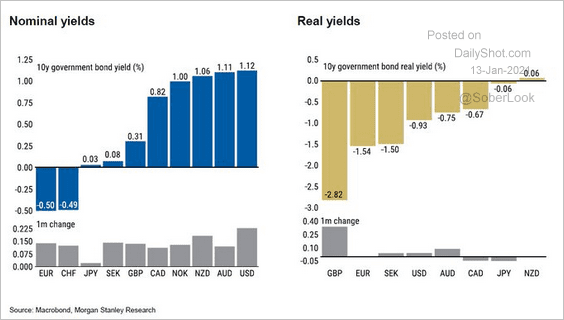 Source: @Scutty
——————–
Food for Thought
1. Who Americans spend their time with, by age:
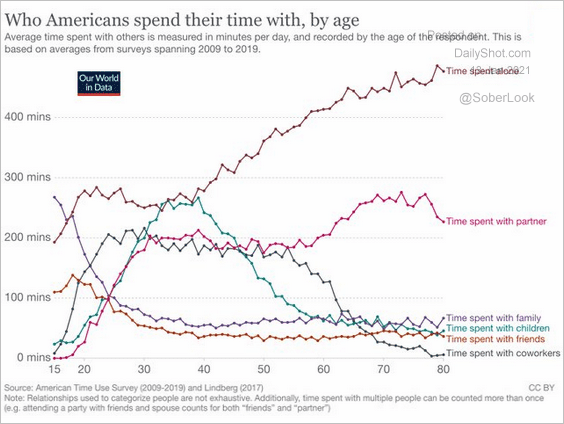 Source: @SteveStuWill, @EOrtizOspina, @OurWorldInData Read full article
2. Visualizing the most populous countries in the world:
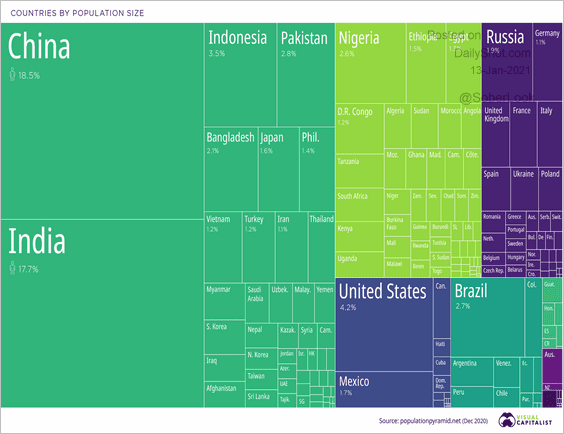 Source: Visual Capitalist Read full article
3. US young adults living with parents:
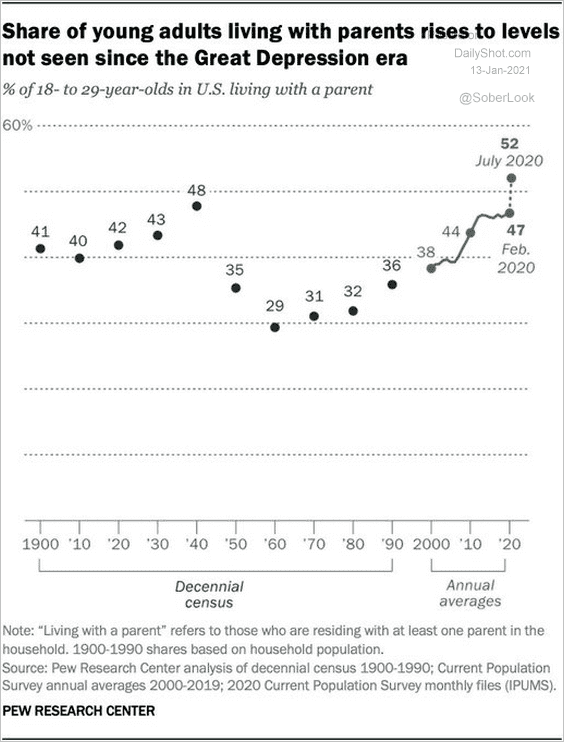 Source: @pewresearch
4. How North Koreans get their news:
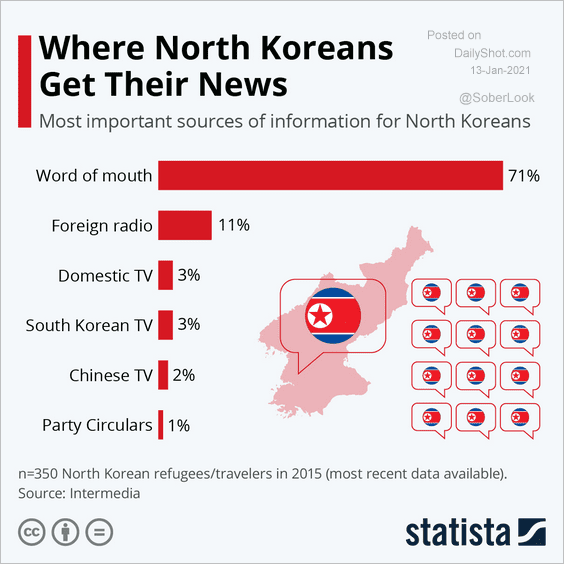 Source: Statista
5. Tobacco product usage by US children:
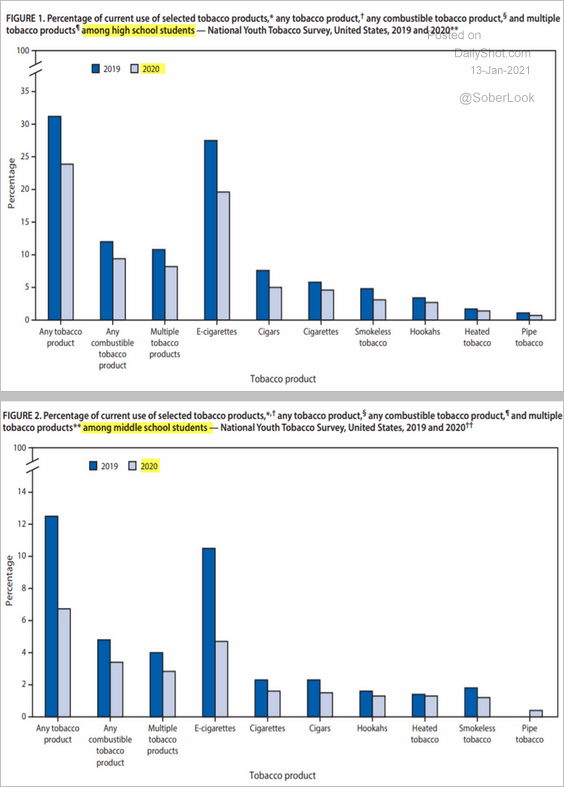 Source: CDC
6. Should healthcare workers be required to get the vaccine?
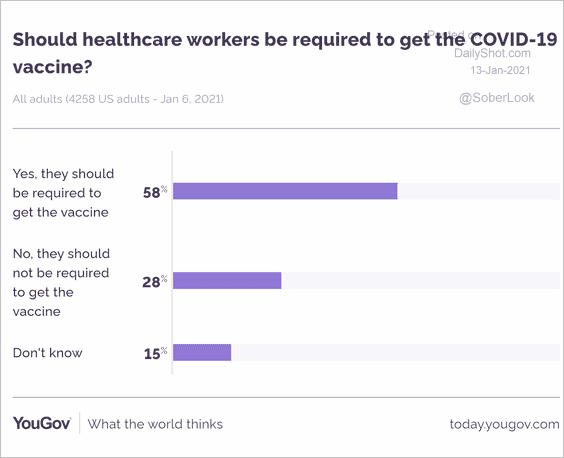 Source: YouGov
7. Americans’ willingness to be vaccinated:
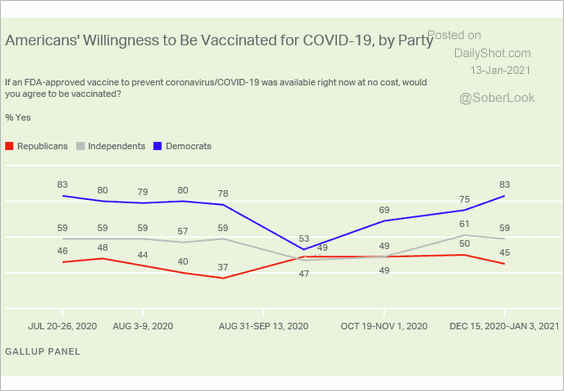 Source: Gallup Read full article
8. Mental health in 2020:
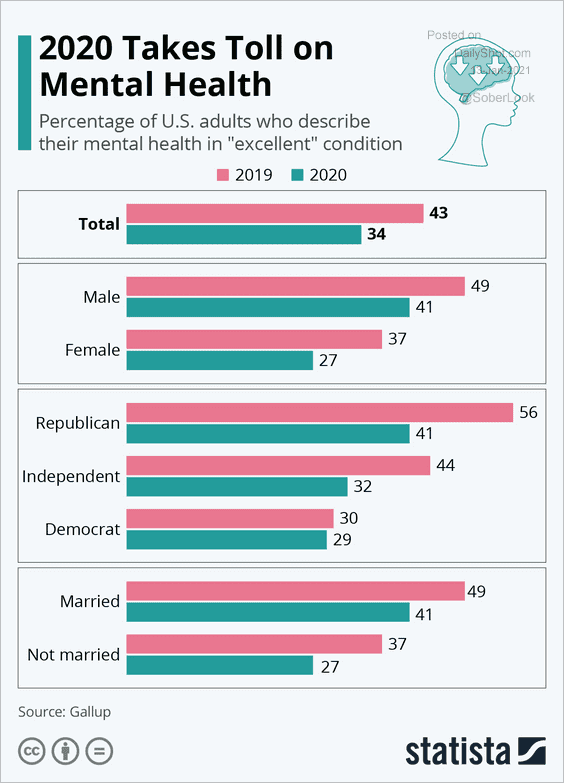 Source: Statista
9. US urban households without running water:
 Source: Statista
10. How do people around the world spend their time?
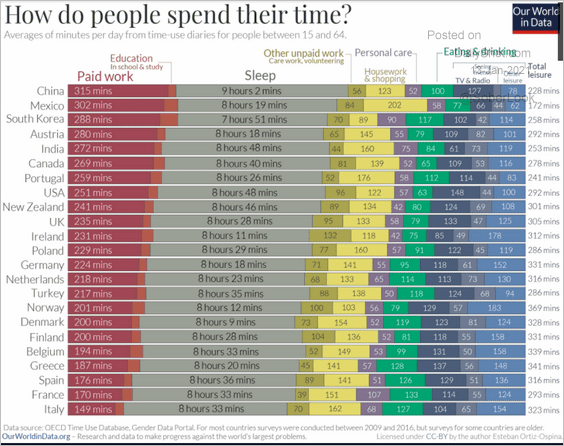 Source: Our World in Data Read full article
——————–
Back to Index