
The Daily Shot: 18-Jan-21
• The United States
• The United Kingdom
• The Eurozone
• Europe
• China
• Emerging Markets
• Cryptocurrency
• Commodities
• Equities
• Credit
• Rates
• Food for Thought
The United States
1. December retail sales were disappointing as the pandemic took its toll.
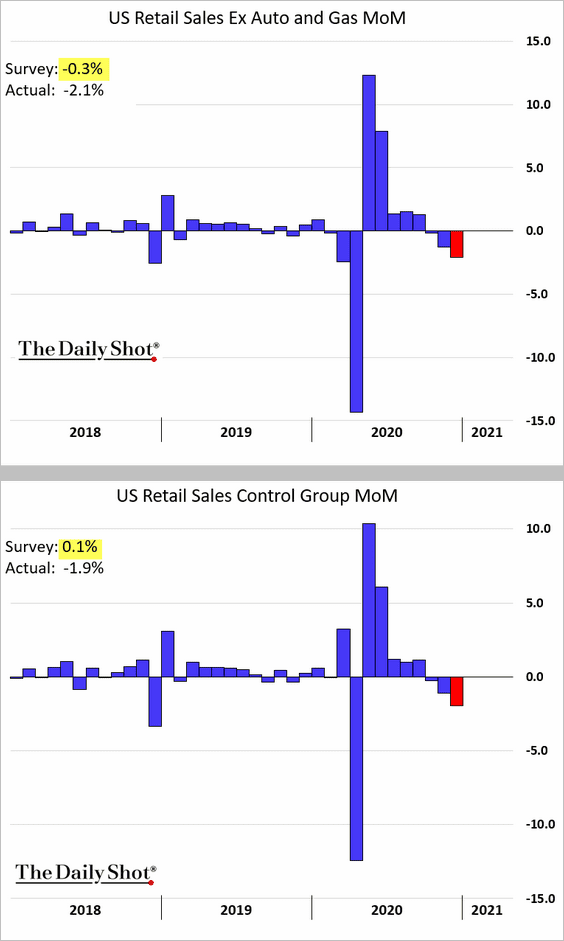
(The “control group” excludes autos, building materials, gas stations, office supplies, mobile homes, and tobacco stores.)
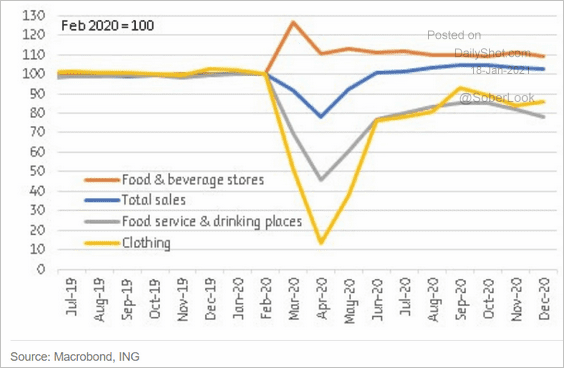
• Here are the trends by sector.
 Source: ING
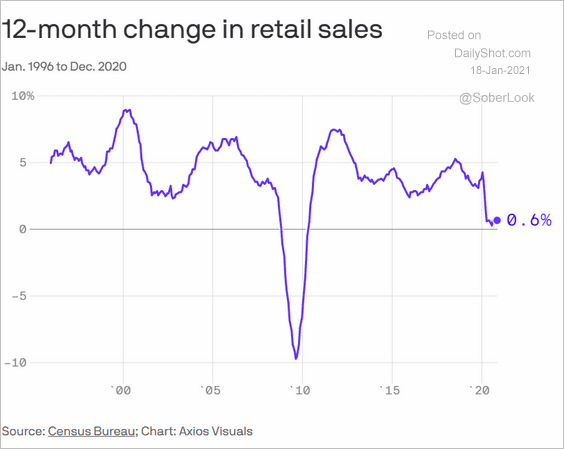
• On a year-over-year basis, US retail sales were in positive territory in 2020.
 Source: @axios Read full article
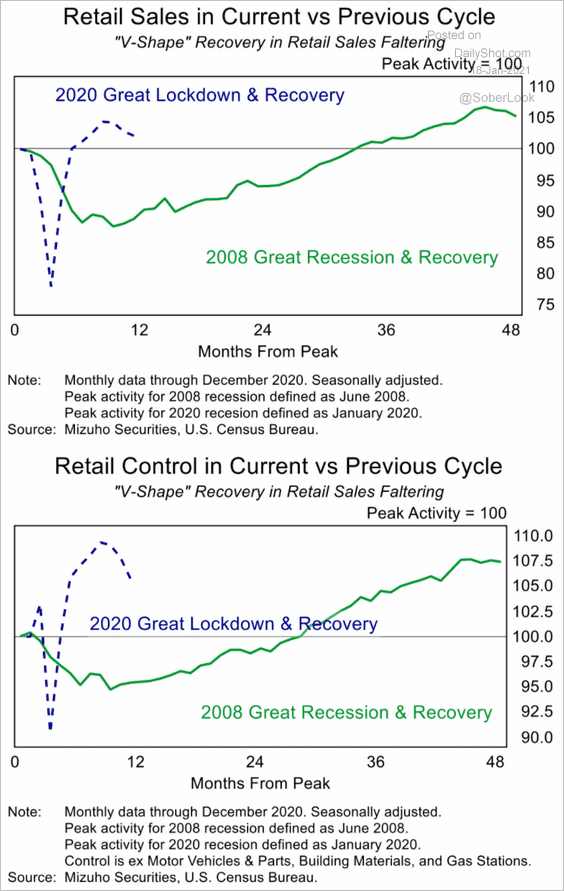
• Below is a comparison to the 2008 downturn.
 Source: Mizuho Securities USA
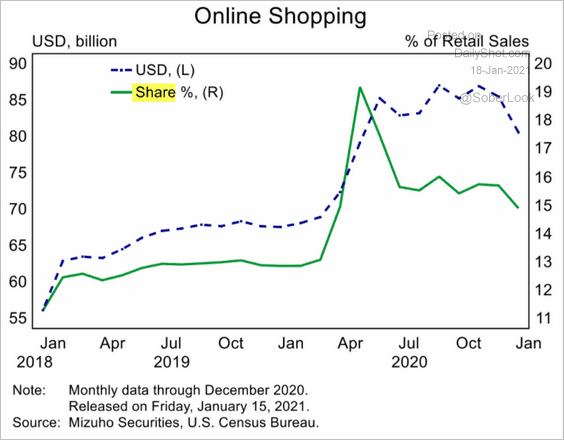
• Online retail sales softened going into the year-end.
 Source: Mizuho Securities USA
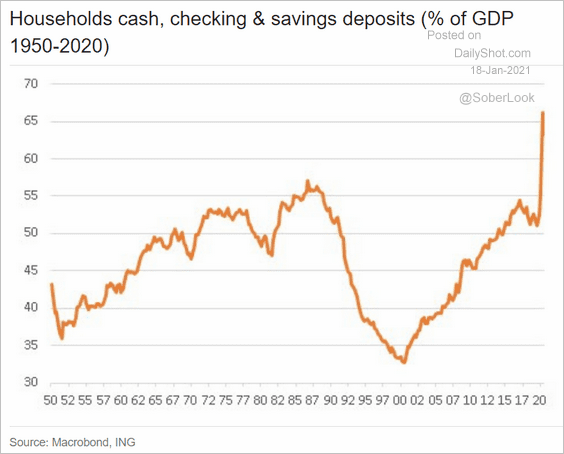
• Elevated household cash balances could translate into a sharp increase in retail sales this year.
 Source: ING
——————–
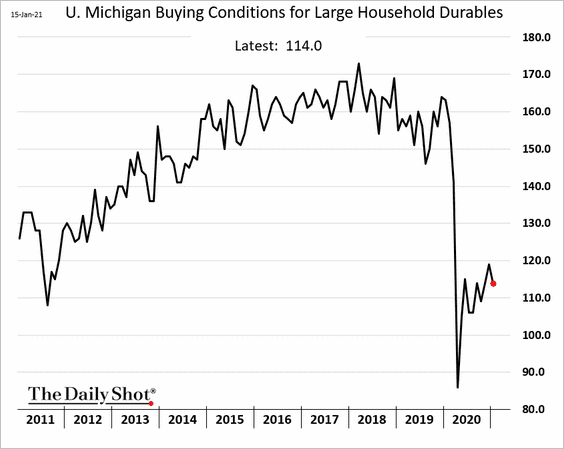
2. The U. Michigan consumer sentiment index declined this month.
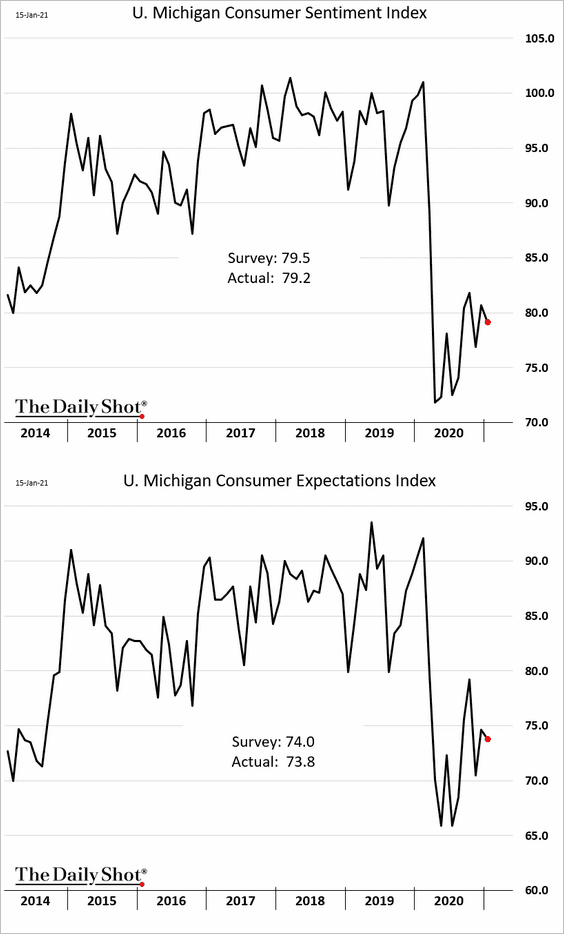
• Americans are concerned about their financial situation.
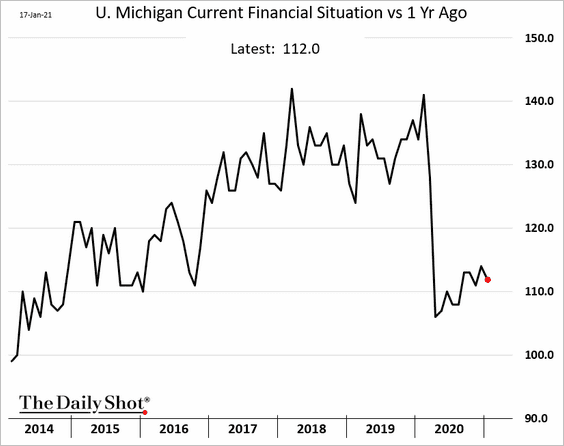
• This index shows buying conditions for large household items.
• The Republican-Democrat expectations gap continues to widen.
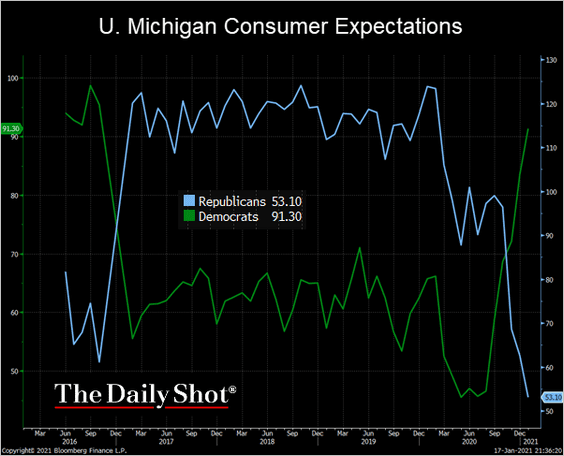 Source: @TheTerminal, Bloomberg Finance L.P.
——————–
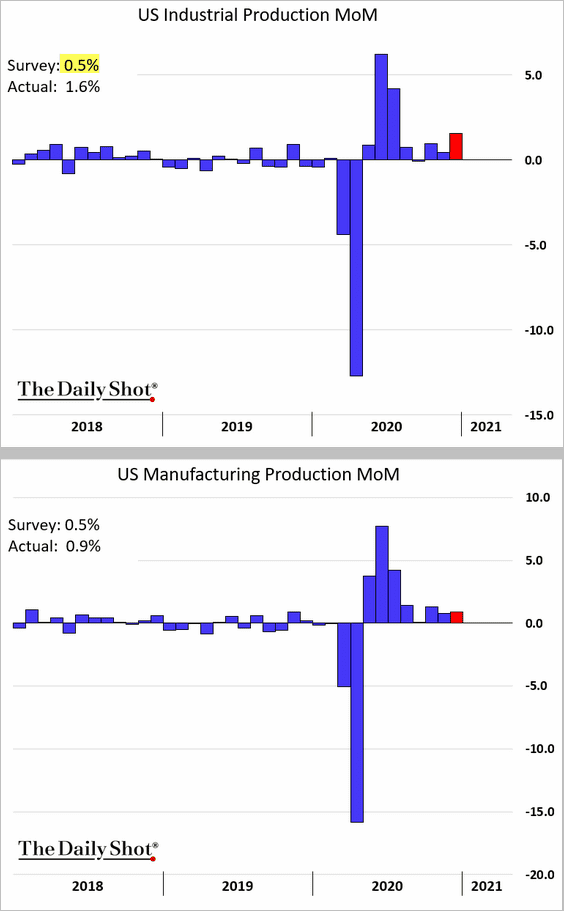
3. Industrial production topped economists’ forecasts. Manufacturing has been resilient in the face of the pandemic.
• Here is the breakdown by sector.
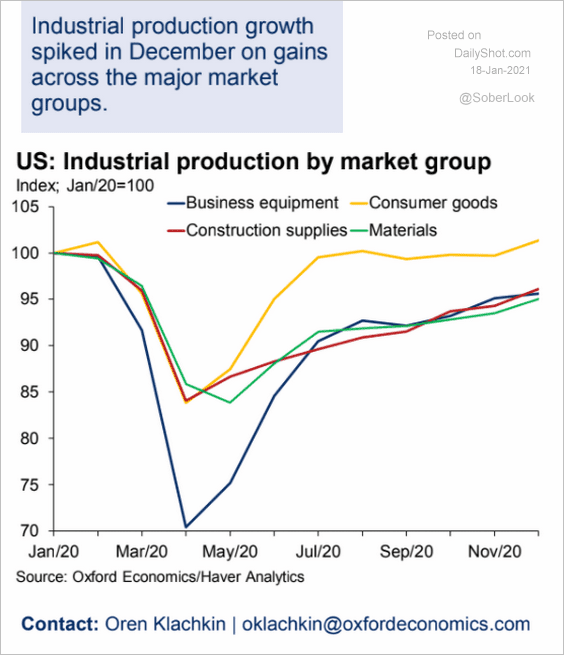 Source: Oxford Economics
• And this chart compares the current trend with 2008.
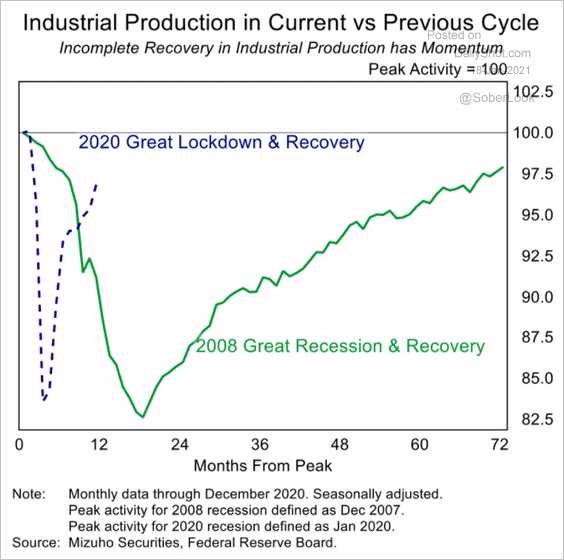 Source: Mizuho Securities USA
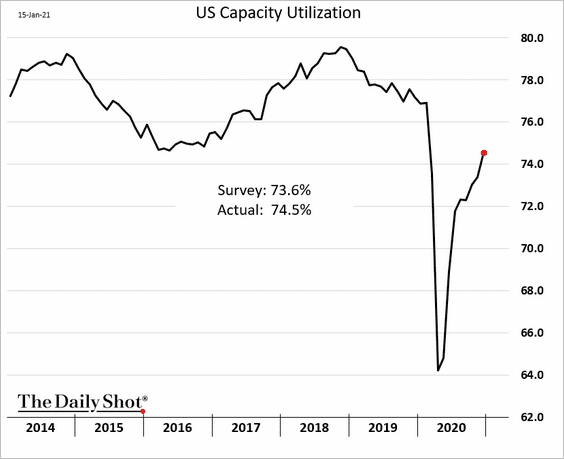
• Capacity utilization continues to improve.
——————–
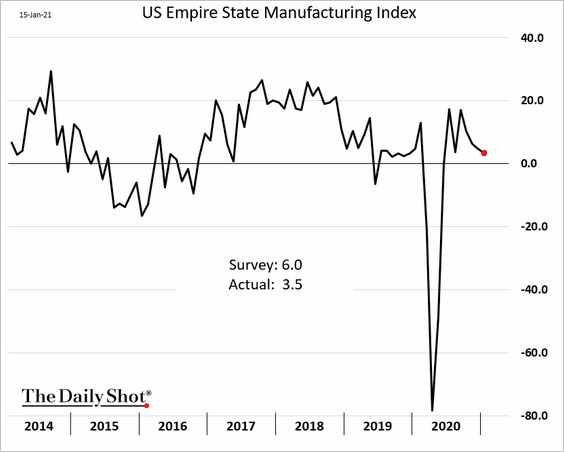
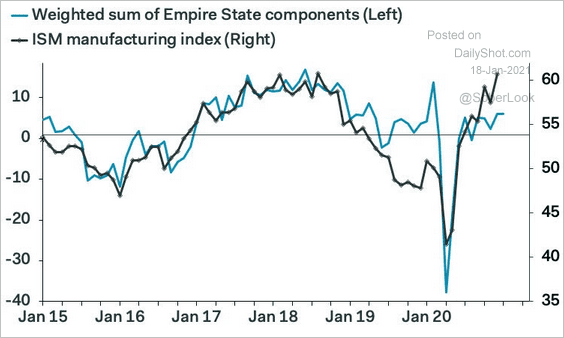
4. The NY Fed’s regional manufacturing index (Empire Manufacturing) showed lackluster growth this month.
Here is the Empire Manufacturing vs. the ISM (national level).
 Source: Pantheon Macroeconomics
——————–
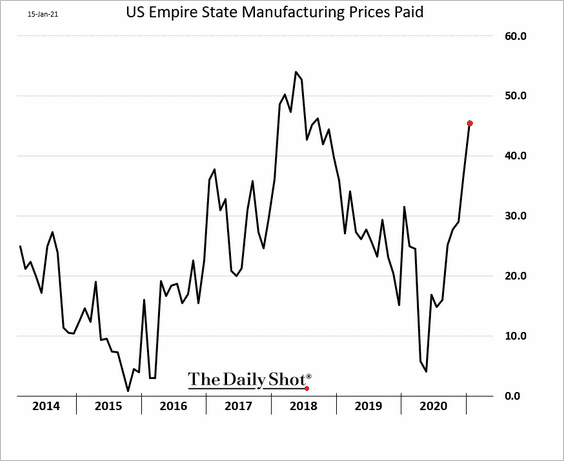
5. Next, we have some updates on inflation.
• The Empire Manufacturing index of factory input costs is rising rapidly.
• A similar index at the national level (ISM Manufacturing Prices) points to higher consumer inflation ahead.
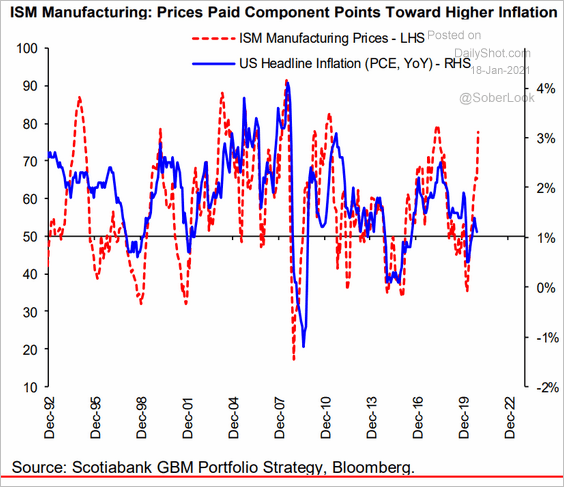 Source: Hugo Ste-Marie, Portfolio & Quantitative Strategy Global Equity Research, Scotia Capital
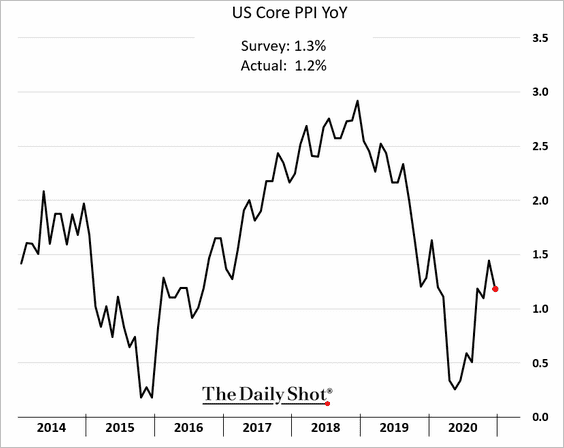
• The core PPI declined last month.
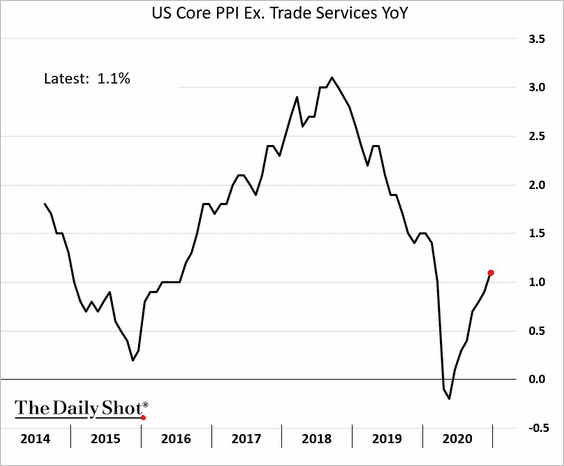
However, excluding the volatile “trade services” component (business markups), producer price inflation continues to recover.
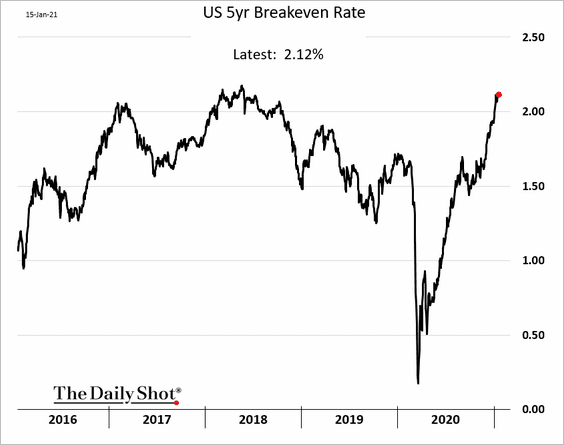
• Market-based inflation expectations keep grinding higher.
——————–
6. According to the Evercore ISI Company Survey, business inventories remain exceptionally low.
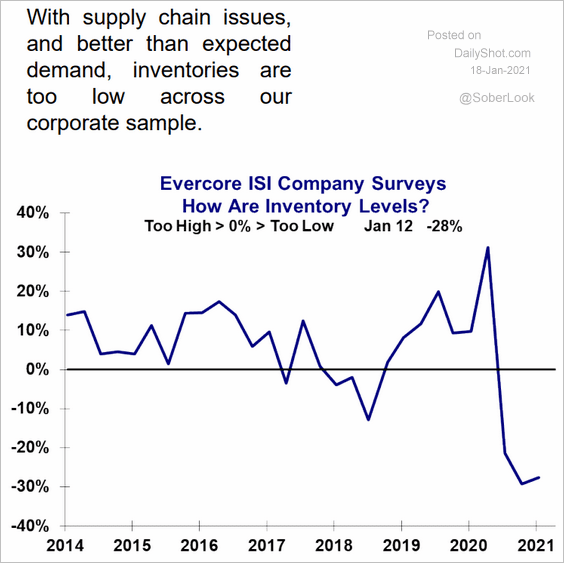 Source: Evercore ISI
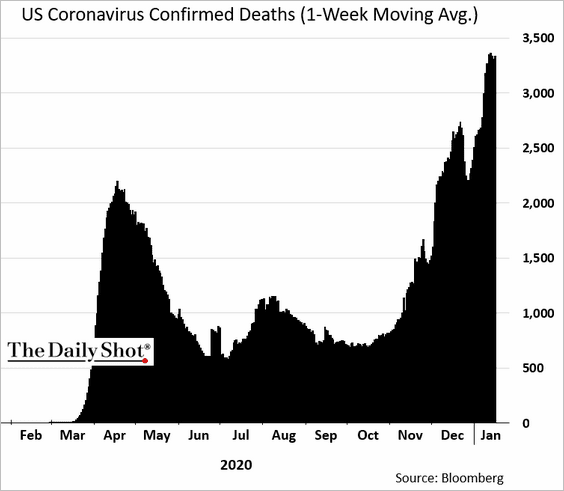
7. US COVID-related fatalities are holding above 3,000 per day. The nation needs to accelerate the pace of vaccinations.
Back to Index
The United Kingdom
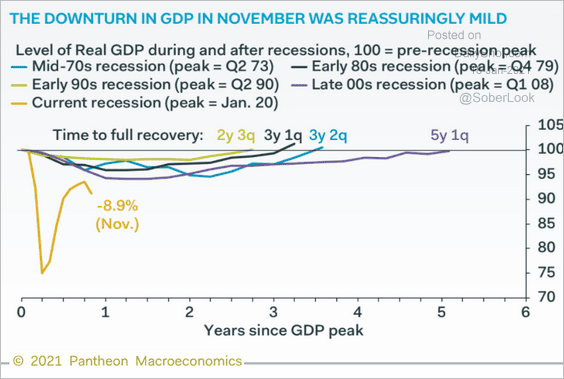
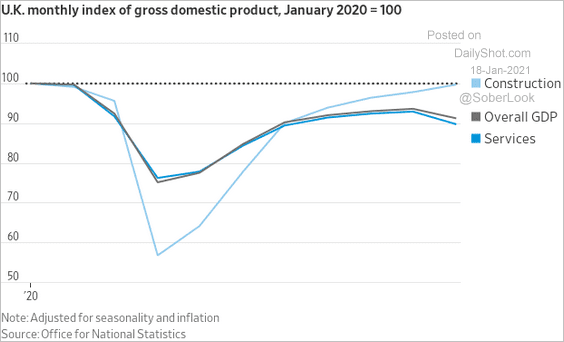
1. The November GDP decline was less severe than expected.
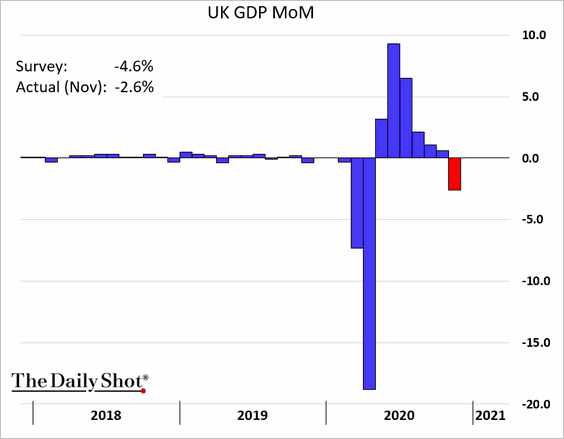
Here is a comparison to previous downturns.
 Source: Pantheon Macroeconomics
And this is the breakdown by sector.
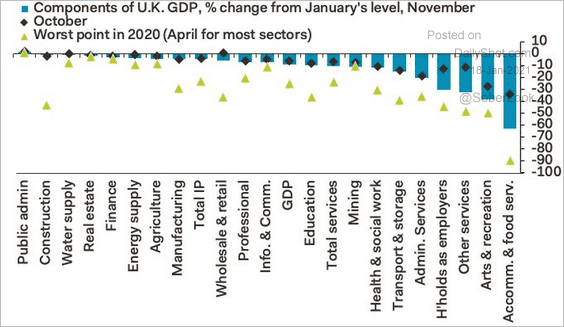 Source: @samueltombs
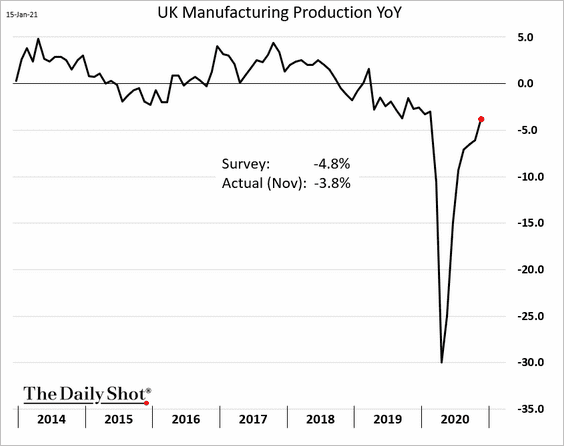
• Manufacturing output continued its recovery.
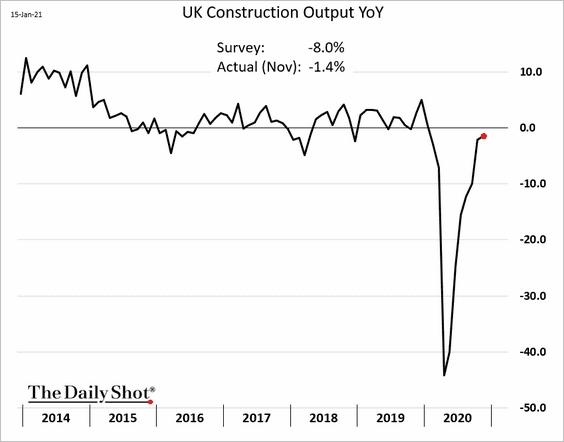
• Construction activity has almost fully rebounded.
• Services have been lagging the overall GDP recovery.
 Source: @jeffsparshott
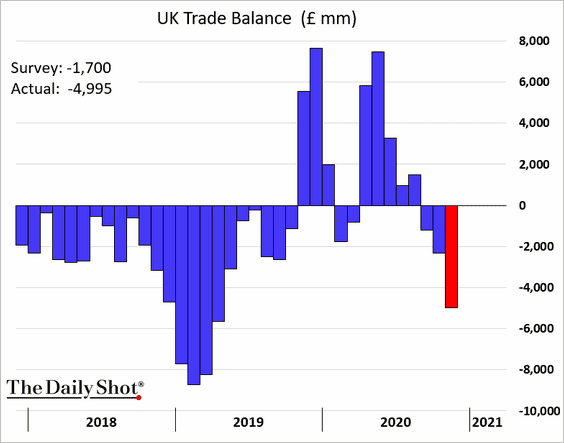
• The UK trade balance is back in deficit.
——————–
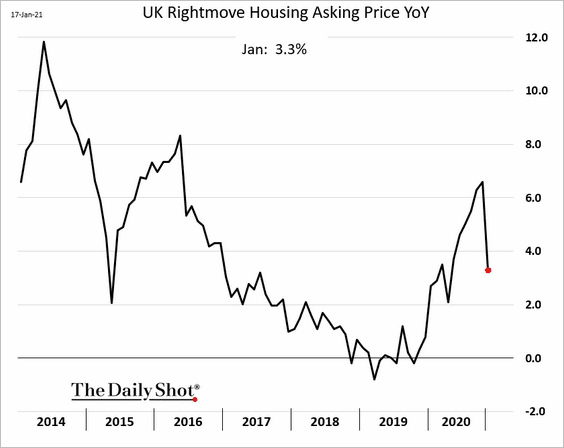
2. Housing asking prices dipped this month.
 Source: Reuters Read full article
——————–
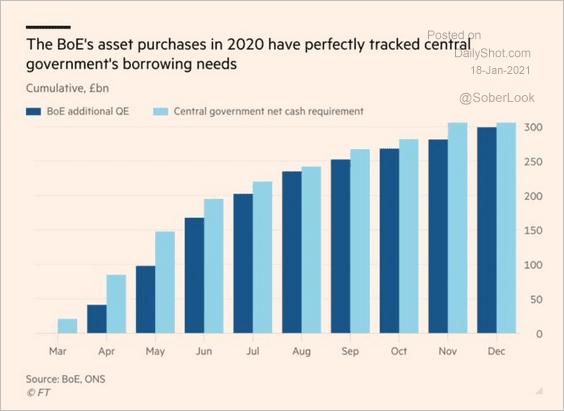
3. Here is the Modern Monetary Theory at work.
 Source: @adam_tooze, @bankofengland Read full article
4. The number of foreign-born workers who left the UK could be larger than earlier estimates suggest.
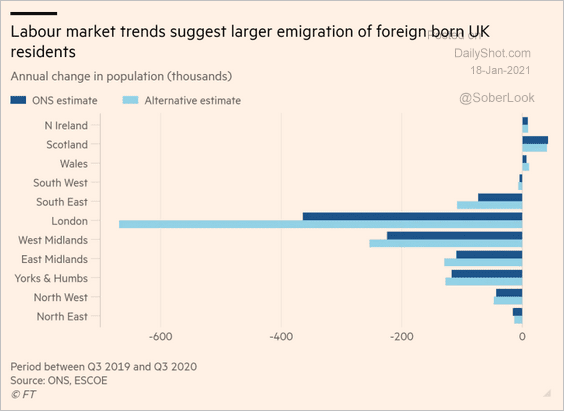 Source: @financialtimes Read full article
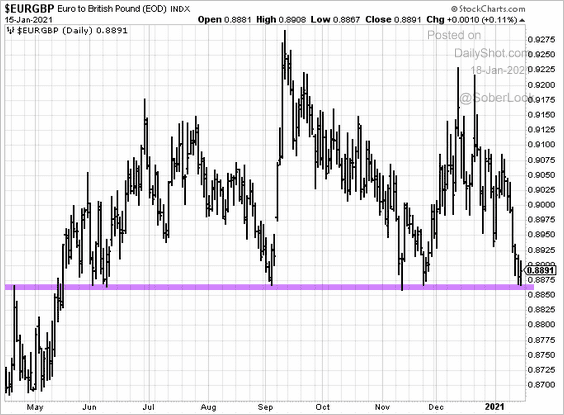
5. EUR/GBP is at support amid concerns about the political situation in Italy.
Back to Index
The Eurozone
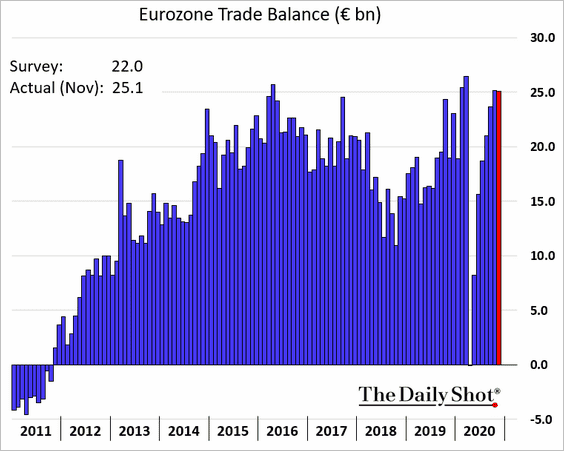
1. The trade surplus surprised to the upside.
But given the euro’s recent strength, that’s unlikely to last.
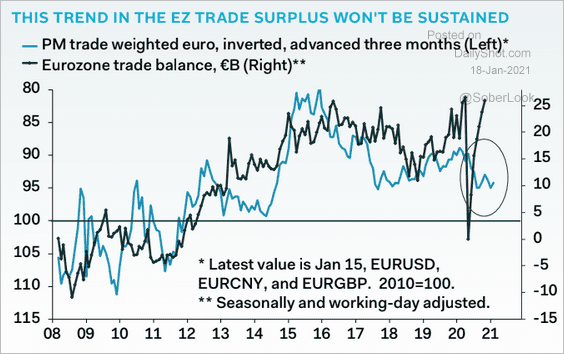 Source: Pantheon Macroeconomics
The overall trade activity has been recovering.
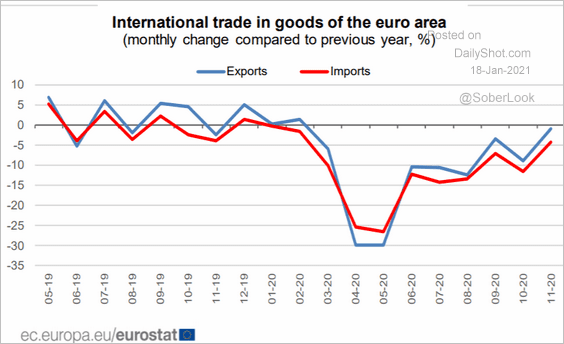 Source: Eurostat Read full article
——————–
2. Italy’s GDP contracted again in Q4 and will see another decline this quarter, according to Prometeia.
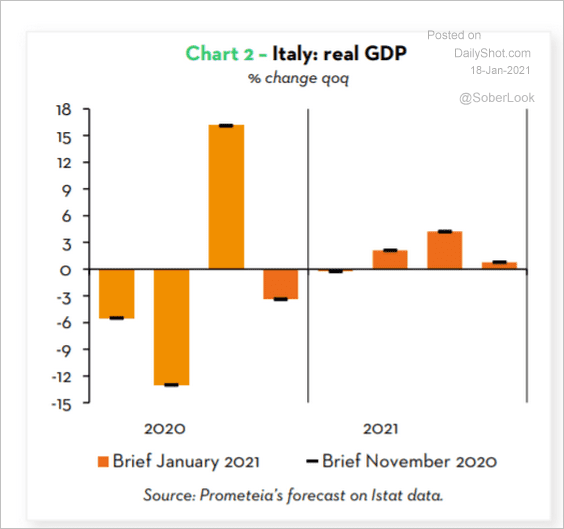 Source: Prometeia
Italy’s household savings rate remains elevated.
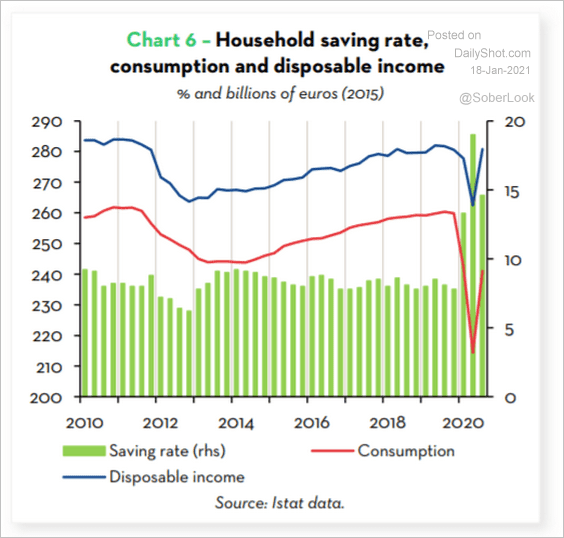 Source: Prometeia
——————–
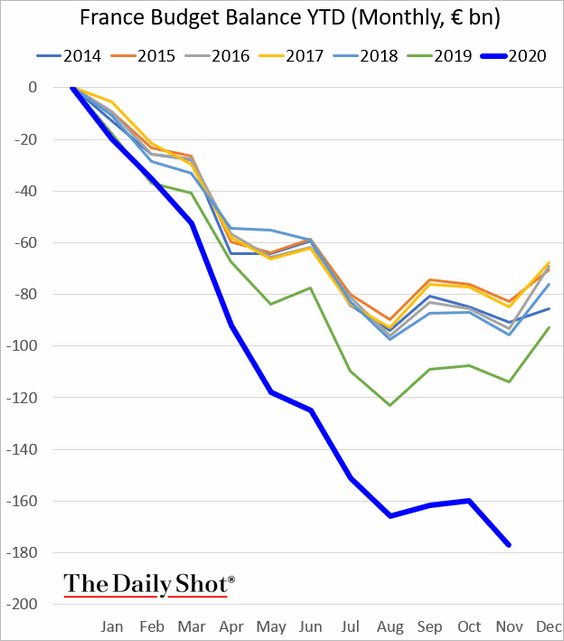
3. French budget deficit continues to widen.
4. The post-holiday return to workplaces has been slow.
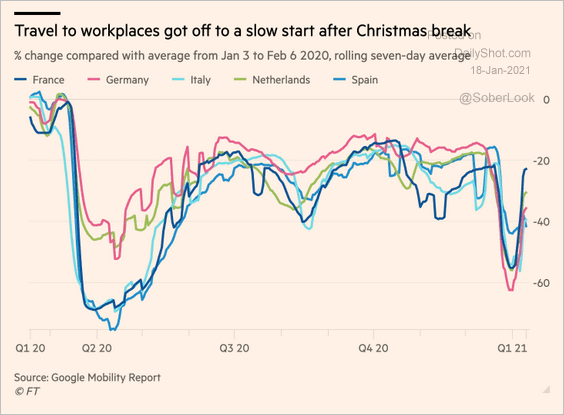 Source: @financialtimes Read full article
Back to Index
Europe
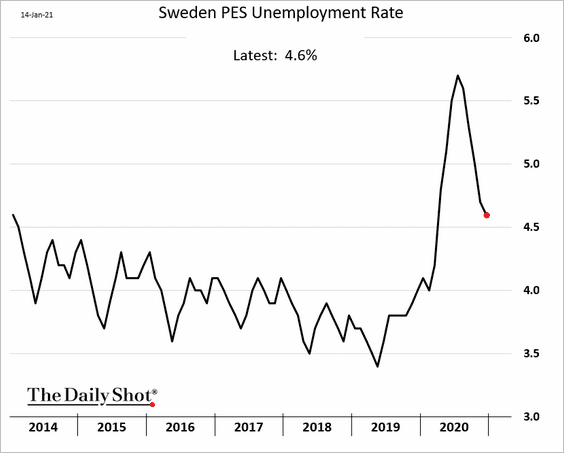
1. Sweden’s labor market continues to recover.
2. Swiss real estate funds are trading at a record premium to NAV. A bubble?
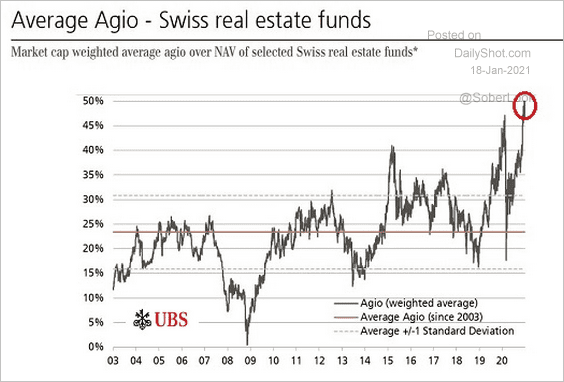 Source: UBS, @RMKOutFront
3. Below are a couple of trends in the EU’s labor markets.
• Employment by age group:
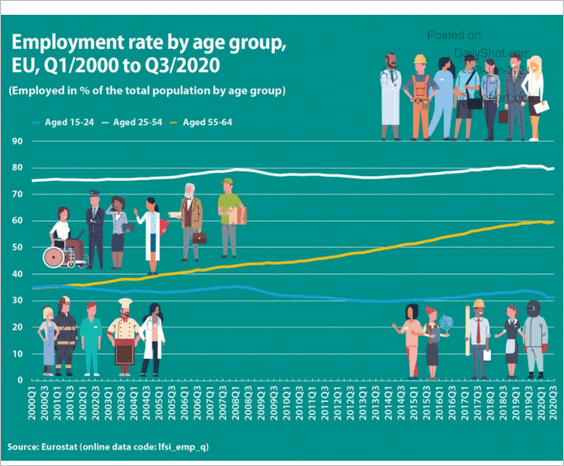 Source: Eurostat Read full article
• Employment changes by occupation (“elementary” = “cleaners, helpers, labourers in construction and manufacturing, etc.”)
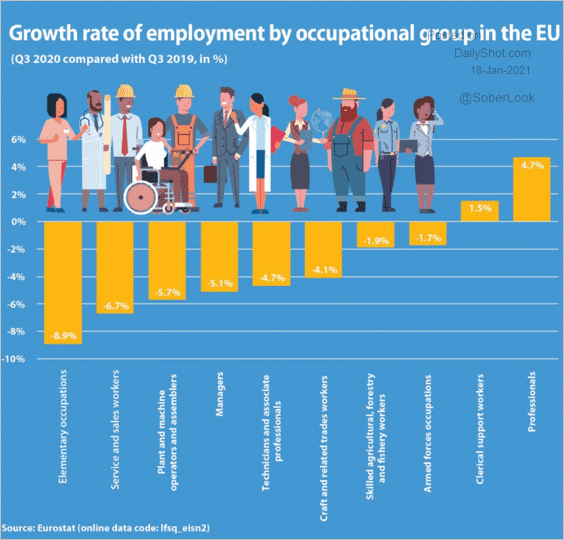 Source: Eurostat Read full article
Back to Index
China
1. The Q4 GDP growth surprised to the upside.
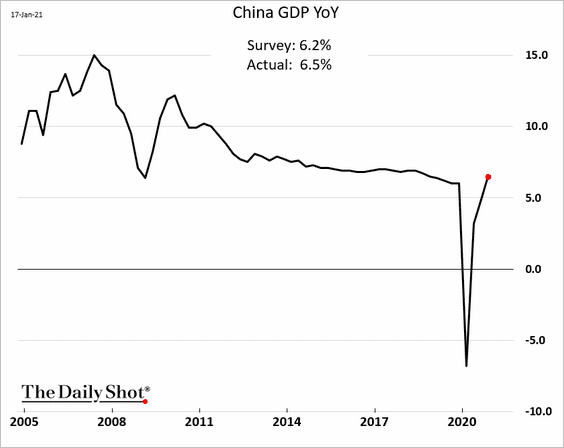
China is the only large economy with positive GDP growth in 2020 (full year).
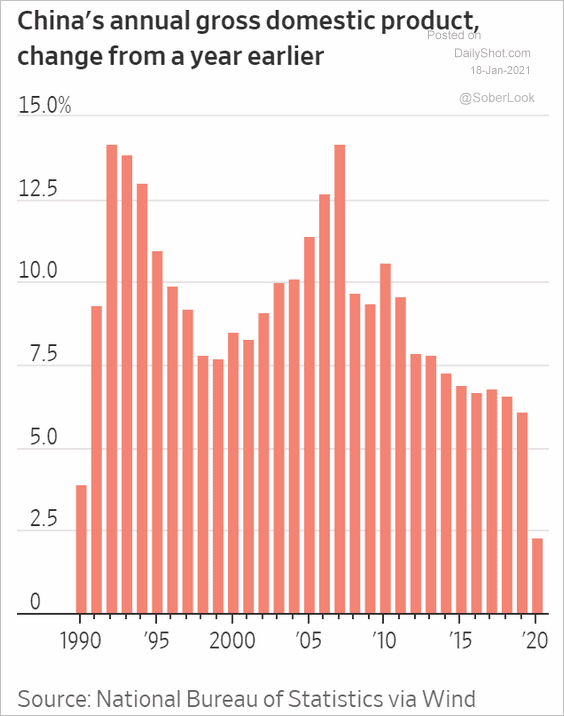 Source: @WSJ Read full article
——————–
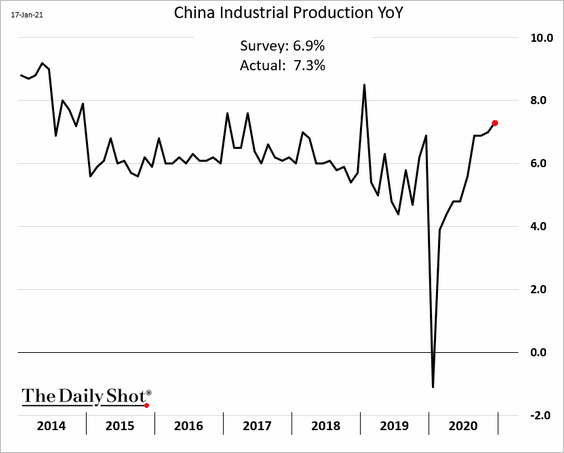
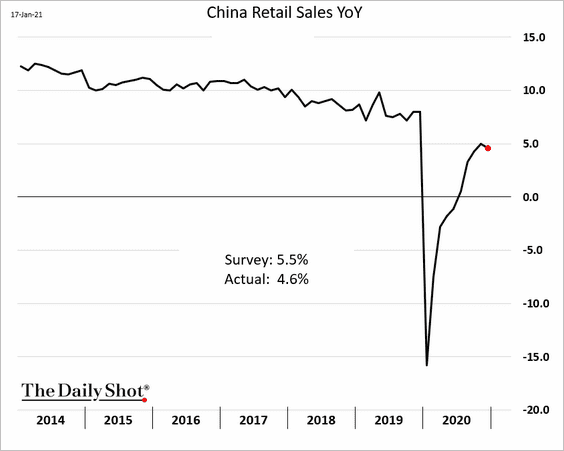
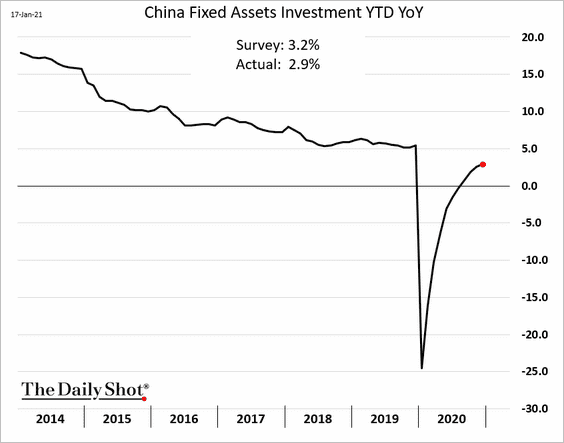
2. Here are the key monthly indicators (through December).
• Industrial production (above expectations):
• Retail sales (below expectations):
• Fixed-asset investment:
Back to Index
Emerging Markets
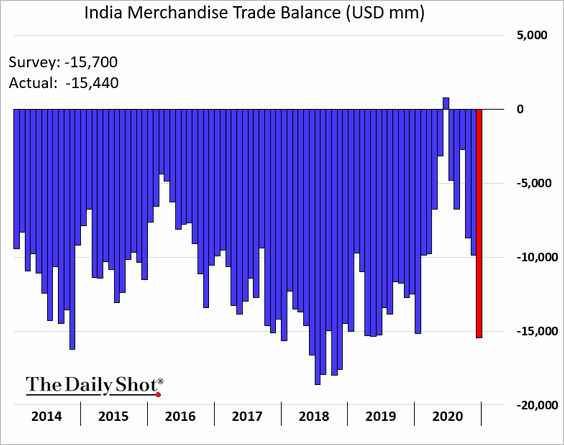
1. India’s trade deficit is widening again as domestic demand picks up.
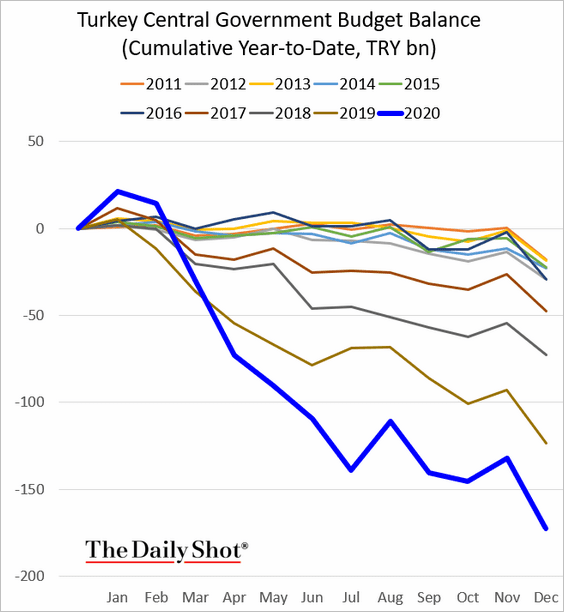
2. Turkey’s budget deficit was deteriorating well before the pandemic.
3. Israel remains in deflation.
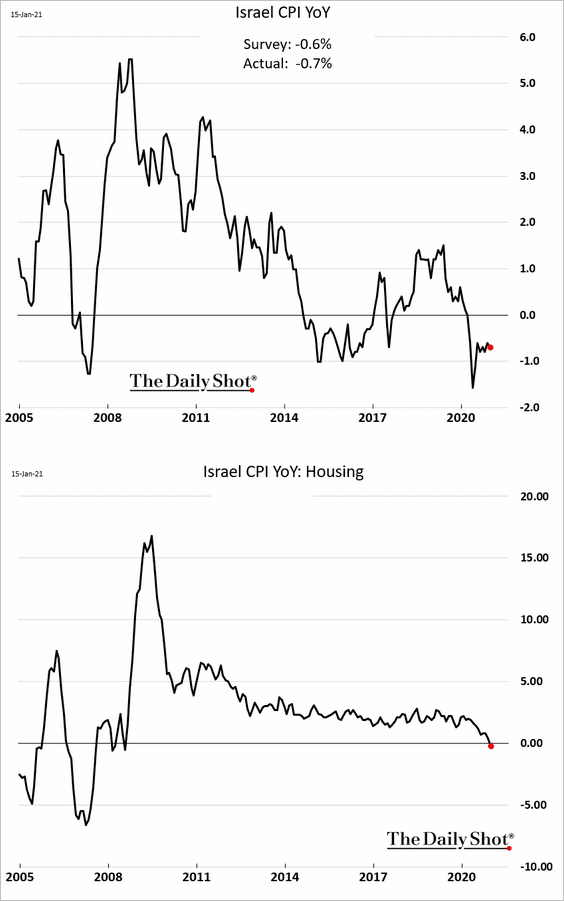
Separately, the rapid pace of vaccinations boosted Israel’s stocks.
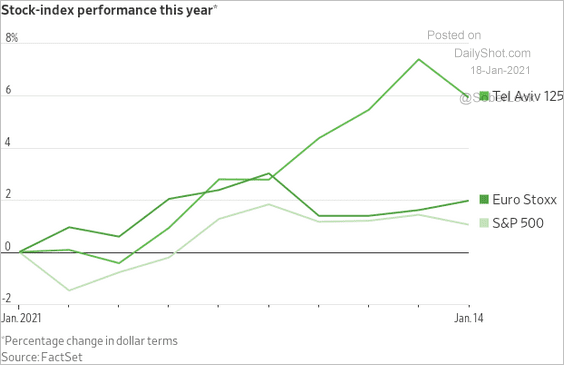 Source: @WSJ Read full article
——————–
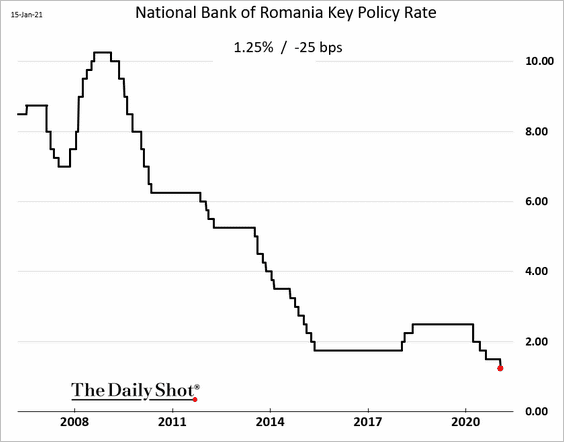
4. Romania’s central bank cut rates again. But monetary easing may be coming to an end across EM.
5. Brazil’s spectacular retail sales rebound is likely to slow in the months ahead.
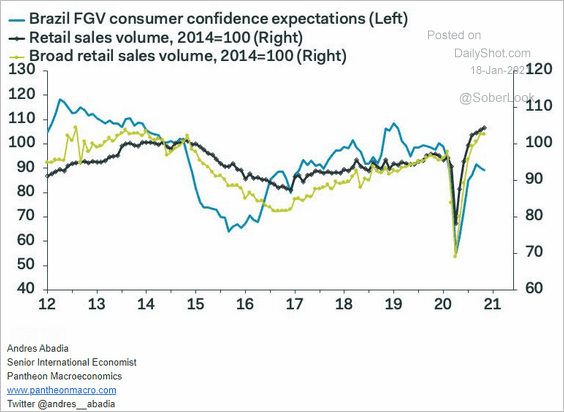 Source: Pantheon Macroeconomics
Back to Index
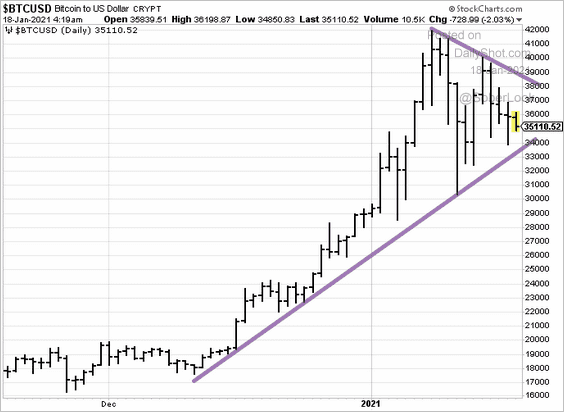
Cryptocurrency
Bitcoin is consolidating.
Back to Index
Commodities
1. Commodities had an impressive run since last March.
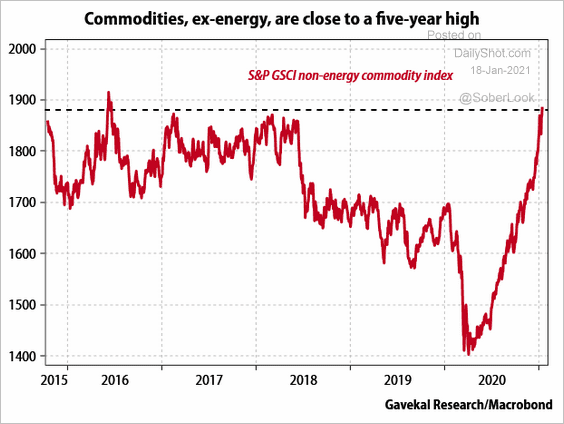 Source: Gavekal Research
2. Global copper inventories continue to shrink.
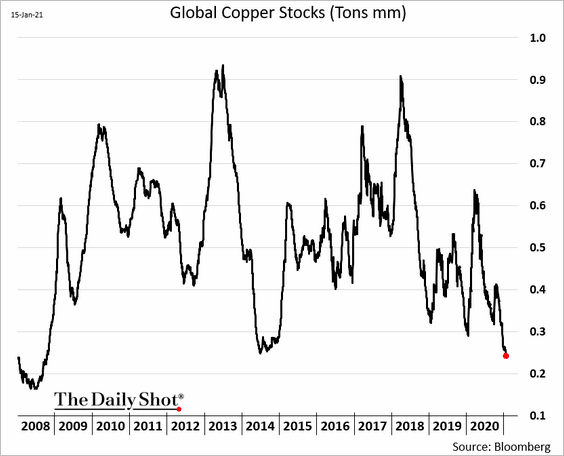 h/t Winnie Zhu
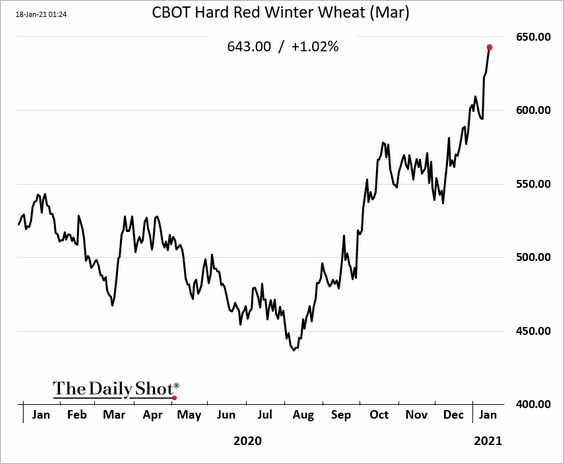
3. Wheat prices are soaring.
 Source: Reuters Read full article
Back to Index
Equities
1. The S&P 500’s deviation from its 200-day moving average is at extreme levels.
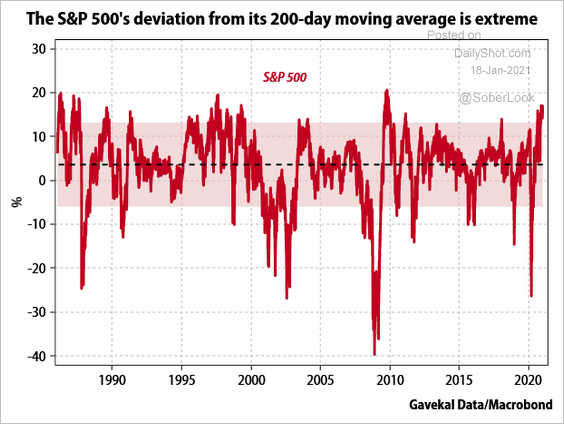 Source: Gavekal Research
2. The US equity outperformance vs. global markets is inconsistent with the US dollar weakness.
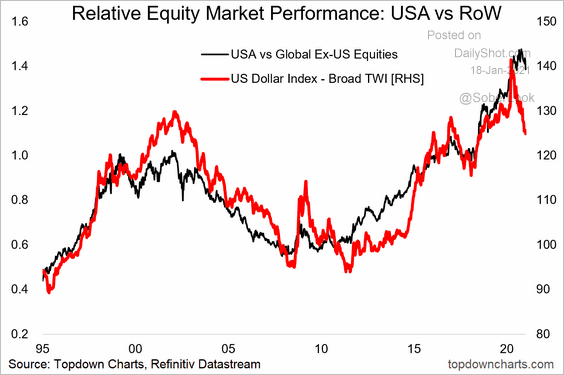 Source: @topdowncharts Read full article
3. The Bespoke Investment’s “ludicrous” indicator counts the number of companies with a market cap of $0.5bn or higher and a trailing price-to-sales of 10 or more that have doubled over the past three months. The index is extremely elevated but is still well below the dot-com highs.
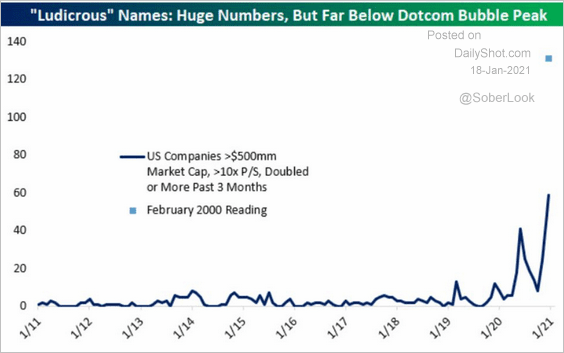 Source: @bespokeinvest, @johnauthers, @bopinion Read full article
By the way, we continue to get questions about the current investment environment’s similarities to 1999/2000. This short video provides a good example.
——————–
4. The penny-stock market has been hot – flooded by retail investors and inspired by online investment chat groups.
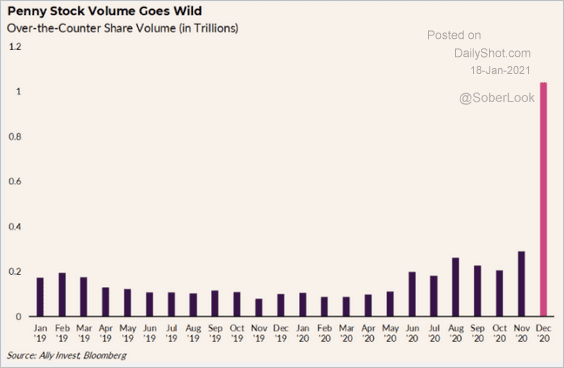 Source: @Ally Read full article
Dealers have been enjoying all the flow (with some hedge funds front-running retail trades).
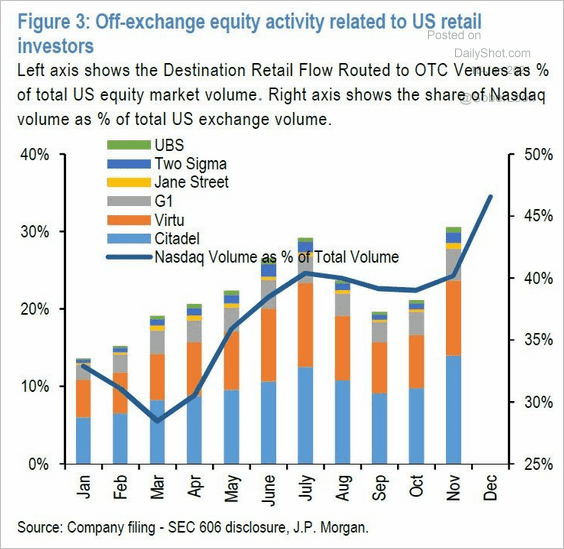 Source: JP Morgan, Tilo Marotz
——————–
5. As discussed previously, dealers’ gamma exposure is extremely elevated.
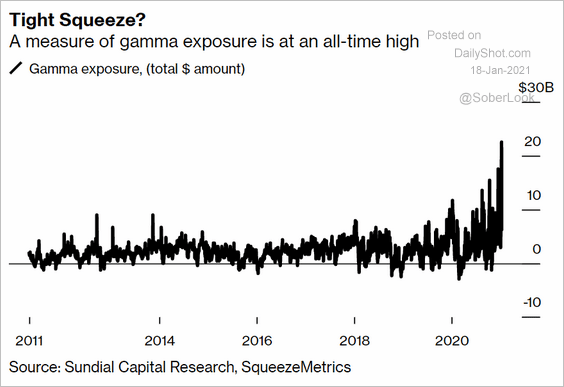 Source: @markets Read full article
 Source: @lebas_janney
Back to Index
Credit
1. Leveraged loans have outperformed this month.
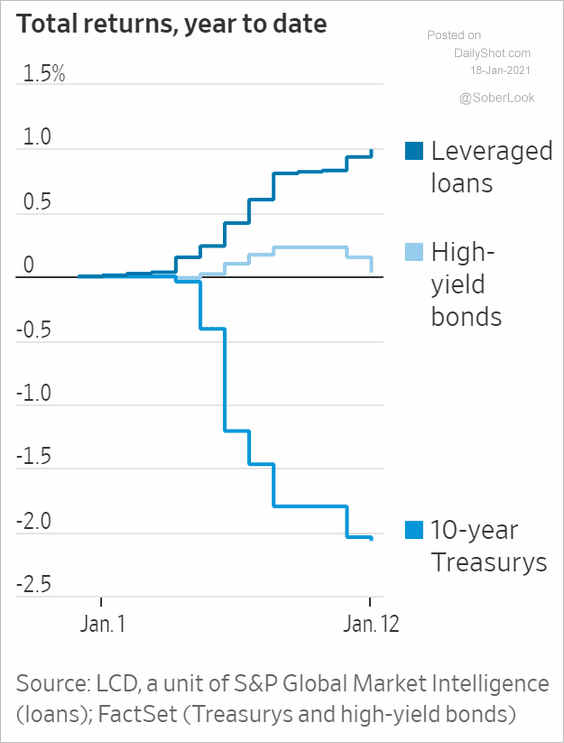 Source: @WSJ Read full article
2. Here is a look at relative value across US investment-grade bond sectors.
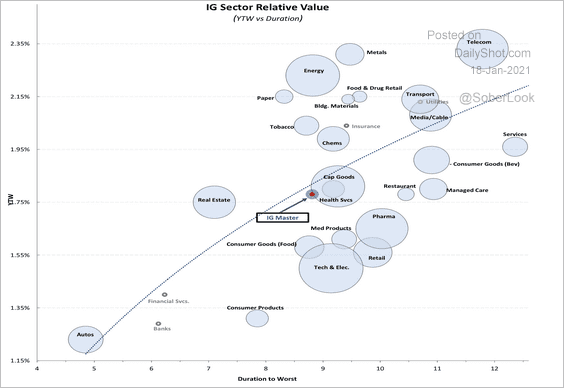 Source: Mizuho Securities USA
3. US bankruptcy filings remain relatively low.
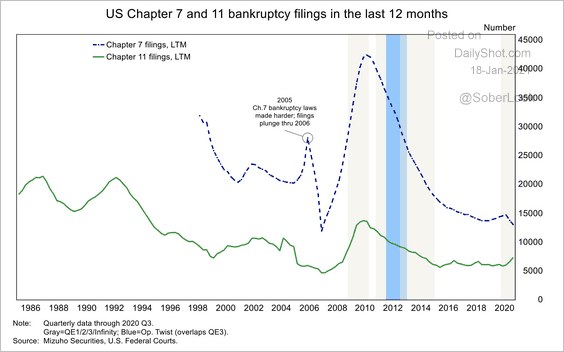 Source: Mizuho Securities USA
4. Below is the number of large companies’ defaults by year.
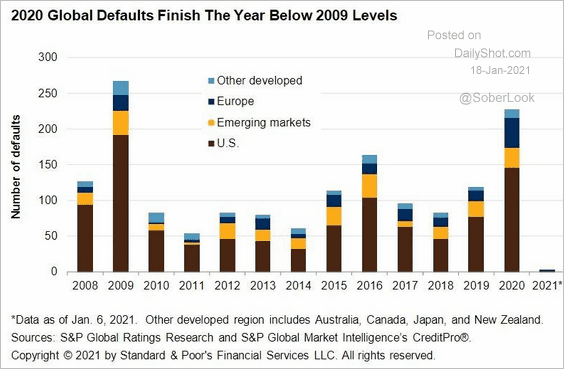 Source: @lcdnews Read full article
5. Insurers’ investment portfolio yields have been declining with Treasury yields.
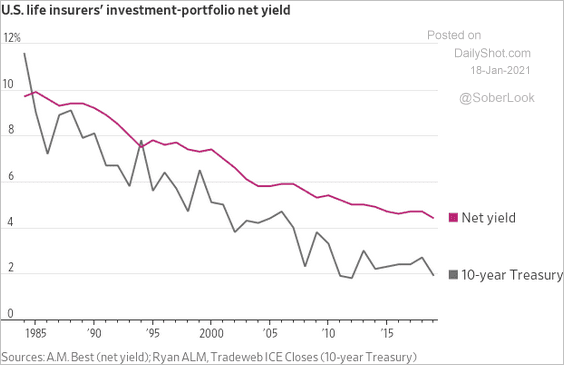 Source: @WSJ Read full article
6. This chart shows US banks’ interest margin over the past decade.
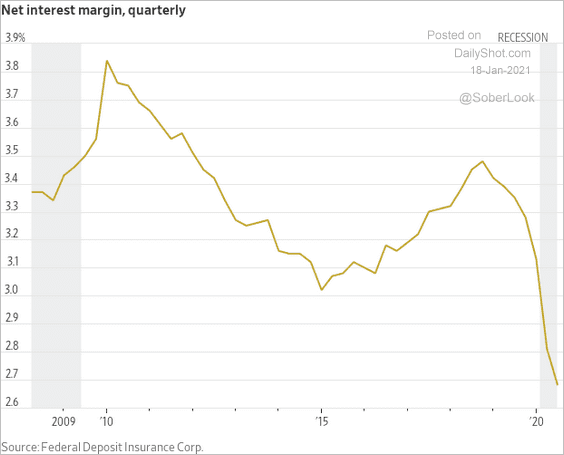 Source: @WSJ Read full article
Back to Index
Rates
1. Let’s start with this long-term chart of Treasury yields.
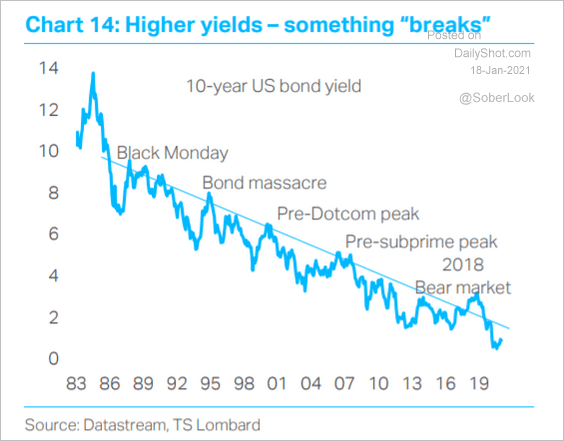 Source: TS Lombard
2. What are the drivers of this year’s jump in Treasury yields?
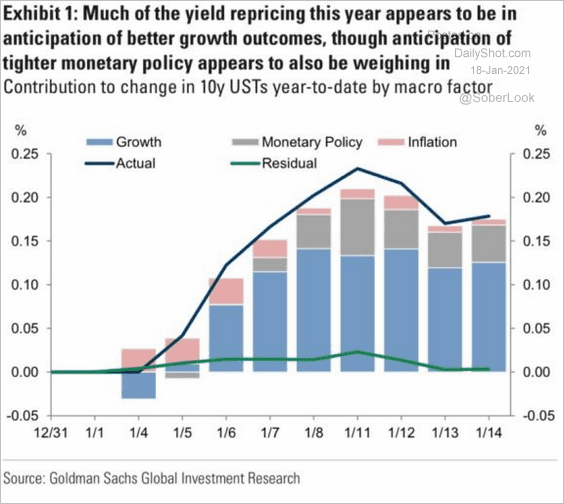 Source: Goldman Sachs
3. Both US term premium and breakevens are above Deutsche Bank’s model estimates.
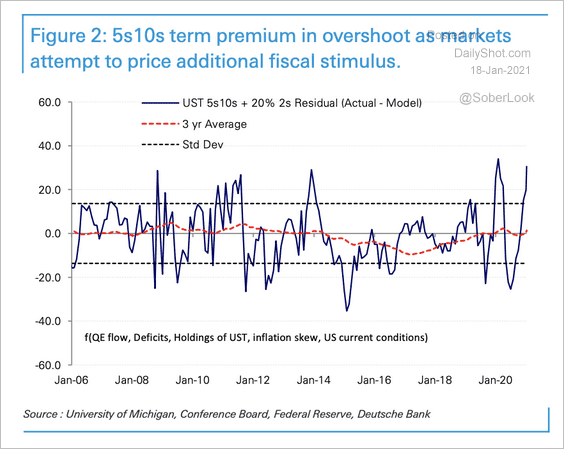 Source: Deutsche Bank Research
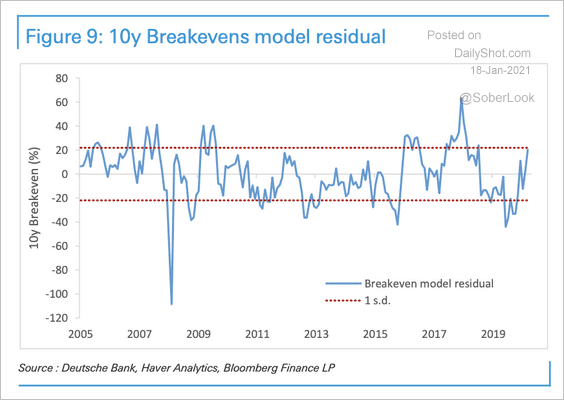 Source: Deutsche Bank Research
——————–
4. This chart shows the weighted average maturity (WAM) of Treasury holdings. Last year’s massive bill issuance pushed WAM lower.
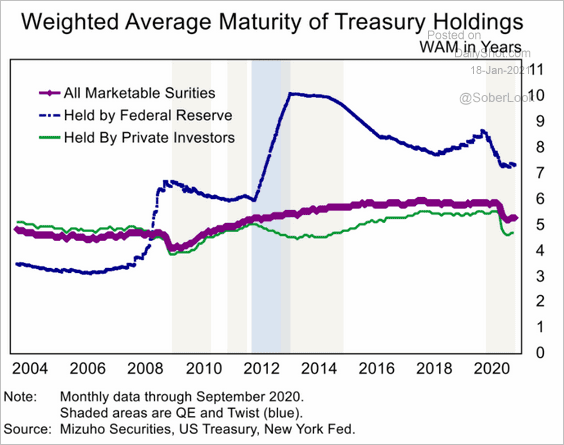 Source: Mizuho Securities USA
5. Below are a couple of charts showing central banks’ government bond holdings.
• Total holdings:
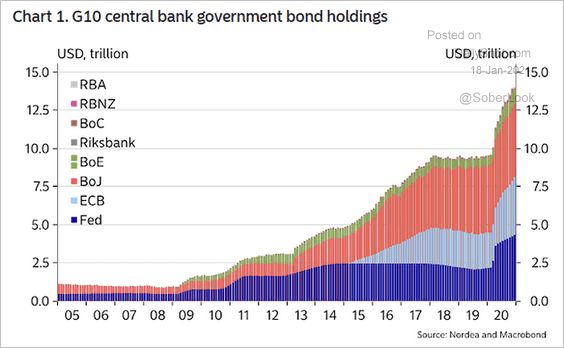 Source: @ISABELNET_SA, @NordeaMarkets
• Percent of eligible securities:
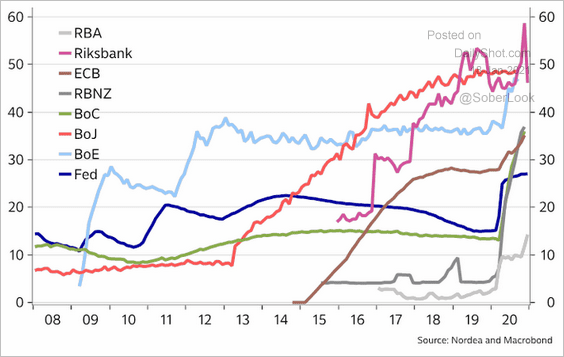 Source: Nordea Markets
——————–
Food for Thought
1. Big tech’s revenues by region:
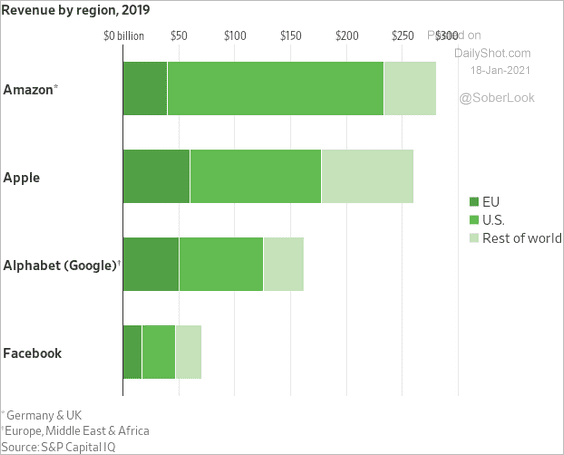 Source: @WSJ Read full article
2. Battery storage costs:
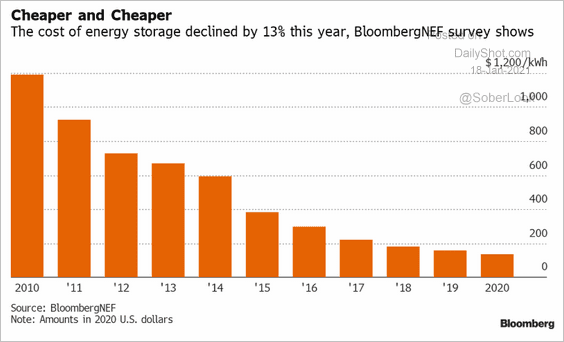 Source: Richard Stubbe, @TheTerminal, Bloomberg Finance L.P.
3. Total US election costs:
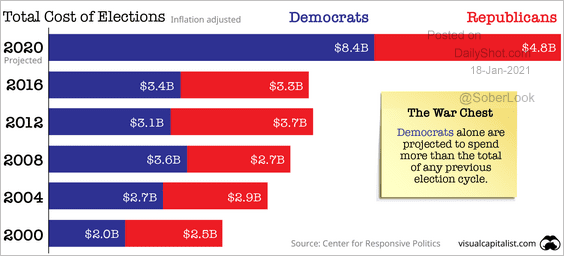 Source: Visual Capitalist Read full article
4. How the news media has been describing the US Capitol attack:
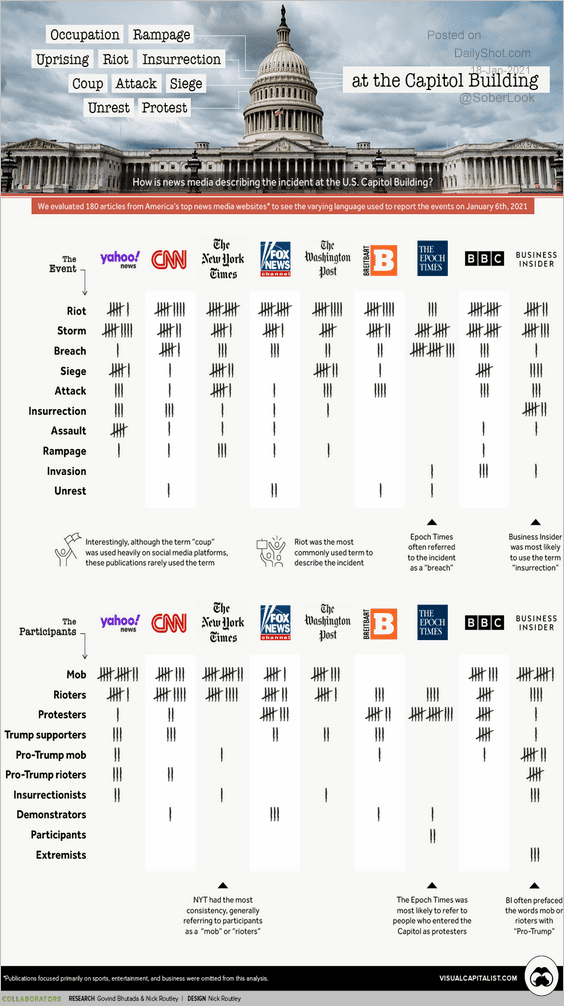 Source: Visual Capitalist Read full article
5. Social media engagements with US legislators:
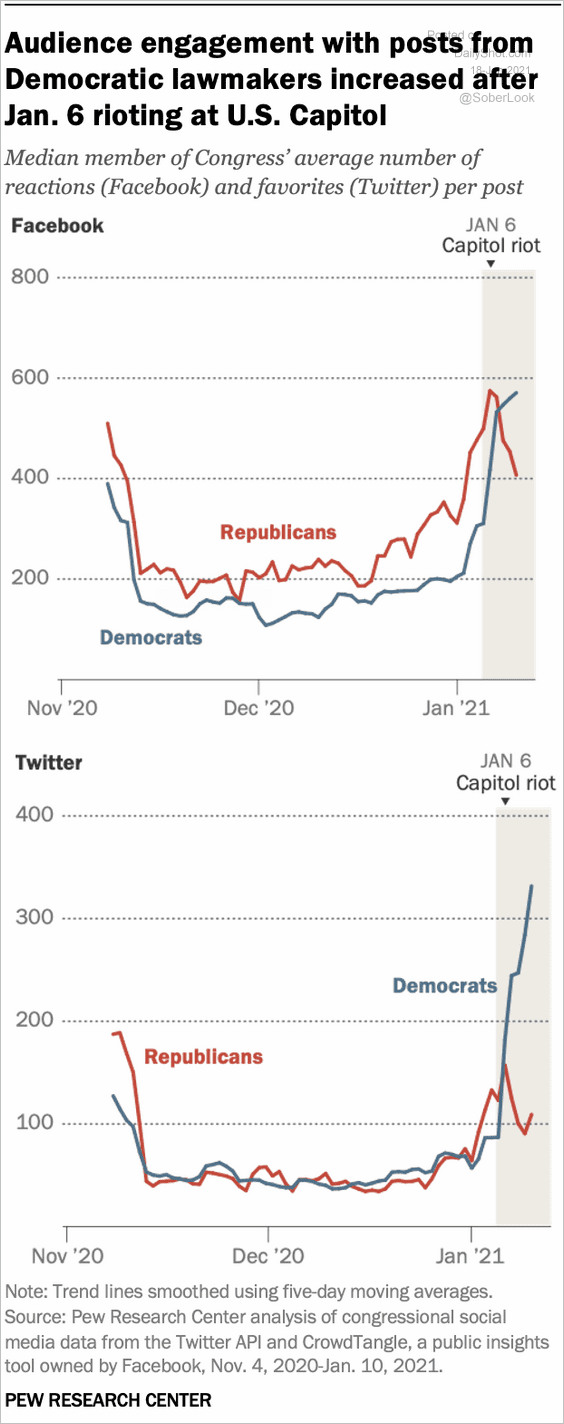 Source: Pew Research Center Read full article
6. US federal executions:
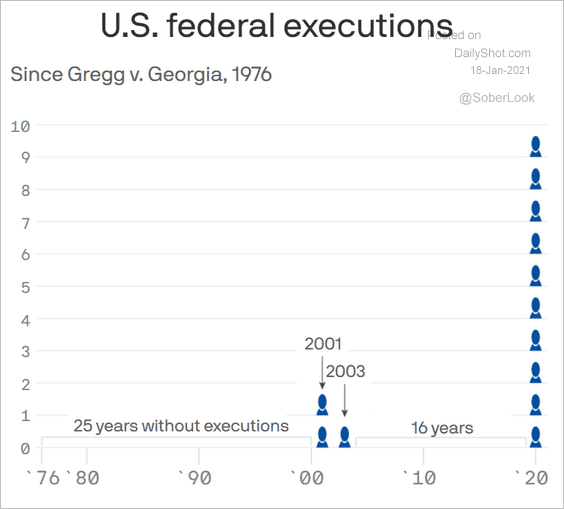 Source: @axios Read full article
7. Origins of the global refugee population:
 Source: Statista
8. Excess deaths in the US:
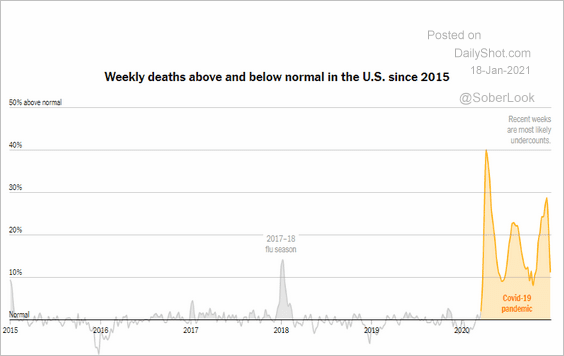 Source: The New York Times Read full article
9. Russia’s favorability ratings:
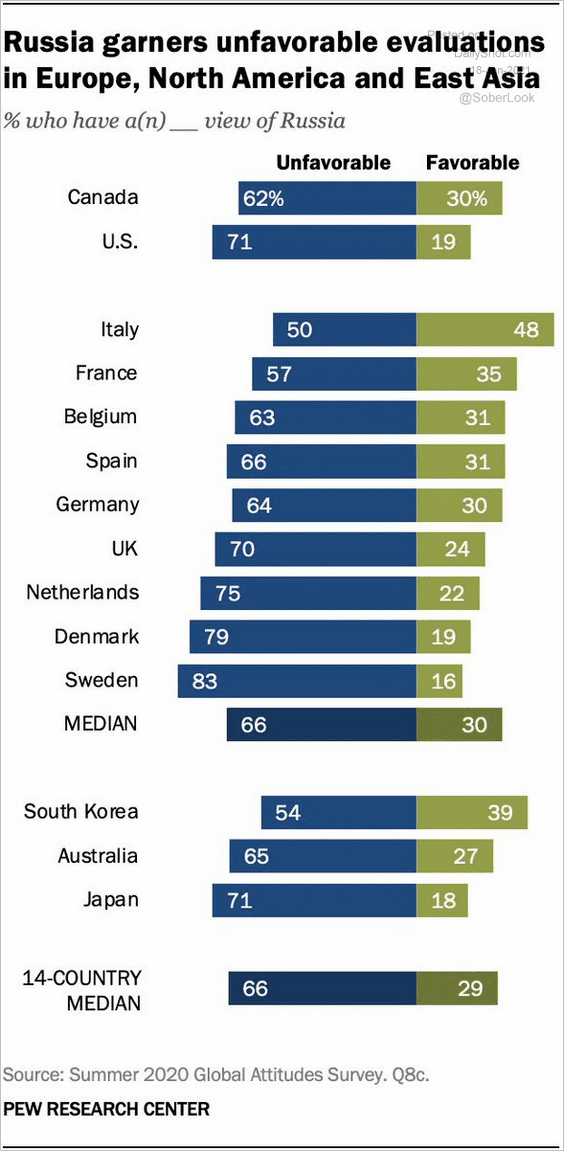 Source: @japoushter Read full article
10. Vegetables vs. Krispy Kreme:
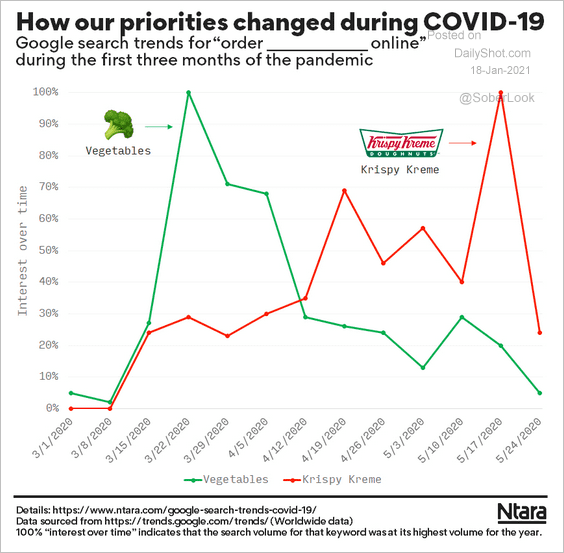 Source: Ntara, Data Is Beautiful
——————–

Back to Index