
The Daily Shot: 22-Feb-21
• Rates
• Credit
• Commodities
• Energy
• Equities
• Cryptocurrency
• Emerging Markets
• China
• Asia – Pacific
• The Eurozone
• The United Kingdom
• The United States
• Food for Thought
Rates
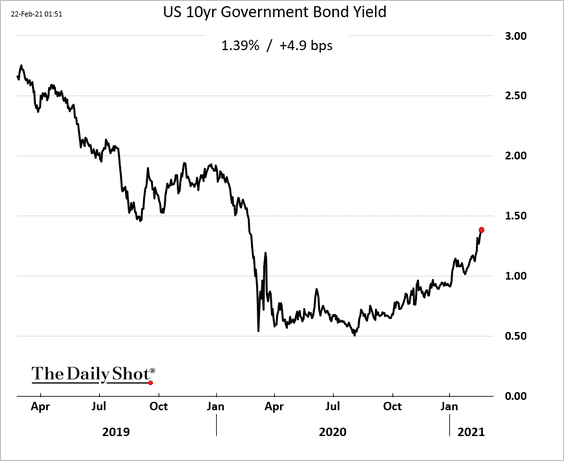
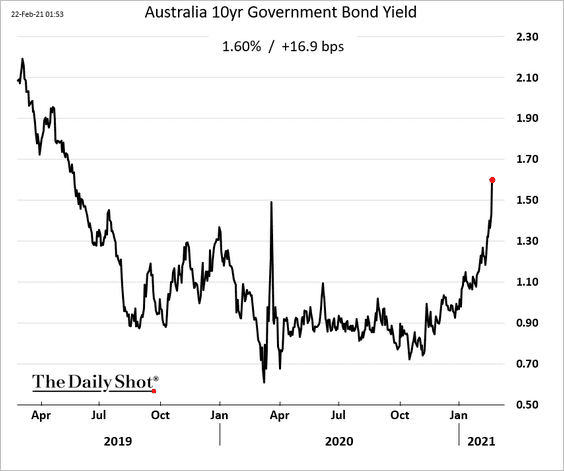
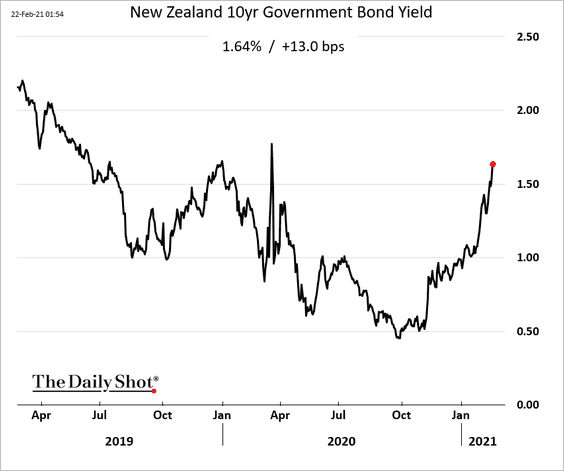
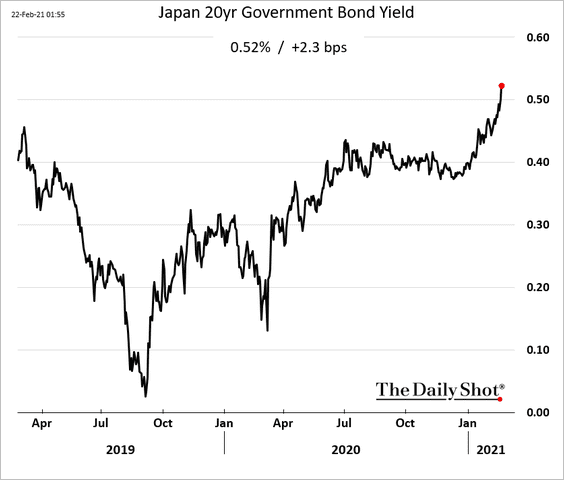
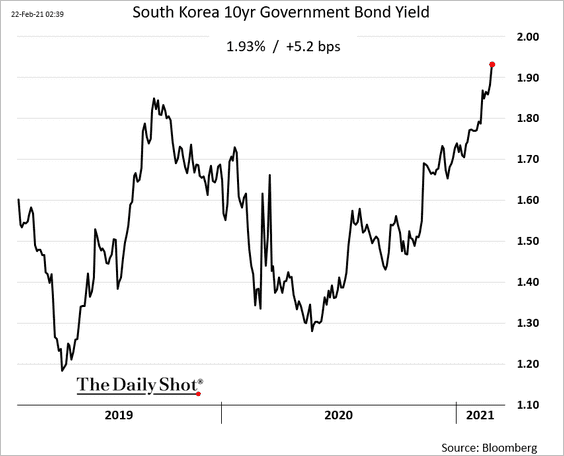
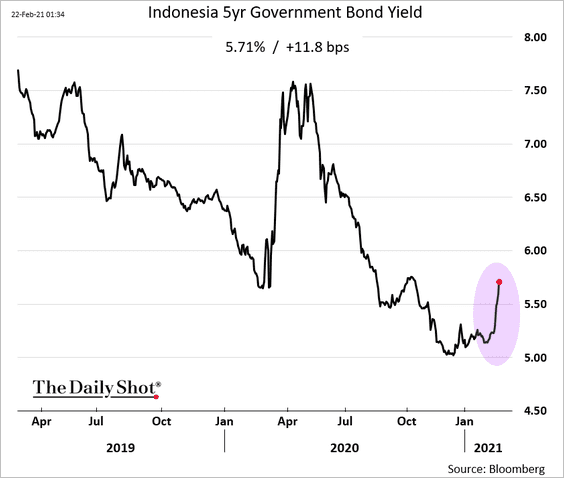
1. The global bond rout is picking up momentum. Most bond yields are still below 2019 levels but are rising quickly.
• The US:
• Australia and New Zealand:
• Japan:
• South Korea:
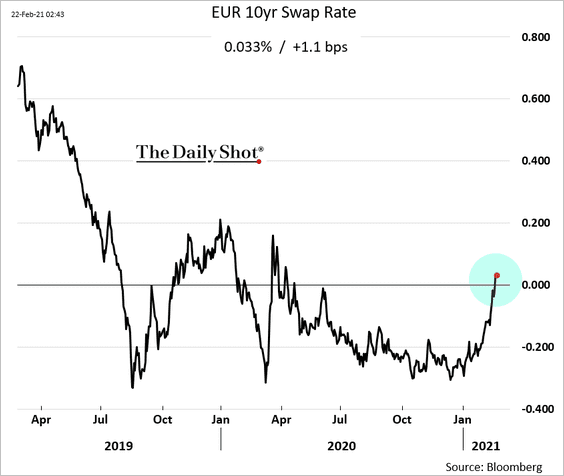
The euro 10yr swap rate moved into positive territory for the first time since April.
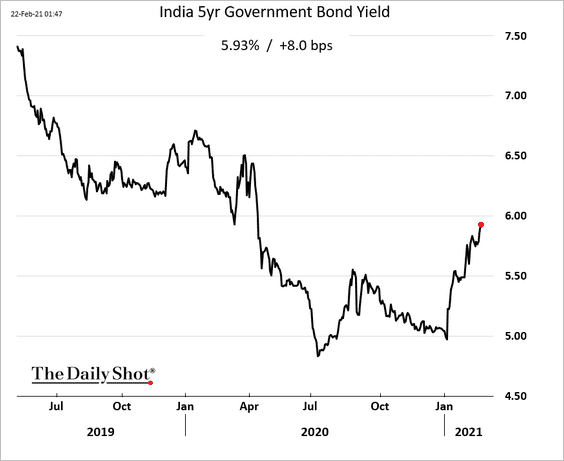
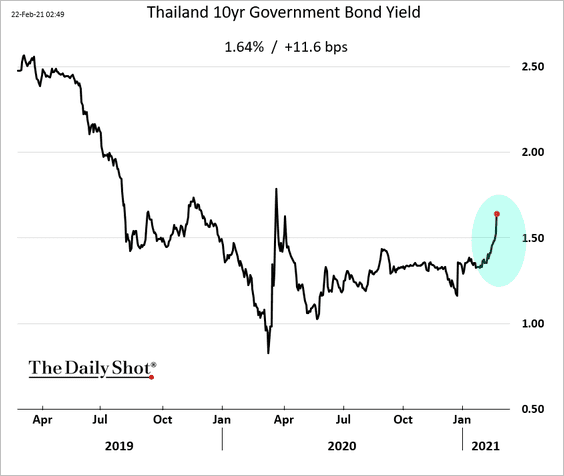
Emerging markets’ local-currency bonds are also selling off.
• India:
• Thailand:
• Indonesia:
——————–
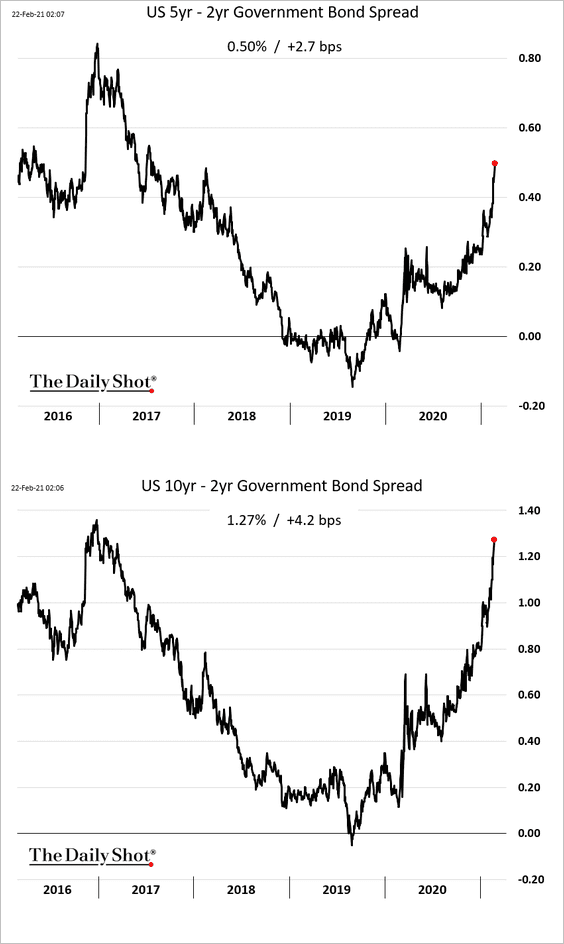
2. The Treasury curve continues to steepen.
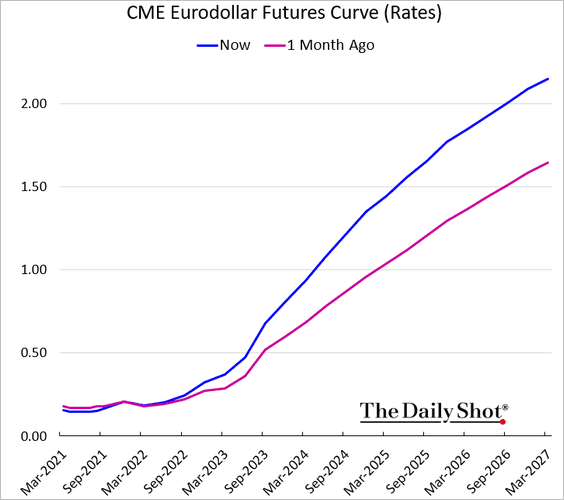
The market expects the Fed’s liftoff to start sooner, with hikes coming at a faster pace. The chart below shows rates implied by 3-month LIBOR futures (eurodollar futures).
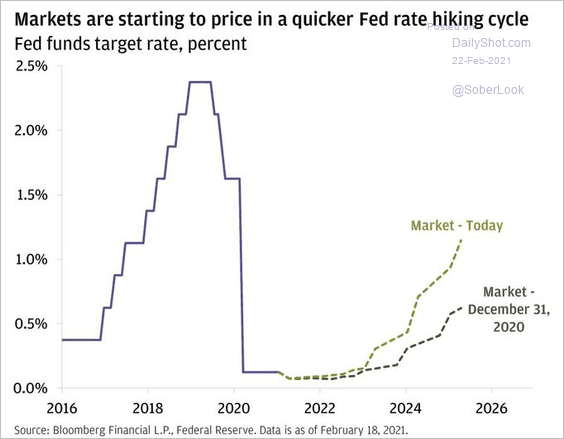
Here is the market’s projection for the fed funds rate.
 Source: @jsblokland
——————–
3. The recent yield increases are comparable to what we saw during the 2013 taper-tantrum.
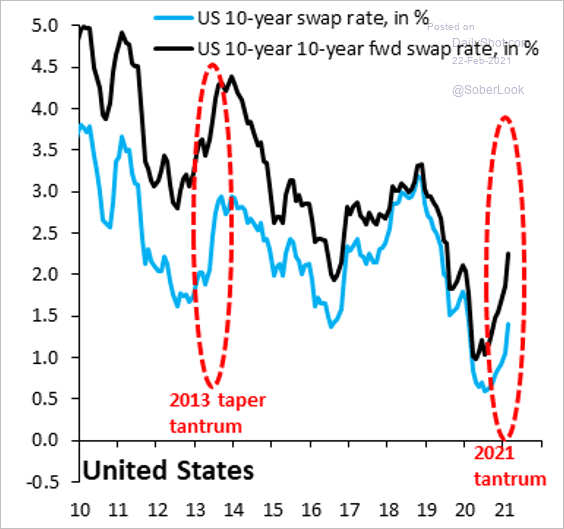 Source: @RobinBrooksIIF
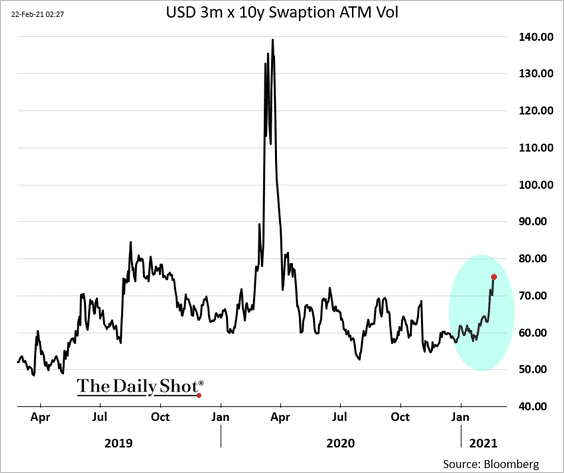
4. Interest-rate implied volatility hit the highest level since last April.
5. The copper-to-gold ratio points to substantial upside risk for Treasury yields.
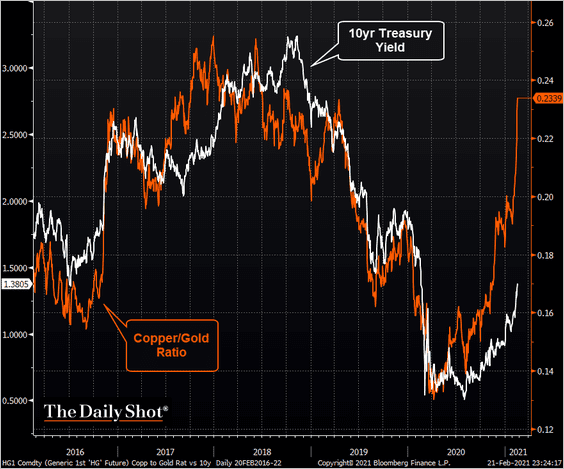 Source: @TheTerminal, Bloomberg Finance L.P.
6. The 10yr note futures volume spiked last week.
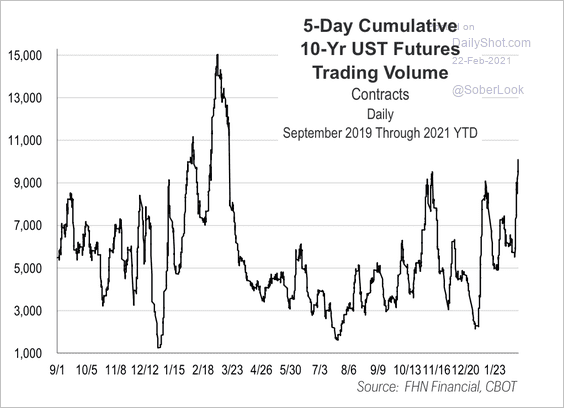 Source: FHN Financial
7. The Fed’s holdings of TIPS (inflation-linked Treasuries) hit a record high.
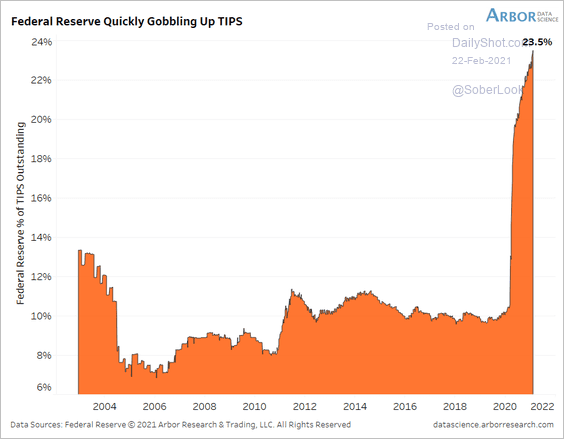 Source: Arbor Research & Trading
8. The looming US Treasury withdrawals from its account at the Fed will flood the market with liquidity, creating demand for short-term paper.
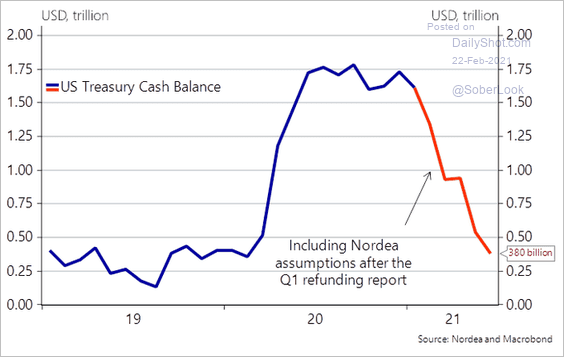 Source: @AndreasSteno
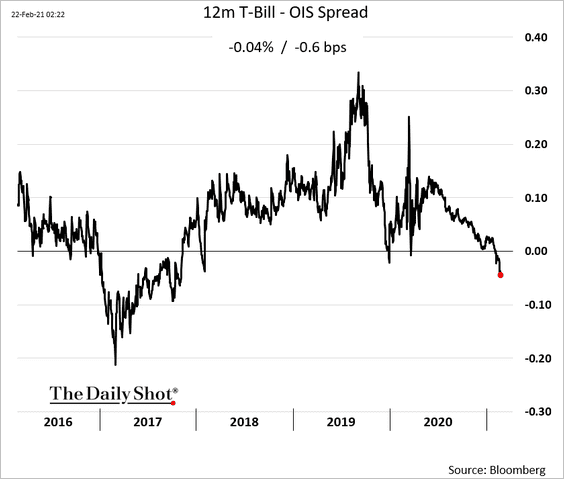
That’s why the 12-month T-Bill-OIS spread continues to move deeper into negative territory.
Back to Index
Credit
1. Higher inflation tends to be helpful for leveraged companies (pushing up prices of commodities, real property, etc.). This chart shows the spread between Baa (BBB) and Aaa (AAA) corporate bonds vs. market-based inflation expectations (breakeven).
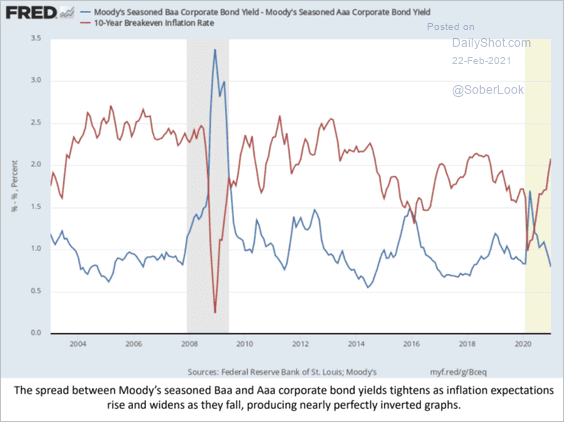 Source: Kevin Daley, Robins School of Business, University of Richmond
2. CCC – B corporate spreads are at the lowest levels since 2006 (the height of the credit bubble).
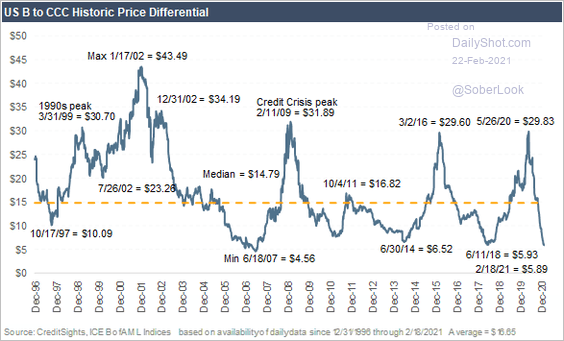 Source: CreditSights
Back to Index
Commodities
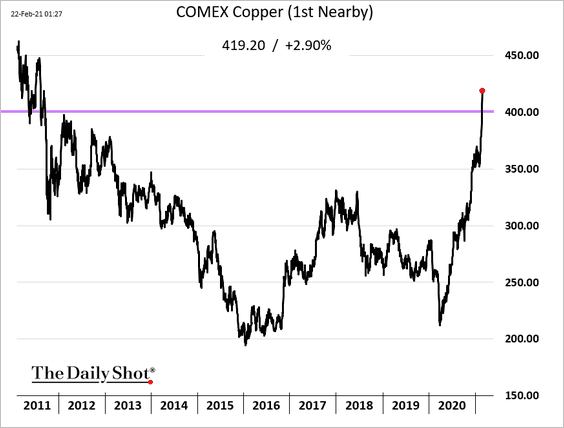
1. US copper futures blasted past $4.0/lb, hitting the highest level since 2011.
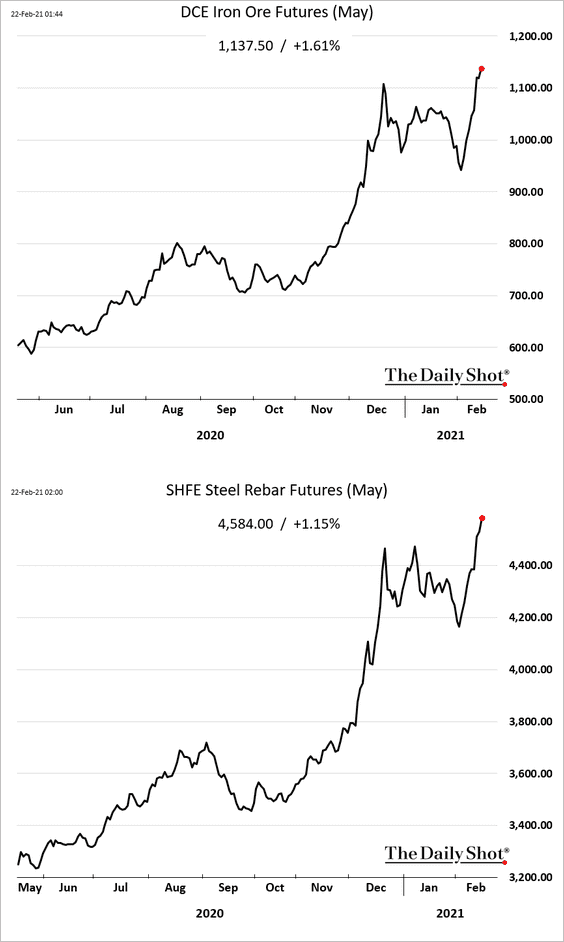
2. China’s iron ore and steel prices keep climbing.
3. Online search activity for “commodity supercycle” has spiked.
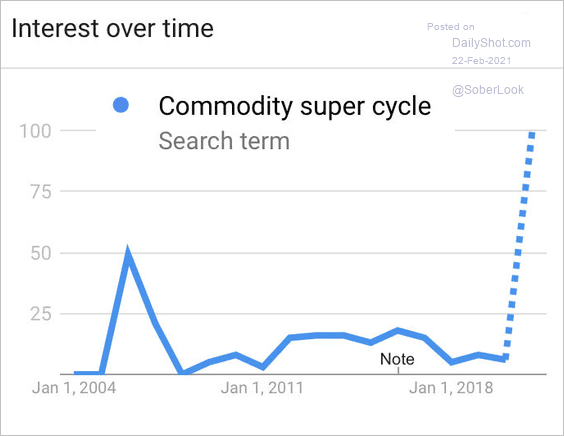 Source: Anastasios Avgeriou
4. In real terms, commodity prices are in a long-term downtrend.
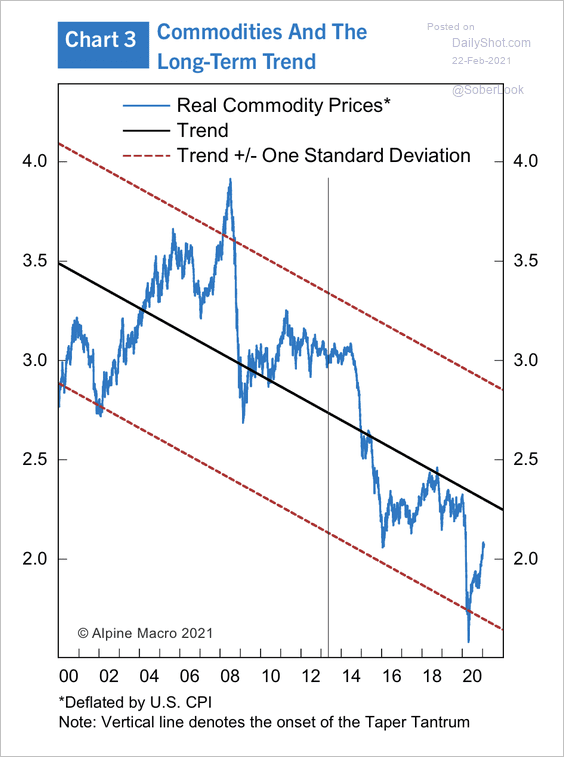 Source: Alpine Macro
5. Fund managers have been boosting their allocation to commodities.
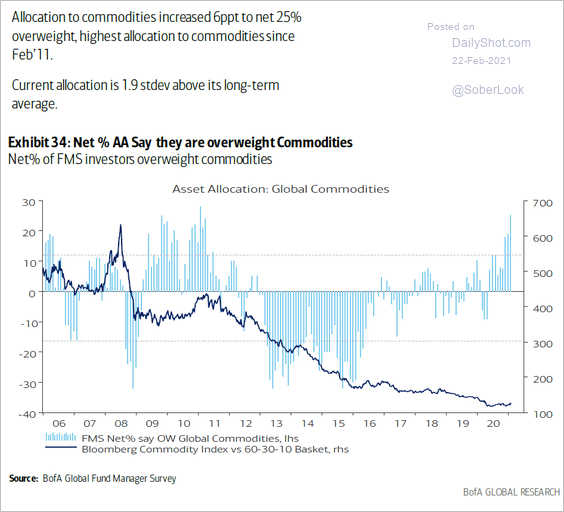 Source: BofA Global Research
Back to Index
Energy
1. Despite ~7-8 million barrels of production lost in the Permian this month, US oil output should return to its previous trajectory by March.
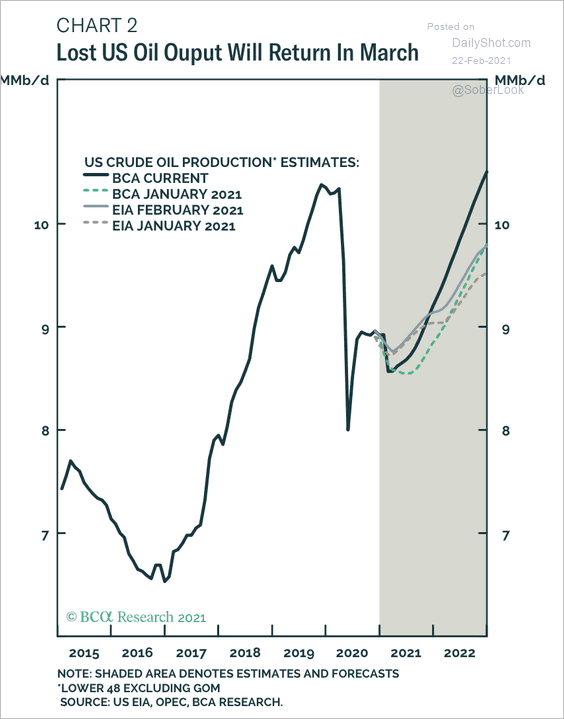 Source: BCA Research
BCA Research has an average price forecast of around $65 per barrel for Brent oil.
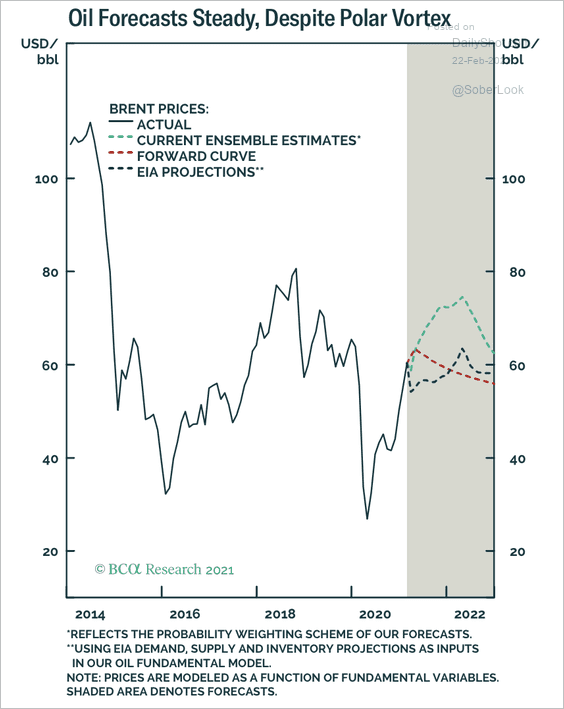 Source: BCA Research
——————–
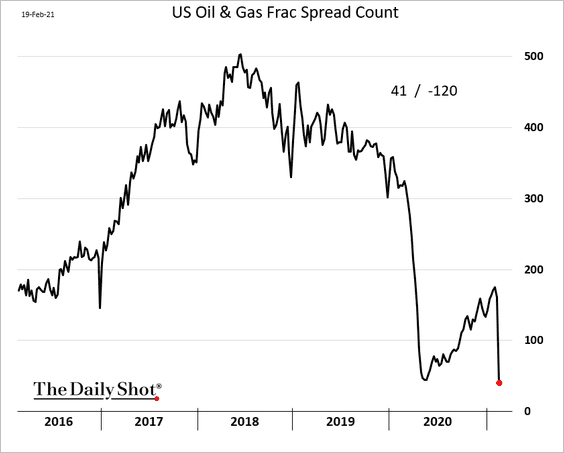
2. The frac spread tumbled last week as the deep freeze halted a great deal of the Permian Basin activity.
 Further reading
3. Louisiana residents could face higher utility costs going forward.
 Source: The Advocate Read full article
4. US gasoline prices at the pump keep climbing.
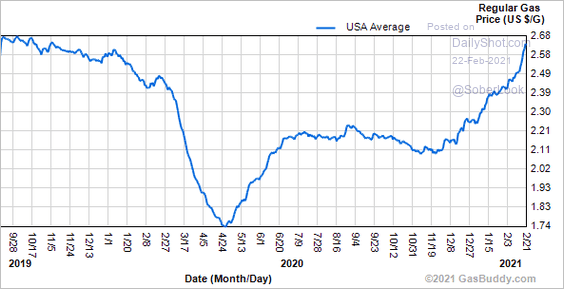 Source: GasBuddy Further reading
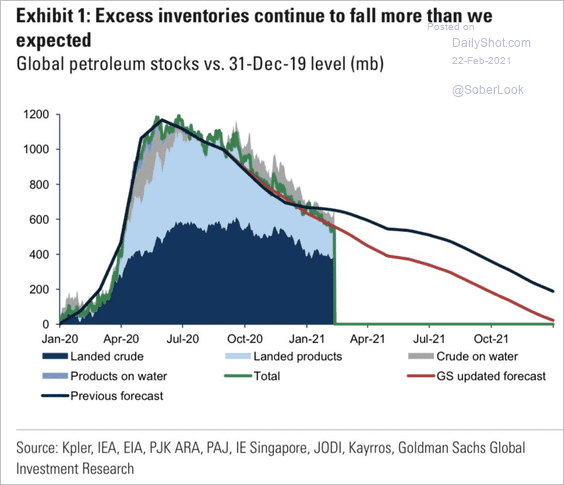
5. Goldman has downgraded its forecast for global petroleum stockpiles.
 Source: Goldman Sachs, @carlquintanilla
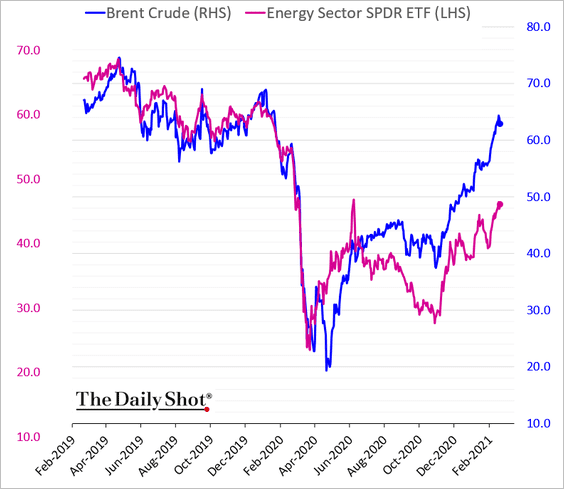
6. Energy stocks continue to lag crude oil.
7. Alternative energy stocks have significantly outperformed traditional energy shares over the past year.
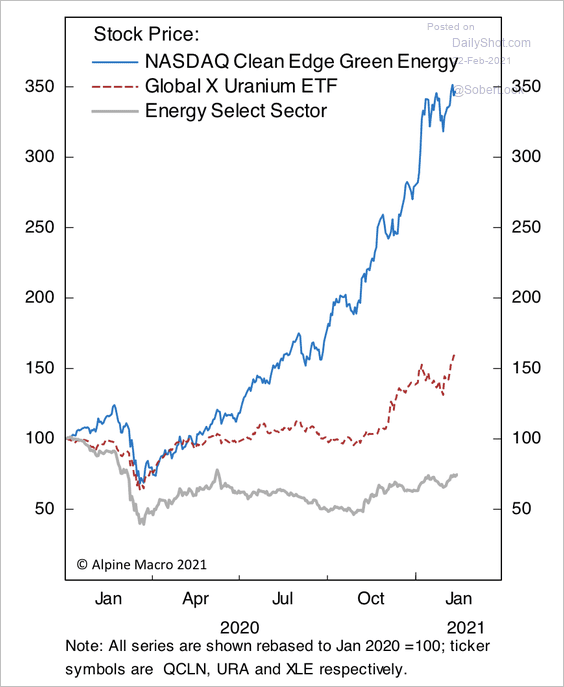 Source: Alpine Macro
Back to Index
Equities
1. Rising corporate bond yields are a risk to the S&P 500 rally.
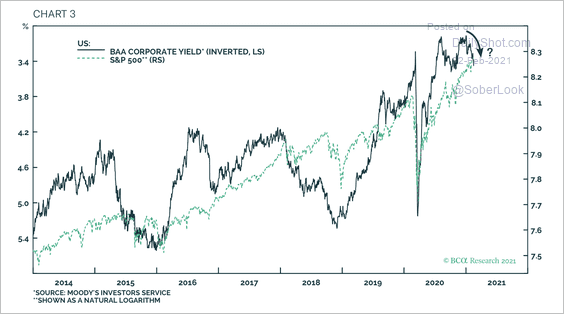 Source: BCA Research
2. Global dividend yields are looking less attractive relative to Treasury yields.
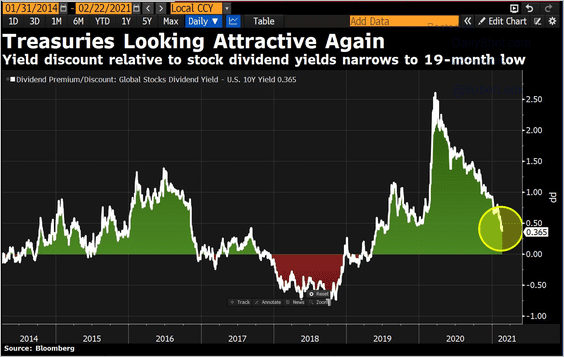 Source: @DavidInglesTV
3. Insider selling has accelerated.
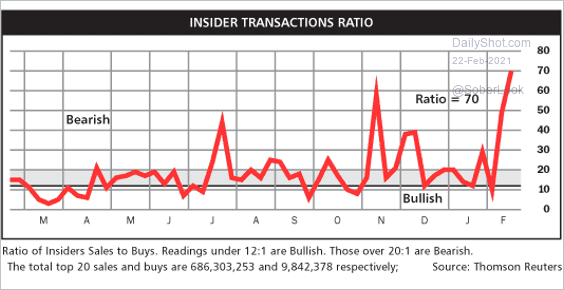 Source: Citi, @hmeisler
4. Fund managers increasingly want to see companies boost CapEx rather than reduce leverage.
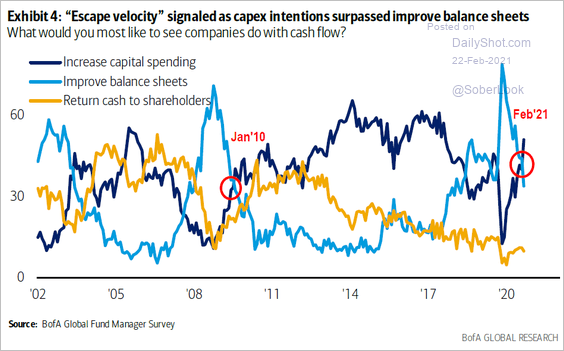 Source: BofA Global Research
5. Equity fund inflows have accelerated.
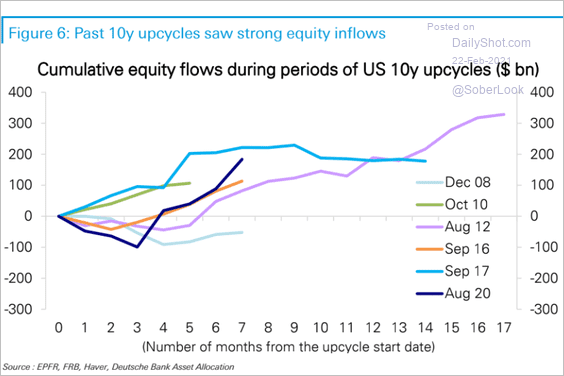 Source: Deutsche Bank Research
6. This bull market had the best start since the 1930s.
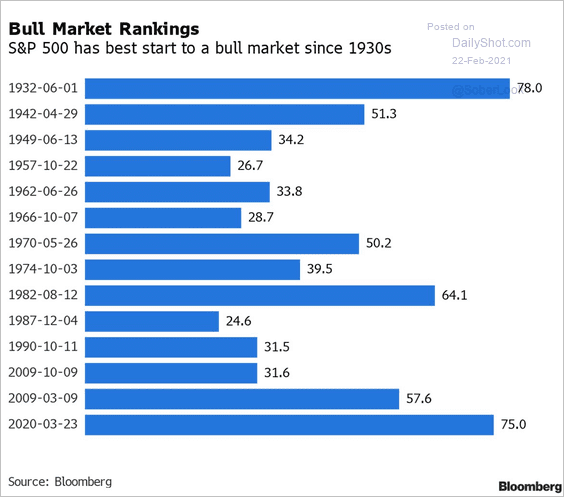 Source: BloombergQuint Read full article
7. The share of small- to mid-cap companies with negative earnings has risen globally (with US leading).
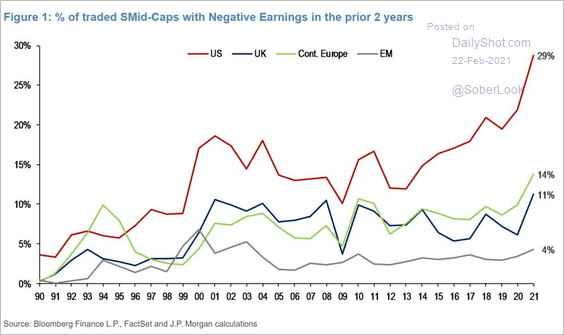 Source: Haresh Raju; JP Morgan
Back to Index
Cryptocurrency
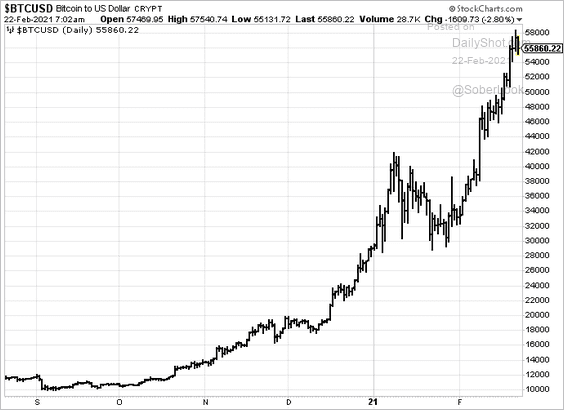
1. Bitcoin tested $58k before pulling back.
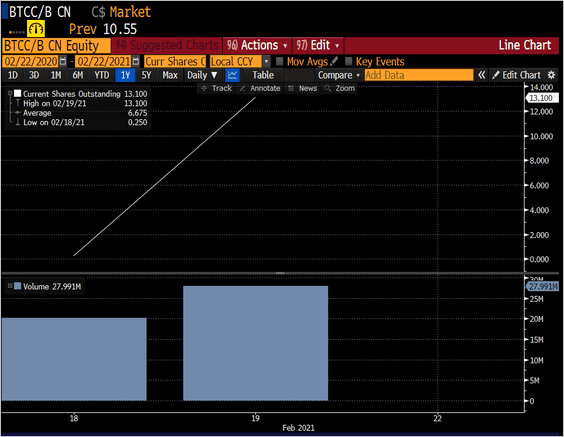
2. A Canadian Bitcoin ETF hit 13 million shares outstanding within a couple of days after launch. Nearly 30 million shares changed hands on Friday.
 Source: @TheTerminal, Bloomberg Finance L.P. Further reading
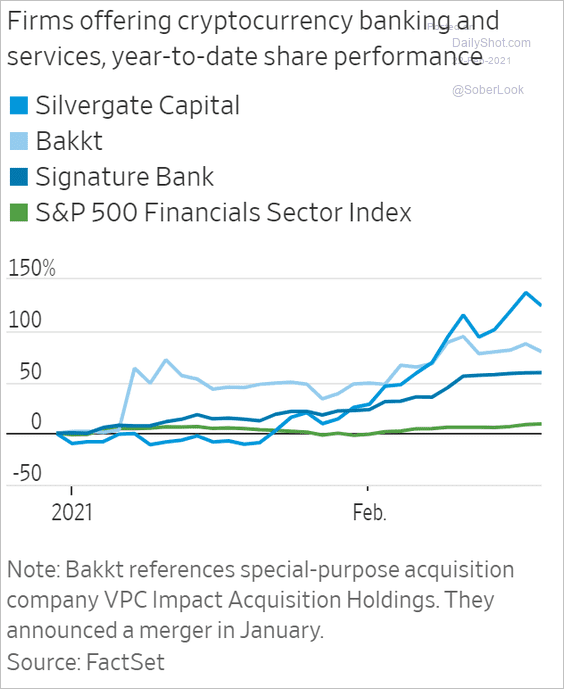
3. Financial firms offering crypto services have outperformed.
 Source: @WSJ Read full article
Back to Index
Emerging Markets
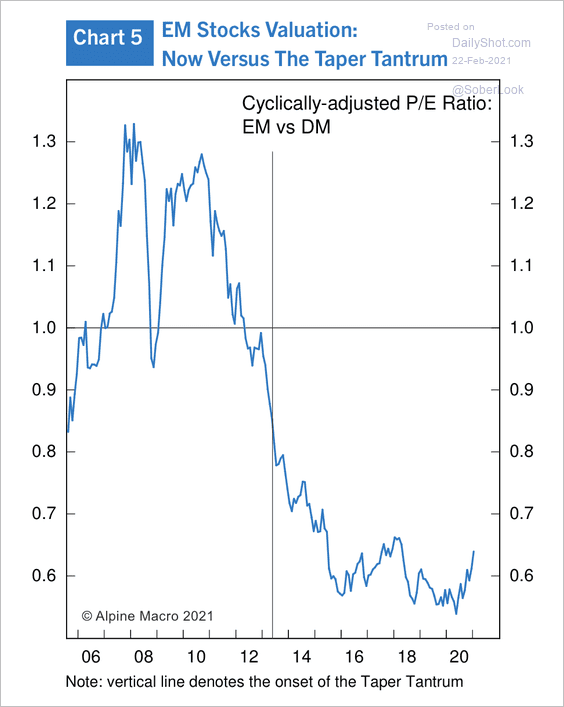
1. EM stocks are deeply undervalued versus developed market stocks compared to the 2013-2014 “taper tantrum.”
 Source: Alpine Macro
2. The recent decline in New Zealand stocks could signal a pull-back in EM equities.
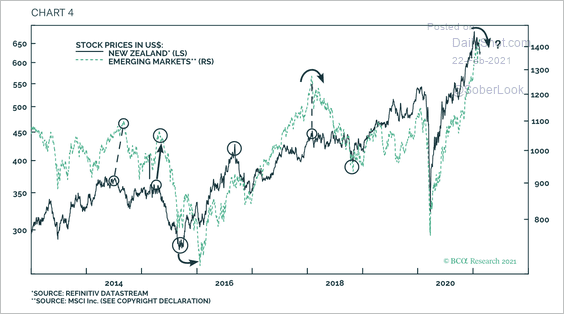 Source: BCA Research
3. Local currency bonds have underperformed hard currency bonds over the past few years.
 Source: Oxford Economics
Higher commodity prices resulted in rising terms of trade for high-beta EM currencies. At the same time, low-yielders have seen their terms of trade deteriorate, resulting in weaker currencies.
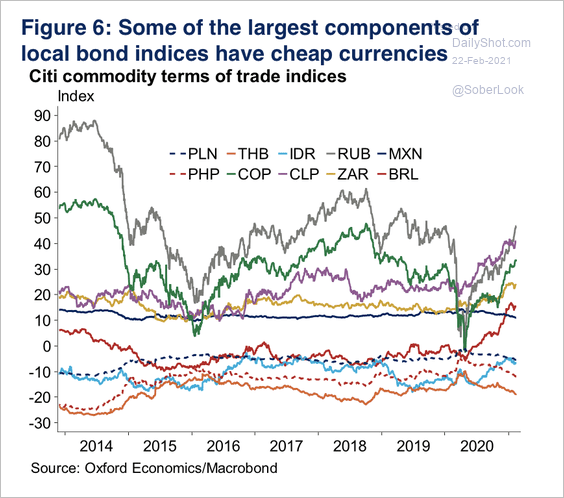 Source: Oxford Economics
——————–
4. Brazil’s government is pressuring Petrobras to lower fuel prices as crude oil prices keep climbing. It’s not a good outcome for the state-owned energy giant.
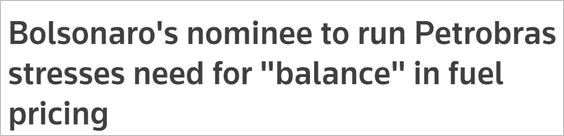 Source: Reuters Read full article
 Source: Reuters Read full article
Petrobras bonds are underperforming government debt.
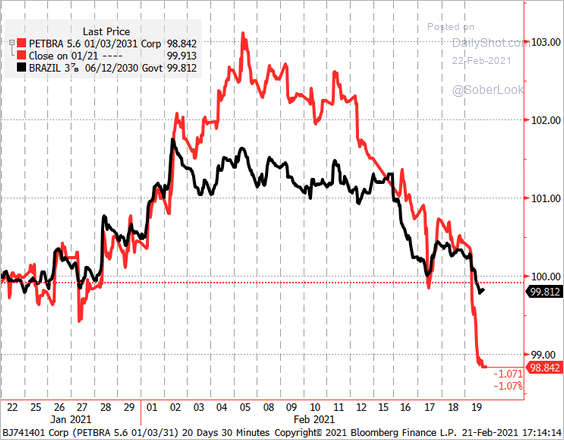 Source: @TheTerminal, Bloomberg Finance L.P.
Back to Index
China
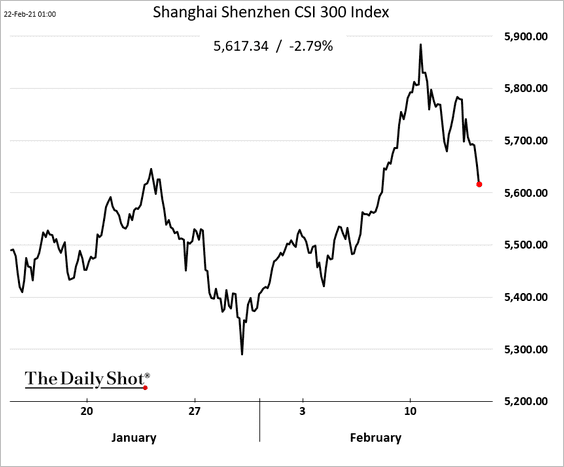
1. The stock market is lower as Beijing tightens regulations on banks that do business with lending platforms. There is also talk of tighter PBoC monetary policy ahead.
 Source: @markets Read full article
Here is China’s online consumer lending growth.
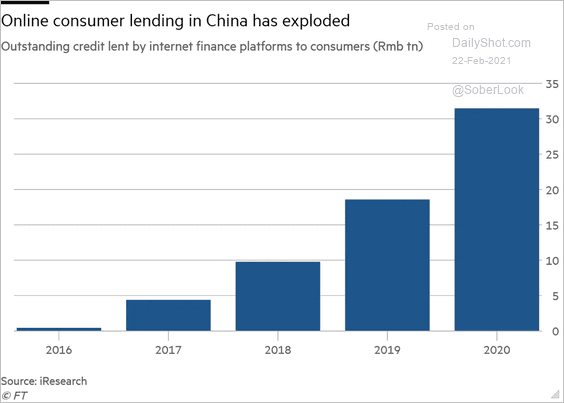 Source: @financialtimes Read full article
——————–
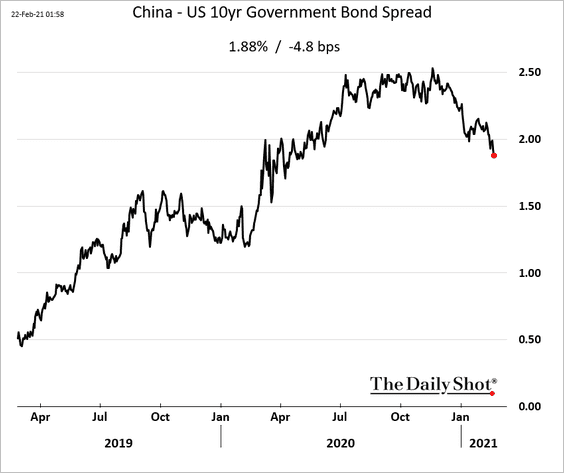
2. The spread between China’s and US 10yr yields has peaked.
3. The offshore yuan trading volume has been climbing.
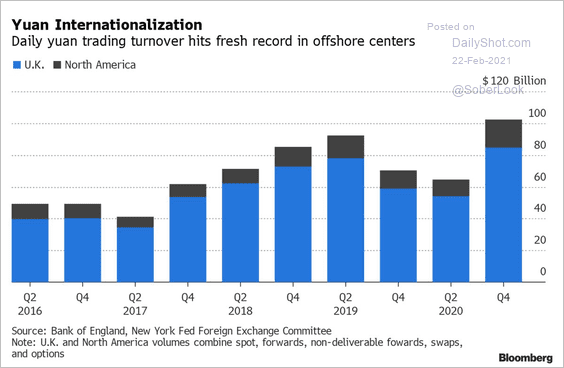 Source: @BloombergQuint Read full article
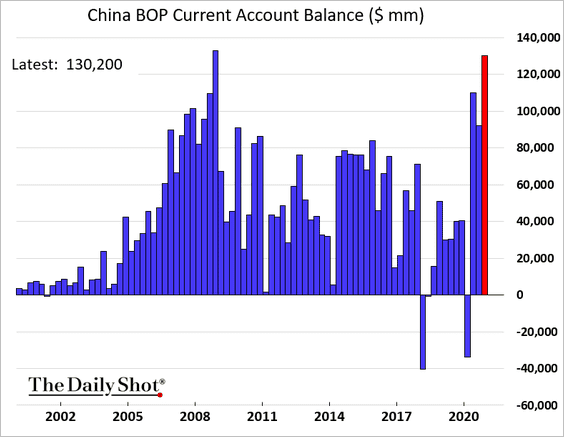
4. The current account surplus hit the highest level since 2008.
Back to Index
Asia – Pacific
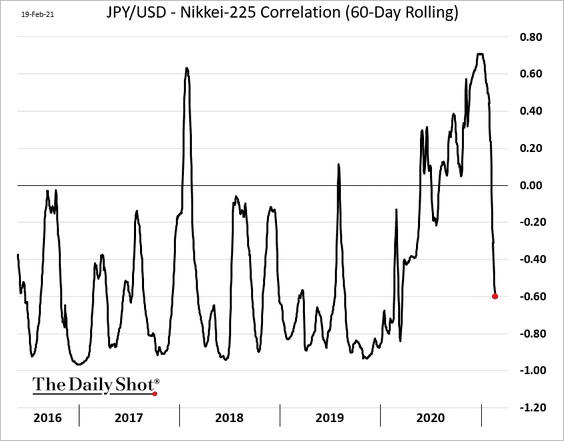
1. Dollar-yen – Nikkei correlation is negative again.
 h/t @shoko_oda
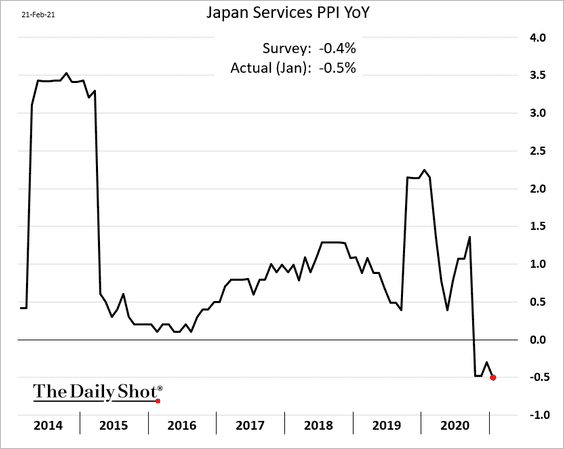
2. Japan’s services PPI remains in negative territory.
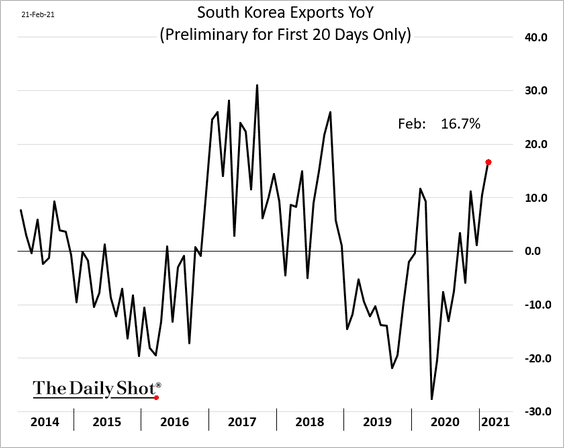
3. South Korea’s exports continue to strengthen.
Back to Index
The Eurozone
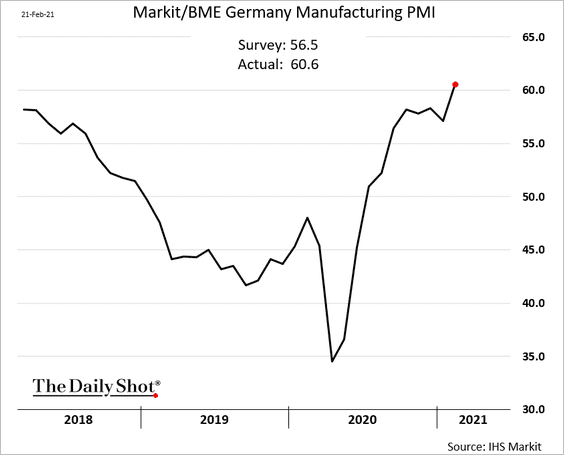
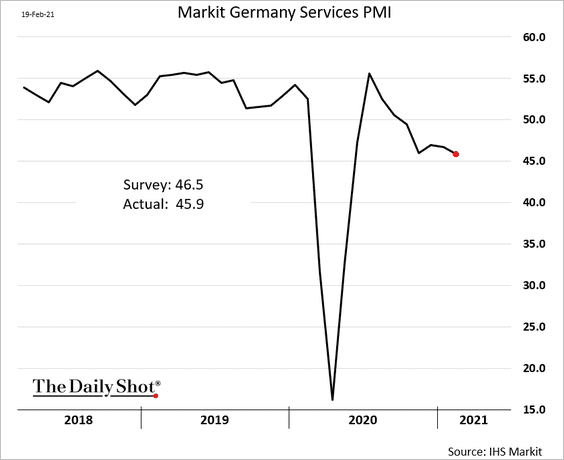
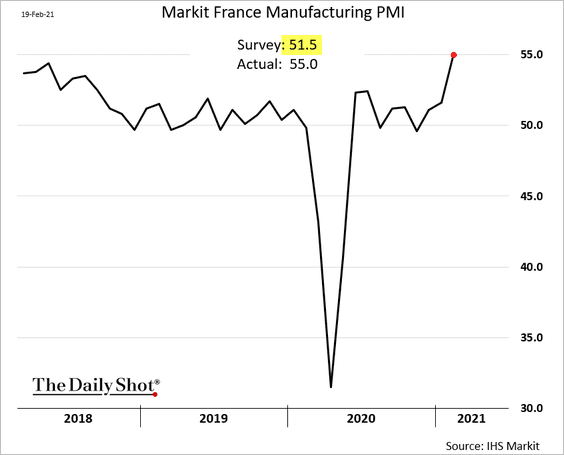
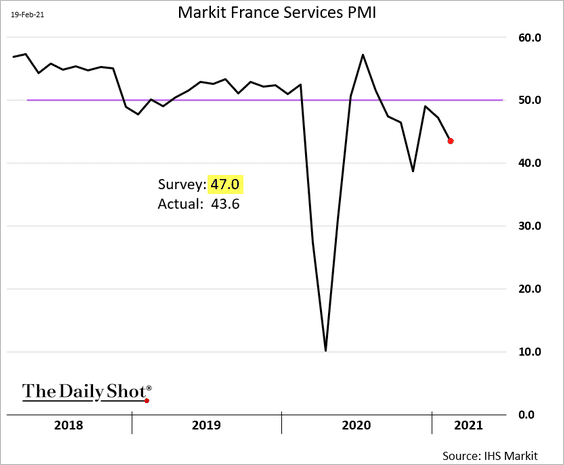
1. The February preliminary PMI report was mixed, with the manufacturing-services gap widening further amid lockdowns.
• Germany:
• France:
• The Eurozone:
 Source: Markit, @TheTerminal, Bloomberg Finance L.P.
——————–
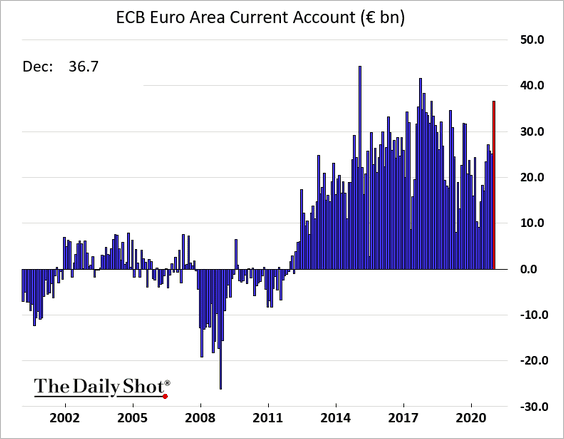
2. The current account surplus spiked in December.
——————–
3. Market indicators point to lower equity valuations ahead.
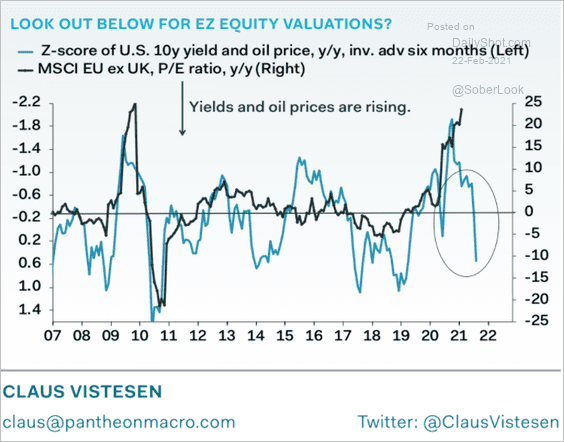 Source: Pantheon Macroeconomics
Back to Index
The United Kingdom
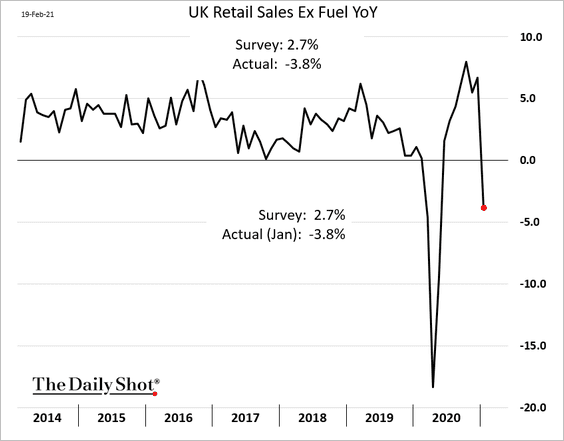
1. Retail sales tumbled in January.
 Source: MarketWatch Read full article
Here is the breakdown by sector.
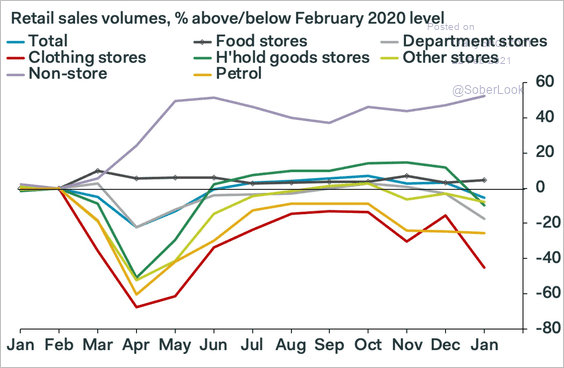 Source: Pantheon Macroeconomics
——————–
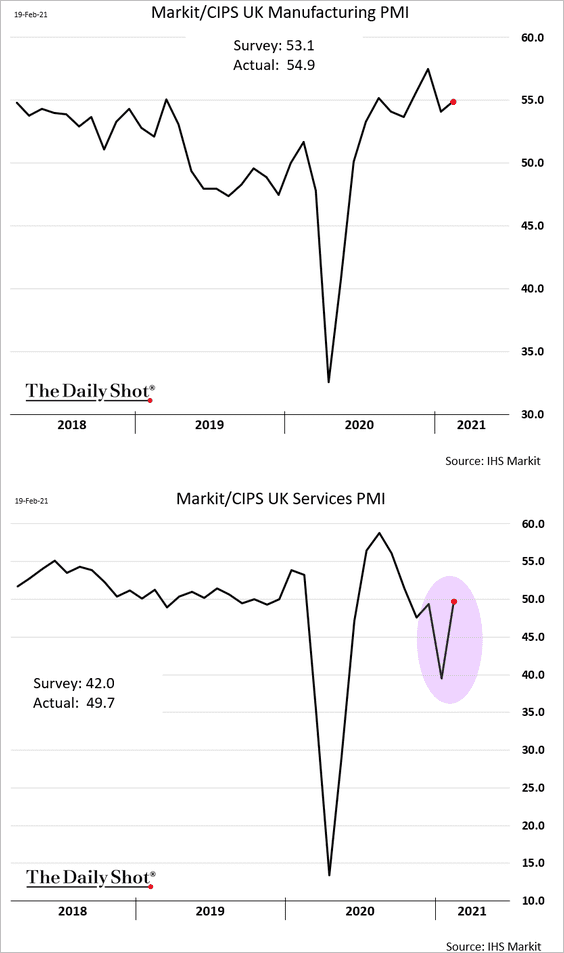
2. However, the economy bounced back this month, with Markit PMI exceeding expectations.
Businesses are upbeat about the future.
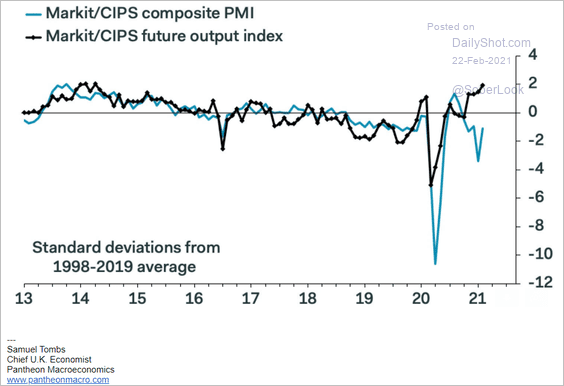 Source: Pantheon Macroeconomics
——————–
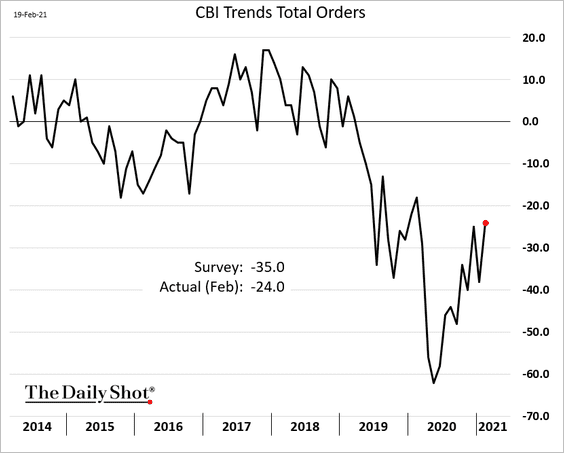
3. The CBI orders report also surprised to the upside.
4. COVID cases continue to tumble.
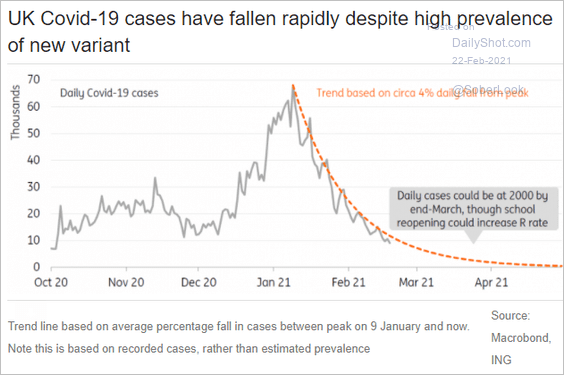 Source: ING
5. The UK stock market looks cheap relative to peers.
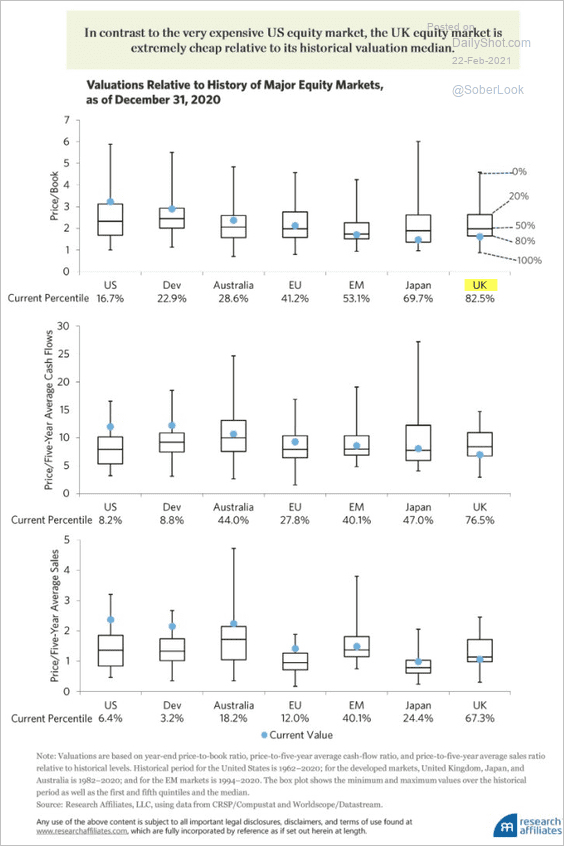 Source: @johnauthers, @RA_Insights, @bopinion Read full article
Back to Index
The United States
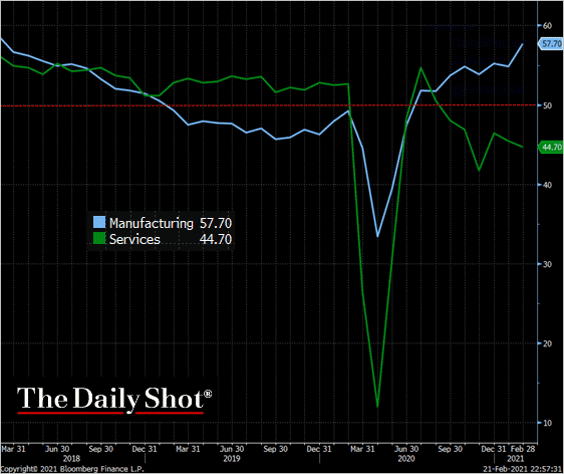
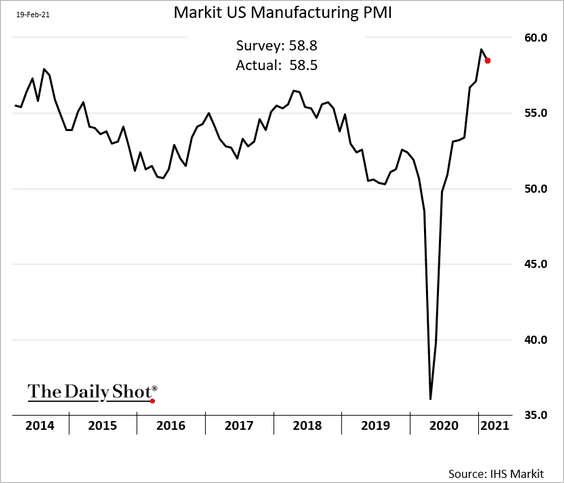
1. The preliminary Markit PMI report showed strong business activity this month.
• Manufacturing:
• Services:
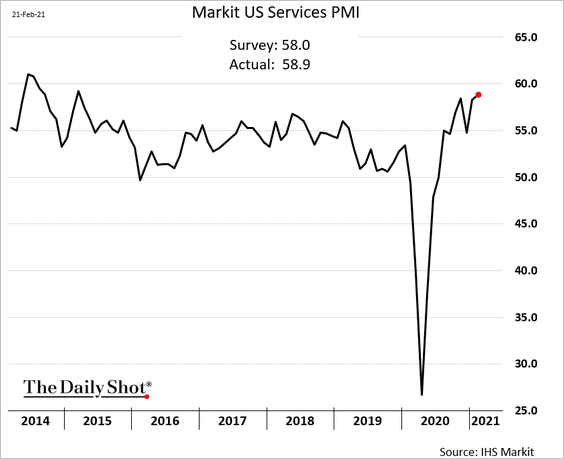
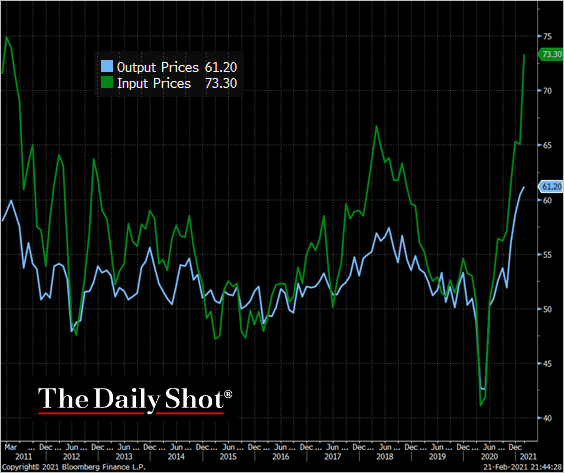
But supplier bottlenecks appear to be worsening, …
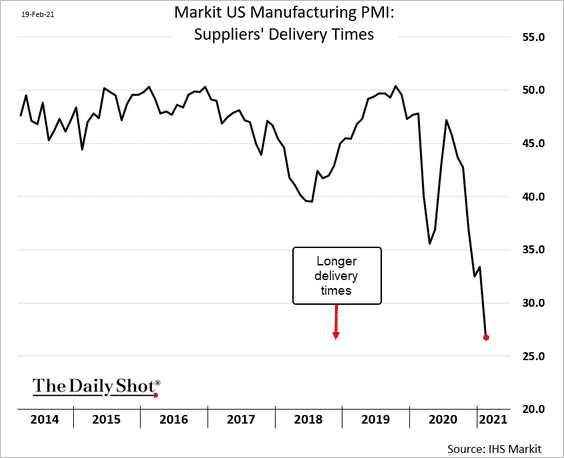
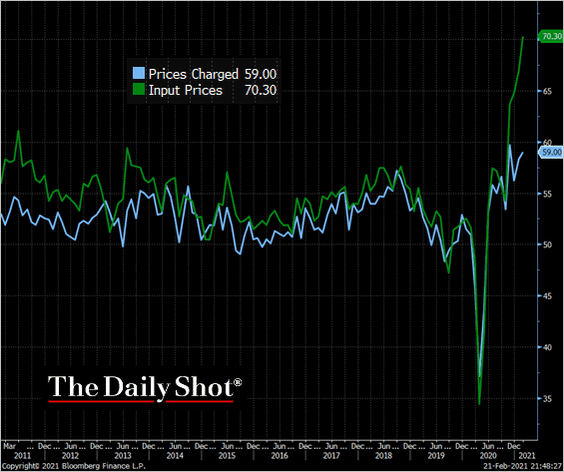
… which is pushing input prices higher. In some cases, businesses have been able to pass these higher prices on to their customers.
 Source: IHS Markit Read full article
• Manufacturing:
 Source: Markit, @TheTerminal, Bloomberg Finance L.P.
• Services:
 Source: Markit, @TheTerminal, Bloomberg Finance L.P.
——————–
2. Rising producer prices are making their way to the consumers.
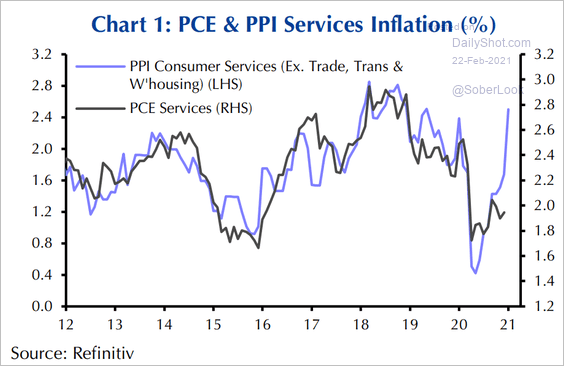 Source: Capital Economics
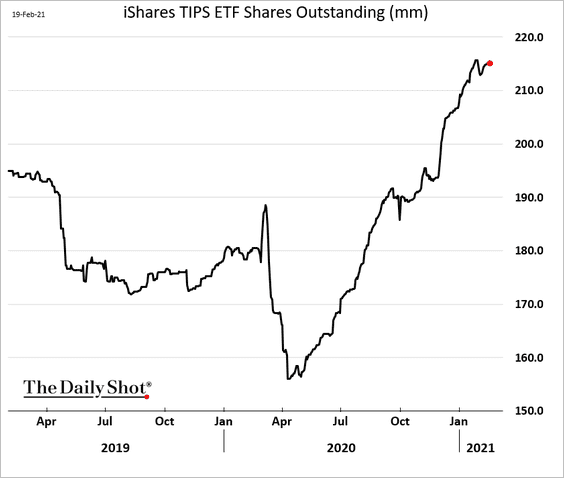
Investors are increasingly concerned about inflation. Many have been buying inflation-linked Treasuries (TIPS). The chart below shows shares outstanding for the largest TIPS ETF. But that trade has played its course, with real yields now moving higher.
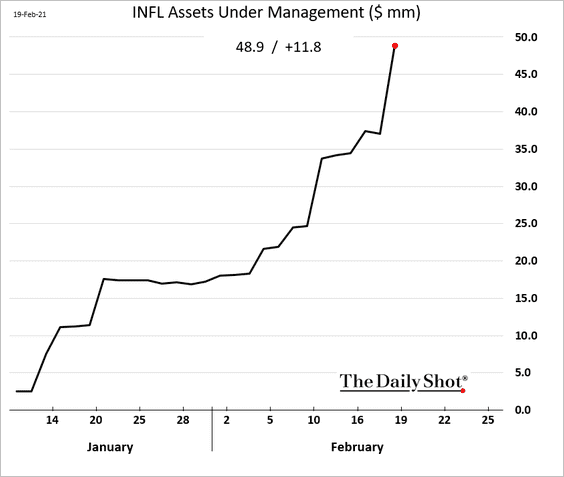
Investors are buying stocks that will benefit from higher prices. Assets of a recently-launched ETF (INFL) focusing on inflation-sensitive stocks soared.
——————–
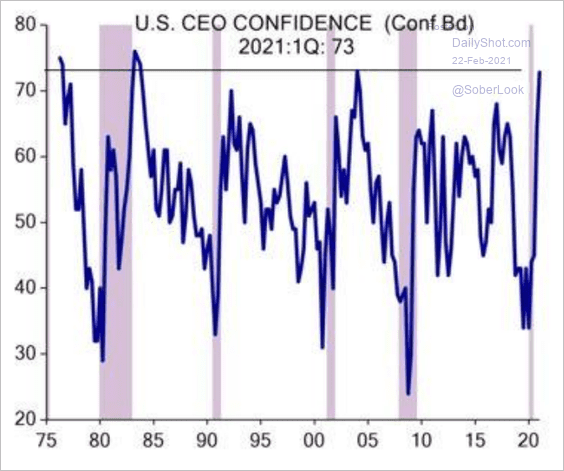
3. Surveys continue to show improvements in CEO confidence.
• Evercore ISI survey:
 Source: Evercore ISI
• The Conference Board survey:
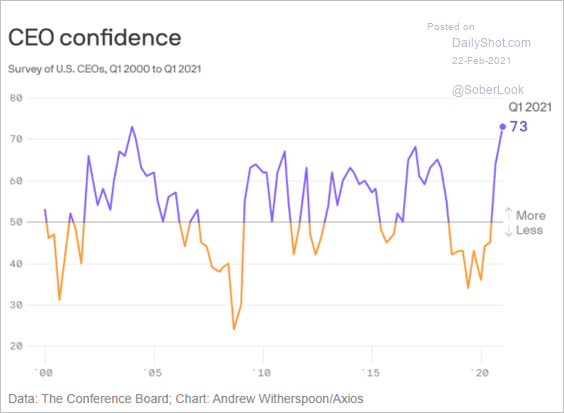 Source: @axios
Back to Index
Food for Thought
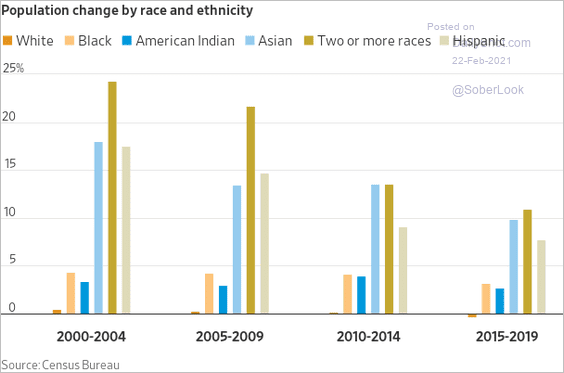
1. US population changes by race/ethnicity:
 Source: @WSJ Read full article
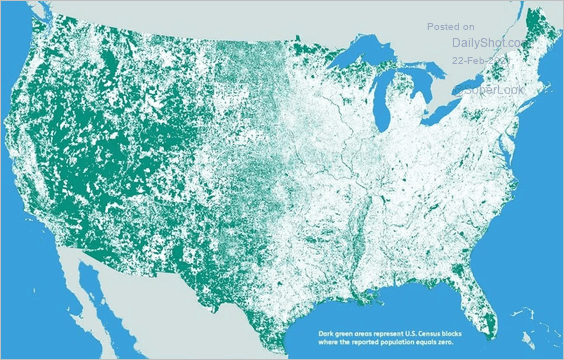
2. Uninhabited parts of the US (green):
 Source: maps by nik, Smithsonian Magazine Read full article
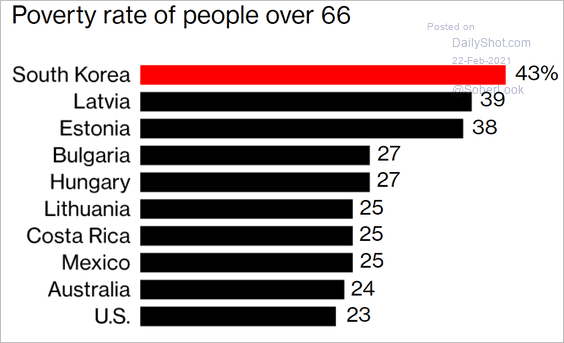
3. Poverty rates of people over 66:
 Source: @BW Read full article
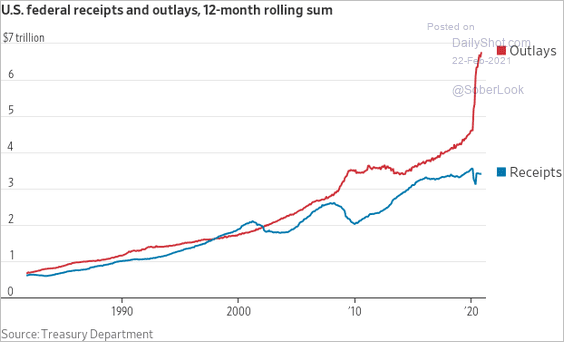
4. US government receipts and outlays:
 Source: @WSJ Read full article
5. Cities with the worst traffic congestion:
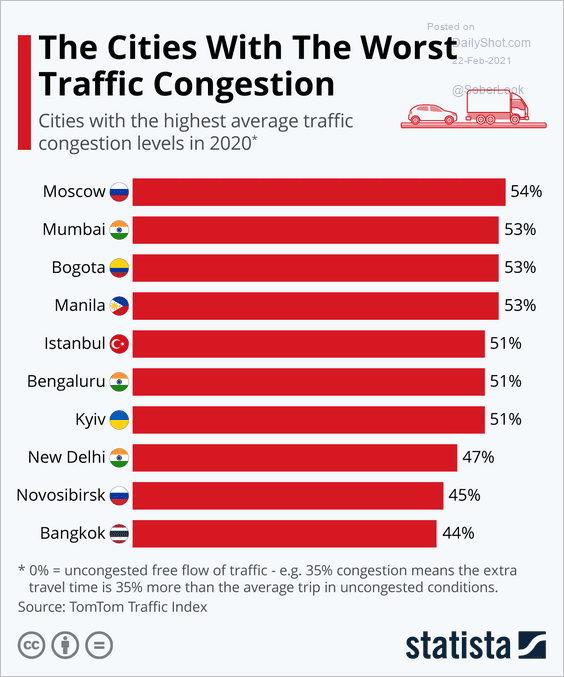 Source: Statista
6. US households’ interest income:
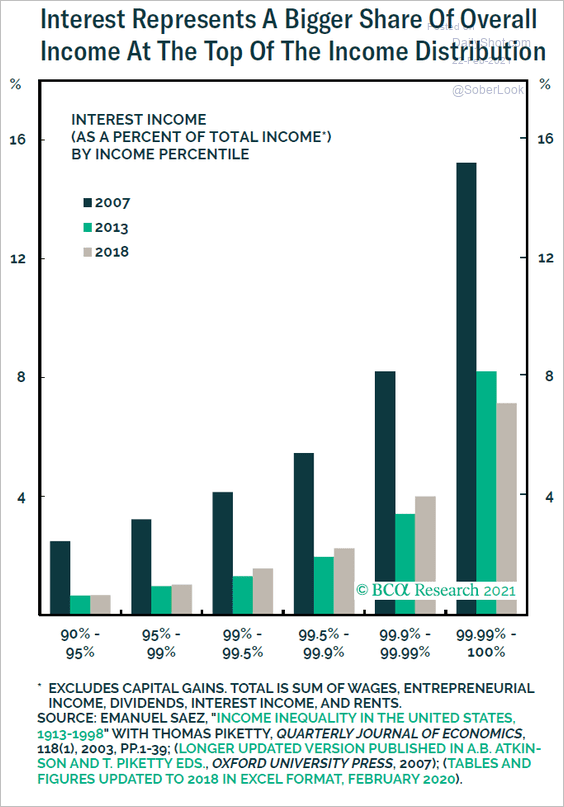 Source: BCA Research
7. Views on additional pandemic aid:
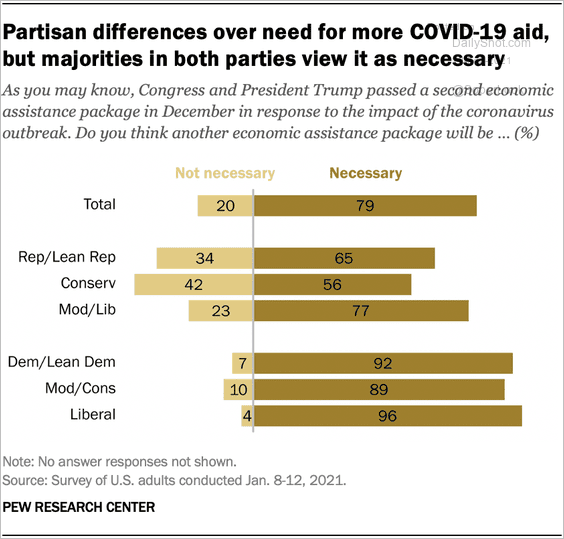 Source: Pew Research Center Read full article
8. Noncitizens as a share of US foreign-born population:
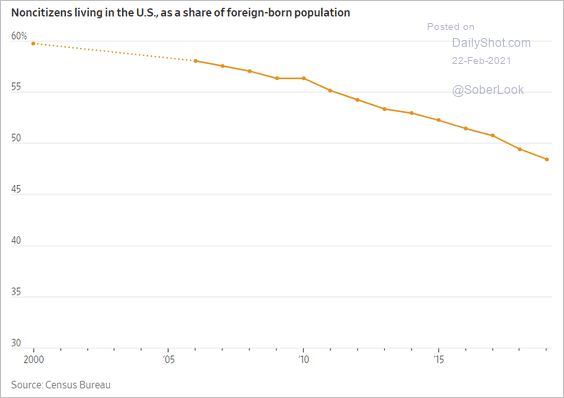 Source: @WSJ Read full article
9. The highest temperature ever recorded on each continent:
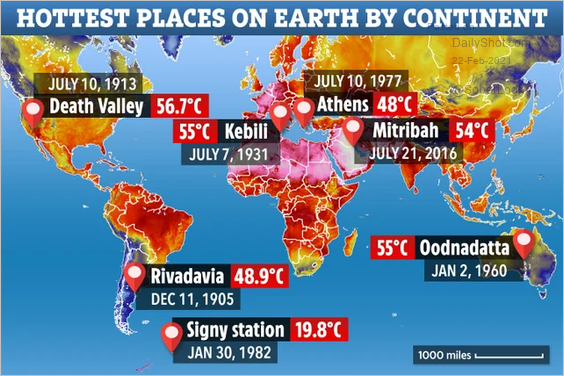 Source: Reddit
——————–
Back to Index