
The Daily Shot: 01-Mar-21
• The United States
• Canada
• The Eurozone
• Europe
• Australia
• China
• Emerging Markets
• Cryptocurrency
• Energy
• Equities
• Rates
• Global Developments
• Food for Thought
The United States
1. Personal incomes rose sharply in January, boosted by one-time government checks and elevated unemployment payments (2 charts).
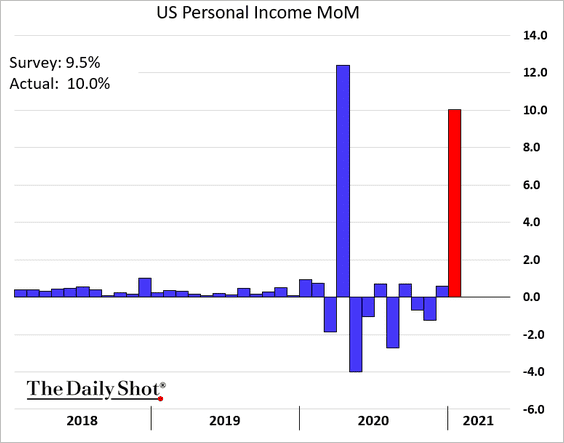
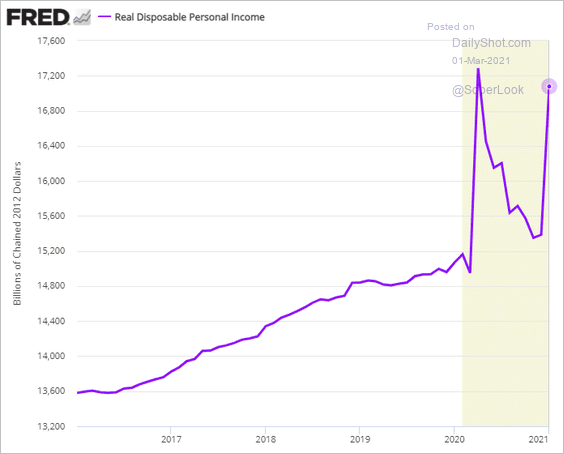
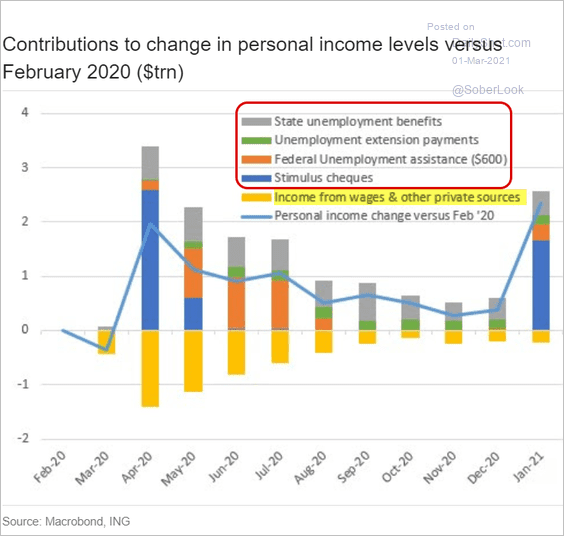
As the attribution chart below shows, all of the gains in income came from government support. The contribution from private sources was negative again.
 Source: ING
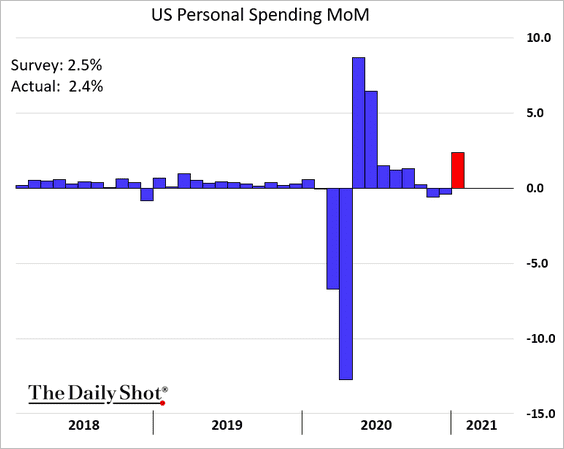
• The savings rate jumped.
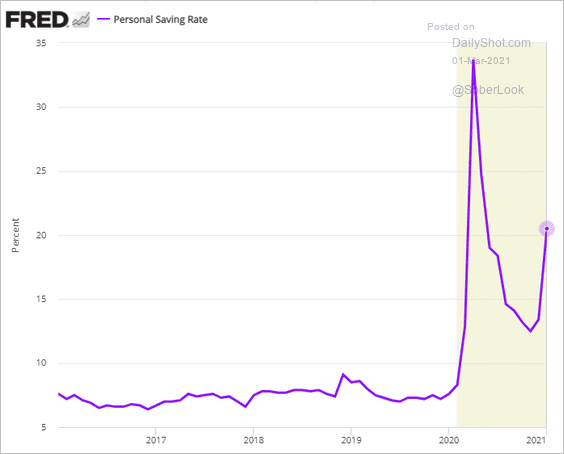
• Spending rose in line with expectations, with the bulk of the income increase going into savings.
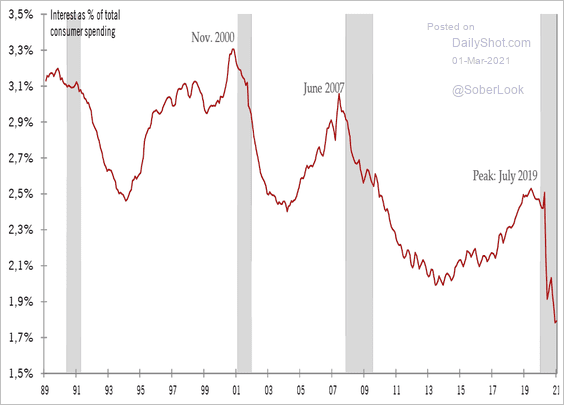
Lower interest expenses also boosted savings. This chart shows interest payments as a percentage of total consumer spending.
 Source: @TCosterg
Here is a comment from Alex Pelle, Mizuho Securities USA.
… the saving rate skyrocketed to 20.5% from 13.4% of disposable income. This implies a consumption multiplier close to $0.20 for every $1.00 of government transfer. This does raise serious questions about the wisdom of another giant stimulus. However, over-heating concerns can be somewhat eased by the evidence that transfer payments or “relief” do not seem to be very effective as stimulus: Most of the transfers are being saved by households.
——————–
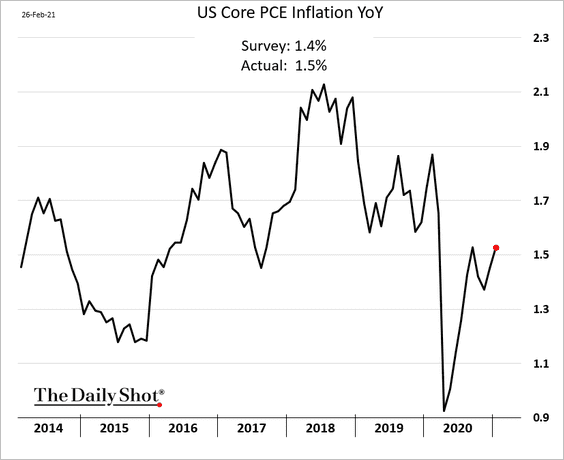
2. Next, we have some updates on inflation.
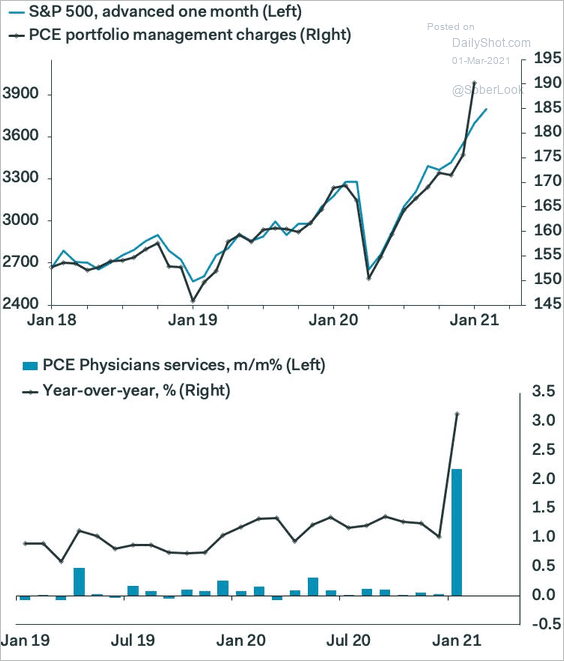
• The PCE inflation measure ticked higher, boosted by physicians’ services and portfolio management.
Below is a comment from Ian Shepherdson, Pantheon Macroeconomics.
The jump in the deflator is due mostly to two components, namely, physicians’ services and portfolio management charges. Physicians’ services prices were boosted in January by a one-time jump in Medicare reimbursement rates and will quickly revert to their very slow rising trend, while portfolio management charges lag the stock market and therefore will hit a wall very soon. Finally, airline fares rose by rather less than we expected, but further increases are a decent bet, lagging the jump in oil prices. We can’t rule out another above-trend increase in the deflator in February, but it’s unlikely to rise as much as in January. We still expect a spike in inflation post-Covid, but the latest numbers aren’t part of that story.
 Source: Pantheon Macroeconomics
• The overall services inflation remains stable, …
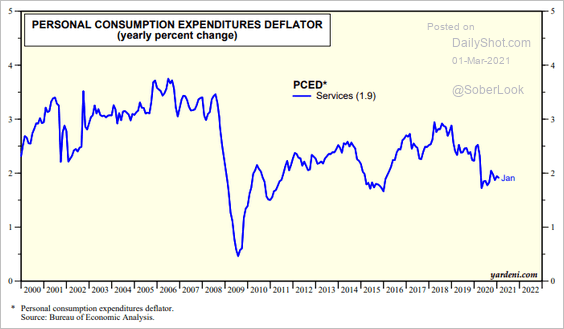 Source: Yardeni Research
… with most of the recent gains in PCE inflation coming from consumer durables.
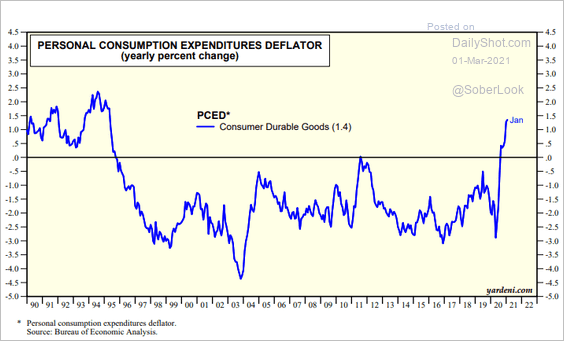 Source: Yardeni Research
• The Dallas Fed’s trimmed mean PCE measure (tracked closely by the FOMC) continues to drift lower.
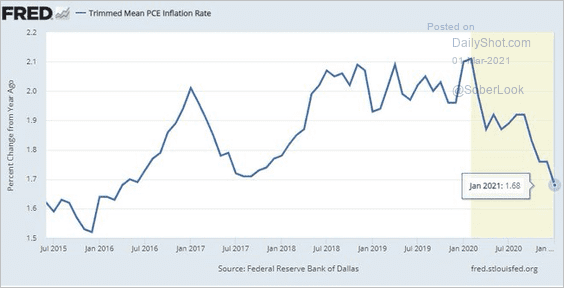 Source: @stlouisfed, @DallasFed
• Core PCE has been significantly below the 2% trend over the past few years. If the FOMC sticks to its commitment to target “average” inflation, the PCE indicator would need to return to its original 2% trendline for the central bank to claim victory on inflation. That means price gains could run well above 2% for some time before the Fed acts.
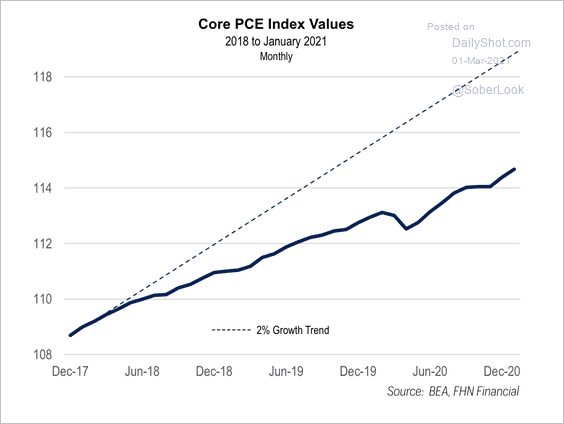 Source: FHN Financial
• Used car prices are up 15% since March of 2020.
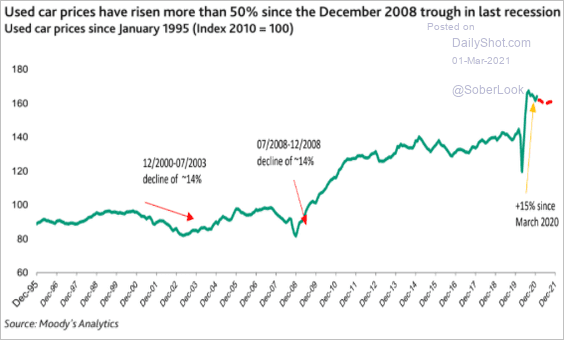 Source: Moody’s Investors Service
• This chart shows Nomura’s core PCE forecast.
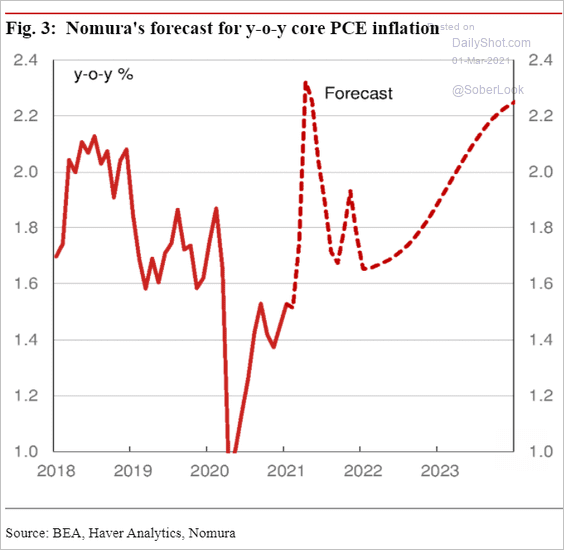 Source: Nomura Securities
——————–
3. As discussed previously, manufacturers’ prices paid are rising faster than prices received, pointing to potential margin pressures ahead.
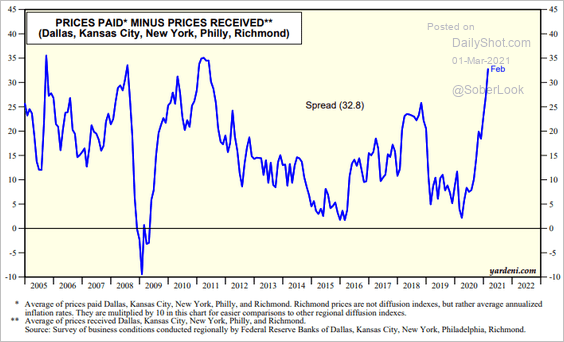 Source: Yardeni Research
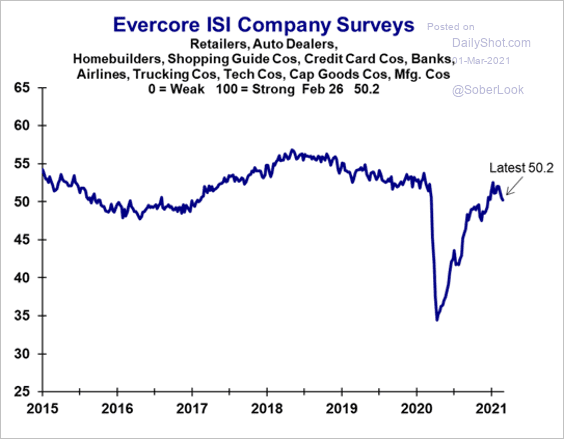
4. The Chicago PMI indicator softened in February, but business activity remains robust. It suggests a modest pullback in factory activity at the national level.
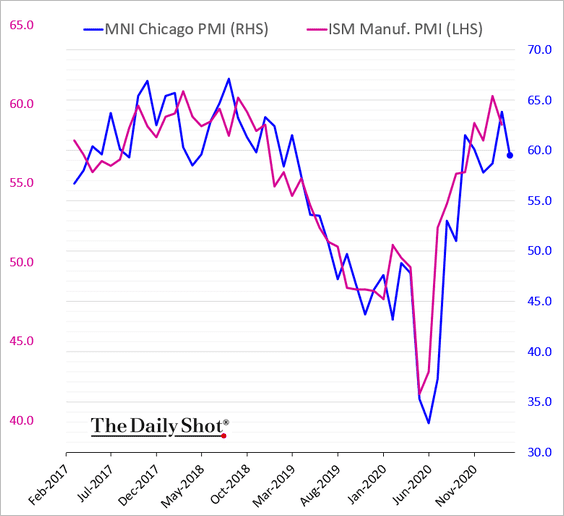
The Evercore ISI business survey also indicates some moderation.
 Source: Evercore ISI
——————–
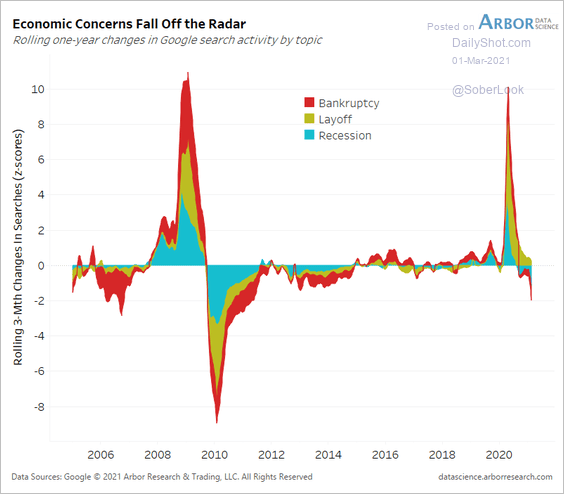
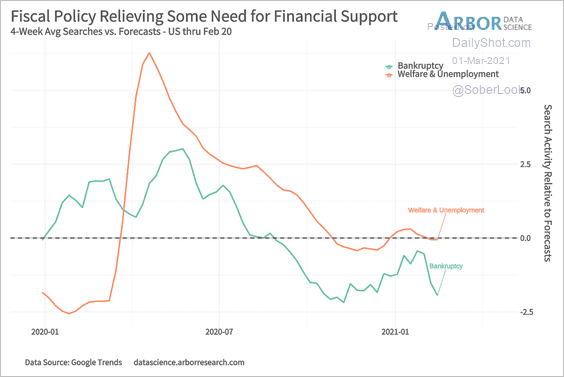
5. Online search activity suggests that consumers’ economic concerns are easing (2 charts).
 Source: Arbor Research & Trading
 Source: Arbor Research & Trading
——————–
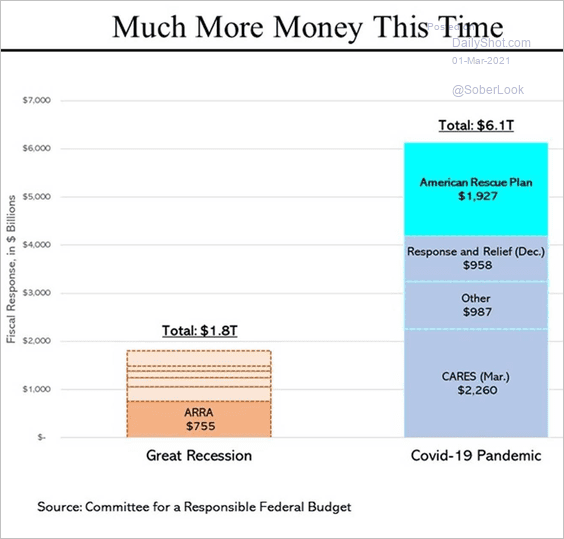
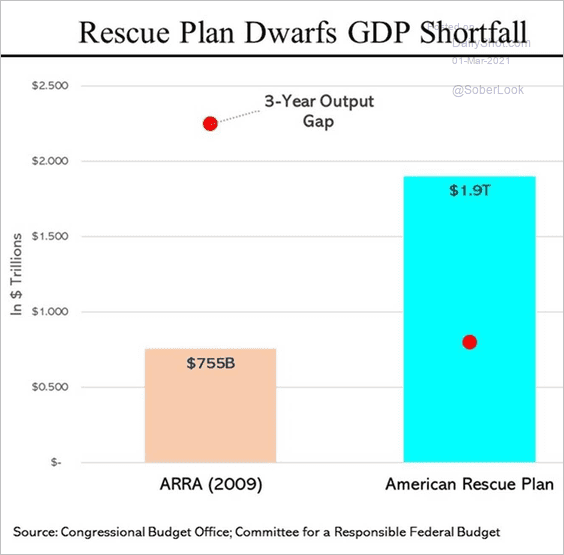
6. $6 trillion of stimulus can smooth many problems.
 Source: @SteveRattner
The planned $1.9 T COVID bill can close the GDP gap, with a trillion or more to spare.
 Source: @SteveRattner
Back to Index
Canada
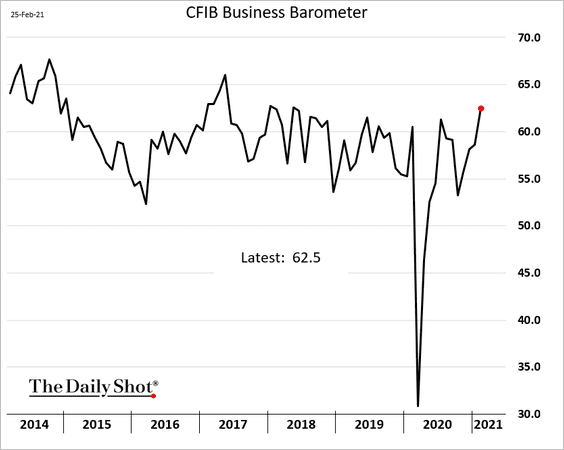
1. The index of business activity for small- and medium-size firms hit a multi-year high.
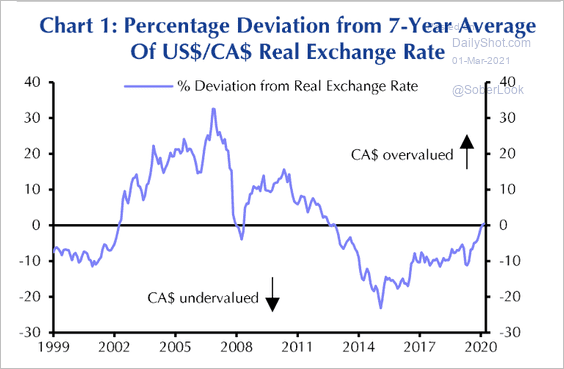
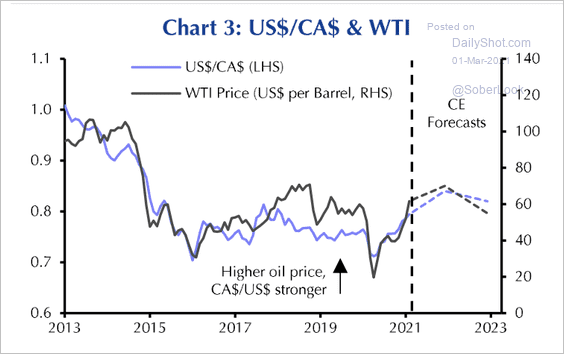
2. The Canadian dollar is not yet at a level that would imply overvaluation (versus the US dollar).
 Source: Capital Economics
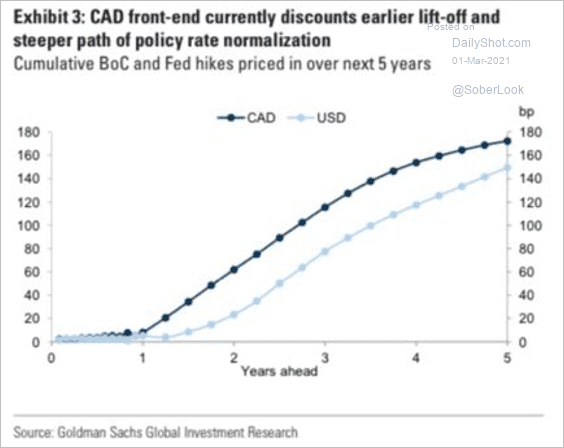
The market is pricing in liftoff in Canada before the US.
 Source: Goldman Sachs
Capital Economics does not expect a sustained oil price recovery, which could dampen market expectations for an earlier interest rate hike from the Bank of Canada than from the Fed. That scenario could eventually weigh on the loonie.
 Source: Capital Economics
Back to Index
The Eurozone
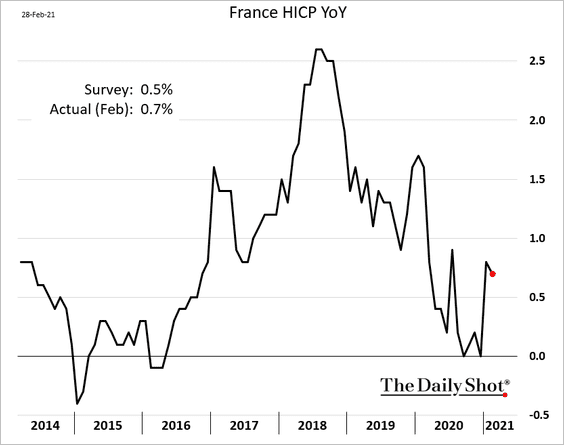
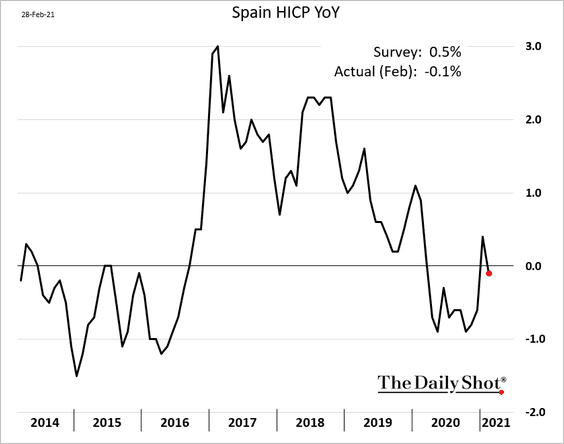
1. The February CPI indicators have been mixed so far.
• France (above consensus):
• Spain (back in deflation):
Here is a forecast for euro-area inflation from Nordea Markets.
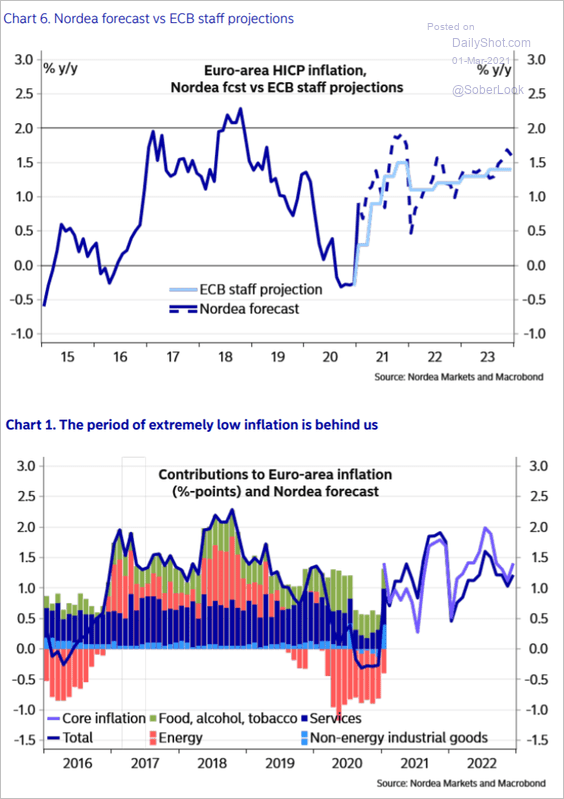 Source: Nordea Markets
——————–
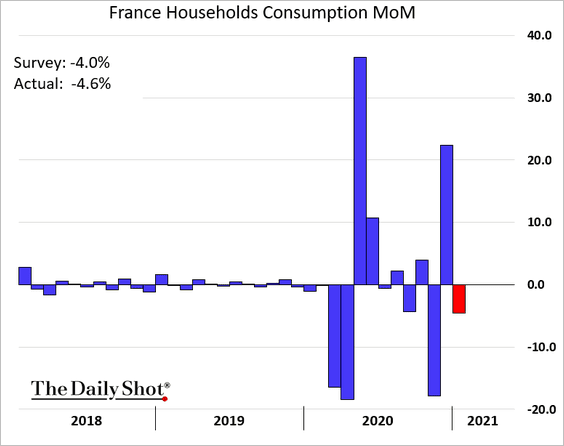
2. French household consumption shrunk in January.
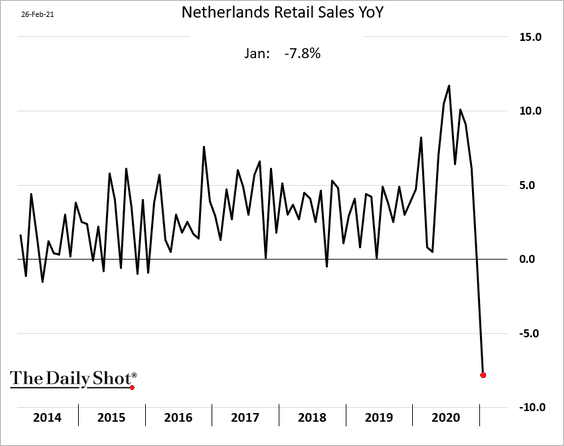
3. Dutch retail sales tumbled in January amid lockdowns.
Here is the breakdown by sector.
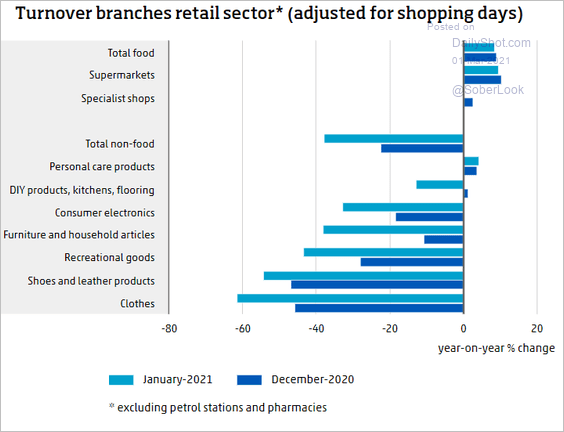 Source: CBS
——————–
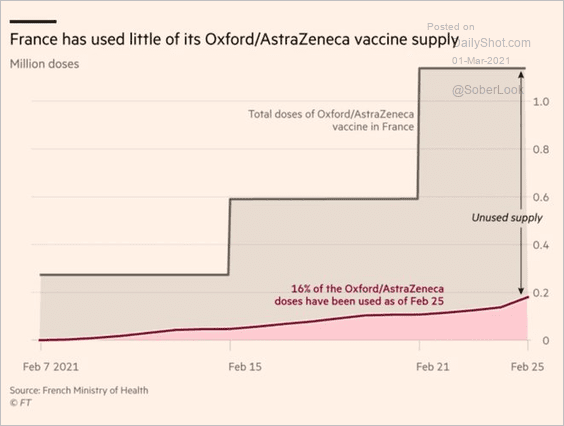
4. France is lagging in its vaccination efforts.
 Source: @adam_tooze, @FT Read full article
5. Will the ECB allow yield curve steepening that occurred in the US?
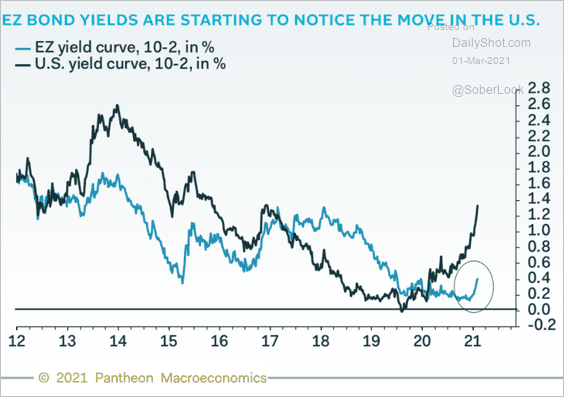 Source: Pantheon Macroeconomics
Back to Index
Europe
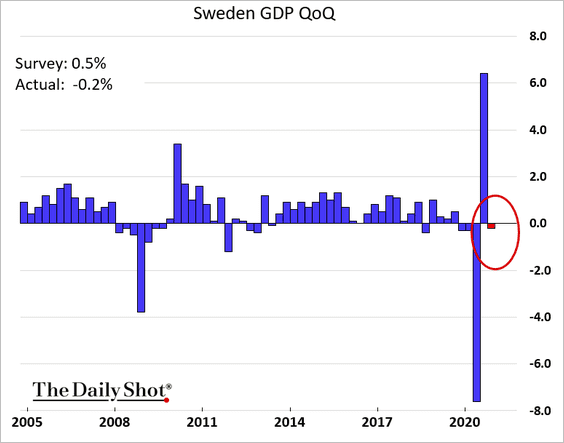
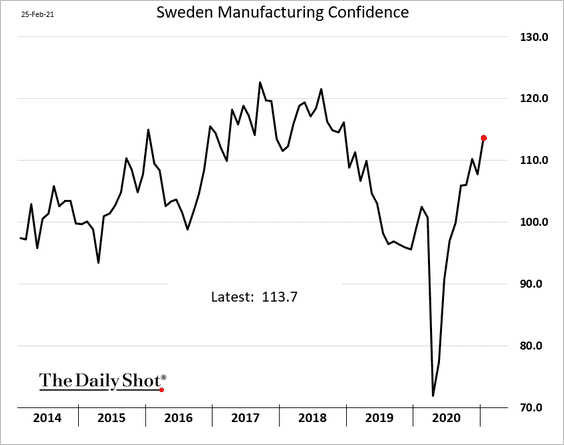
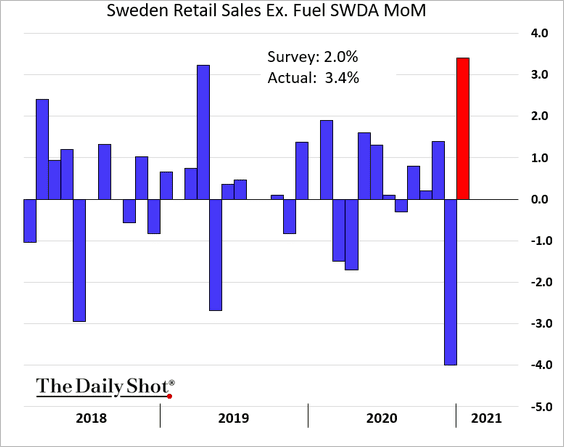
1. Let’s begin with Sweden.
• The GDP unexpectedly declined last quarter.
• Manufacturing confidence continues to recover.
• Retail sales jumped in January.
——————–
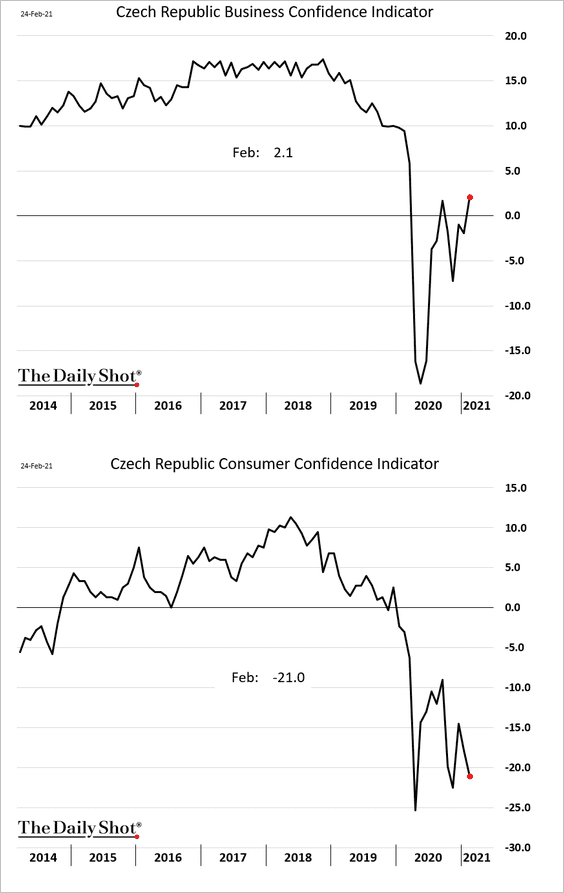
2. Czech business and consumer confidence indices have diverged.
3. Which countries have the highest inflation in the EU?
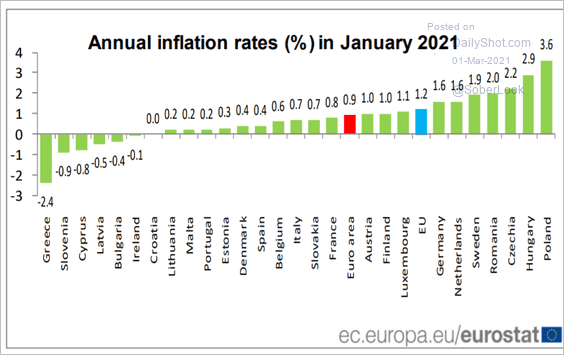 Source: Eurostat Read full article
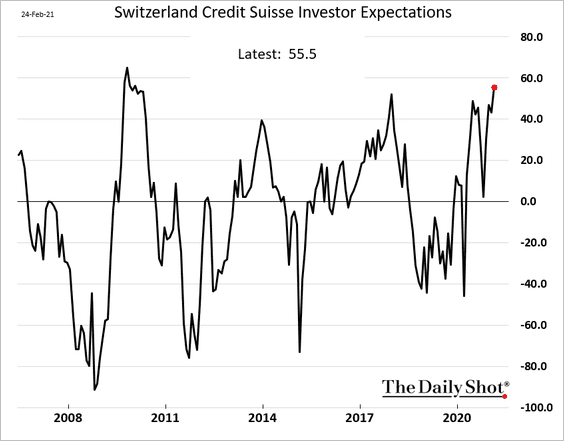
4. Swiss investor expectations have rebounded.
5. Here is the February attribution of European stock returns by country.
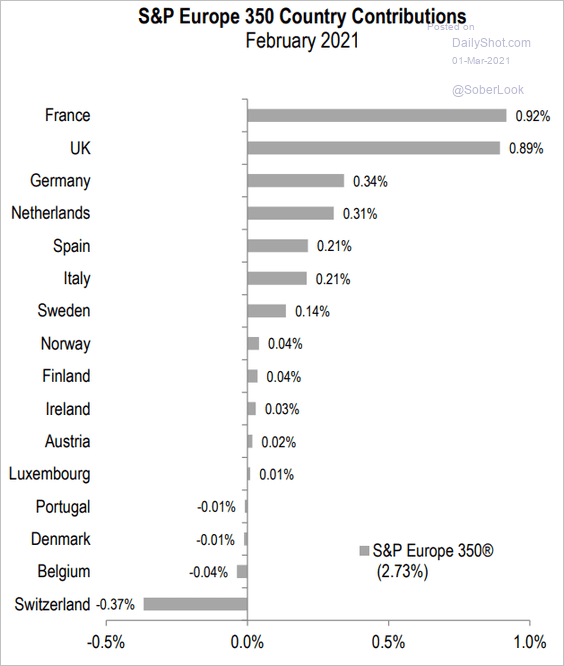 Source: S&P Global Market Intelligence
6. EU’s in-store foot traffic is starting to recover.
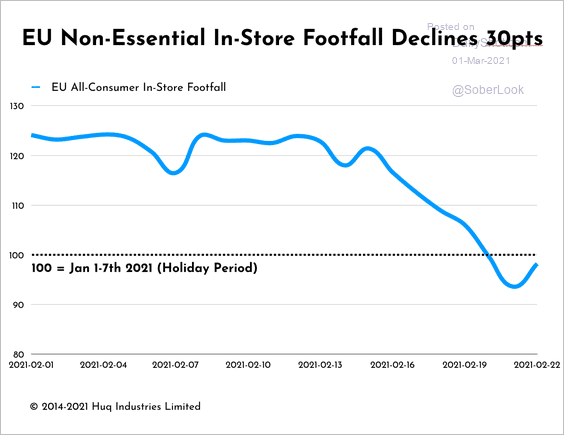 Source: Huq Read full article
Back to Index
Australia
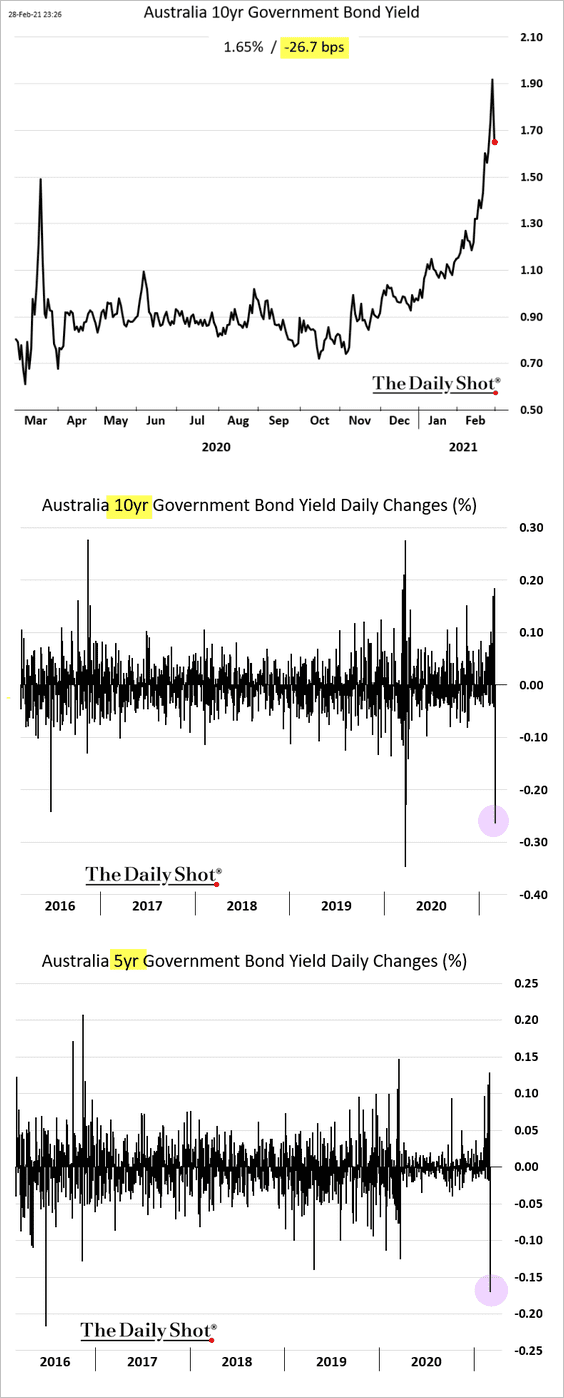
1. The RBA responded to the bond selloff, …
 Source: Financial Review Read full article
… pushing yields sharply lower. This action contributed to bond yield stabilization globally.
——————–
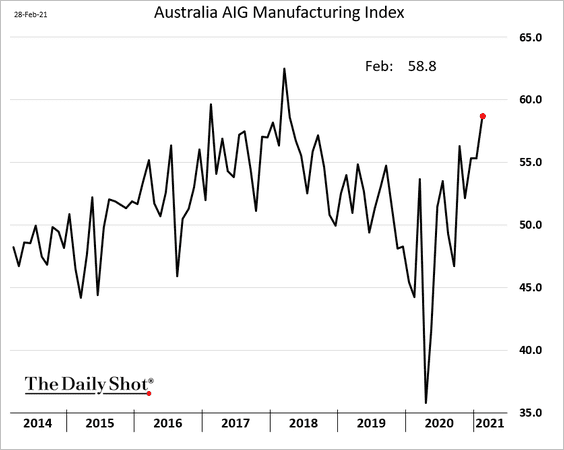
2. According to Ai Group’s index, factory activity accelerated in February.
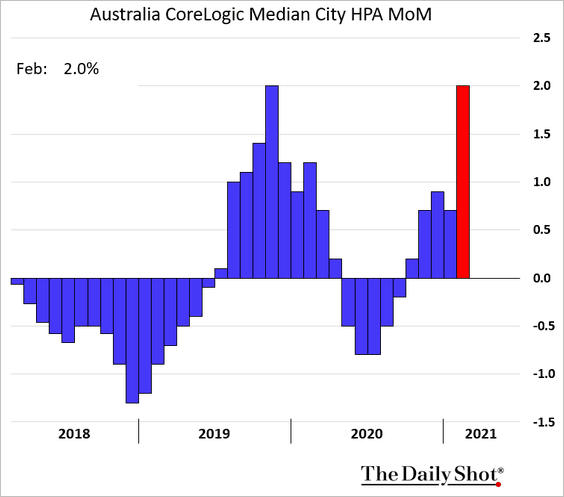
3. Lending to households has gone parabolic amid demand for homes.
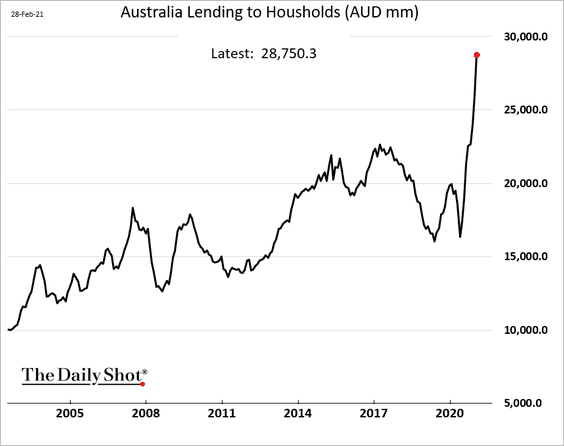
Home prices jumped 2% in February (month-over-month).
——————–
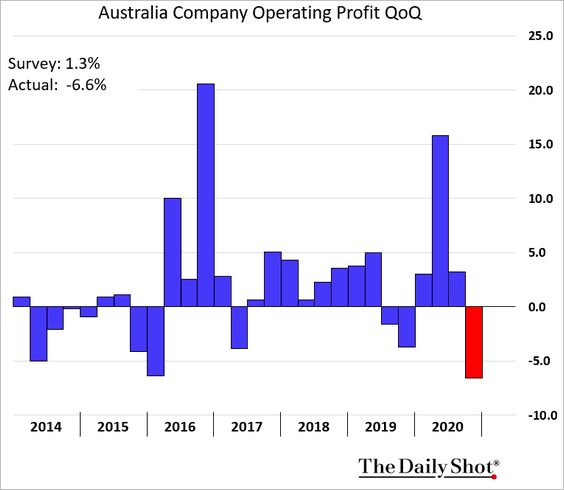
4. Corporate profits unexpectedly dropped last quarter.
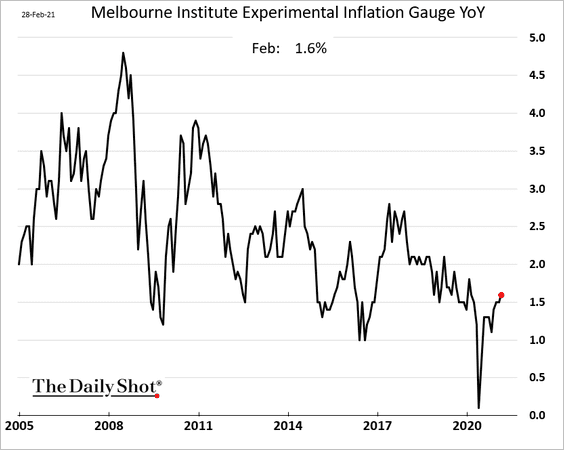
5. The Melbourne Institute inflation measure is grinding higher.
6. Job openings continue to rise.
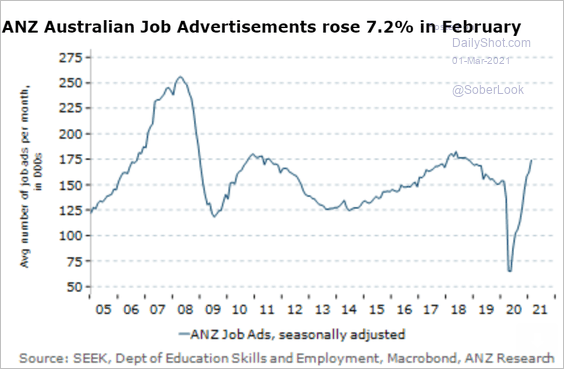 Source: ANZ Research
7. China represents a substantial share of Australia’s exports.
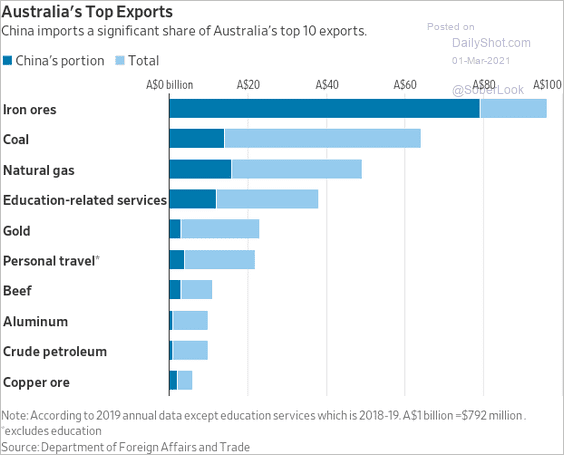 Source: @WSJ Read full article
8. China’s investment in Australia has been slowing.
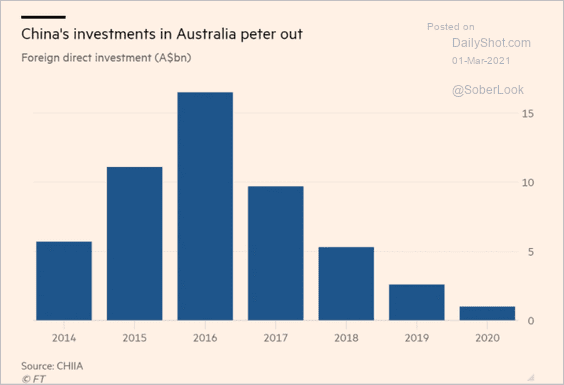 Source: @financialtimes Read full article
Back to Index
China
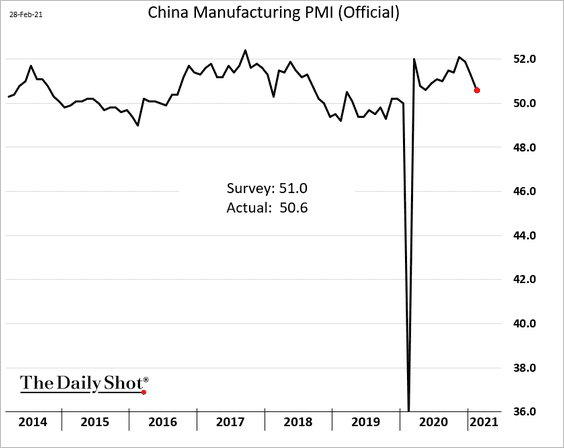
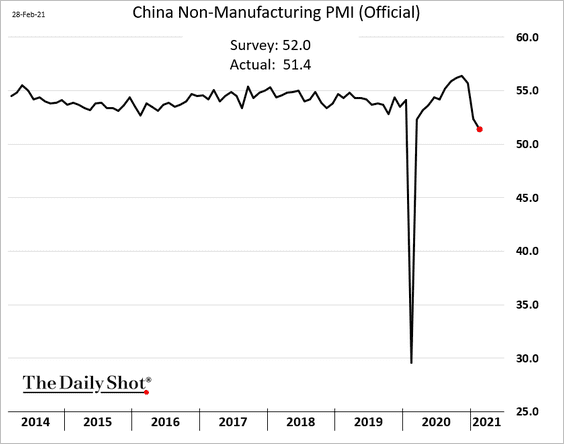
1. Business activity continued to expand during the holidays but at a slower pace.
——————–
2. Semiconductor sales are moderating along with manufacturing PMI.
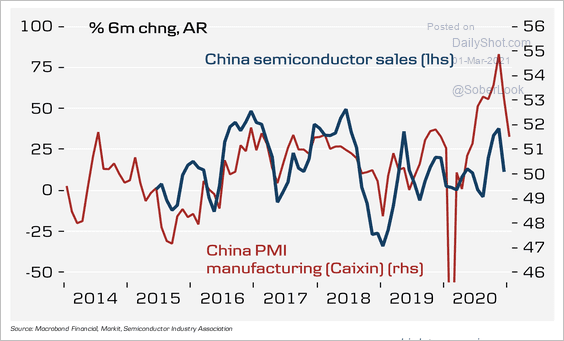 Source: Danske Bank
China’s manufacturing PMI has diverged from Taiwan’s PMI.
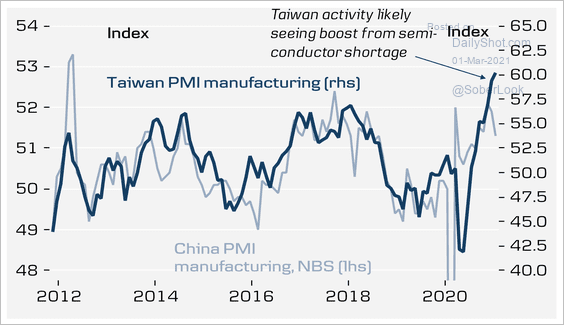 Source: Danske Bank
——————–
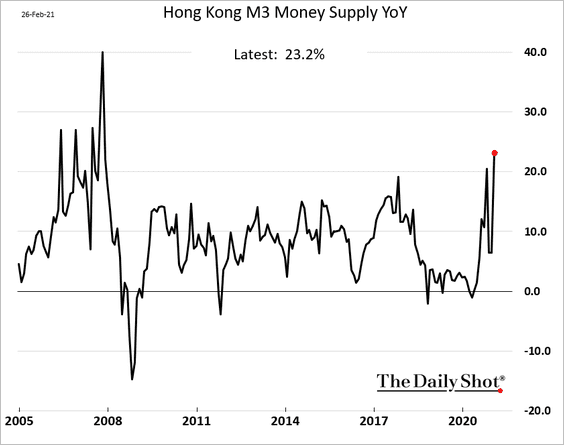
3. Hong Kong’s money supply growth hit the highest level since 2008.
Back to Index
Emerging Markets
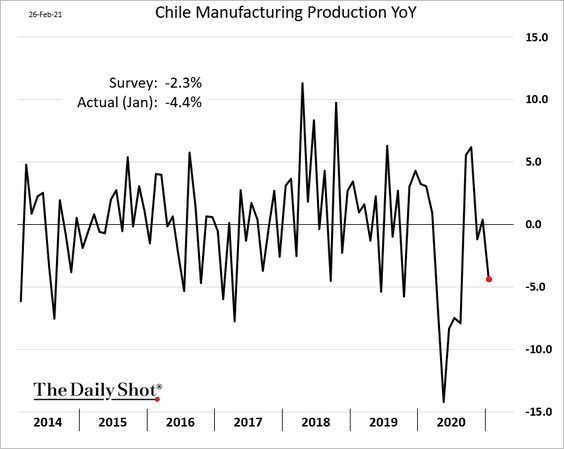
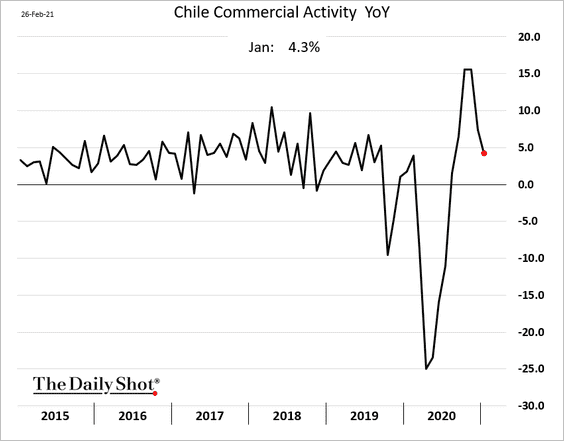
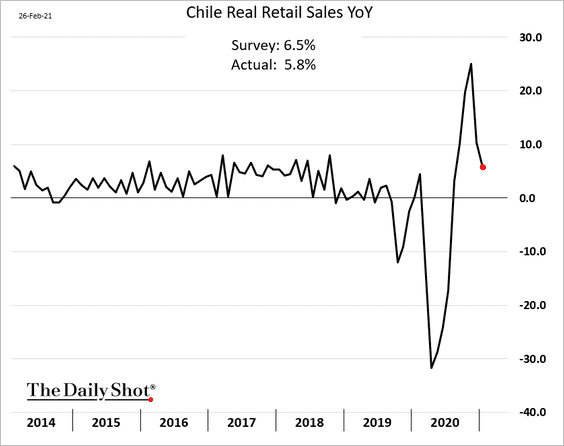
1. Let’s begin with Chile, where the economy lost some momentum in January.
• Manufacturing output:
• Commercial activity:
• Retail sales:
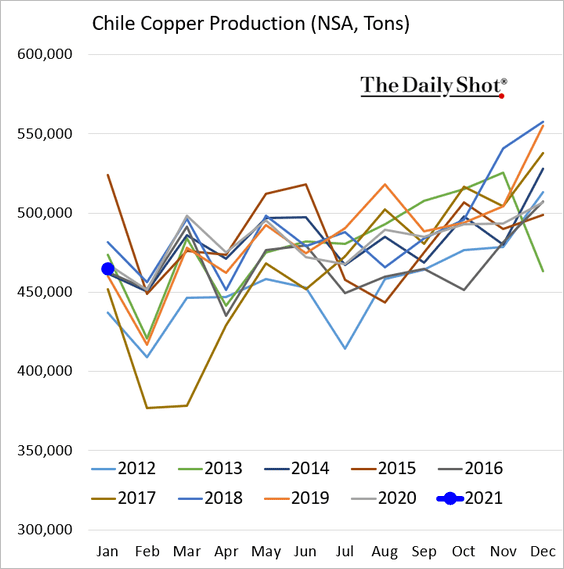
This chart shows Chile’s copper production relative to previous years.
——————–
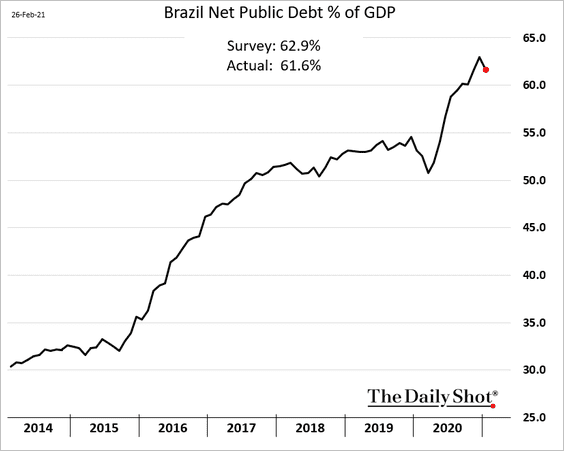
2. Brazil’s debt-to-GDP ratio unexpectedly turned lower.
3. Mexico’s economy continues to recover.
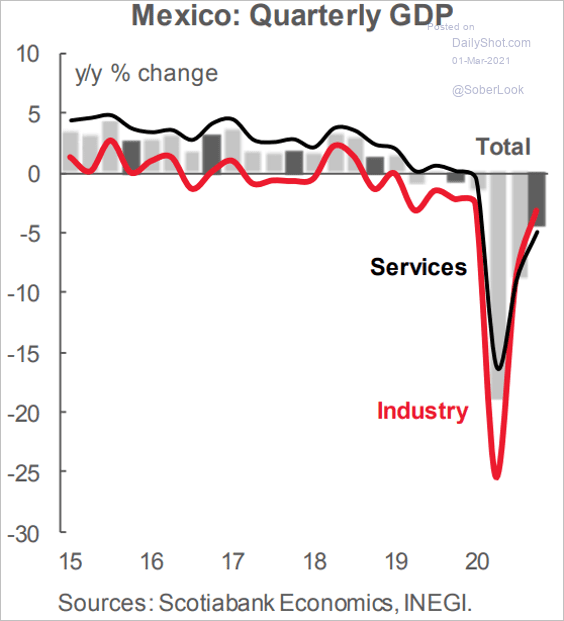 Source: Scotiabank Economics
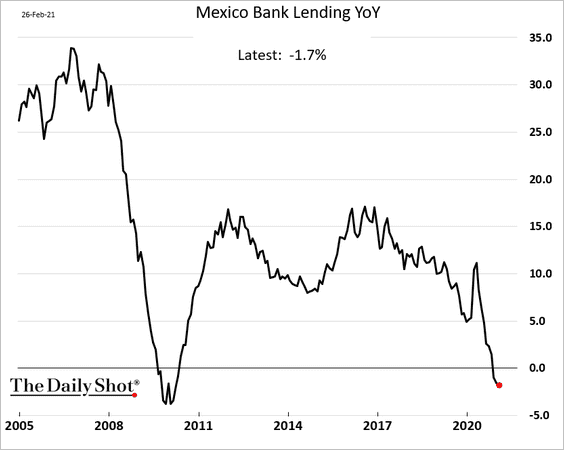
Loan growth is still in negative territory.
——————–
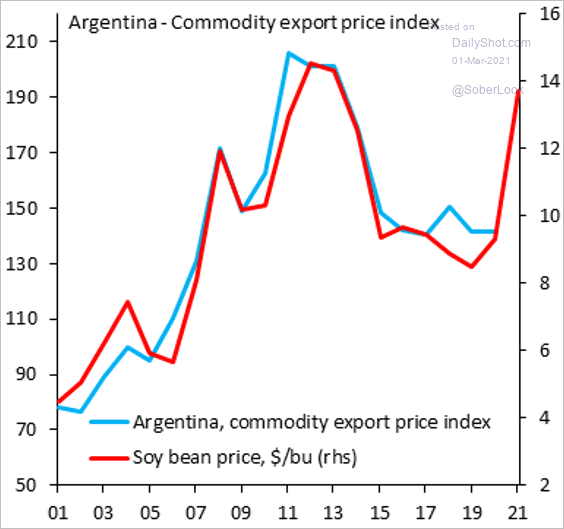
4. Higher soybean prices should help Argentina’s recovery.
 Source: @SergiLanauIIF
5. South Africa’s January budget deficit was substantially worse than markets were expecting.
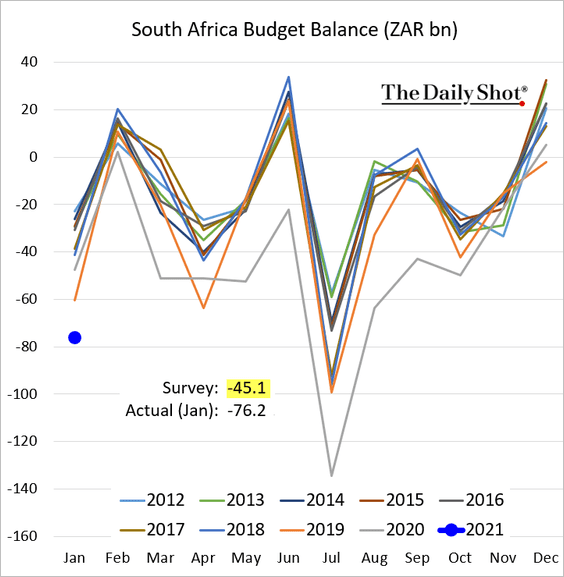
But debt projections are looking more upbeat.
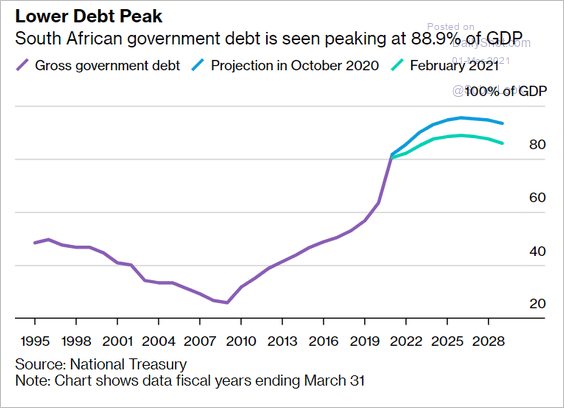 Source: @bpolitics Read full article
——————–
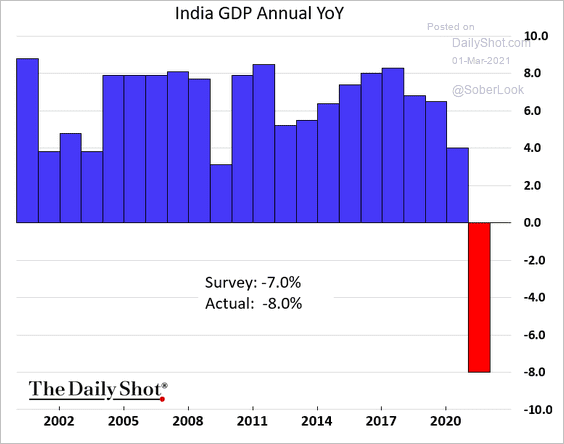
5. India has pulled out of recession, …
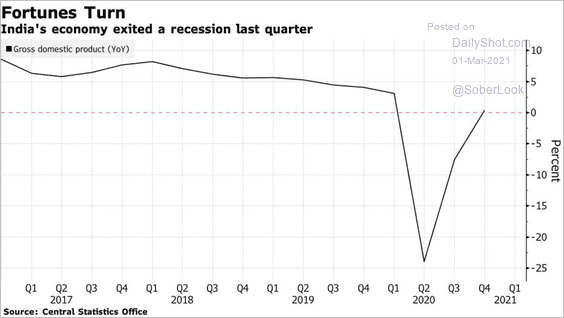 Source: @bpolitics Read full article
… after a rough year (chart shows fiscal years).
 Source: @jessefelder, @AndreasSteno, @enlundm Read full article
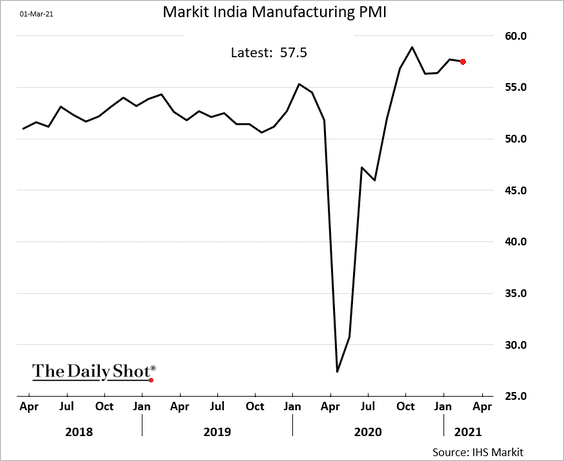
Manufacturing activity held up well in February.
——————–
6. The latest bond rout’s impact on EM assets wasn’t too severe.
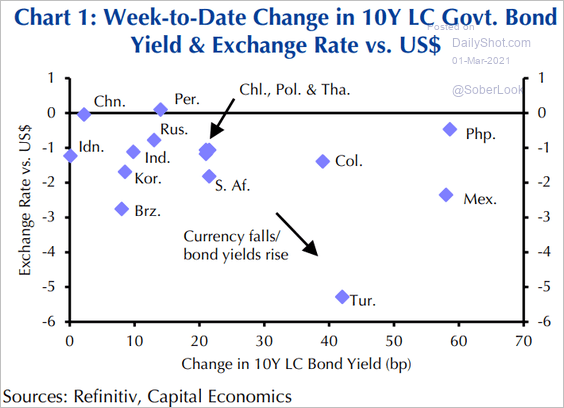 Source: Capital Economics
Back to Index
Cryptocurrency
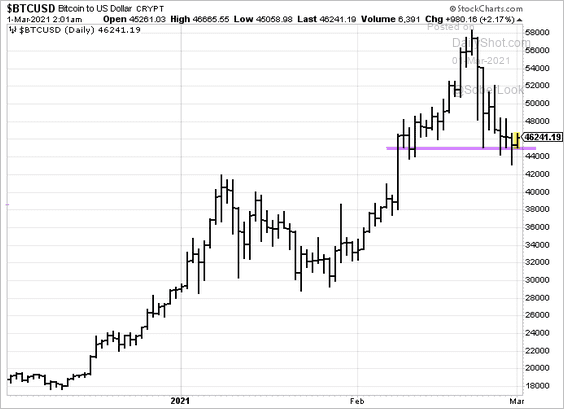
1. Bro, please don’t sell Bitcoin …
 Source: @RyanWatkins_
The market heard you. Support held over the weekend.
——————–
2. Robinhood now has millions of crypto traders.
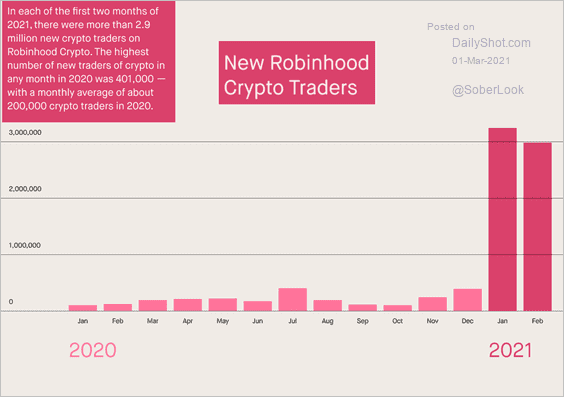 Source: Robinhood
3. Here is Bitcoin’s market cap as a percentage of total gold outstanding.
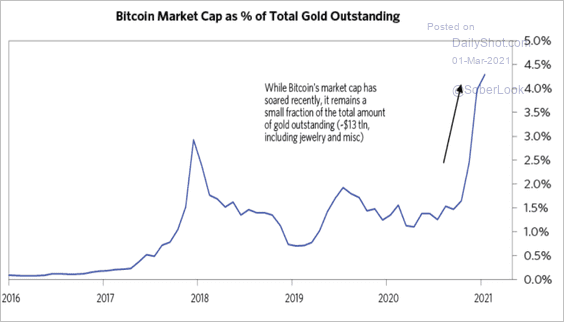 Source: Bridgewater Read full article
Back to Index
Energy
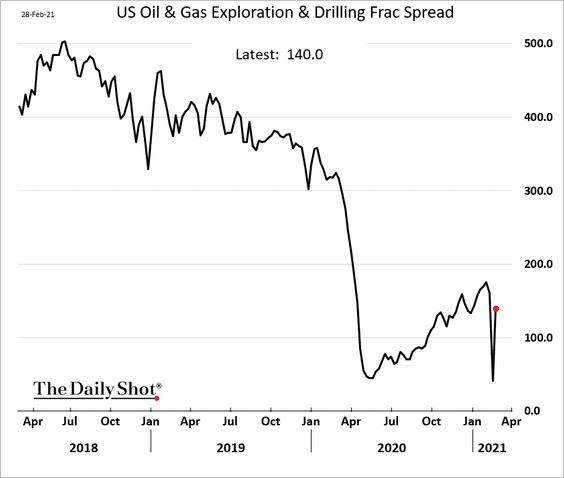
1. US Frac spread bounced last week after the weather-related disaster.
2. Higher oil prices could encourage more drilling activity.
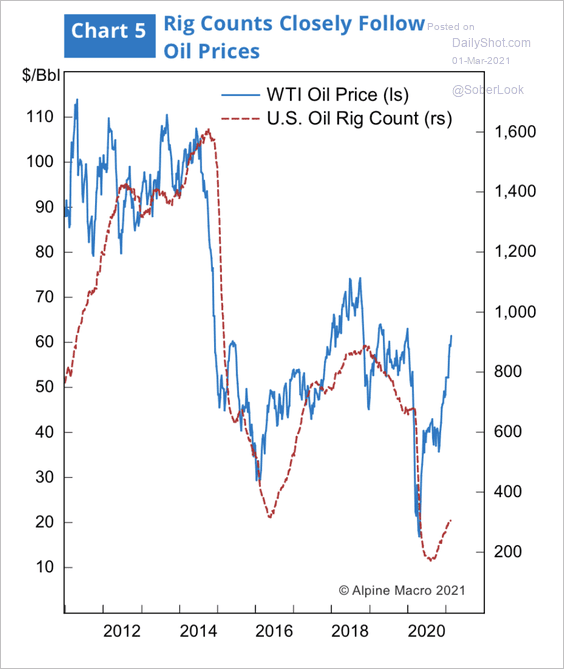 Source: Alpine Macro
3. Oil inventories are expected to head much lower.
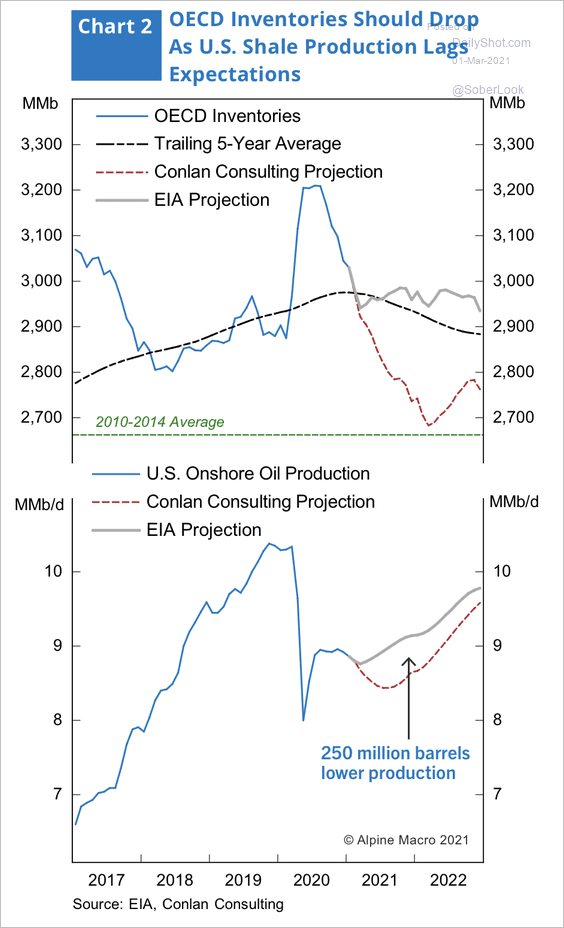 Source: Alpine Macro
4. Arbor Data Science estimate points to a WTI crude oil price above $80.
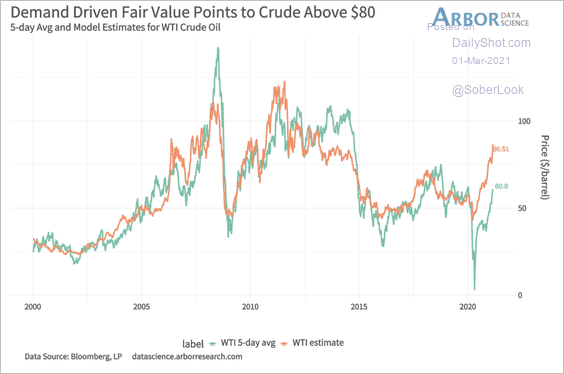 Source: Arbor Research & Trading
5. Here is the breakdown of US crude oil production.
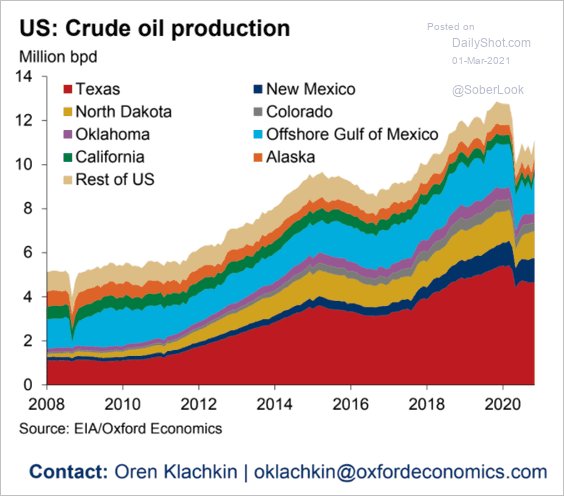 Source: Oxford Economics
6. After massive underperformance in 2020, fossil fuel energy shares outperformed “clean energy” this year.
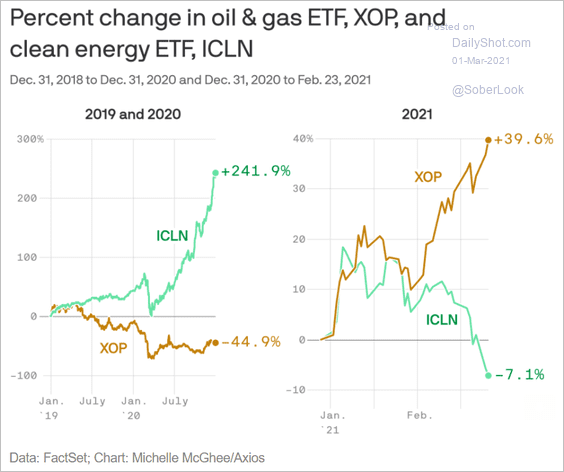 Source: @axios Read full article
Back to Index
Equities
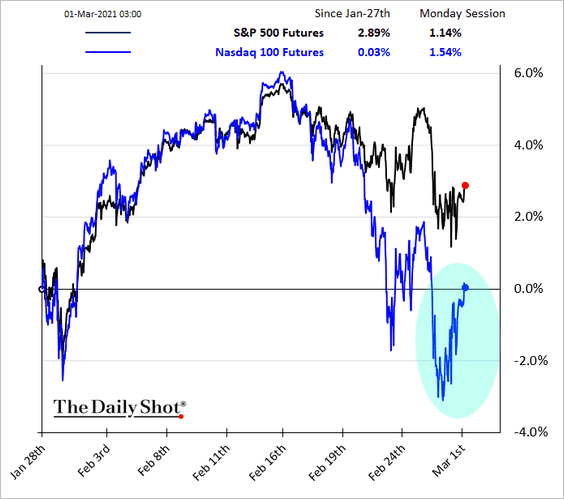
1. Bonds are firmer this morning, helped in part by RBA’s action (see Australia). As discussed last week (#2 here), Treasuries now look attractive to foreign investors.
Stock futures are rebounding.
——————–
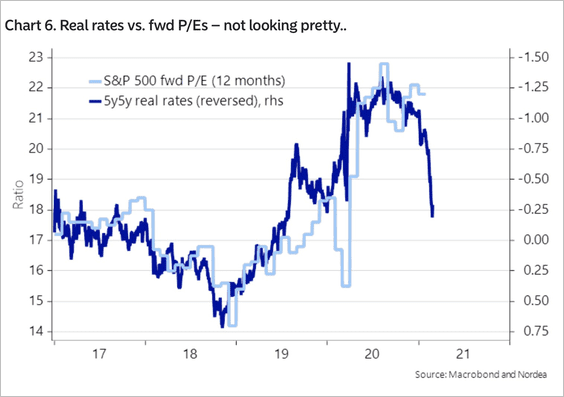
2. Higher real rates point to declines in the S&P 500 forward P/E ratio (either better earnings or lower stock prices).
3. Additional US stimulus will further boost savings, some of which will be going into the market.
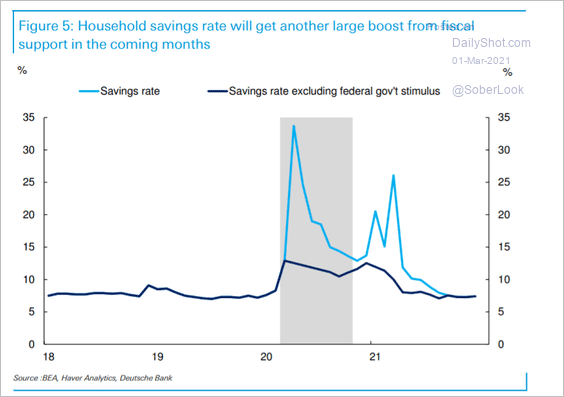 Source: Deutsche Bank Research
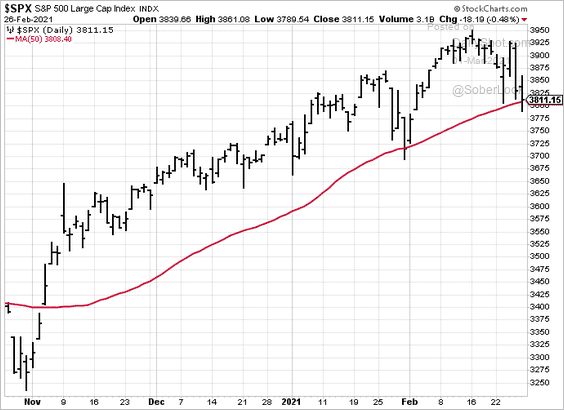
4. The S&P 500 held support at the 50-day moving average.
5. Will higher inflation push the correlation between stocks and bond yields back into negative territory?
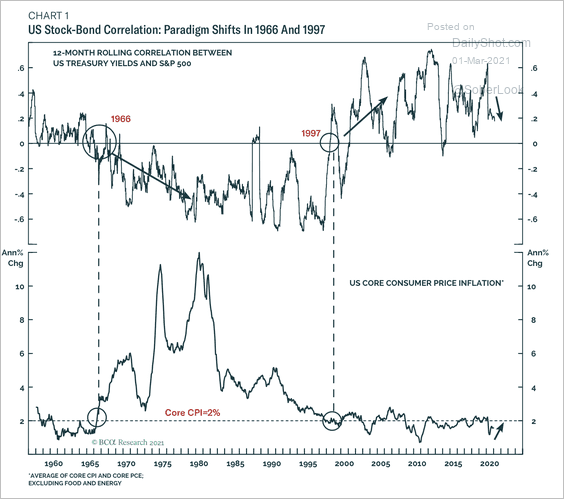 Source: BCA Research
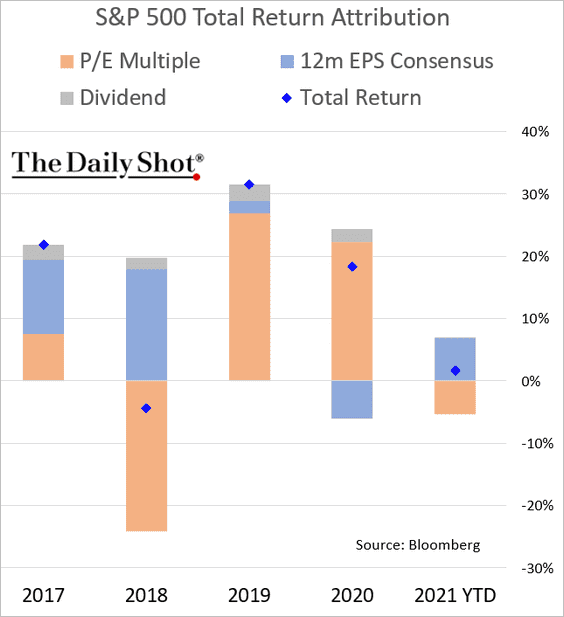
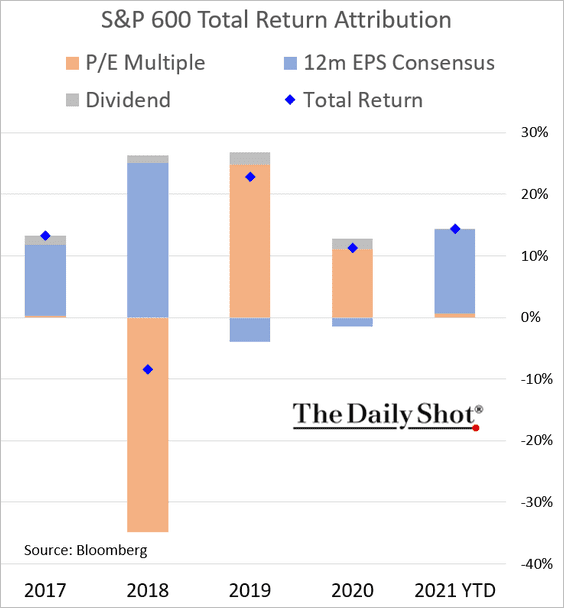
6. Next, we have some performance attribution data.
• S&P 500:
• S&P 600 (small caps):
And this chart shows the attribution by sector for February.
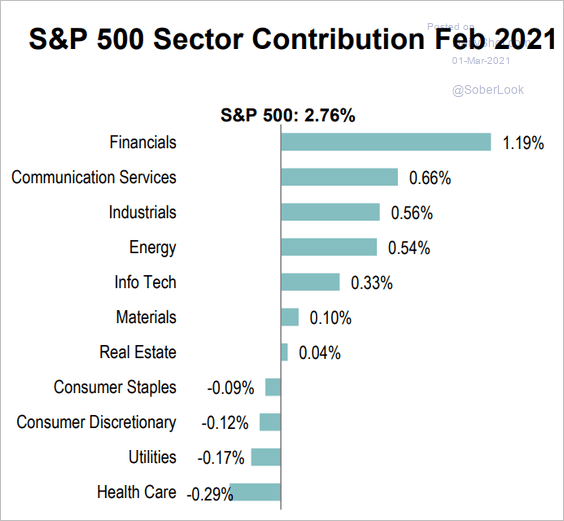 Source: S&P Global Market Intelligence
——————–
7. How did profit margins change last year (by sector)?
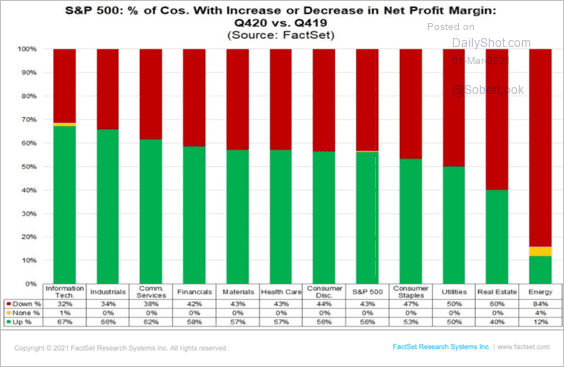 Source: @FactSet
Back to Index
Rates
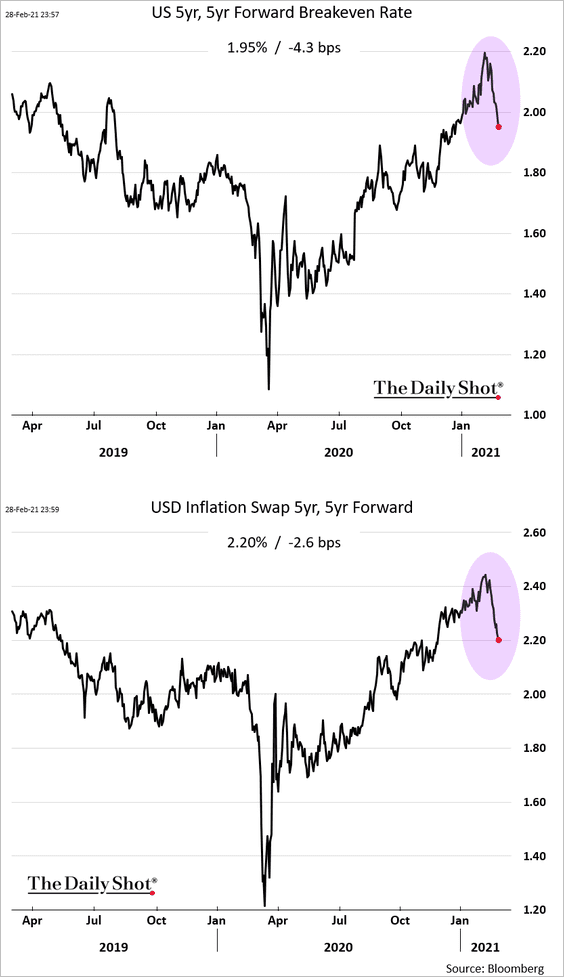
1. Longer-term inflation expectations have been falling. The market expects the Fed to push inflation lower in the long run.
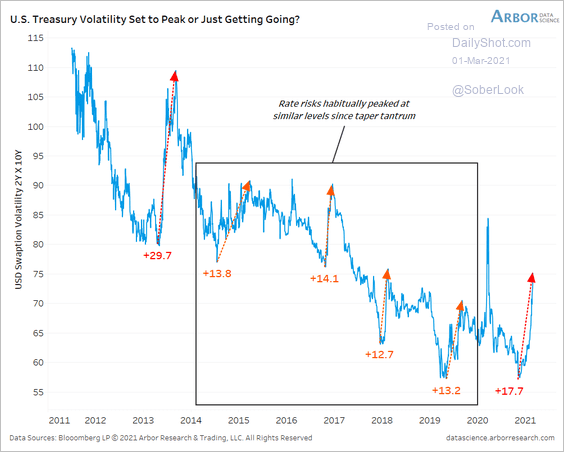
2. Rates implied volatility may have peaked for now.
 Source: Arbor Research & Trading
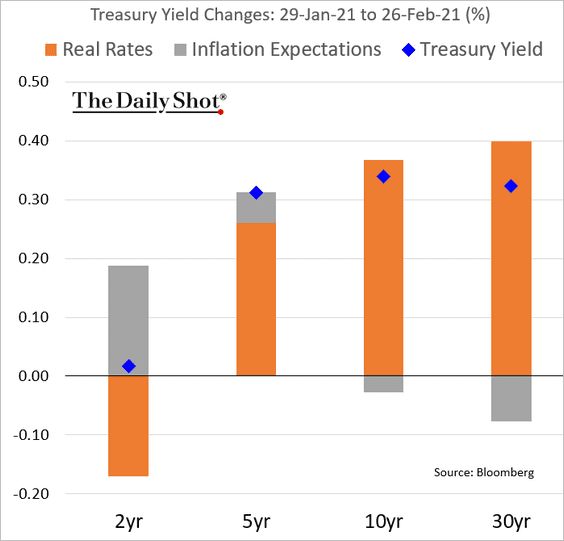
3. Next, we have the Treasury yield attribution chart for February: real rates vs. inflation expectations.
Back to Index
Global Developments
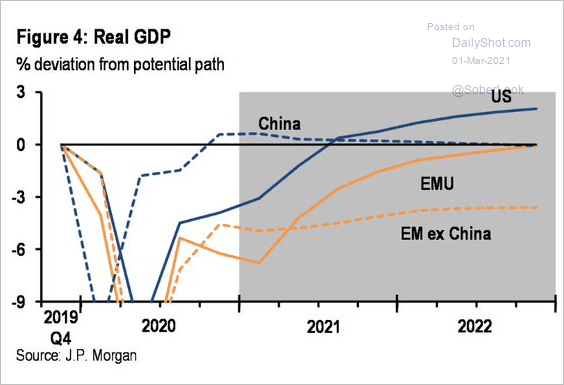
1. Will the US economy outperform China’s growth relative to the potential GDP path?
 Source: JP Morgan, @dlacalle_IA
2. How effective are central banks’ policies?
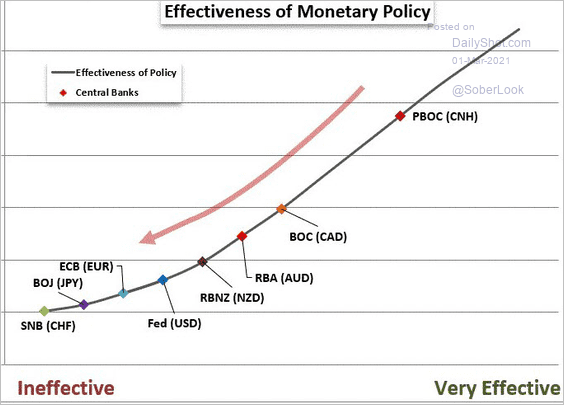 Source: @JohnKicklighter
——————–
Food for Thought
1. Union membership in the US:
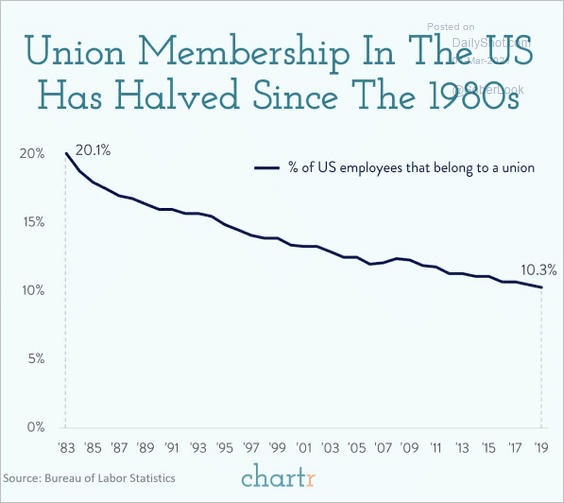 Source: @chartrdaily
2. Poverty rate:
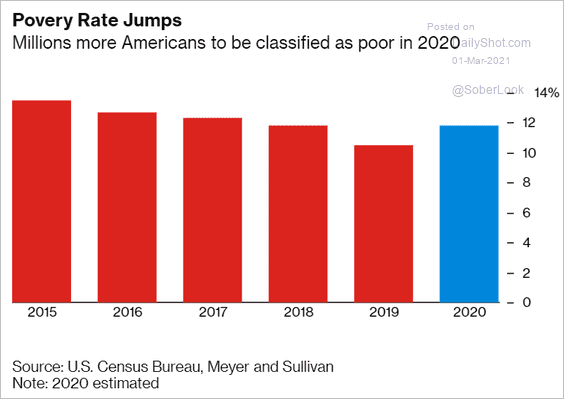 Source: @bpolitics Read full article
3. US private prison population:
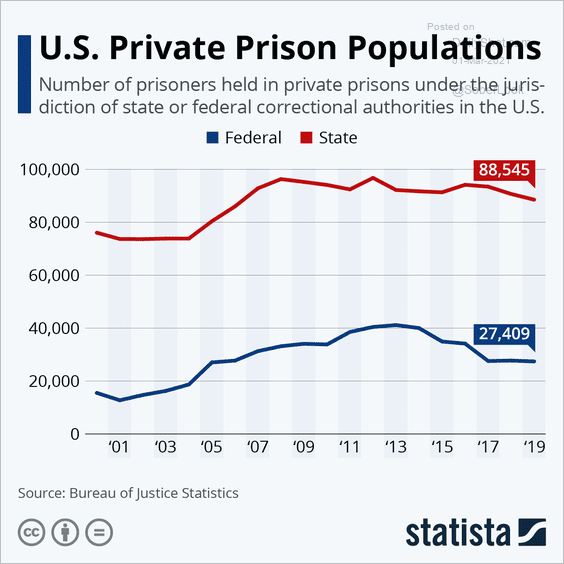 Source: Statista
4. Trust in traditional media:
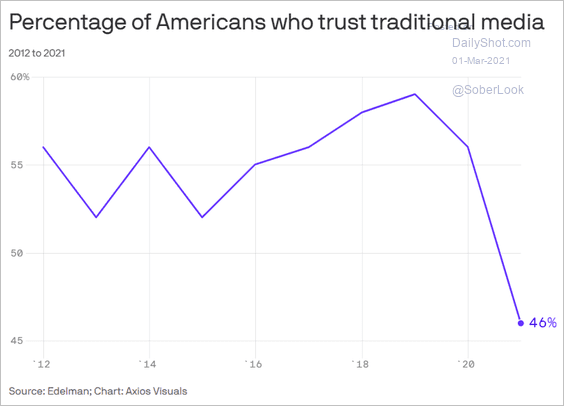 Source: @axios Read full article
5. State governor ratings:
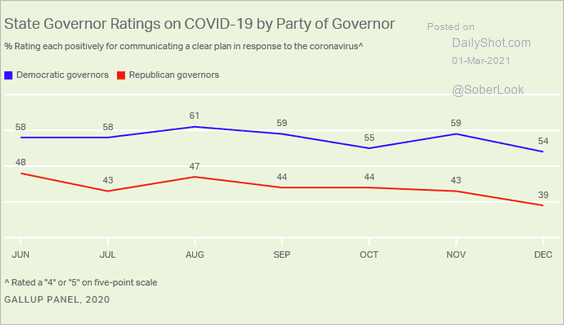 Source: Gallup Read full article
6. Freedom of Information Act requests:
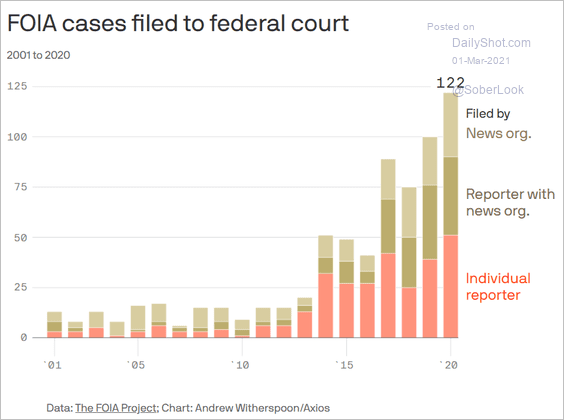 Source: @axios Read full article
7. Mexico’s birth rate:
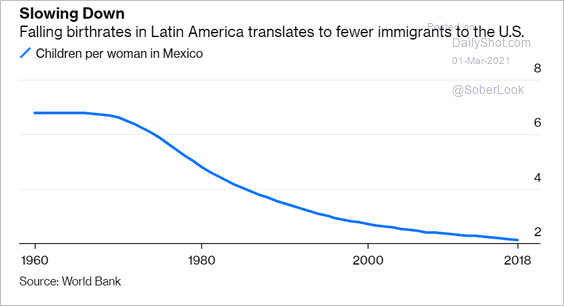 Source: @Noahpinion, @bopinion Read full article
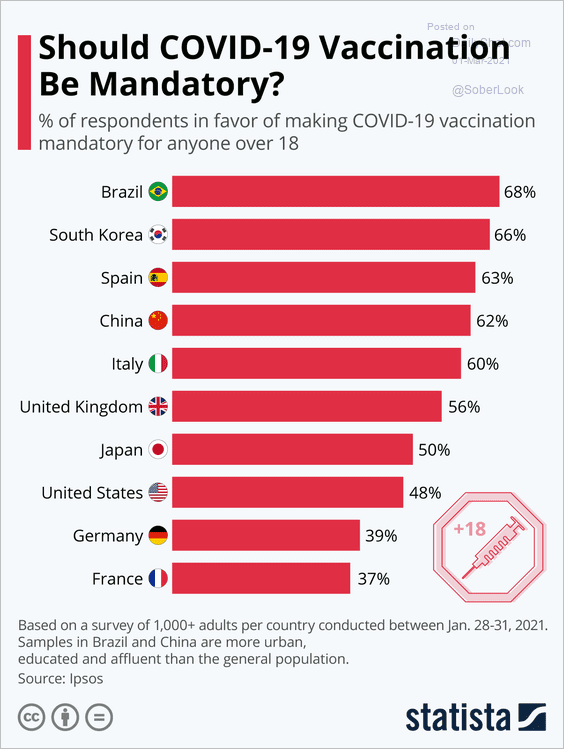
8. Should vaccination be mandatory?
 Source: Statista
9. Actual vs. perceived relative income (people generally think their income percentile is lower than it is):
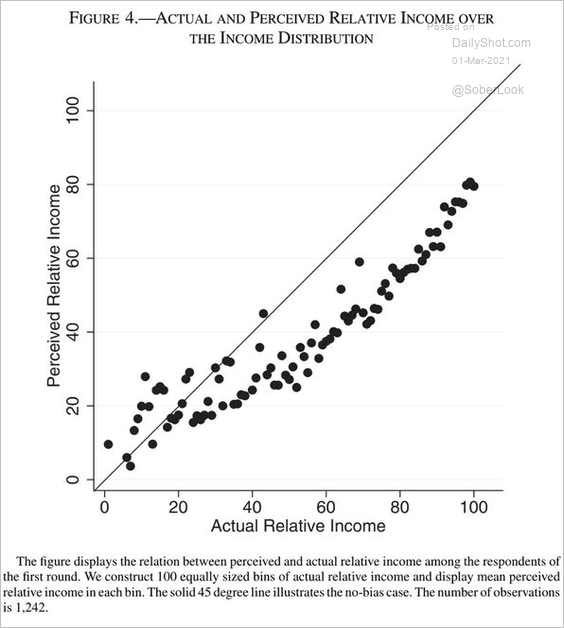 Source: Mounir Karadja, Johanna Mollerstrom, and David Seim, Review of Economics and Statistics – June 2016
10. US sales of sweets are up sharply since the start of the pandemic. This year, it’s about frozen desserts.
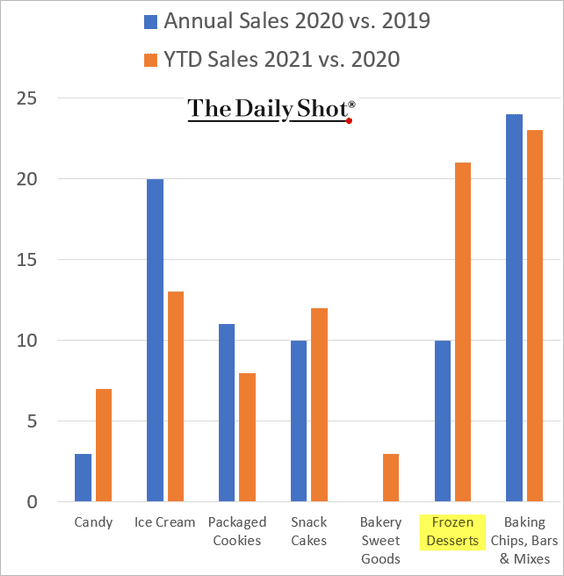 Source: Numerator, h/t Nancy Moran Read full article
——————–
Back to Index