
The Daily Shot: 09-Aug-21
• The United States
• Canada
• The United Kingdom
• The Eurozone
• Europe
• Asia – Pacific
• China
• Emerging Markets
• Cryptocurrency
• Commodities
• Energy
• Equities
• Rates
• Food for Thought
The United States
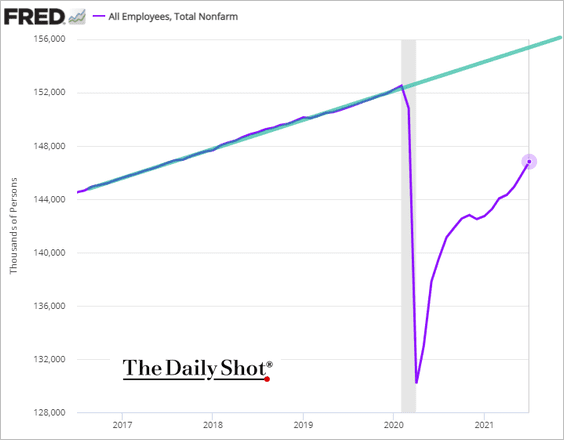
1. The July payrolls report topped market expectations, posting another strong month of job gains.
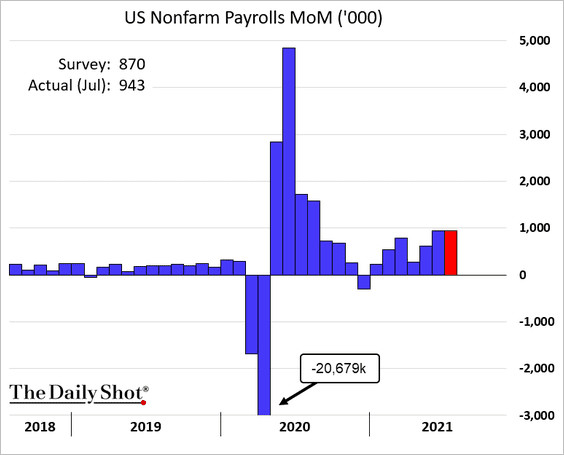
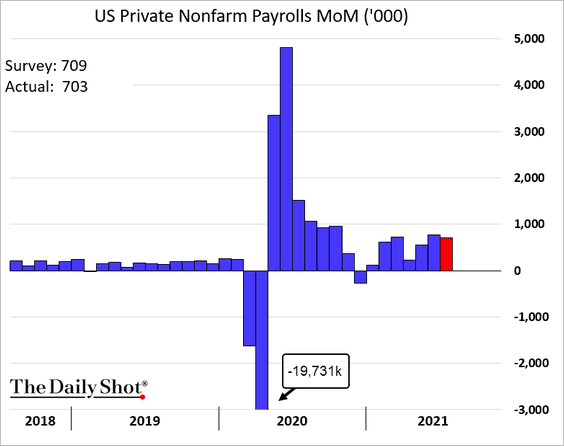
Private-sector job growth was in line with forecasts.
The surprise came from state and local hiring. Some of this is noise related to seasonal adjustments (teacher hiring didn’t follow the usual pattern last year). The total jobs figure, therefore, was distorted to the upside.
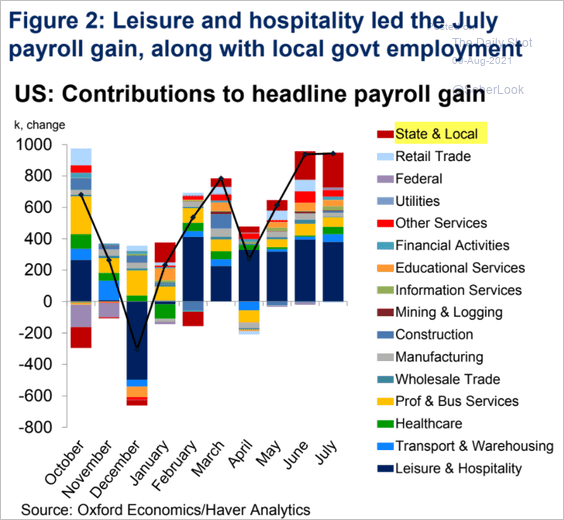 Source: Oxford Economics
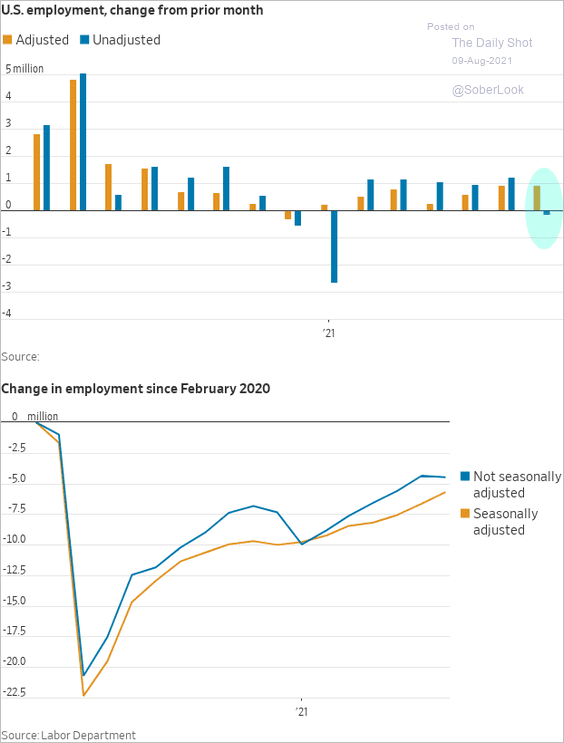
It’s worth noting that without seasonal adjustments, payrolls declined in July.
 Source: @WSJ Read full article
• It will be a while before employment returns to 2019 levels, let alone the pre-COVID trend.
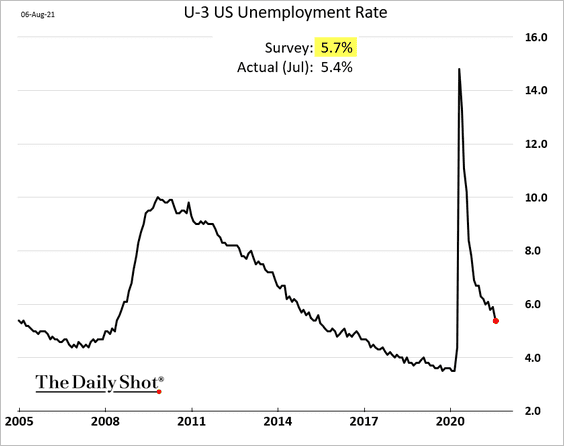
• The unemployment rate dropped more than expected.
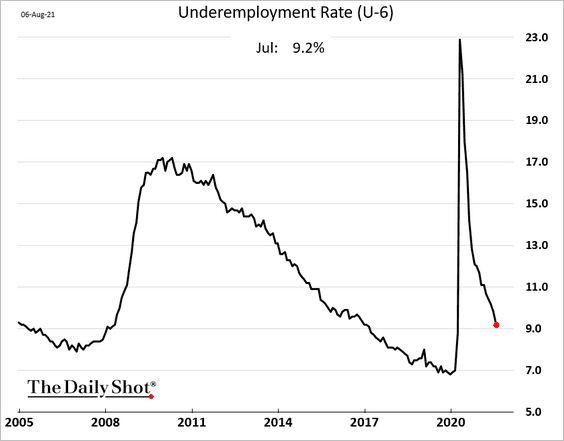
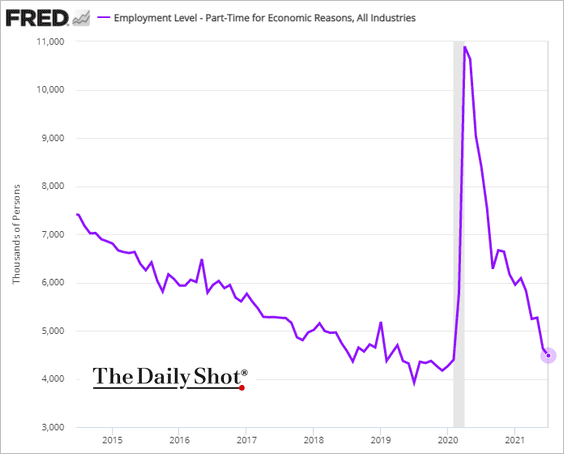
Underemployment indicators also declined.
– The underemployment rate (U-6):
– Part-time employment for economic reasons (almost back to pre-COVID levels):
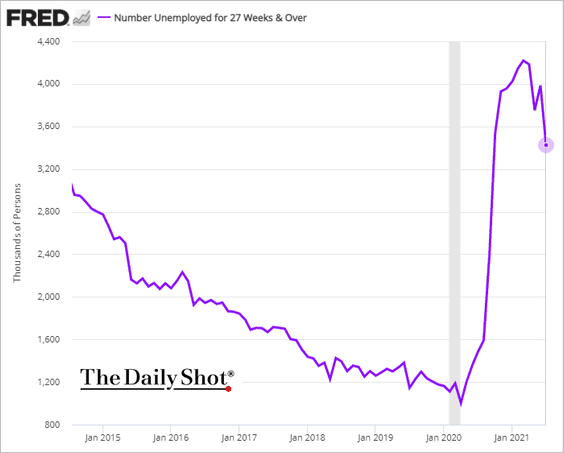
• Long-term unemployment is falling (in part due to some states terminating emergency benefits).
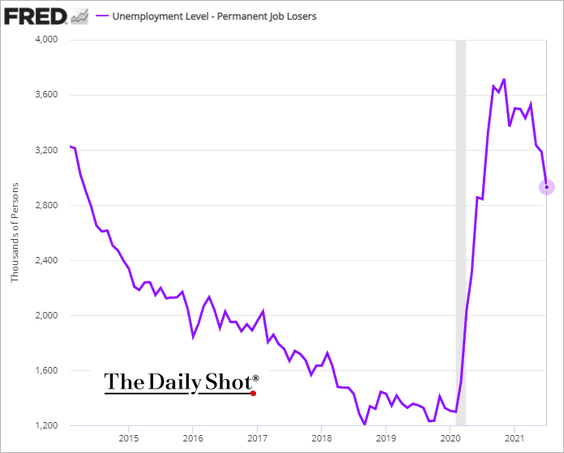
• The number of unemployed workers who experienced permanent job losses is dropping as well.
• Prime-age labor force participation is rebounding, but the total participation rate has stalled.
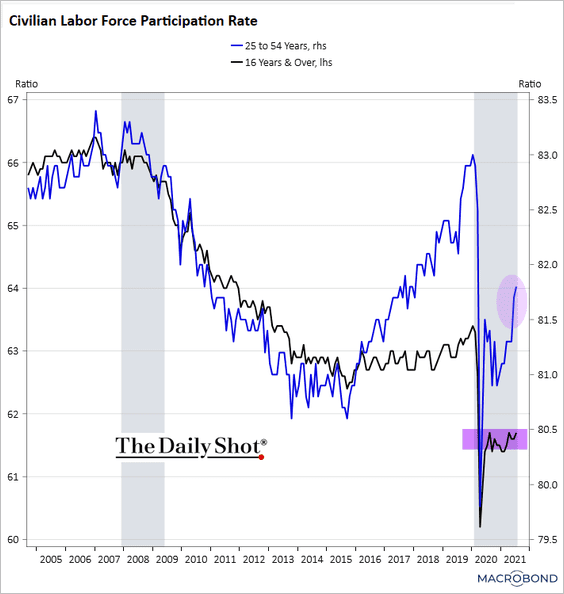 Source: Chart and data provided by Macrobond
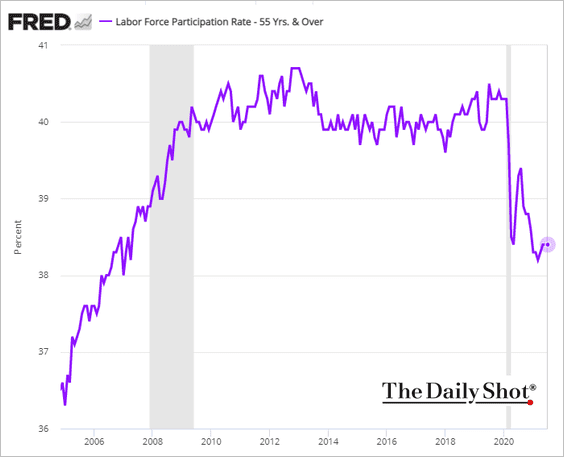
Labor force participation among Americans aged 55 and older remains depressed.
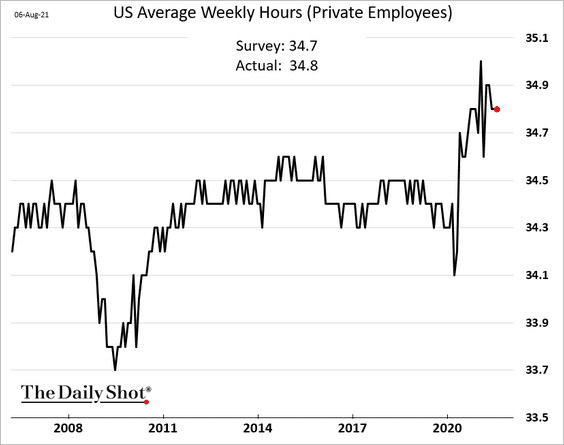
• Hours worked are still elevated.
• Leisure & Hospitality employment saw another significant gain, …
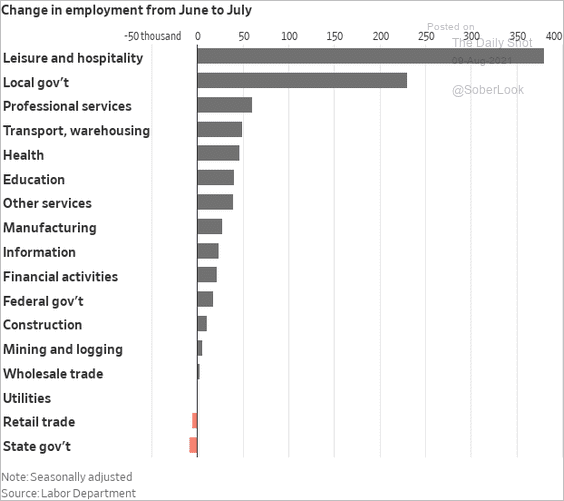 Source: @WSJ Read full article
… as employers boost wages.
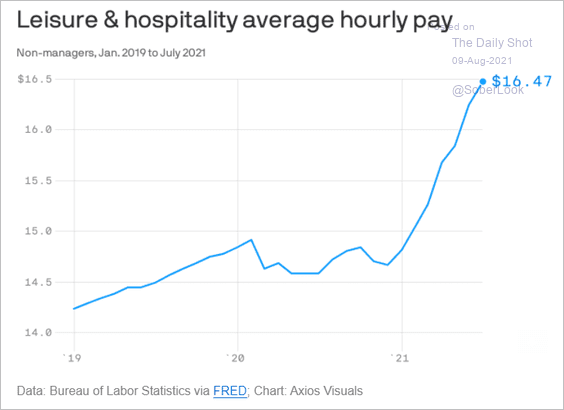 Source: @axios Read full article
Here are the leaders and laggards.
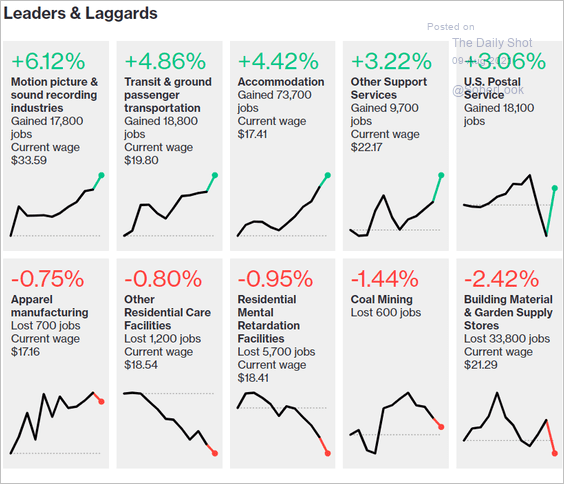 Source: @bbgvisualdata Read full article
——————–
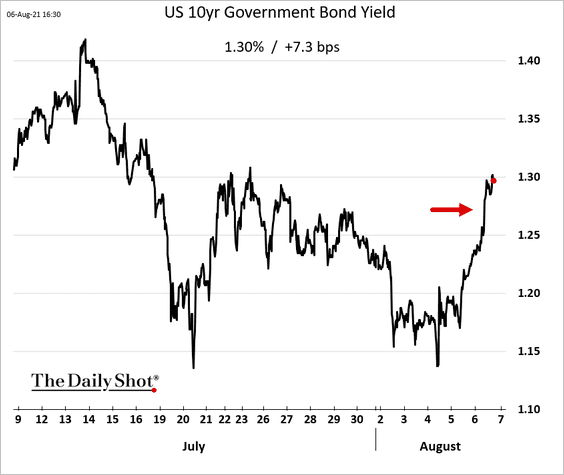
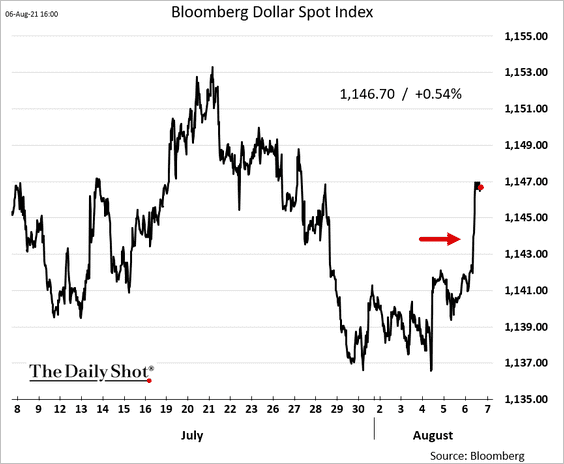
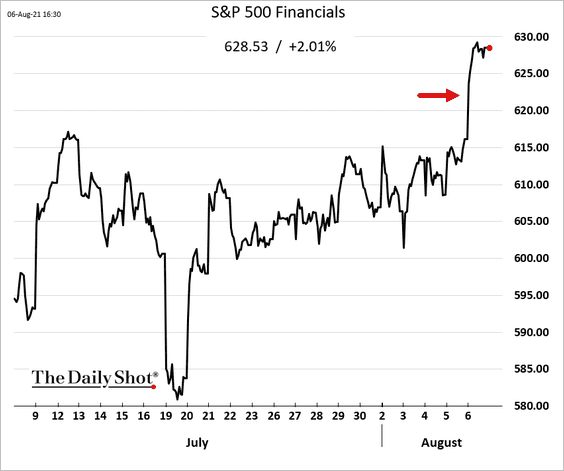
2. The payrolls surprise, especially the drop in the unemployment rate, sent Treasury yields and the US dollar higher.
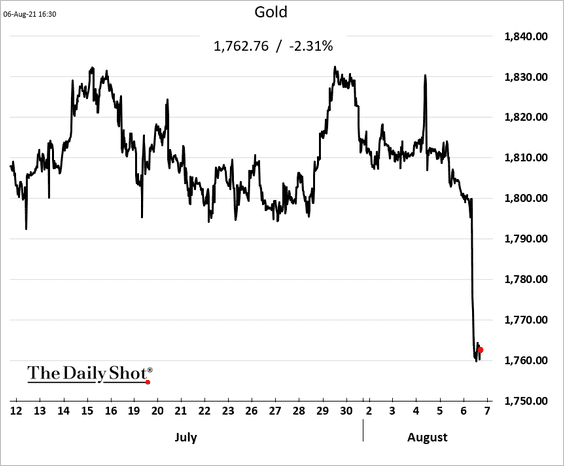
• Precious metals tumbled.
• The Nasdaq 100 was lower because high-growth stocks have been correlated to Treasury prices.
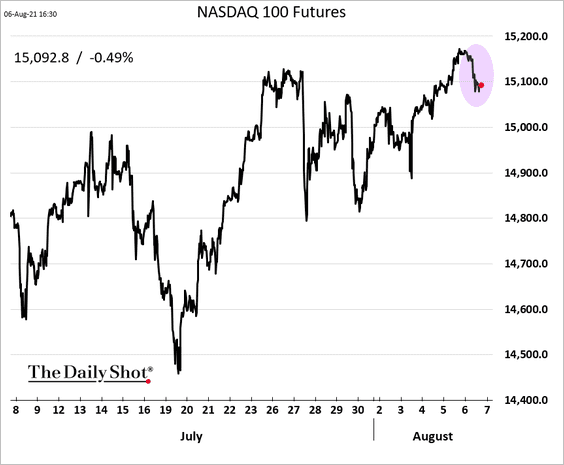
But financials surged because higher yields tend to benefit banks.
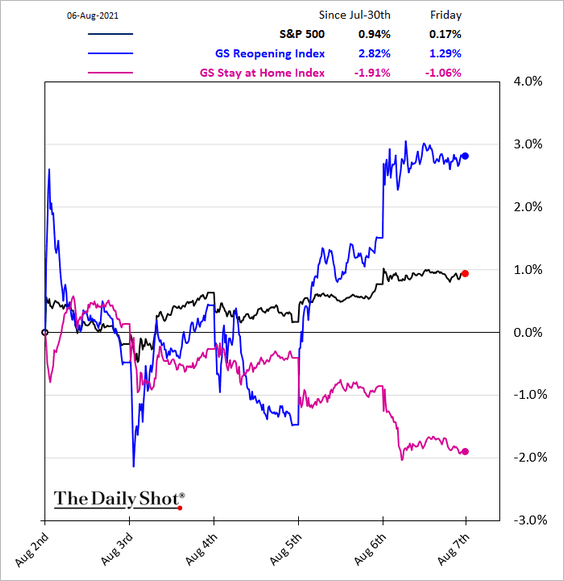
• In general, “reopening” stocks sharply outperformed “stay-at-home” shares.
——————–
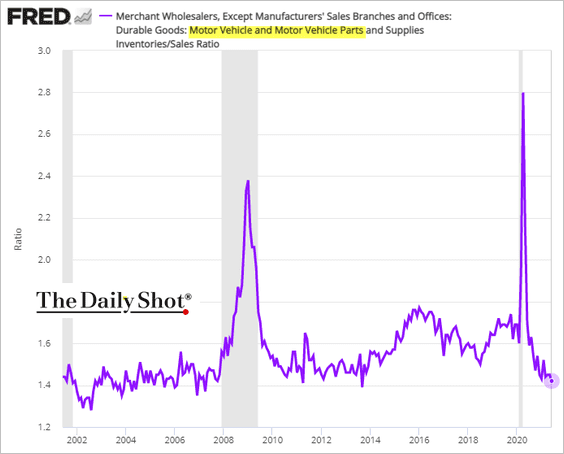
3. Businesses are still trying to rebuild inventories.
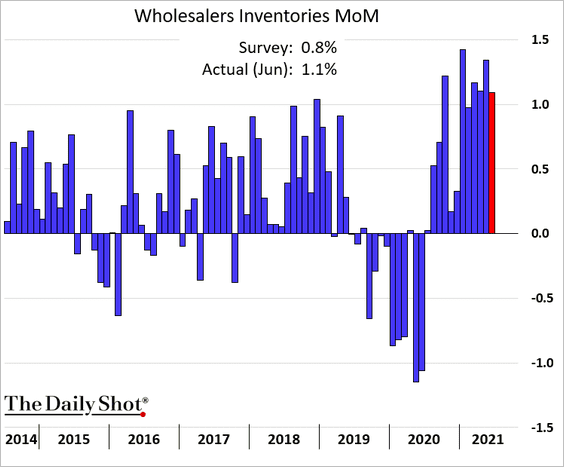
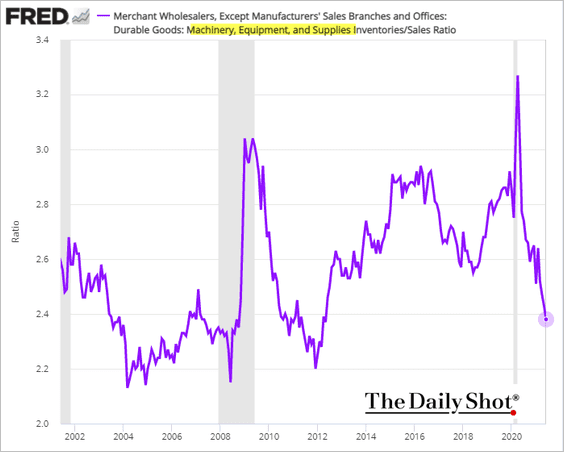
But inventories-to-sales ratios remain unusually low in some sectors.
• Capital goods:
• Automobiles and parts:
Businesses have increasingly been mentioning supply-chain challenges and labor shortages on earnings calls.
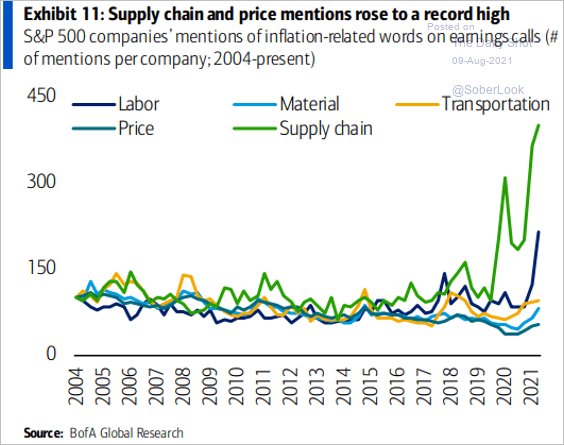 Source: BofA Global Research; @MrBlonde_macro
——————–
4. US freight rail traffic dipped below its multi-year range.
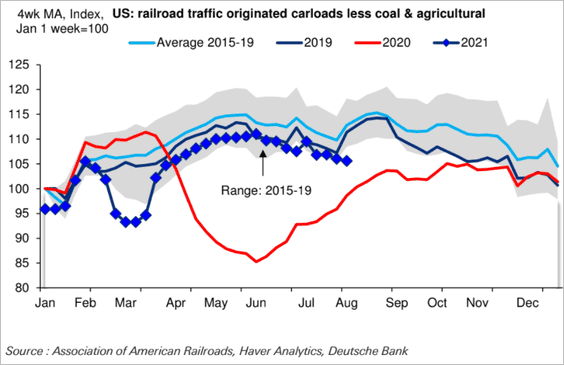 Source: Deutsche Bank
Part of the issue is shortages of crews.
 Source: @WSJ Read full article
——————–
5. Will the GDP trajectory mirror the 1990 recovery cycle?
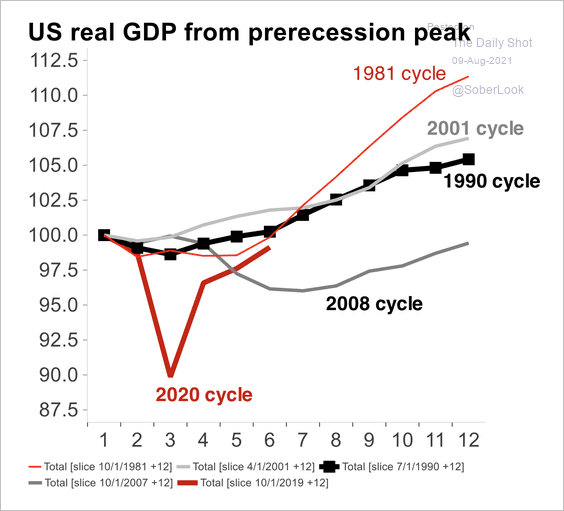 Source: Bain & Company
6. Finally, we have some updates on the pandemic.
• New cases/deaths:
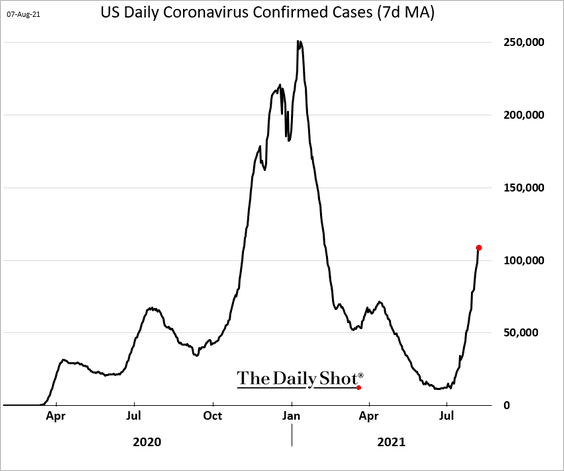
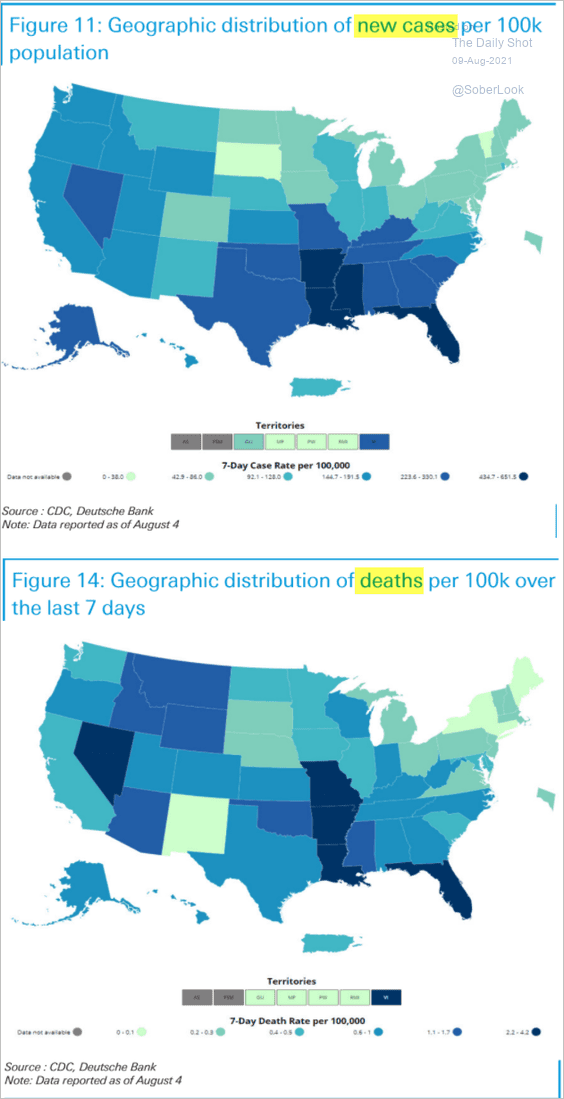 Source: Deutsche Bank Research
• Vaccination rates:
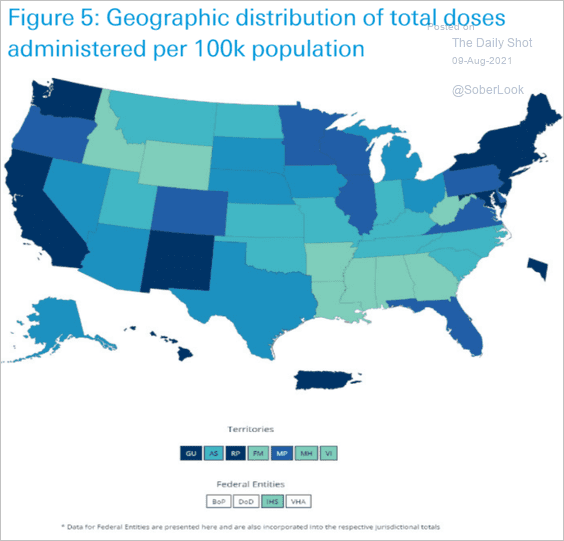 Source: Deutsche Bank Research
Back to Index
Canada
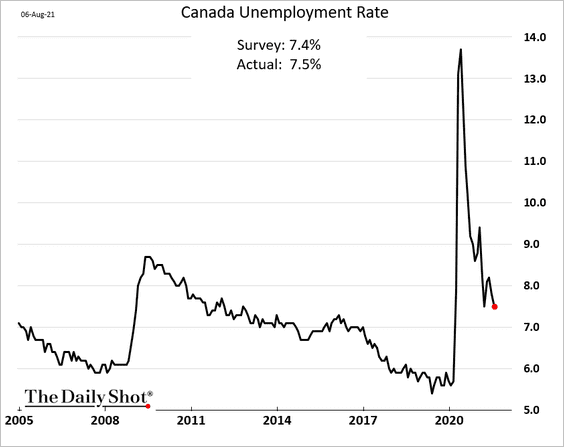
1. The July employment report was disappointing.
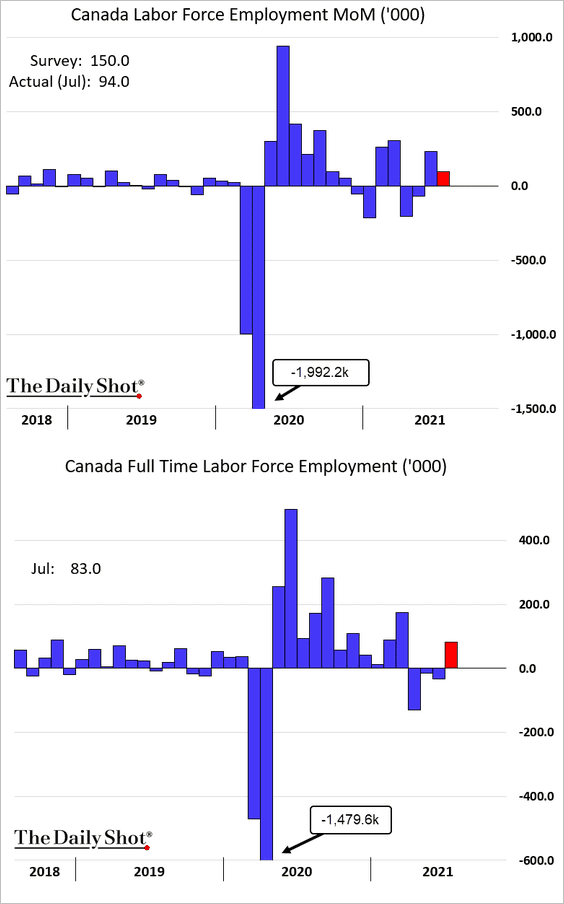
• Total employment could still reach the pre-COVID level this year.

• The unemployment rate edged lower.
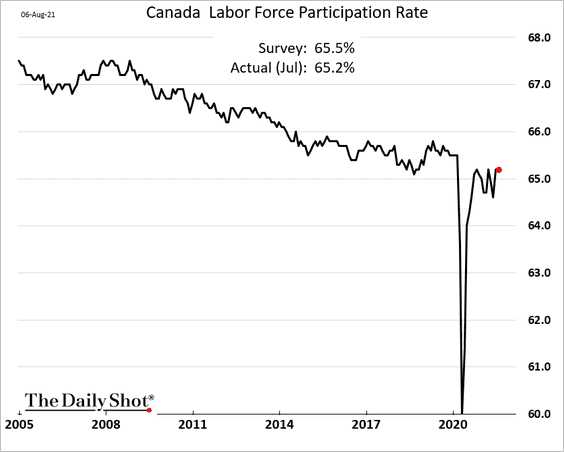
• Labor force participation recovery stalled in July.
• Here is the breakdown by sector.
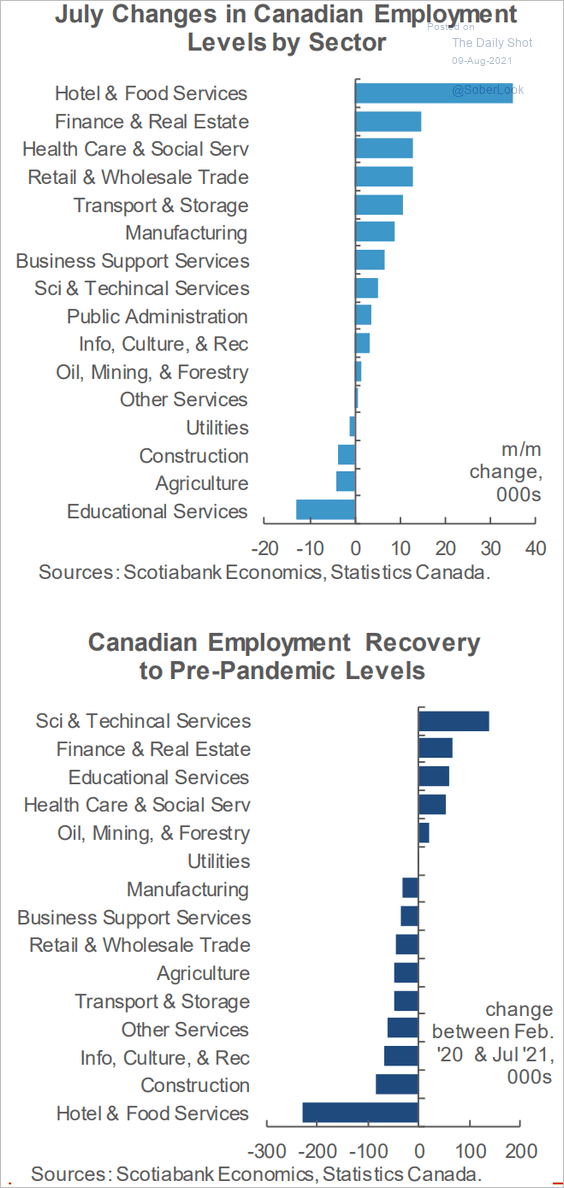 Source: Scotiabank Economics
——————–
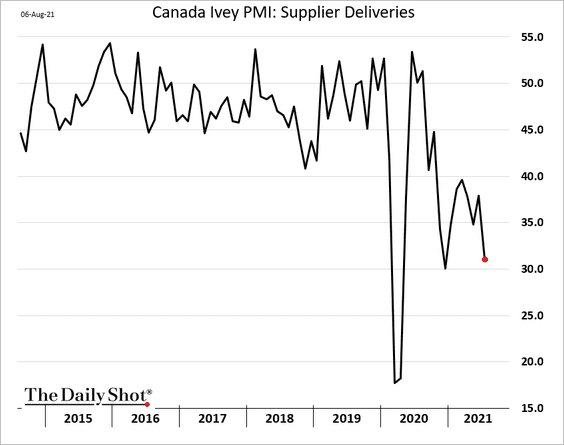
2. Growth in business activity eased last month.
 Source: Reuters Read full article
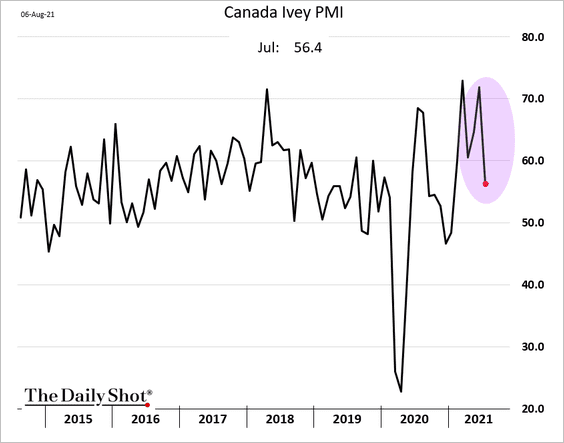
Supplier deliveries slowed further.
——————–
3. Consumer inflation varies substantially across provinces.
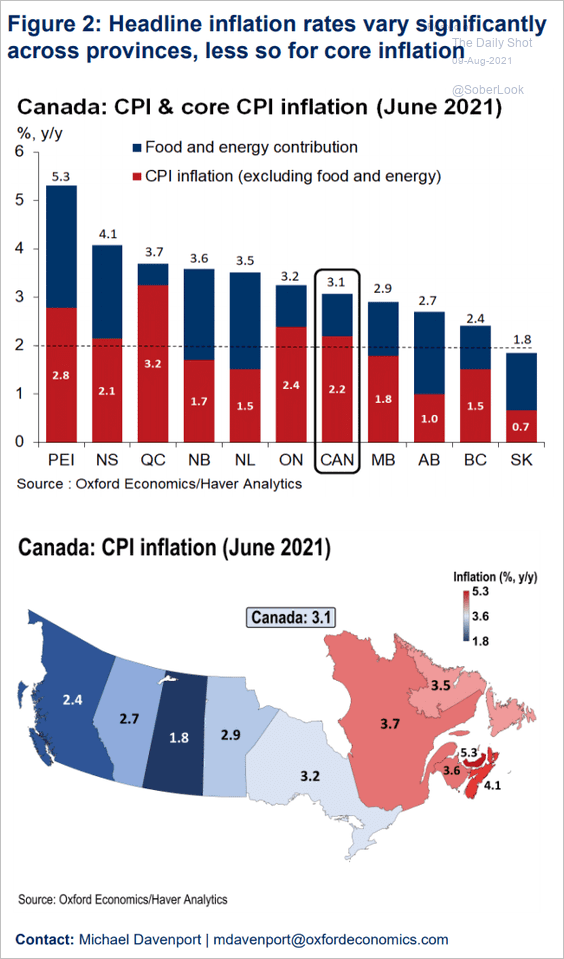 Source: Oxford Economics
Back to Index
The United Kingdom
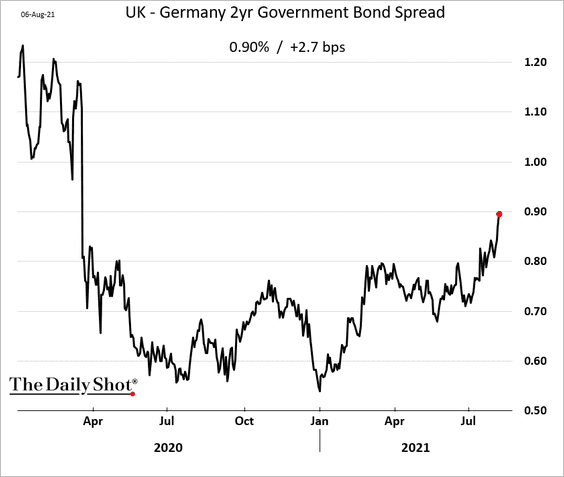
The pound continues to gain against the euro, …
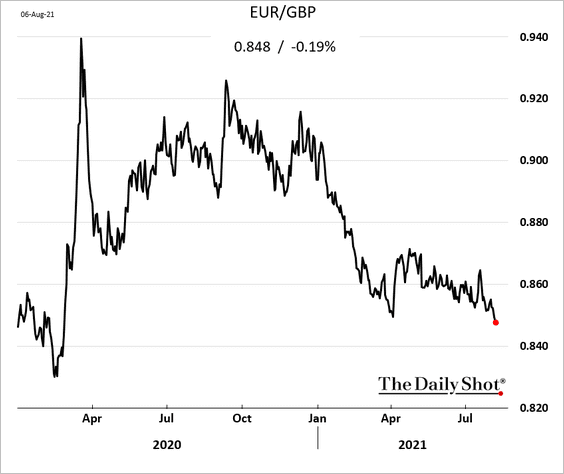
… as the rate differential widens.
 Source: Tradeweb
Back to Index
The Eurozone
1. Spain’s industrial production pulled back from the May highs.
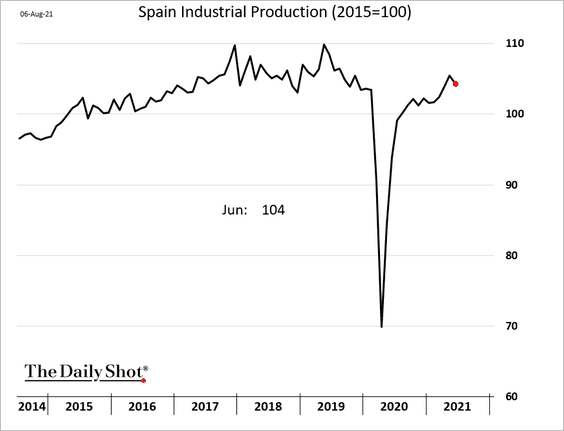
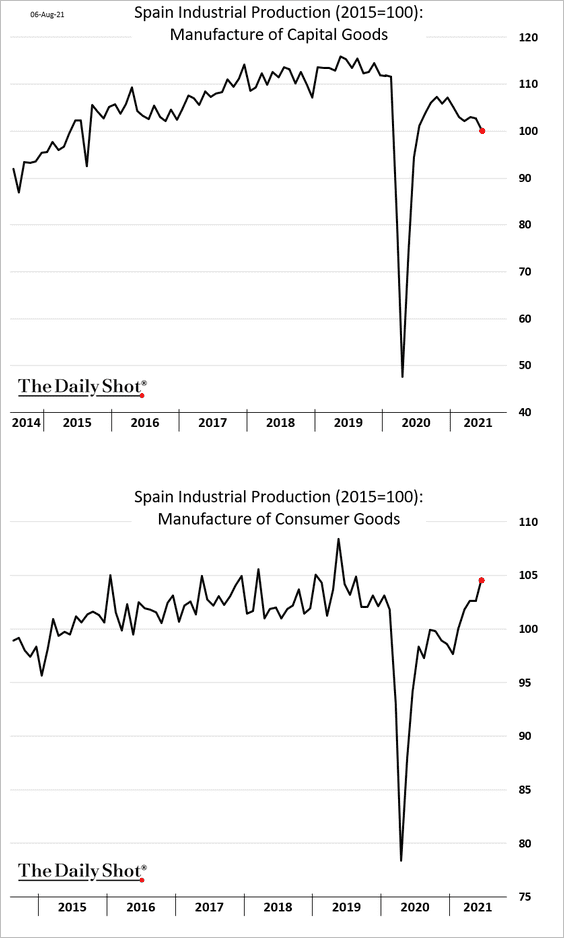
We continue to see a further divergence between capital goods and consumer goods production.
Separately, Spain’s housing transactions have recovered.
![]()
——————–
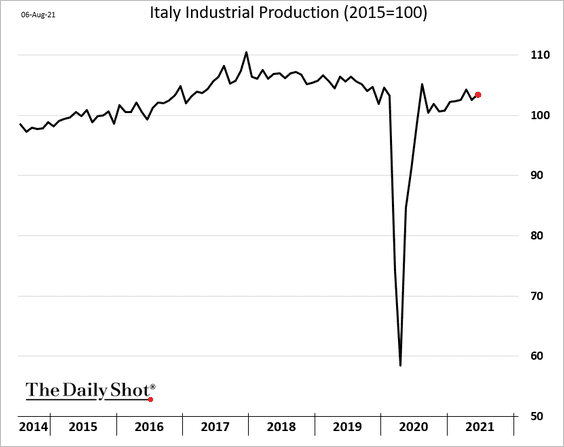
2. Italian industrial production is holding up well.
 Source: ING Read full article
——————–
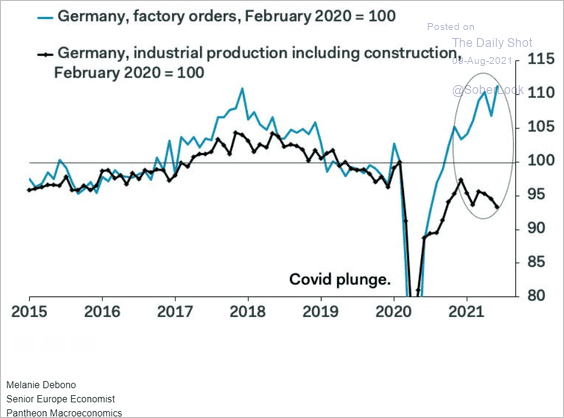
3. Below is the divergence between Germany’s factory orders and industrial production (shown here).
 Source: Pantheon Macroeconomics
Germany’s auto production continues to trend lower.
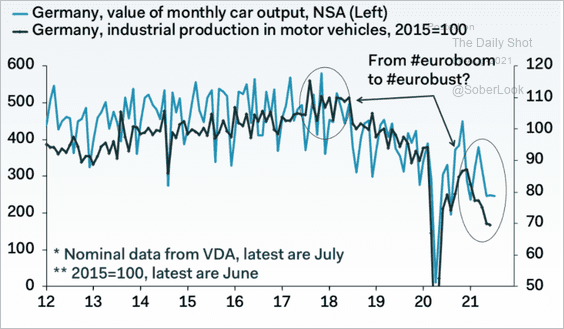 Source: Pantheon Macroeconomics
——————–
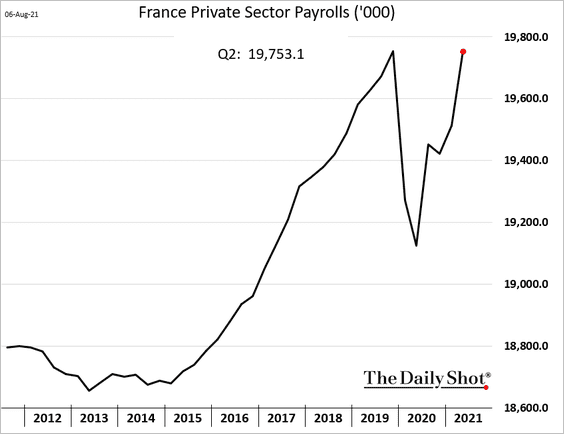
4. French private-sector payrolls are back at pre-COVID levels.
5. This cycle is about accommodation rather than austerity.
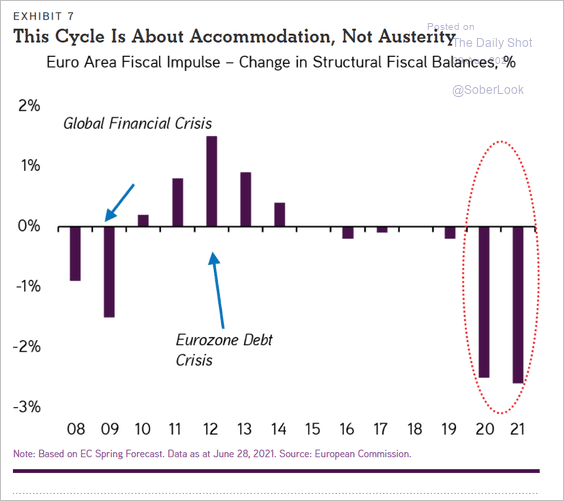 Source: Henry H. McVey, KKR Read full article
Back to Index
Europe
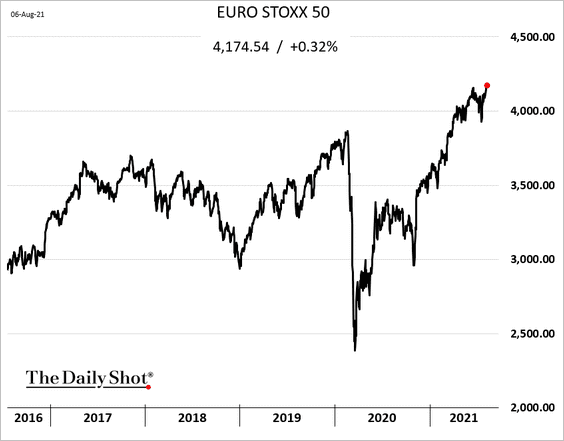
1. European stock indices are hitting new highs.
2. Here is a comparison of digital technologies adoption between the EU and the US.
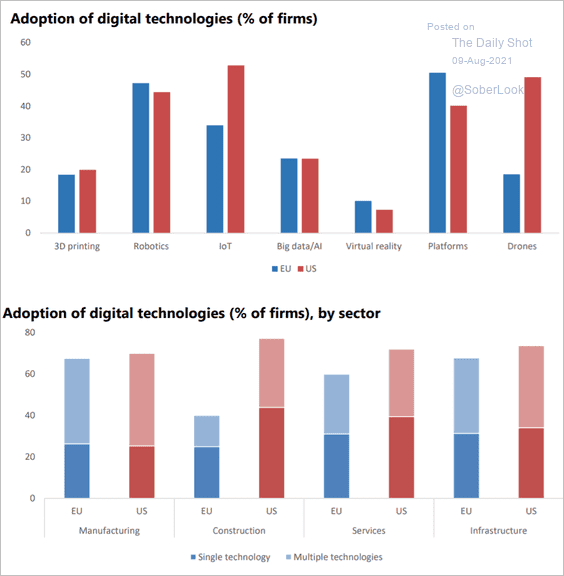 Source: EIB Read full article
Back to Index
Asia – Pacific
1. Will the yen get a boost from the Olympics?
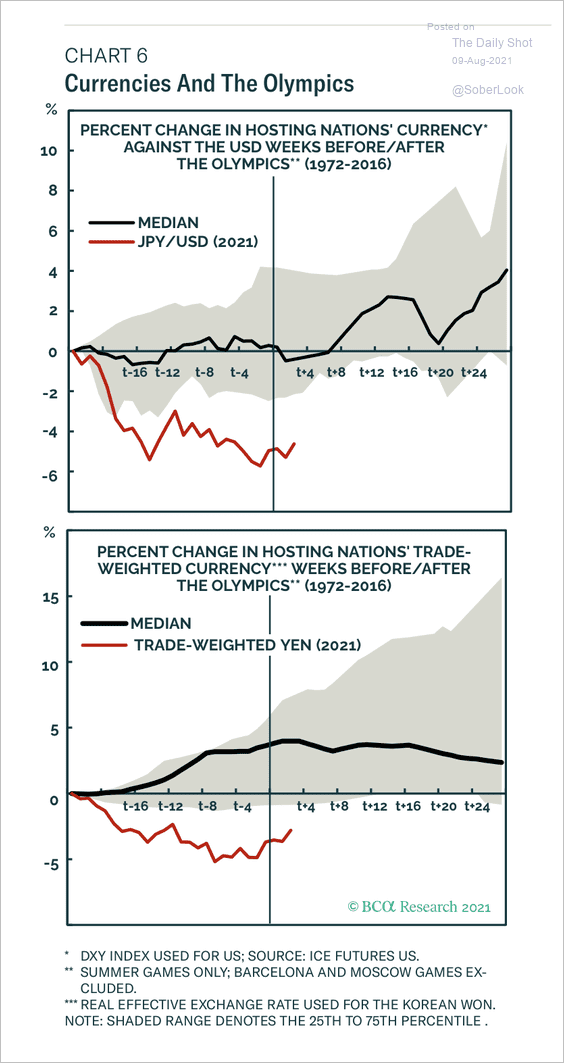 Source: BCA Research
2. Beijing’s crackdown on tech platforms is sending investors into hardware stocks.
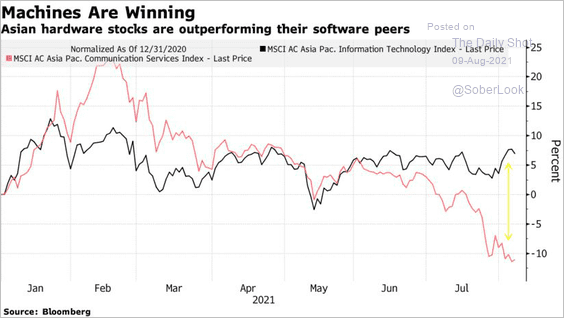 Source: Bloomberg Read full article
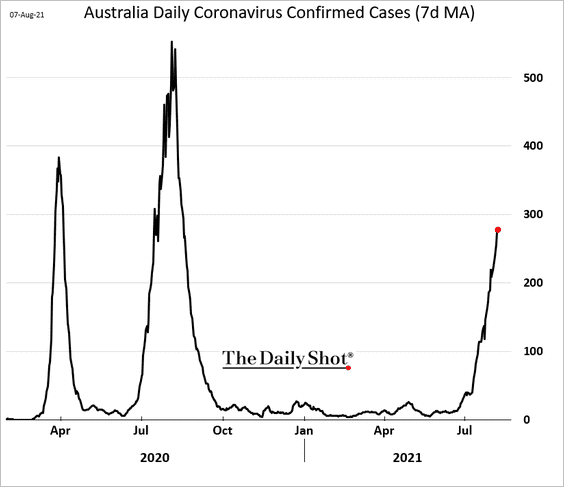
3. COVID cases in Australia continue to rise.
——————–
China
1. Exports remain robust. Be careful with the year-over-year figures the media is reporting – comparing to last year introduces a lot of noise.
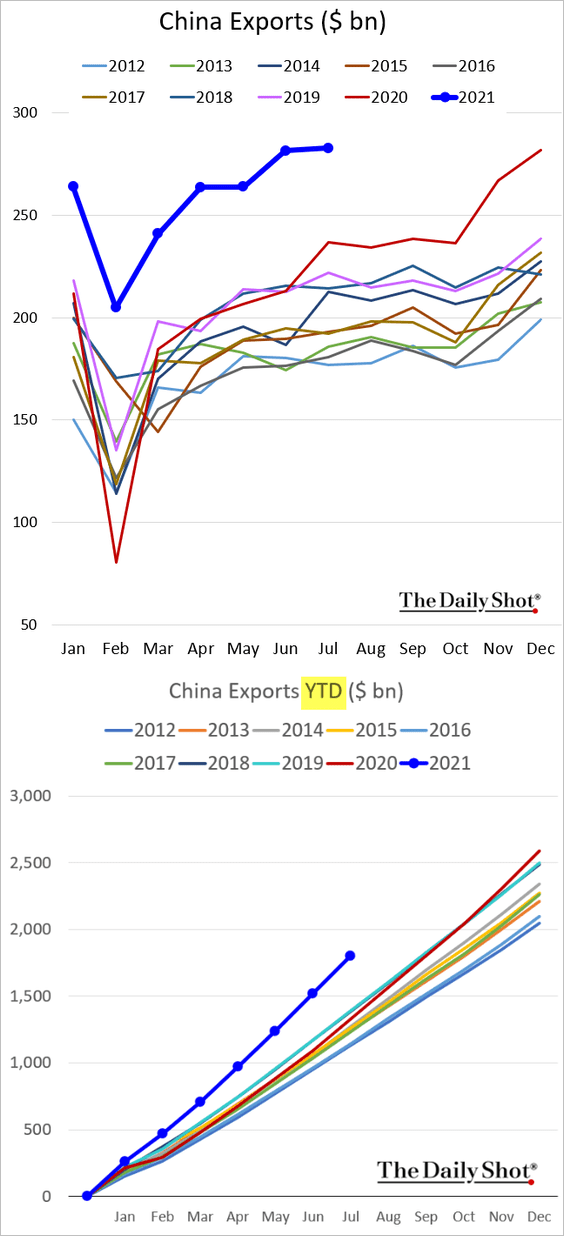
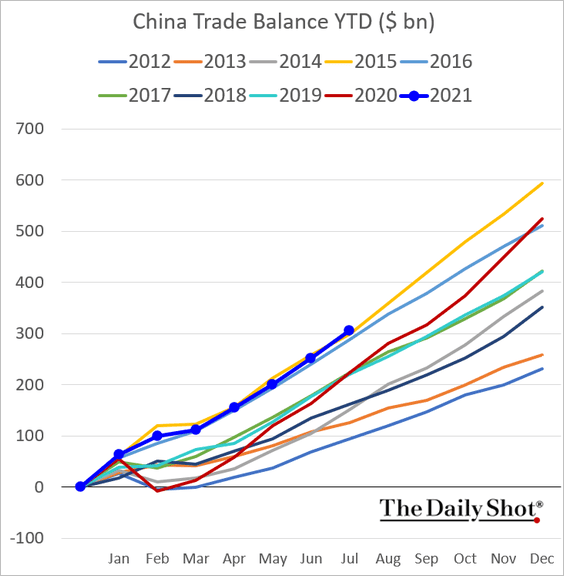
Here is the year-to-date cumulative trade balance.
——————–
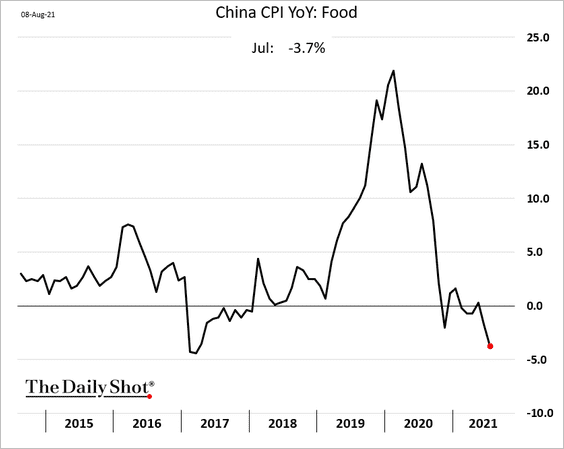
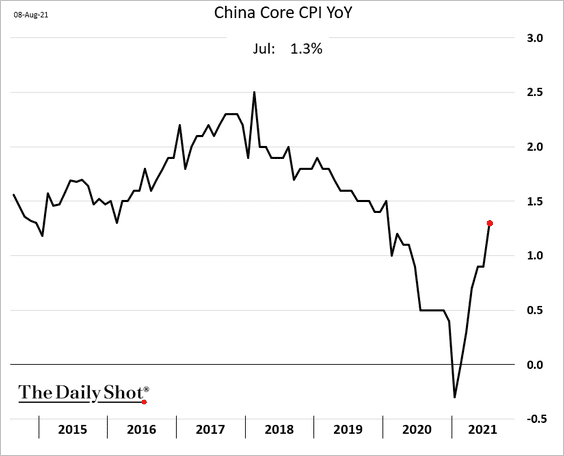
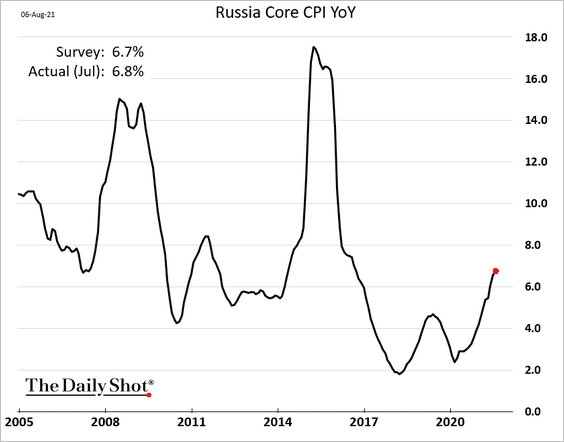
2. The CPI was a bit firmer than expected, …
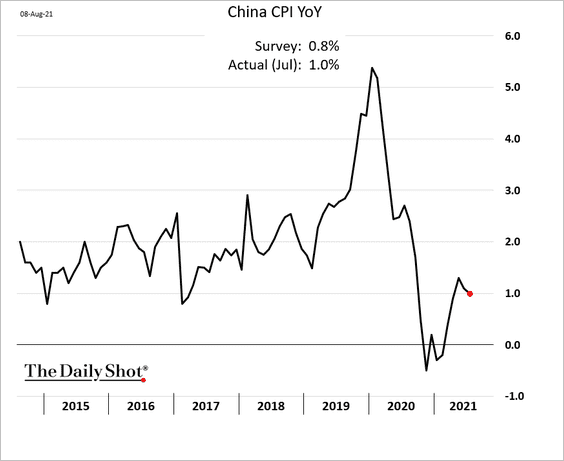
… even as food inflation drops further (coming off a high base).
Below is the core CPI.
——————–
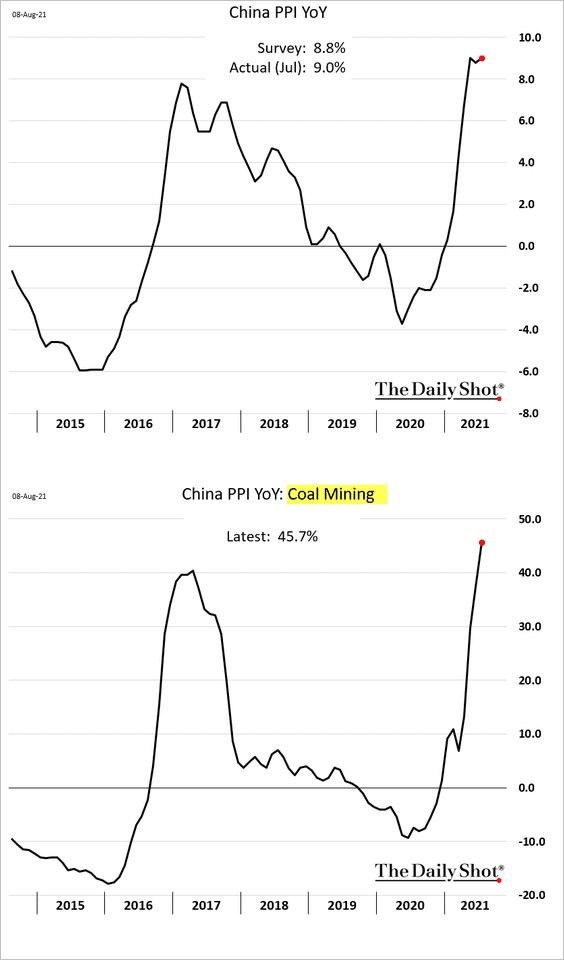
3. The PPI remains elevated, driven by industrial commodities.
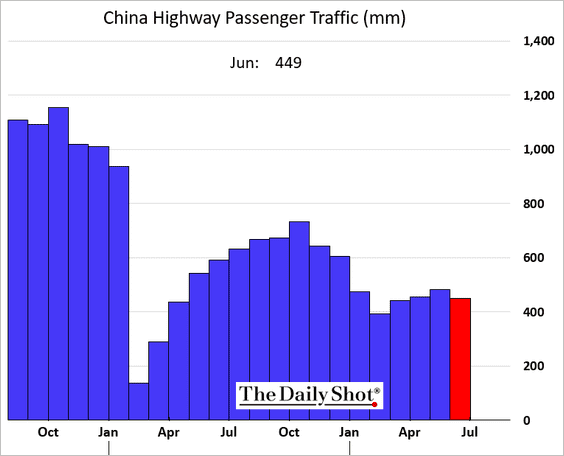
4. China’s highway passenger traffic never recovered.
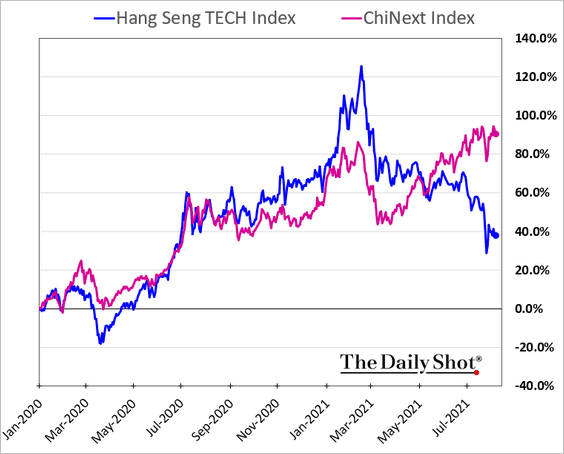
5. Next, we have some updates on the equity market.
• Small-cap growth stocks have been resilient.
 h/t @mikamsika
• The Nasdaq Golden Dragon China Index appears oversold.
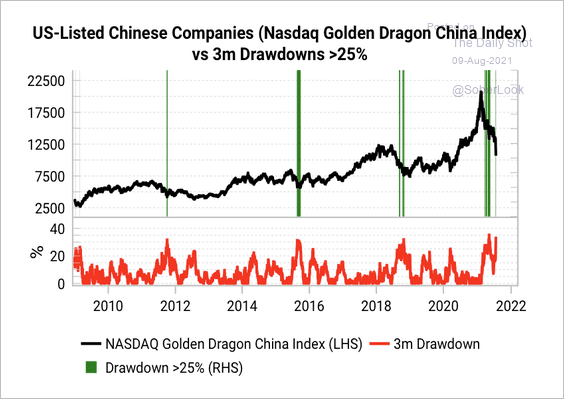 Source: Variant Perception
• Internet stocks are trading near 2018 lows when the Chinese government cracked down on gaming companies in an effort to reduce screen time.
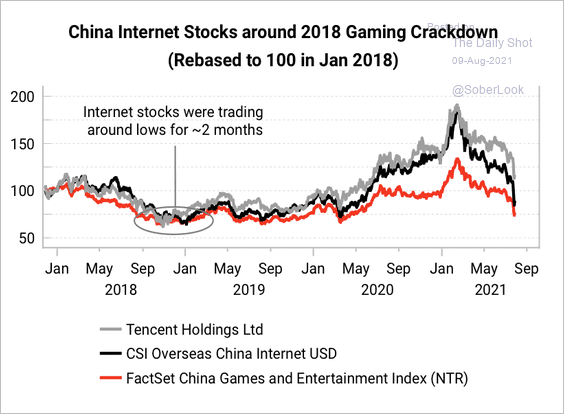 Source: Variant Perception
• Restrictions on foreign listings, especially in the US, will benefit Hong Kong.
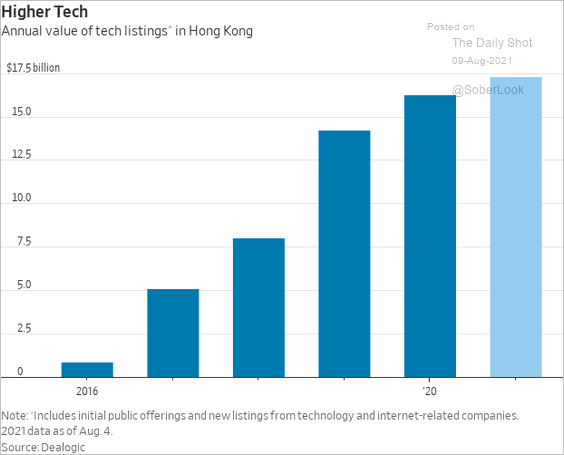 Source: @WSJ Read full article
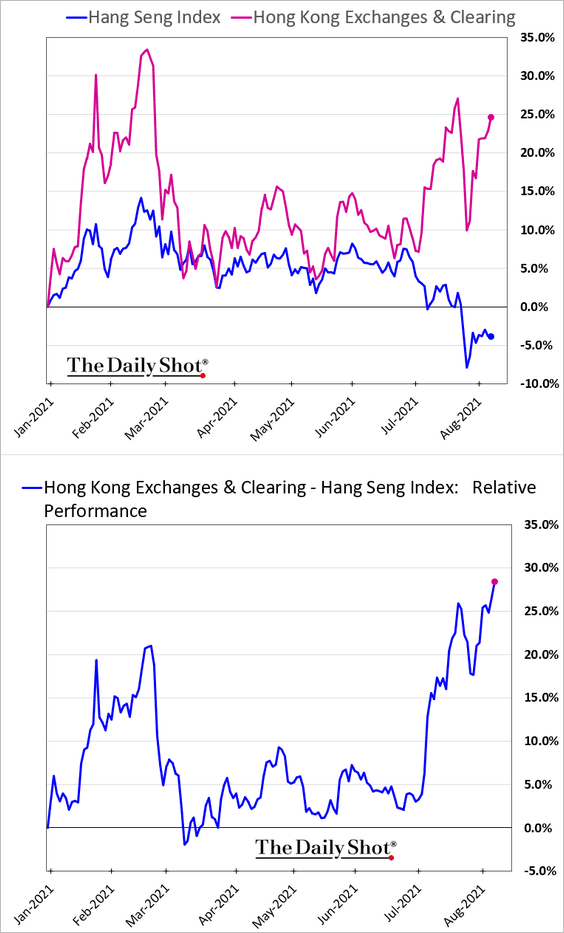
Hong Kong’s exchange operator’s shares surged in recent days.
Back to Index
Emerging Markets
1. Russia’s consumer inflation continues to climb.
2. Emerging Asia stocks have become more vulnerable due to high dollar debt exposure, commodity and manufacturing risks, according to Cornerstone Macro.
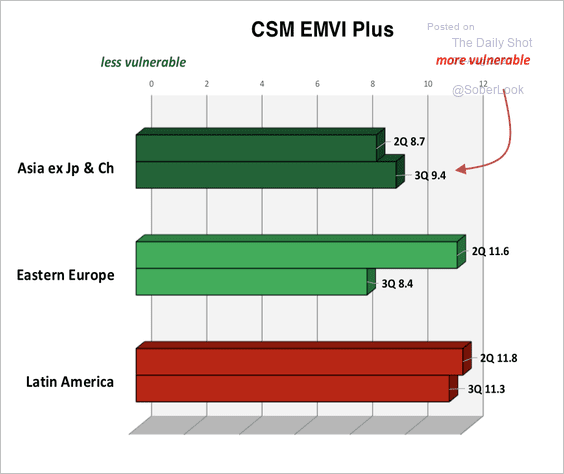 Source: Cornerstone Macro
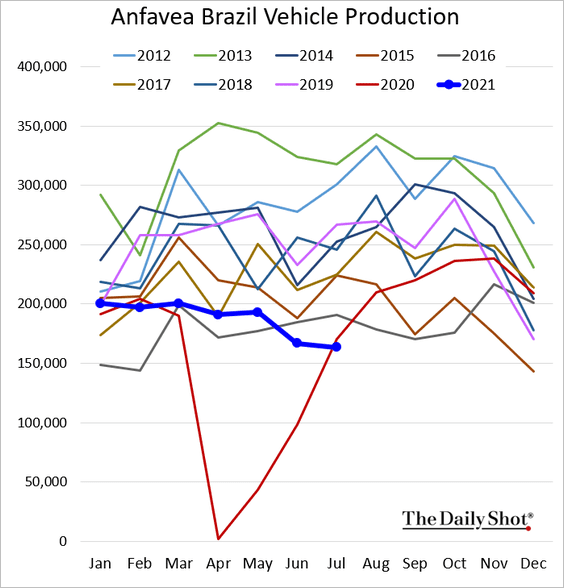
3. Mexican car production is lagging due to chip shortages.
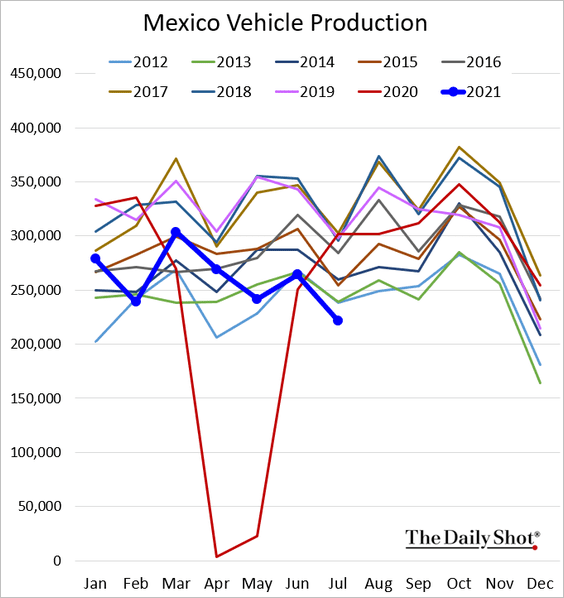
Brazil is facing similar issues.
——————–
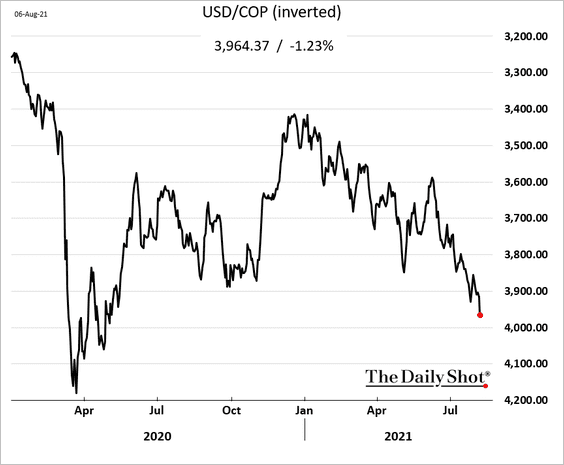
4. The Colombian peso continues to sink.
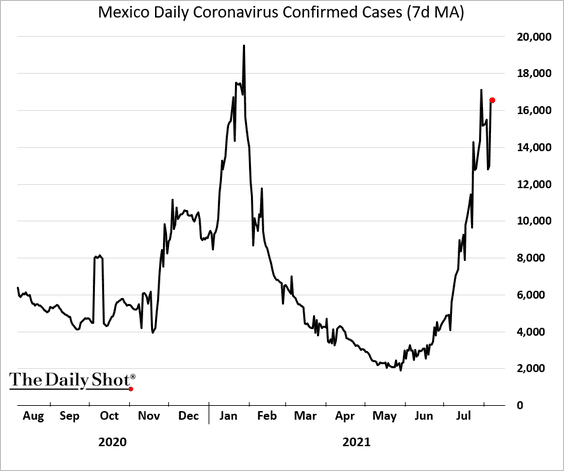
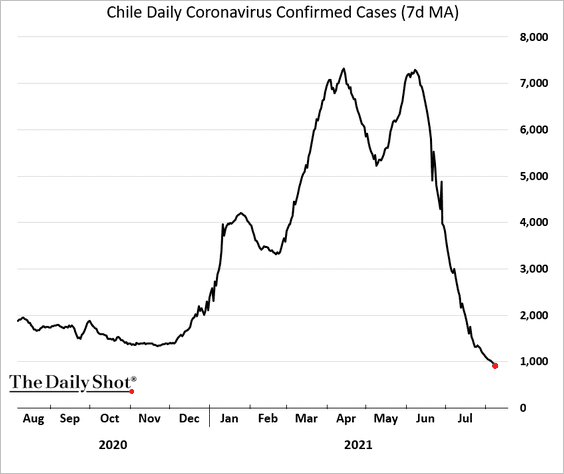
5. Next, we have a couple of COVID charts.
• Mexico:
• Chile:
——————–
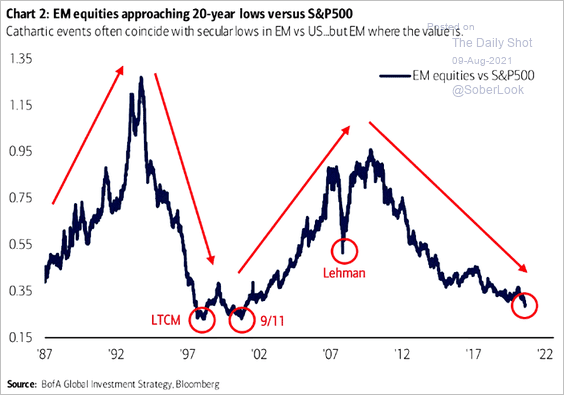
6. EM stocks have been underperforming the S&P 500 in dollar terms.
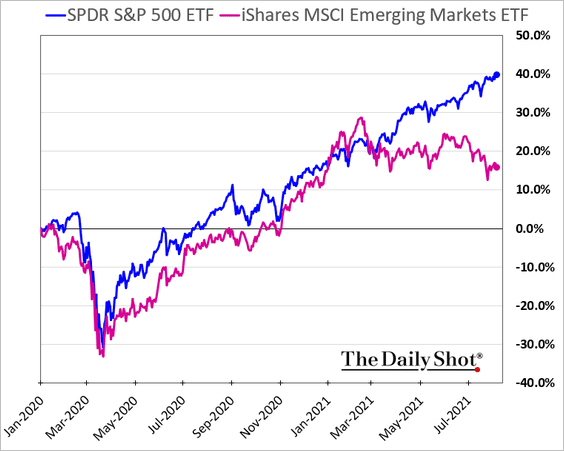
Here is a long-term chart.
 Source: @ISABELNET_SA, @BofAML
——————–
7. This chart shows China’s overseas coal power development pipeline.
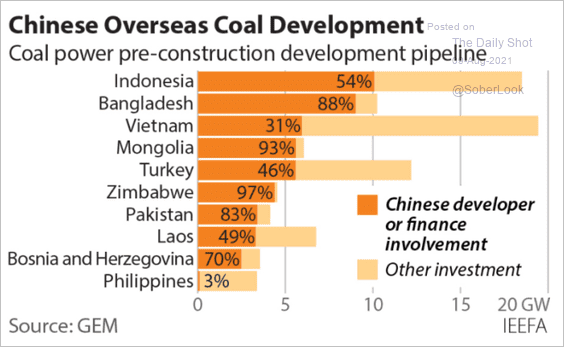 Source: IEEFA Read full article
Back to Index
Cryptocurrency
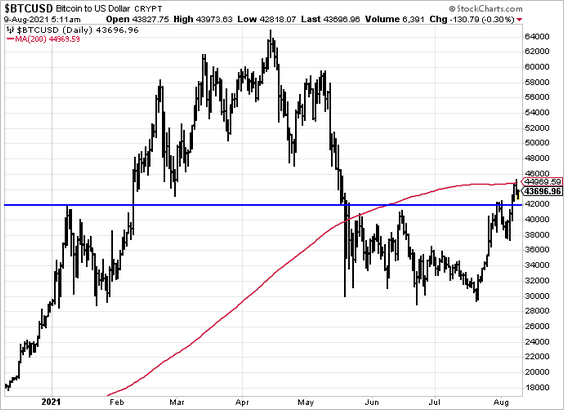
1. Bitcoin broke through the $42k resistance but got stopped at the 200-day moving average.
2. Crypto-related search activity remains tepid.
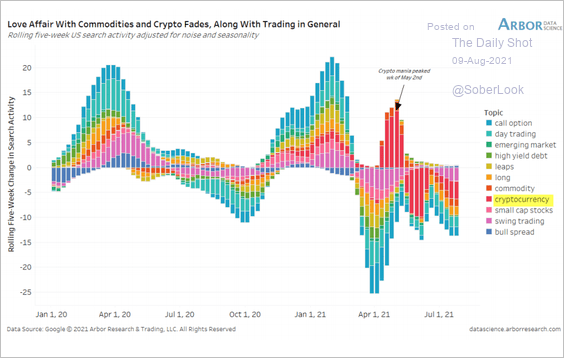 Source: Arbor Research & Trading
3. This chart shows crypto trading volume by trade size.
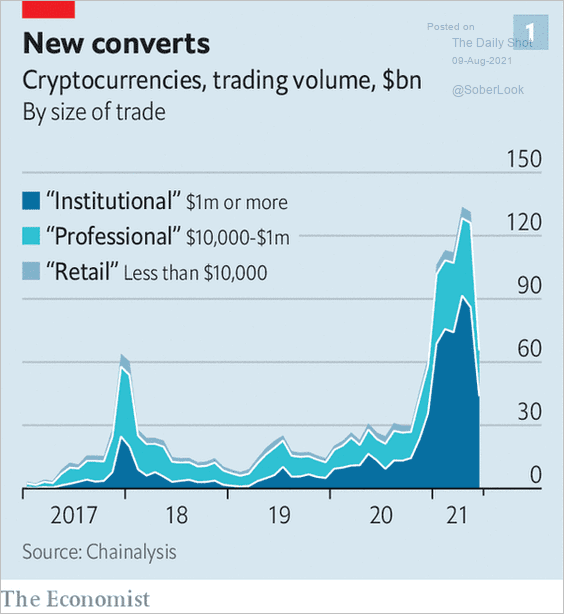 Source: The Economist Read full article
Back to Index
Commodities
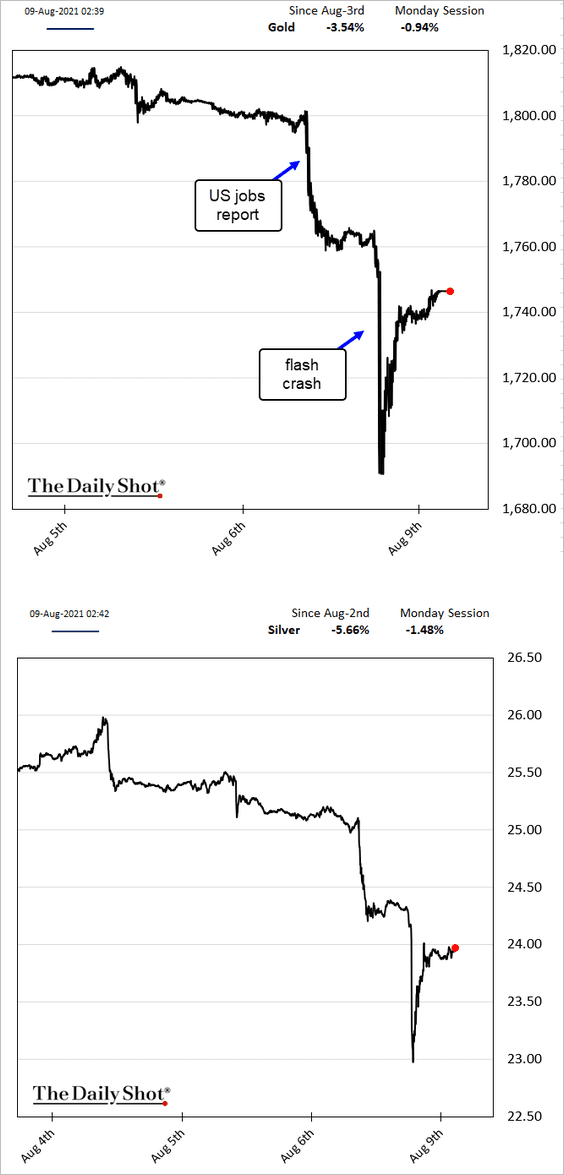
1. Gold and silver experienced a mini flash crash this morning but quickly recovered some of the lost ground.
2. Iron ore is under pressure, as China’s industrial commodity imports moderate.
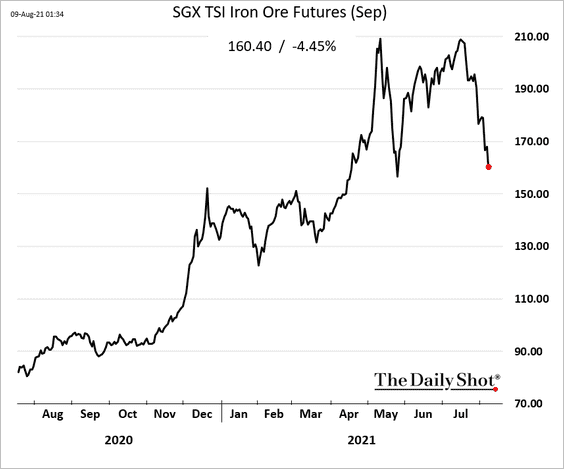
 Source: Reuters Read full article
Back to Index
Energy
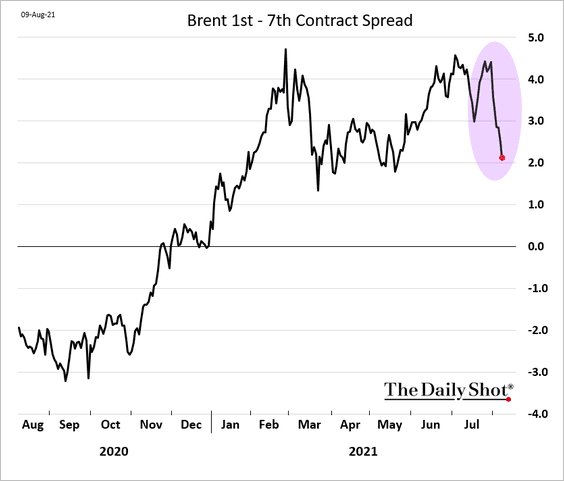
1. Brent crude is back below $70/bbl.
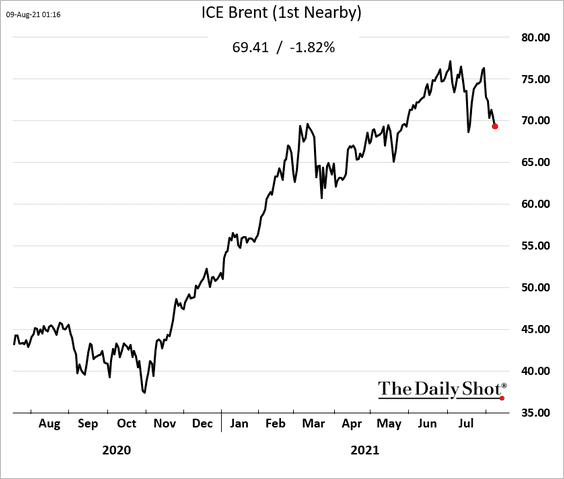
Backwardation is moderating (flatter curve).
——————–
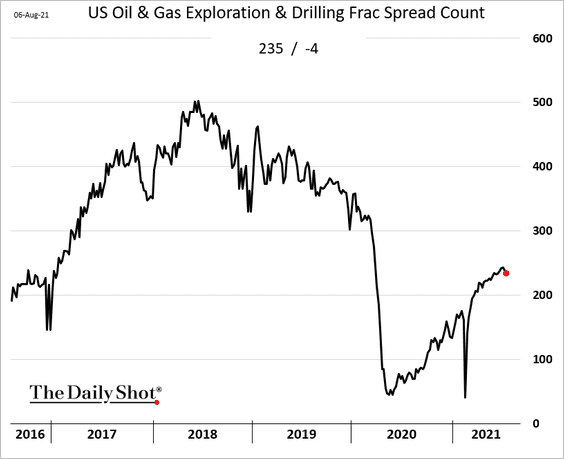
2. US rig count recovery remains relatively slow.
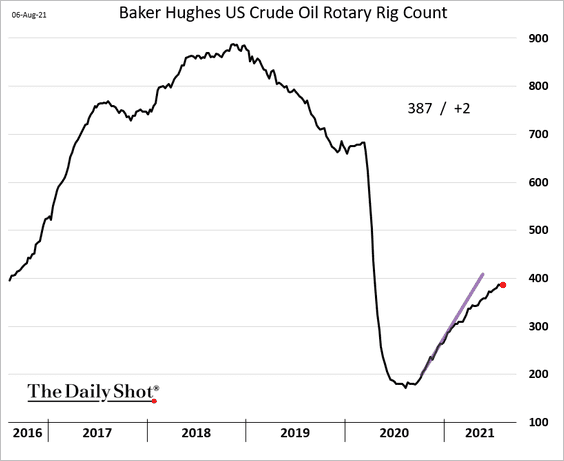
The frac spread count is down for the second week.
——————–
3. This chart illustrates the normalization of global oil demand.
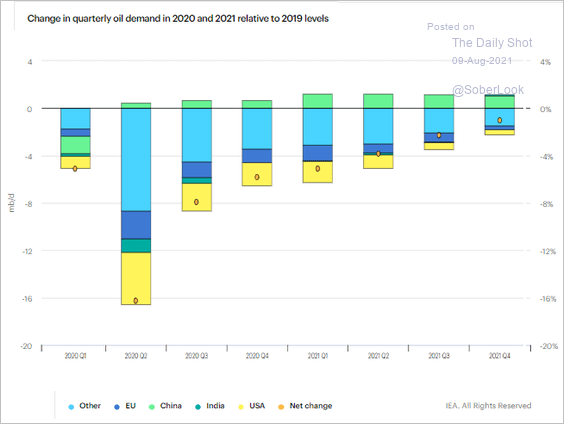 Source: IEA Read full article
Back to Index
Equities
1. Earnings continue to exceed expectations across the board.
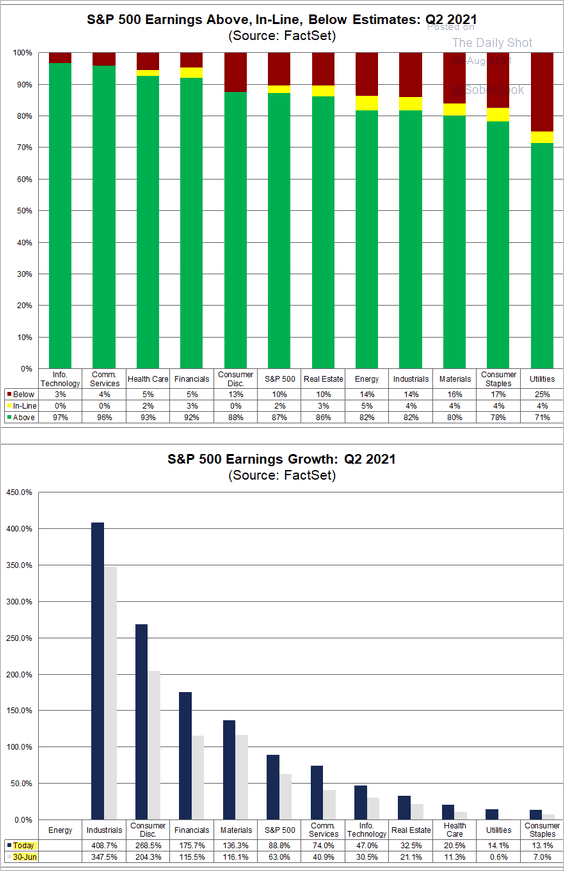 Source: @FactSet Read full article
• Earnings forecasts for this year continue to surge, making 2022 a tougher comp.
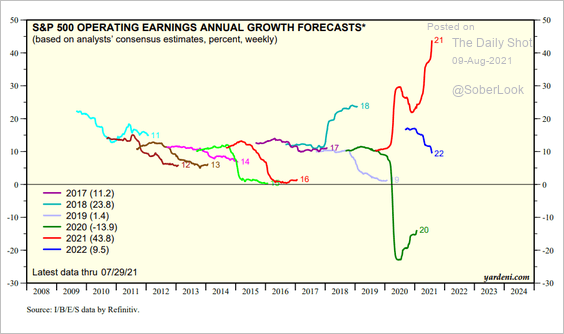 Source: Yardeni Research
• Operating margins hit a multi-decade high.
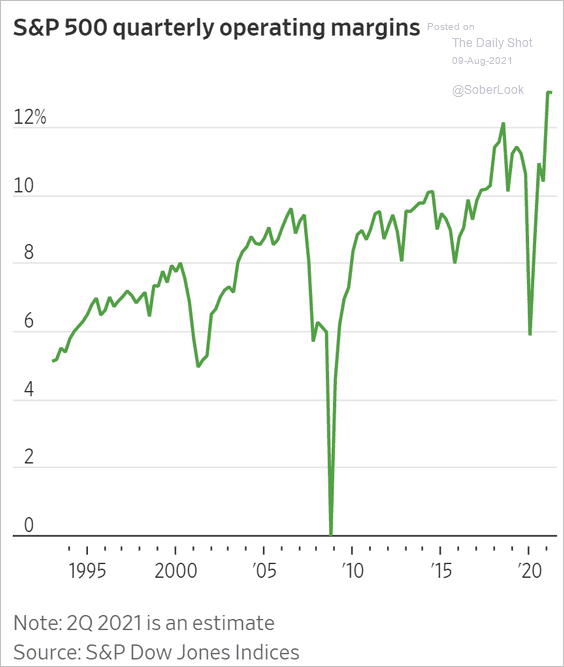 Source: @jessefelder, @WSJ Read full article
——————–
2. Roughly 50% of S&P 500 stocks have dividend yields greater than the 10-year Treasury yield.
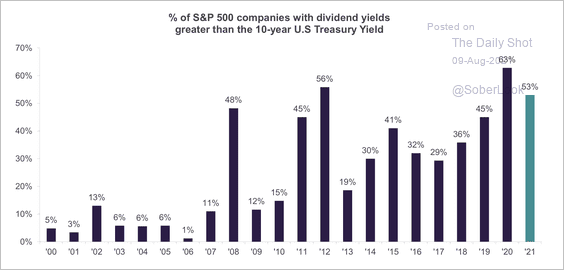 Source: Truist Advisory Services
3. High-yield bond spreads have diverged from stocks.
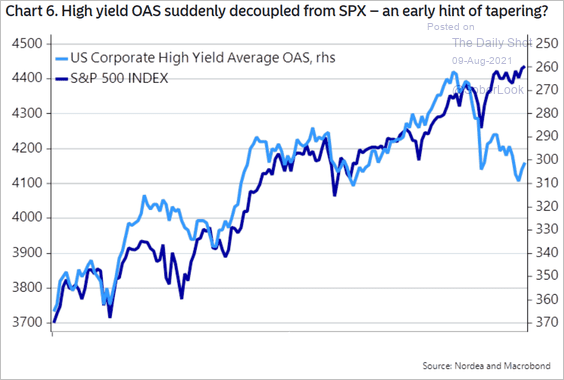 Source: Nordea Markets
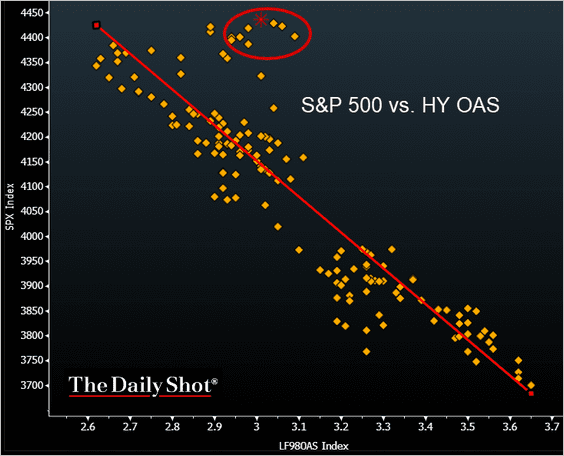 Source: @TheTerminal, Bloomberg Finance L.P.
——————–
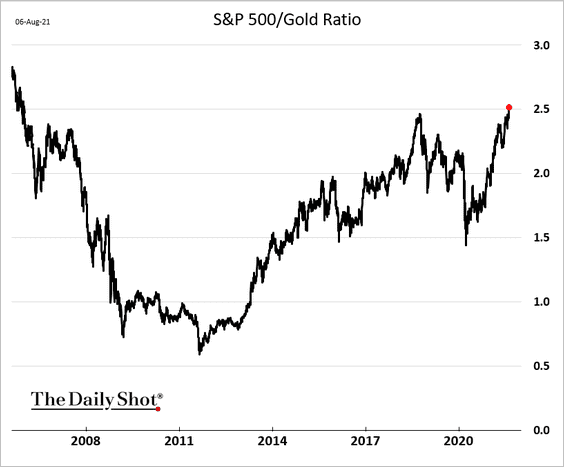
4. This chart shows the ratio of the S&P 500 to gold.
5. Share buybacks are about to break a new record.
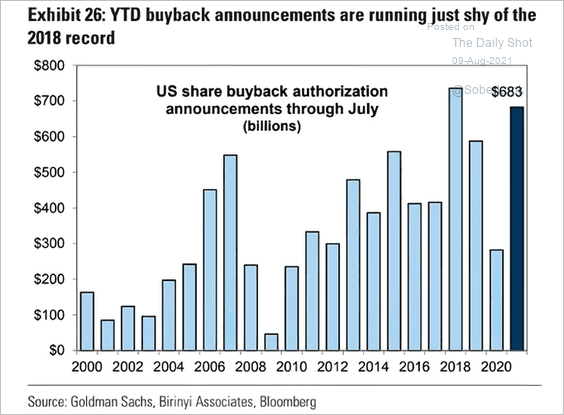 Source: @ISABELNET_SA, @GoldmanSachs
6. Retail flows into stocks and ETFs surged last month.
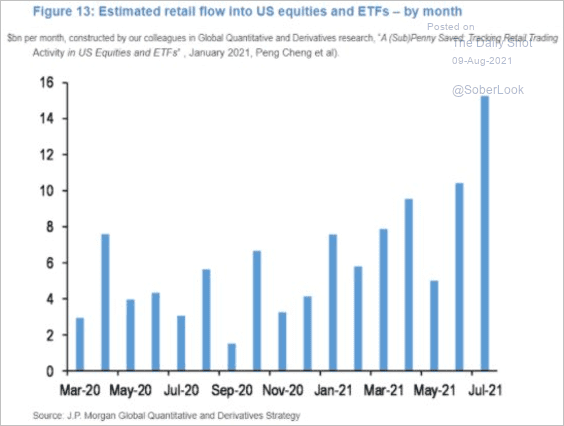 Source: @LizAnnSonders, @jpmorgan
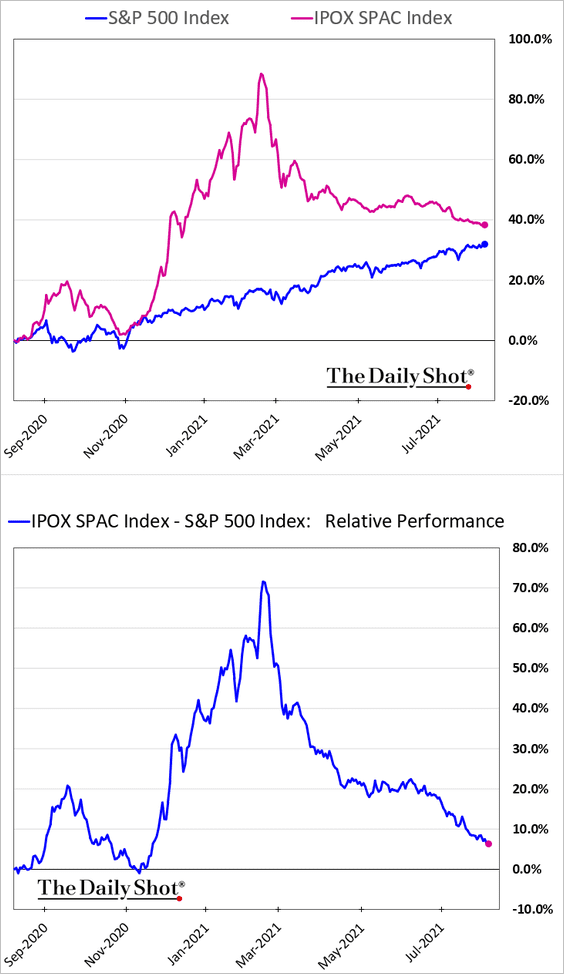
7. SPACs continue to underperform.
8. VIX is entering a seasonally strong period, which can lead to a sideways/choppy market over the next two months (2 charts).
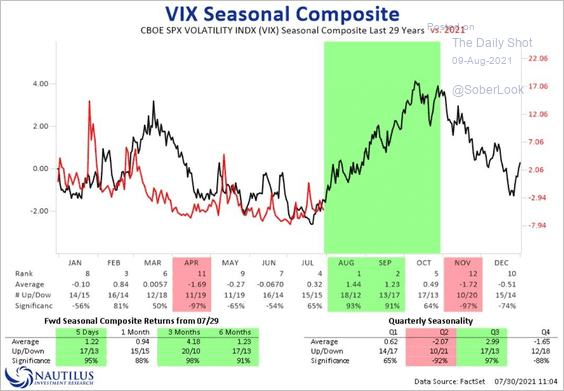 Source: @NautilusCap
 Source: Truist Advisory Services
Back to Index
Rates
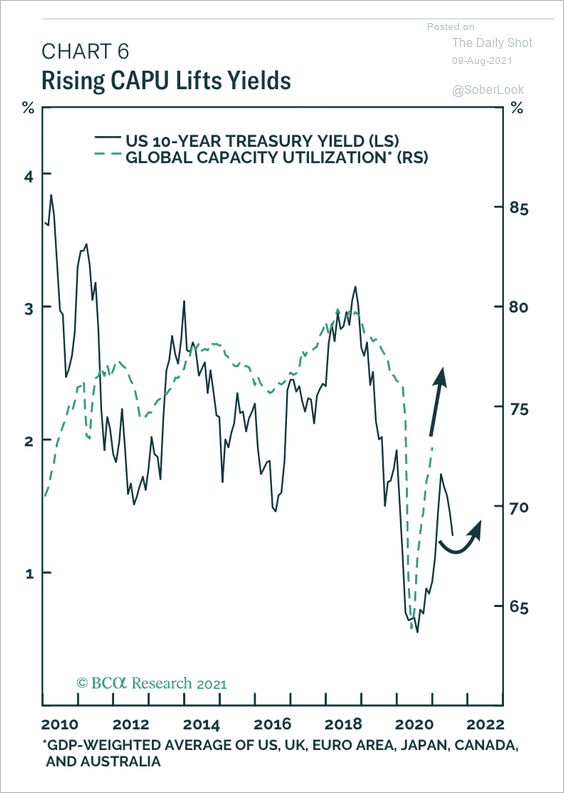
1. Both global liquidity and capacity utilization point to higher yields (2 charts).
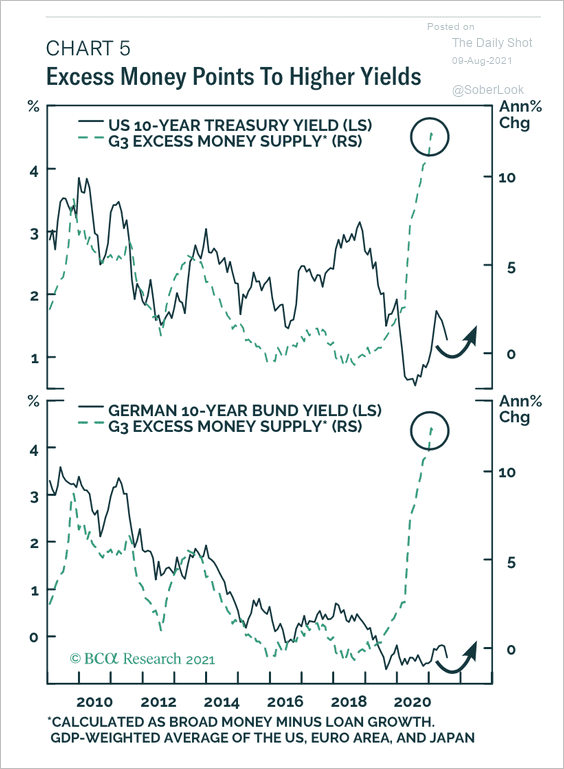 Source: BCA Research
 Source: BCA Research
——————–
2. The 10-year Treasury yield is approaching short-term resistance near 1.4%.
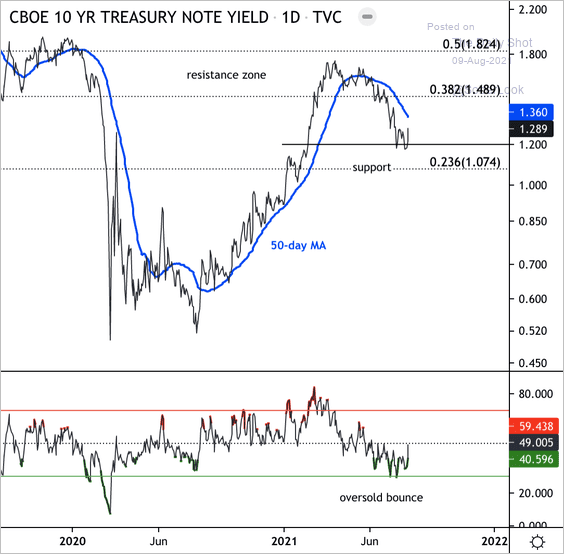 Source: Dantes Outlook
3. TIPS supply is expected to decline further relative to the overall non-bill Treasury market.
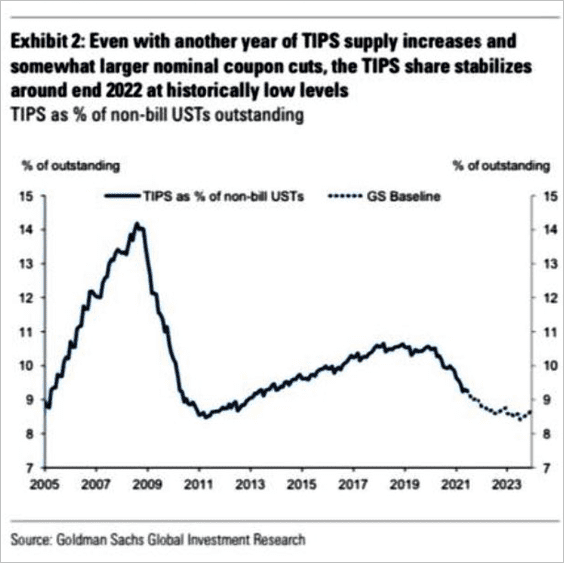 Source: Goldman Sachs; @WallStJesus
——————–
Food for Thought
1. US college endowments’ investment returns:
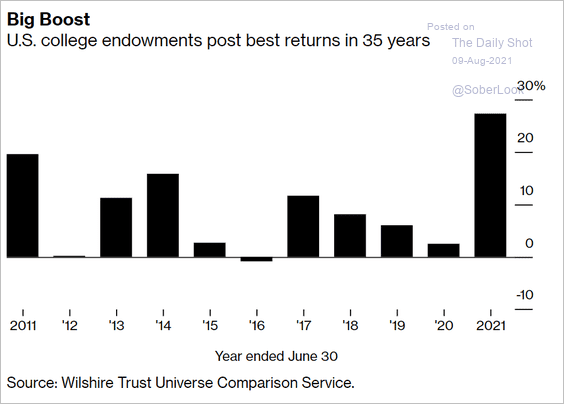 Source: @markets Read full article
2. Monthly visits to …
• Salad chains:
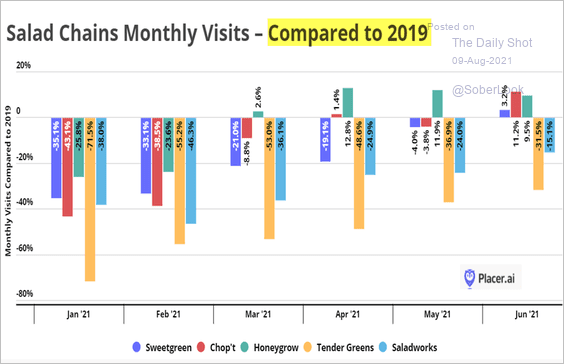 Source: Placer.ai
• Ice cream chains:
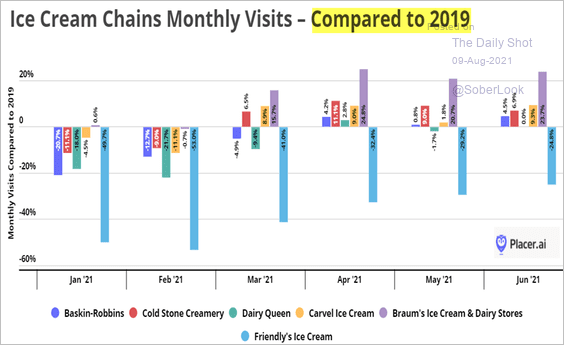 Source: Placer.ai
——————–
3. Number of events at summer Olympic games:
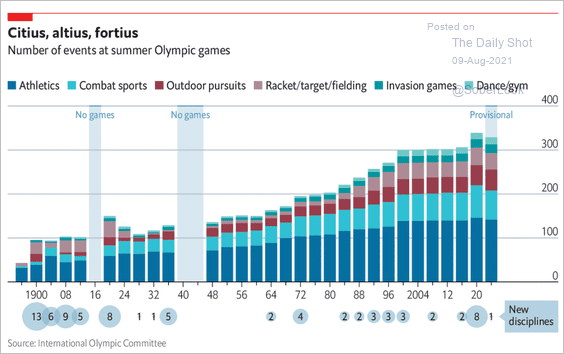 Source: The Economist Read full article
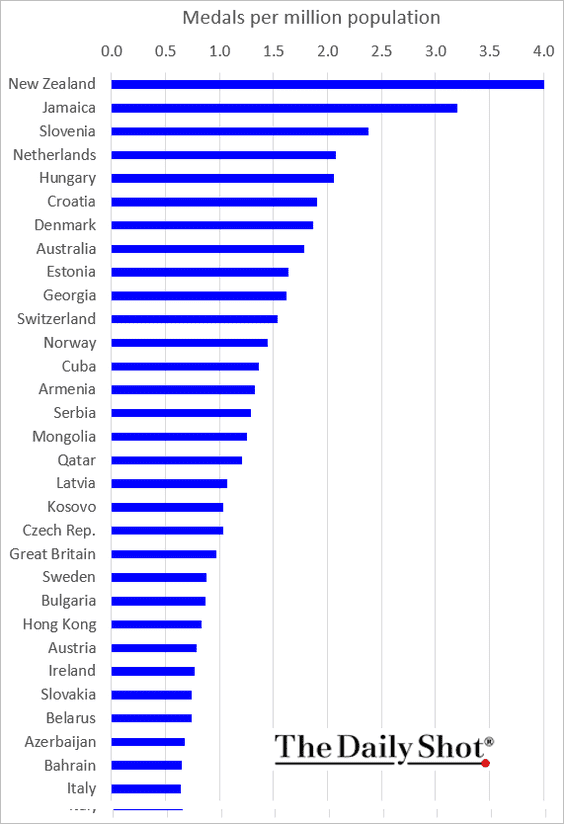
4. 2021 Olympic medals per million population (for countries with over 1 million population):
5. Households’ ability to afford a median-priced home:
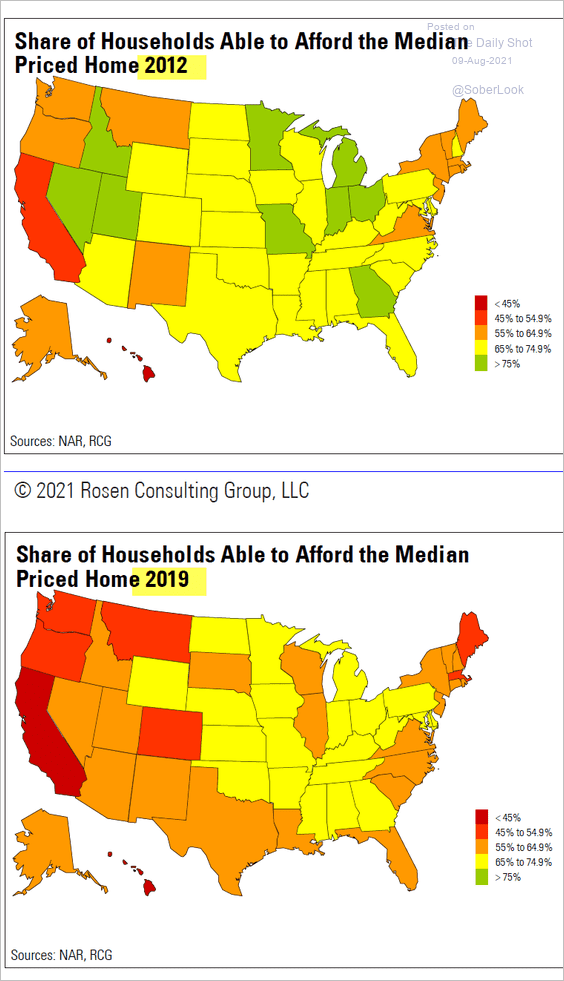 Source: Rosen Consulting Group
6. Assets and liabilities of US households:
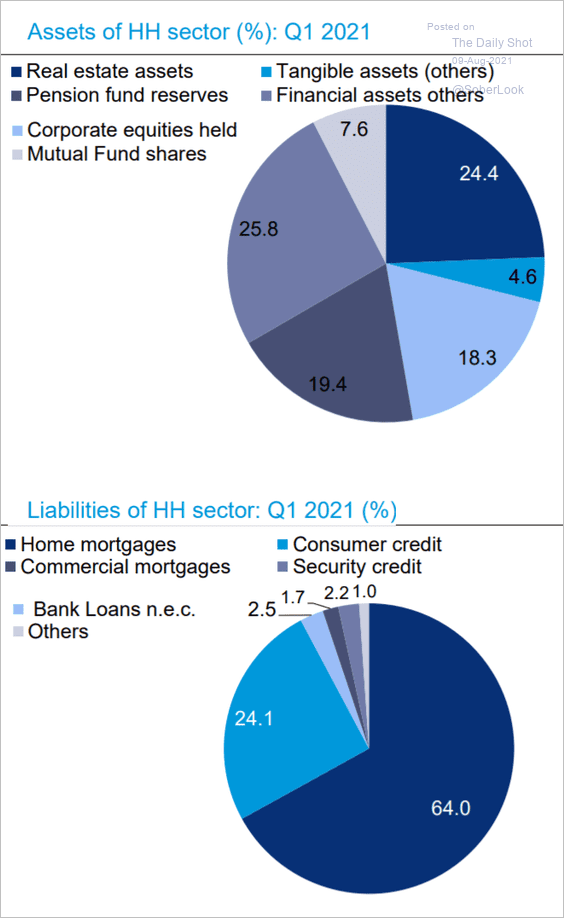 Source: Deutsche Bank Research
7. Changes in each country’s consumer spending as a share of global consumption:
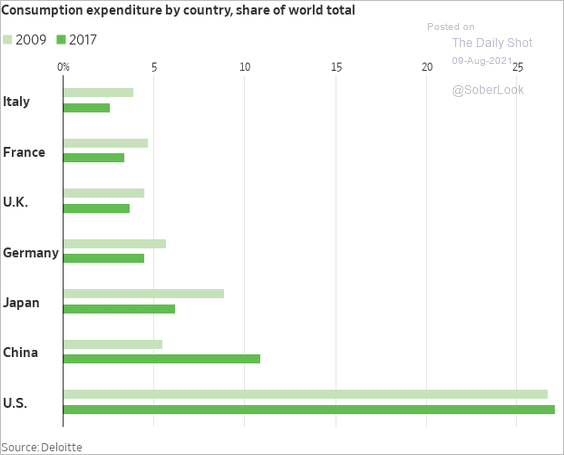 Source: @WSJ Read full article
8. Episodes of US post-WWII inflation:
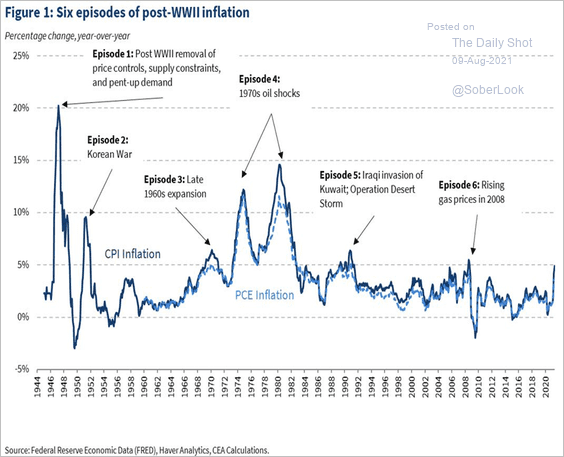 Source: The White House Read full article
9. Meat consumption vs. GDP per capita:
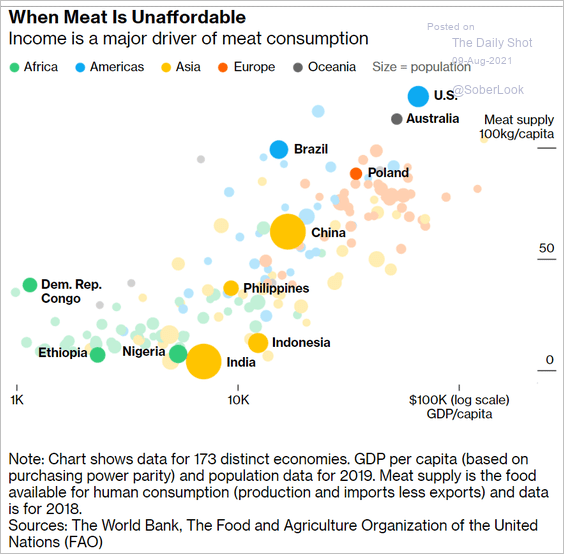 Source: @business Read full article
10. Teen vaccinations:
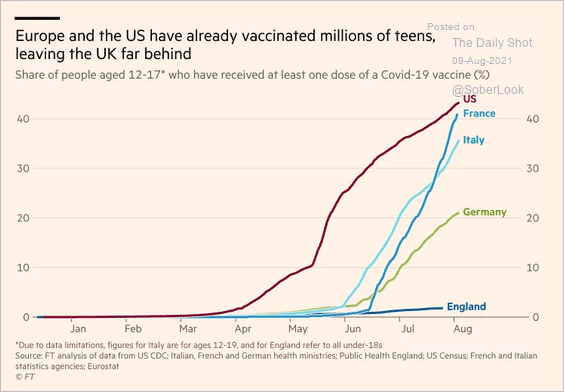 Source: @financialtimes Read full article
11. Most popular out-of-state NFL team, based on Google search:
 Source: Custom Ink Read full article
——————–
Back to Index