
The Daily Shot: 01-Sep-21
• The United States
• Canada
• The United Kingdom
• The Eurozone
• Japan
• Asia – Pacific
• China
• Emerging Markets
• Cryptocurrency
• Commodities
• Energy
• Equities
• Rates
• Global Developments
• Food for Thought
The United States
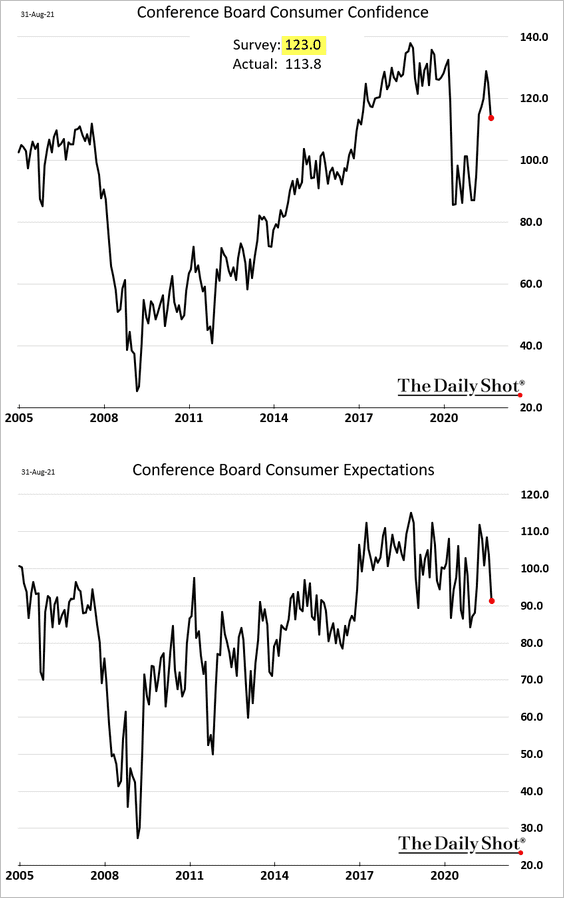
1. The Conference Board’s consumer confidence report surprised to the downside. It’s the latest indication that sentiment weakened in August.
• Here are the contributions to the index.
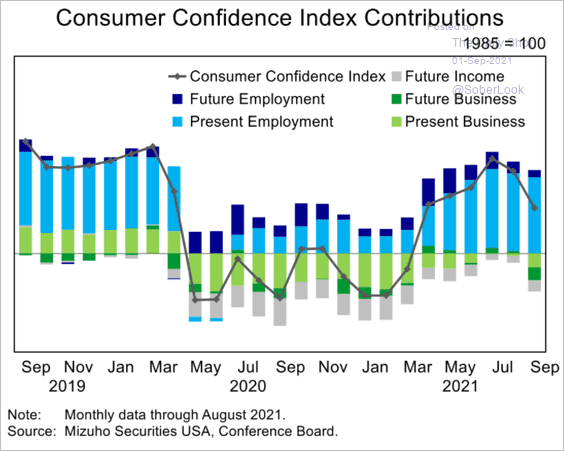 Source: Mizuho Securities USA
• The decline wasn’t as severe as what we saw in the U. Michigan data (the two indicators have decoupled).
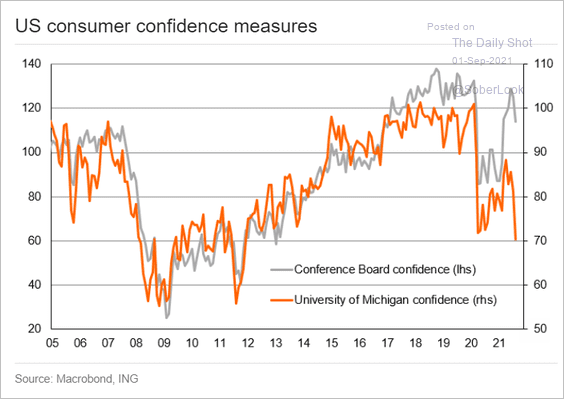 Source: ING
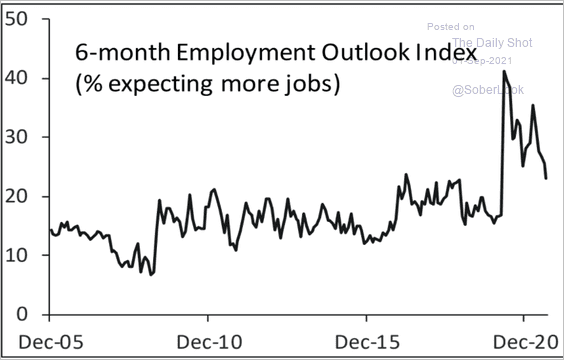
• The labor differential (spread between “jobs plentiful” and “jobs hard to get”) appears to have peaked.
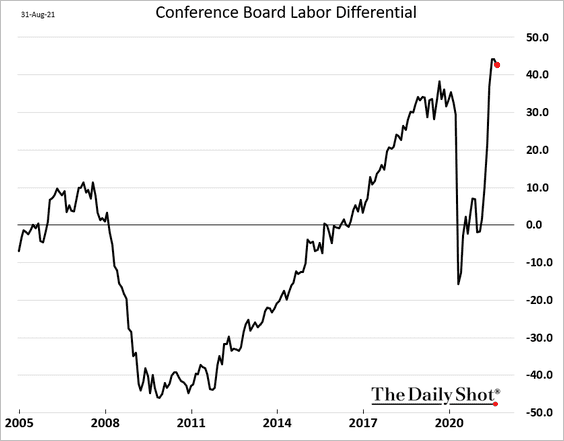
The employment outlook moderated further.
 Source: Piper Sandler
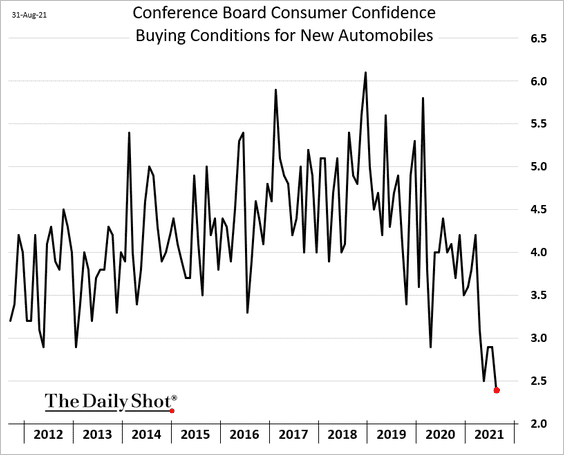
• Buying conditions for vehicles have deteriorated.
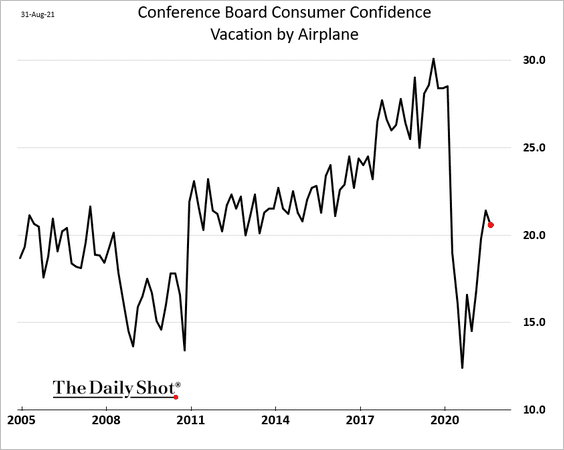
Intentions to take a vacation by airplane ticked lower and remain well below pre-COVID levels.
——————–
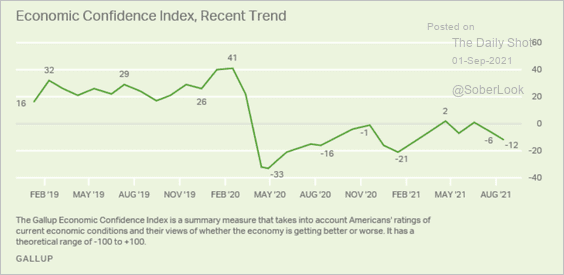
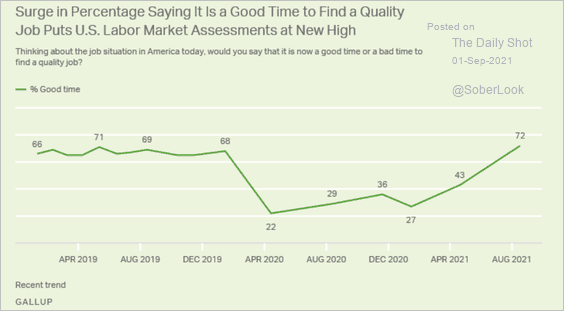
2. Gallup’s confidence indicator also declined.
 Source: Gallup Read full article
But labor market sentiment remains robust.
 Source: Gallup Read full article
——————–
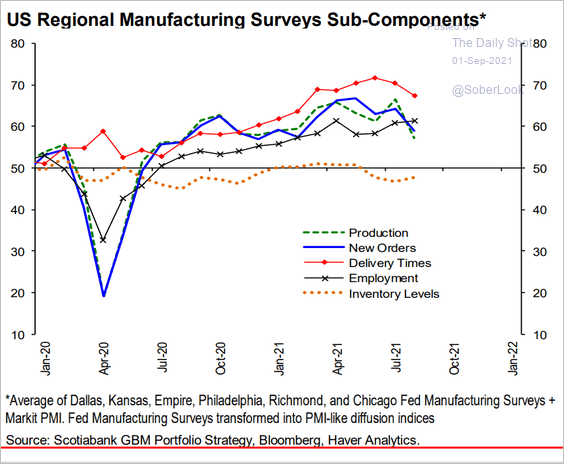
3. The Chicago PMI shows a moderate slowdown in Midwest regional factory activity.
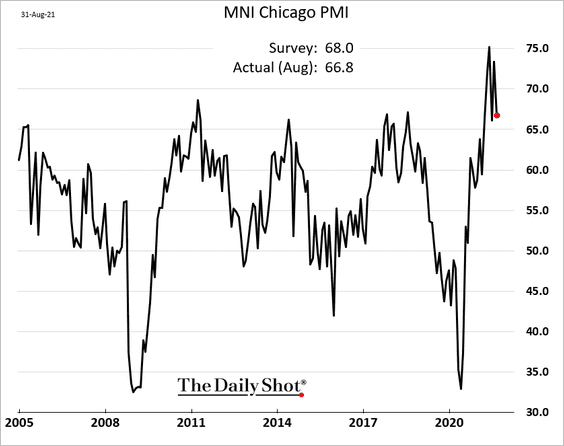
It’s consistent with the regional Fed surveys in other parts of the country.
 Source: Hugo Ste-Marie, Portfolio & Quantitative Strategy Global Equity Research, Scotia Capital
——————–
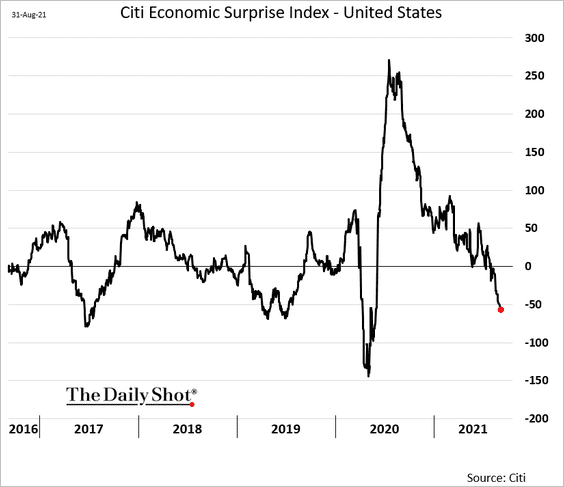
4. The Citi Economic Surprise Index continues to deteriorate.
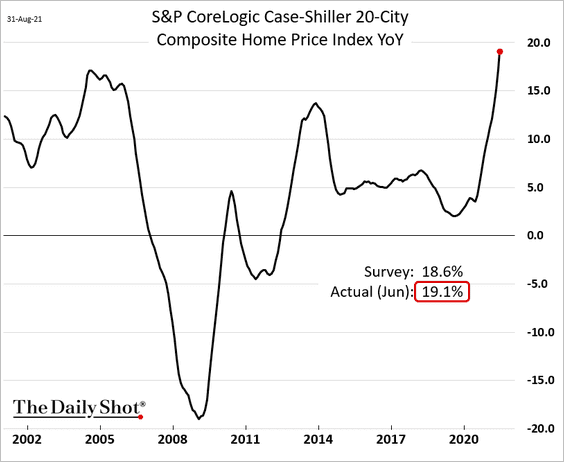
5. Home price appreciation hit new highs in June, with the Case-Shiller index rising by over 19% (year over year).
• The Case-Shiller index monthly changes:
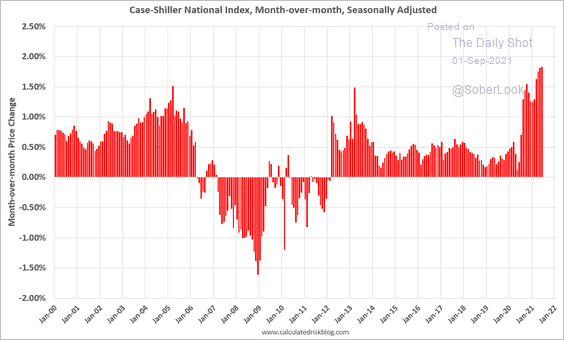 Source: @calculatedrisk Read full article
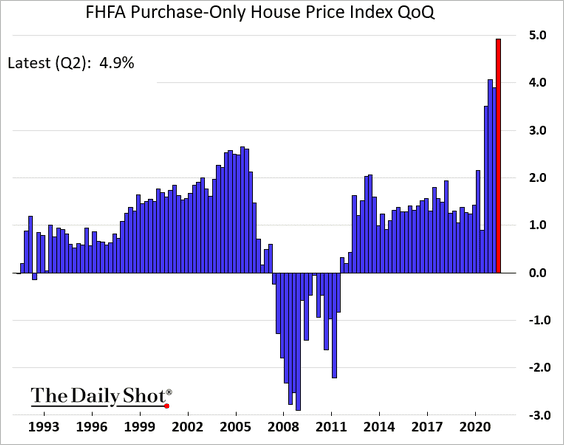
• The FHFA housing index quarterly changes:
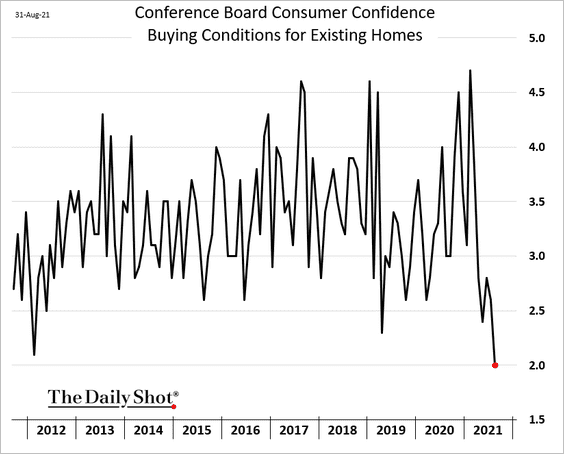
Rising home prices are spooking potential buyers.
——————–
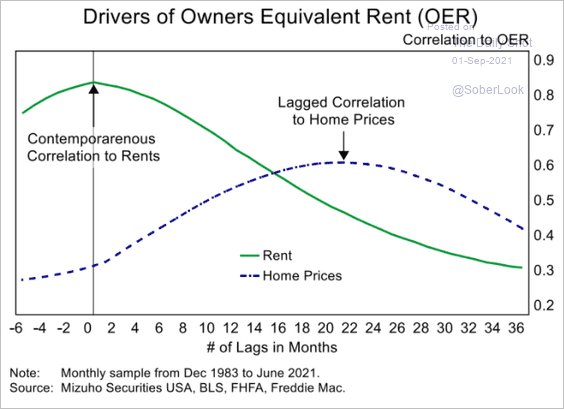
6. Next, we have some updates on inflation.
• Home price appreciation takes longer to affect the owners’ equivalent rent (OER) inflation. The massive spike in housing prices (#5 above) will show up in the CPI data in the months ahead.
 Source: Mizuho Securities USA
• Rent inflation has been accelerating.
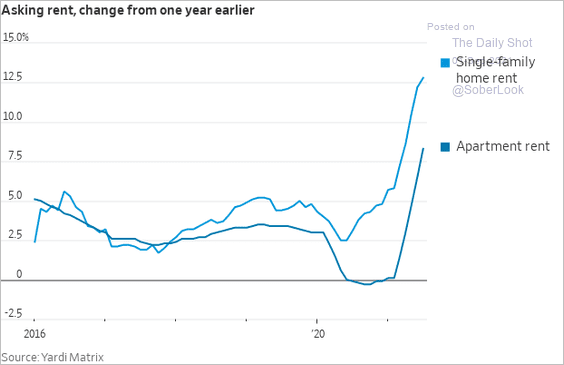 Source: @WSJ Read full article
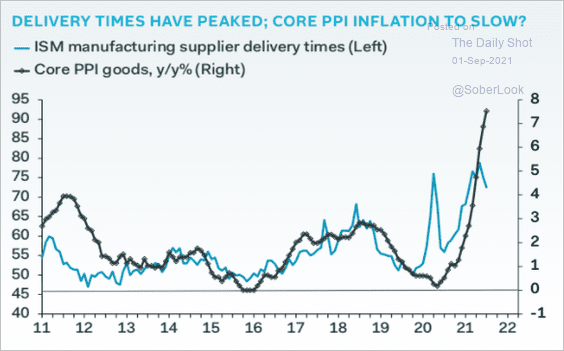
• Does the peak in supplier delivery times suggest a slowdown in the goods PPI?
 Source: Pantheon Macroeconomics
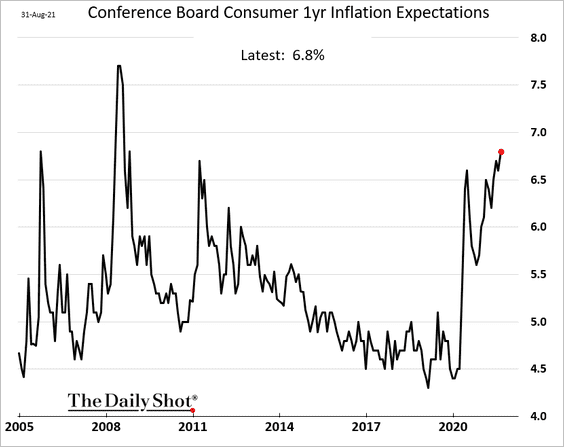
• Similar to the U. Michigan report, the Conference Board’s consumer inflation expectations have been rising.
——————–
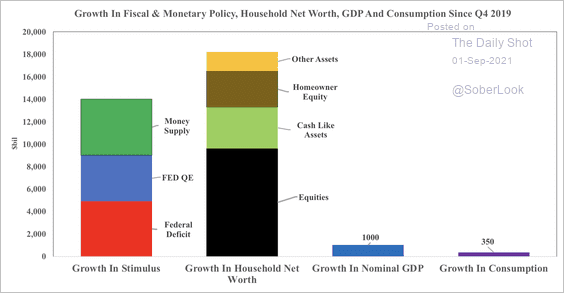
7. This chart shows growth in pandemic-related stimulus as well as household net worth compared to nominal GDP and consumption growth.
 Source: SOM Macro Strategies
And here is money supply growth versus loan growth and nominal GDP growth.
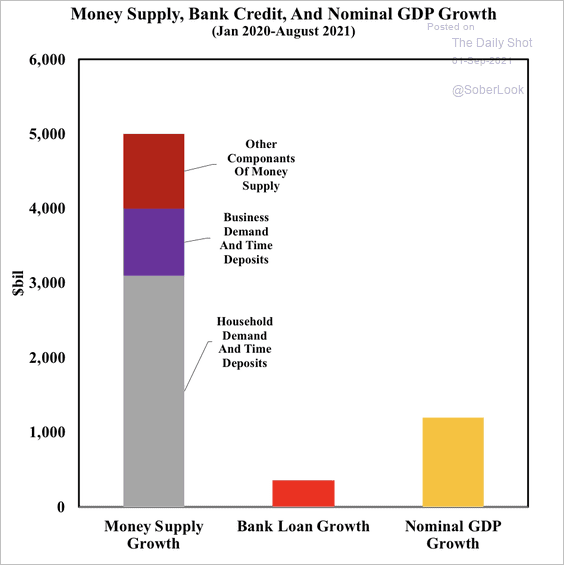 Source: SOM Macro Strategies
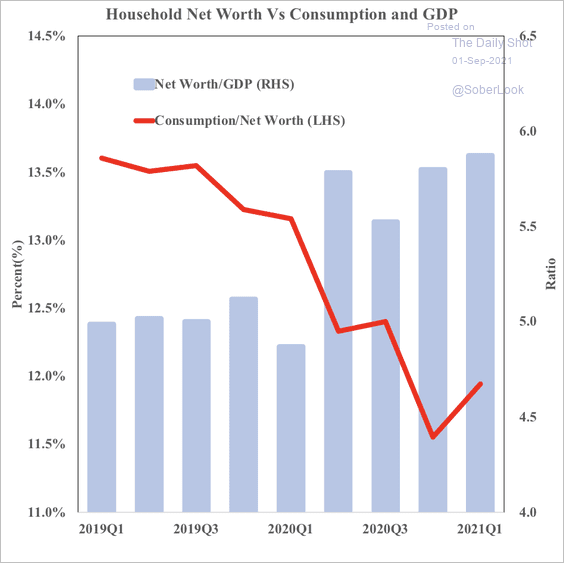
• Will households turn stimulus and wealth growth into consumption growth?
 Source: SOM Macro Strategies
• Services consumption still has a lot of room to recover as a share of total consumption.
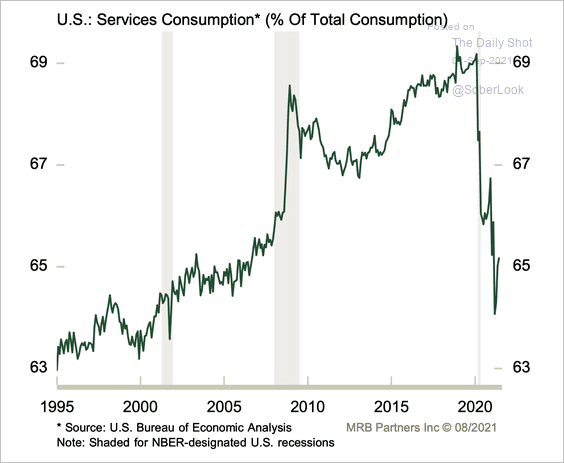 Source: MRB Partners
• There is no deleveraging pressure for households in this economic cycle.
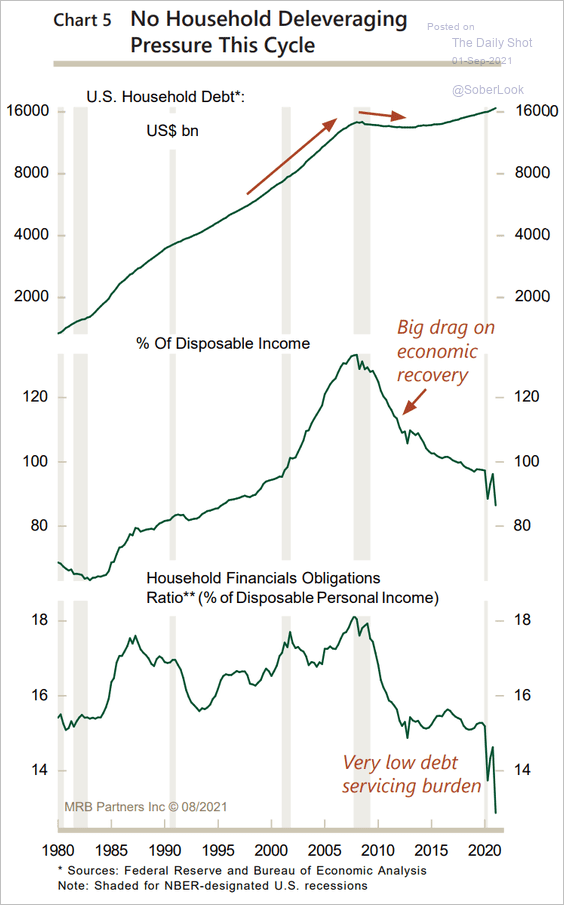 Source: MRB Partners
——————–
8. High previous infection rates in the US offer additional protection for the population going forward.
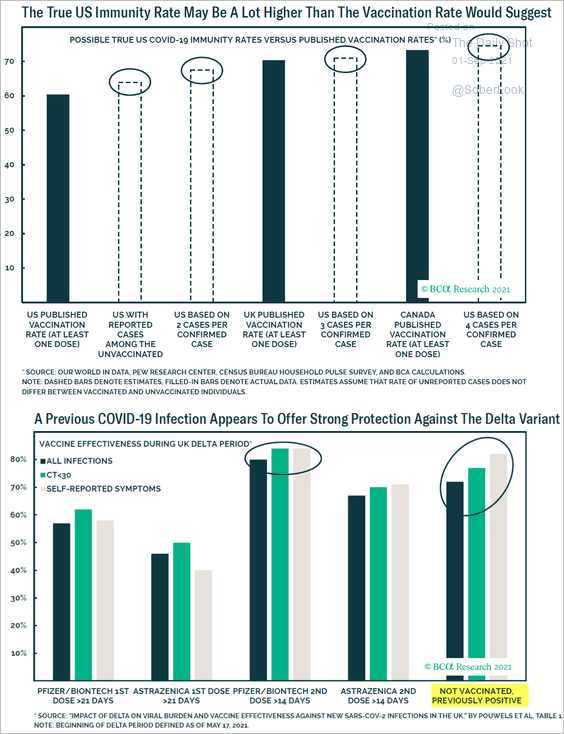 Source: BCA Research
Back to Index
Canada
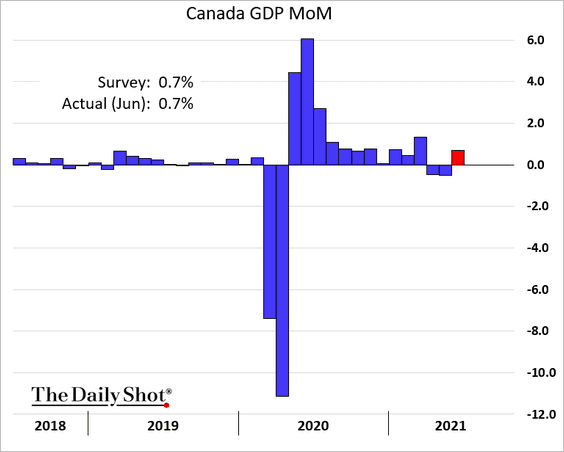
The economy unexpectedly contracted in the second quarter.
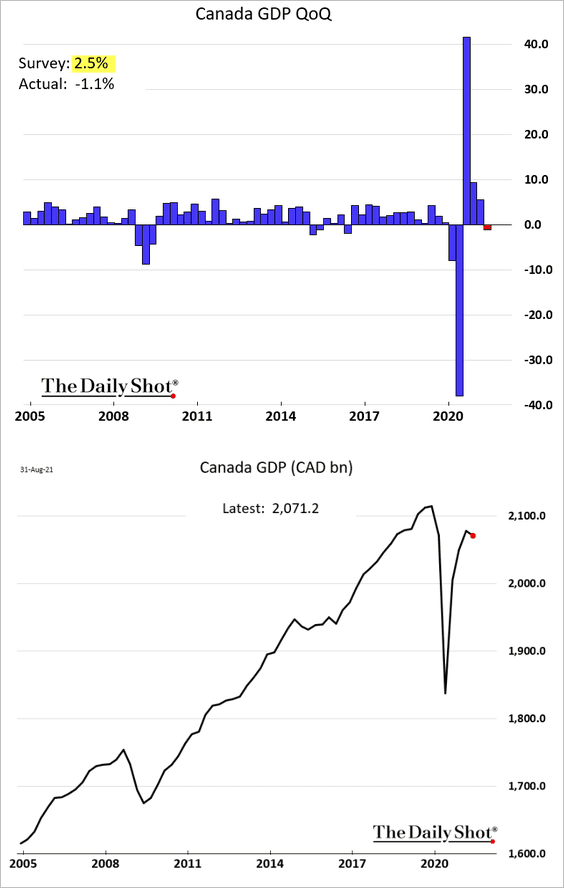
But there was a rebound in June.
Back to Index
The United Kingdom
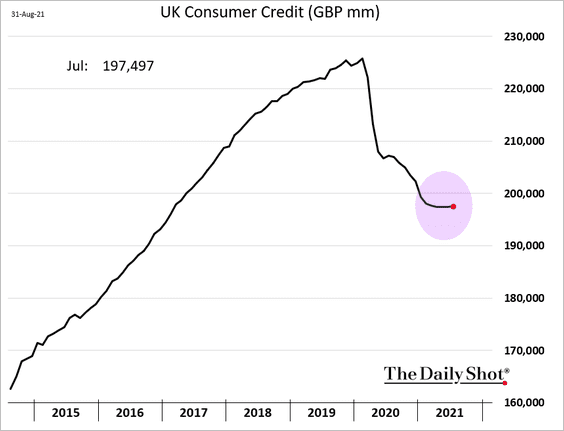
1. UK consumers remain cautious when it comes to credit.
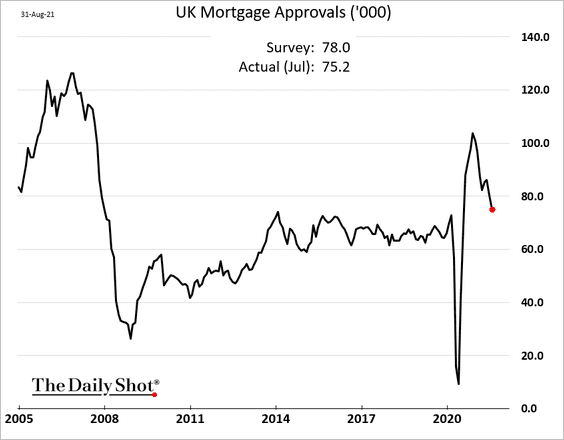
2. Mortgage approvals surprised to the downside.
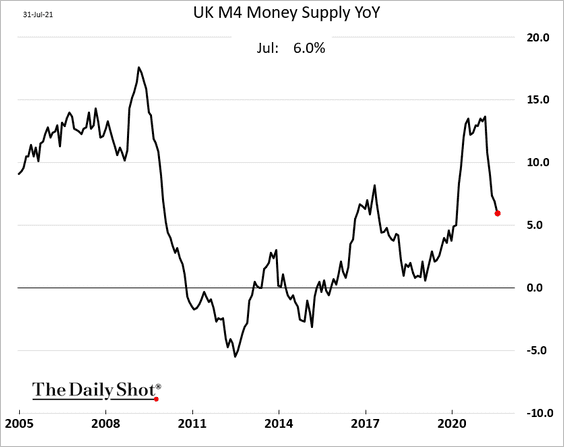
3. The expansion rate in the broad money supply continues to moderate.
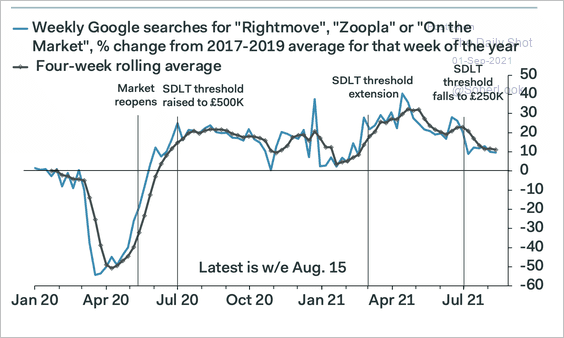
4. Based on search data, the UK housing market is showing signs of cooling.
 Source: Pantheon Macroeconomics
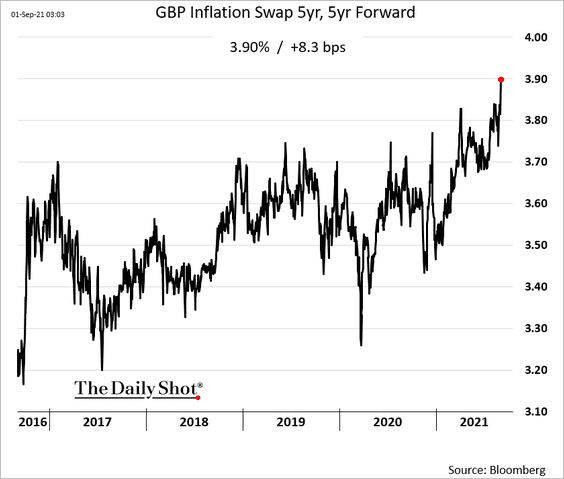
5. Longer-term market-based inflation expectations continue to move higher.
6. Manufacturers’ inventories are at record lows amid supply bottlenecks.
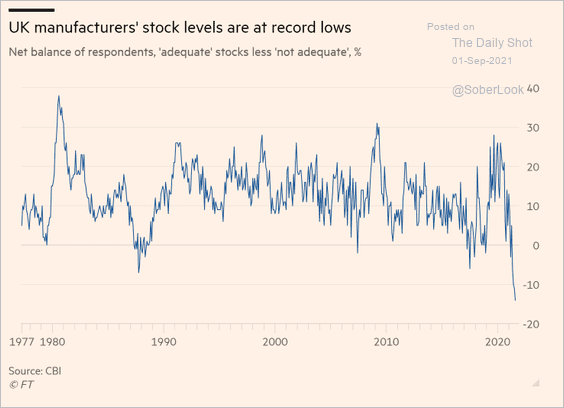 Source: @financialtimes Read full article
7. COVID cases among the UK’s older population have risen.
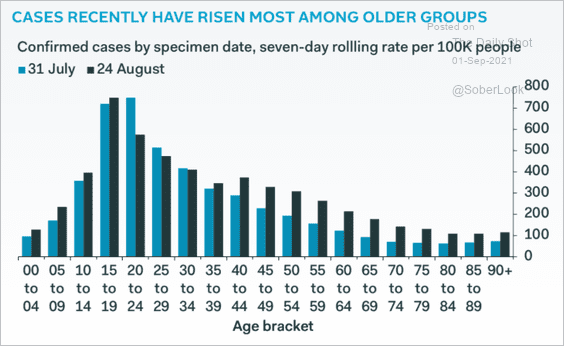 Source: Pantheon Macroeconomics
Back to Index
The Eurozone
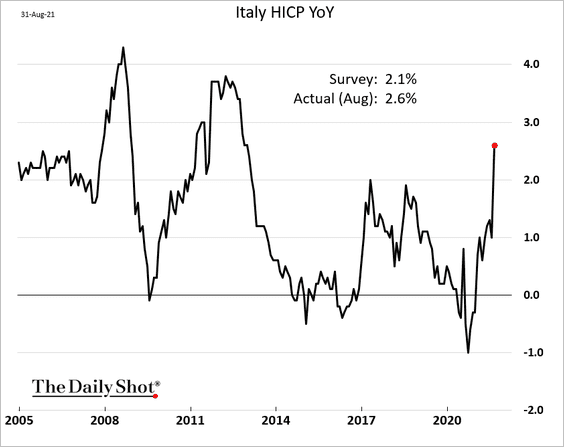
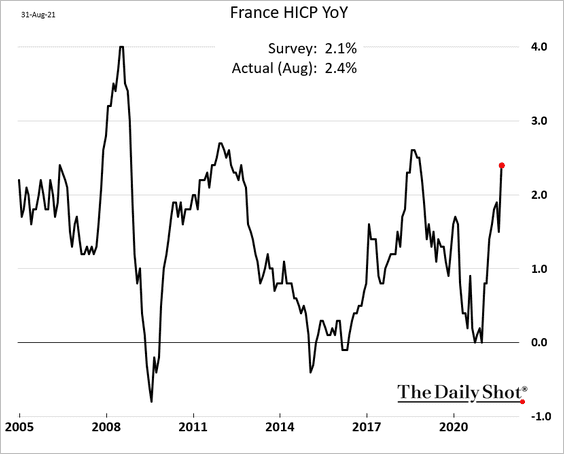
1. Inflation surprised to the upside, hitting the highest level in a decade.
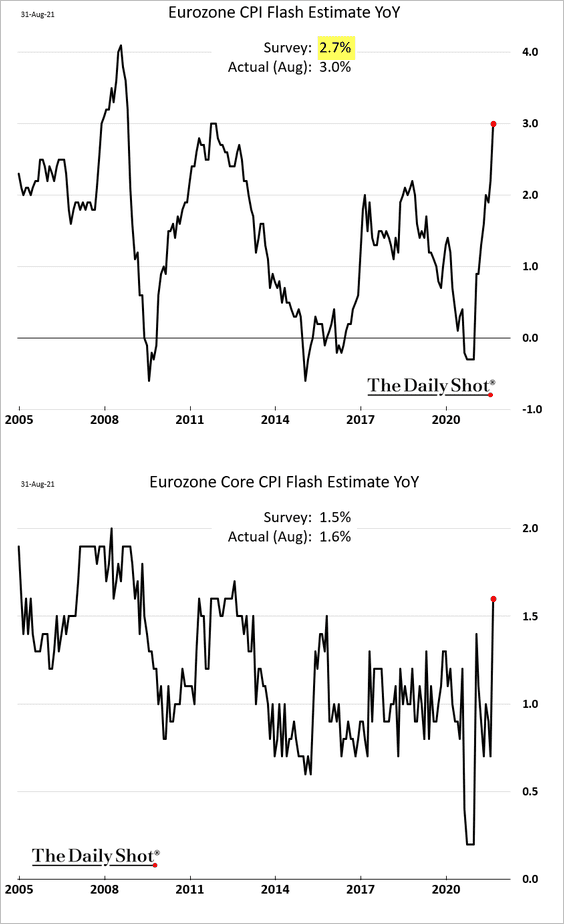
• CPI data from Italy and France topped forecasts.
• Here are the contributions, …
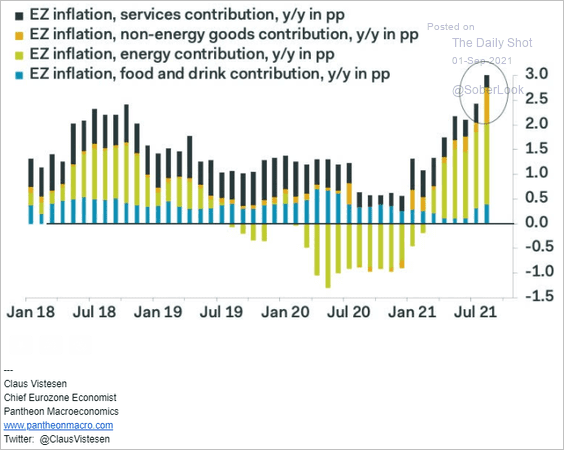 Source: Pantheon Macroeconomics
… with goods inflation surging.
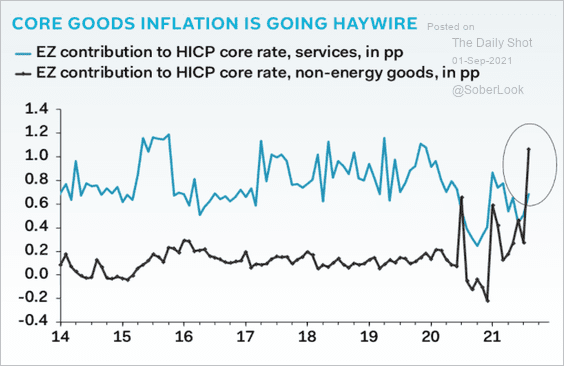 Source: Pantheon Macroeconomics
——————–
2. ECB’s Knot made some hawkish comments in response to rising inflation. Will taper come sooner than expected?
 Source: Forexlive Read full article
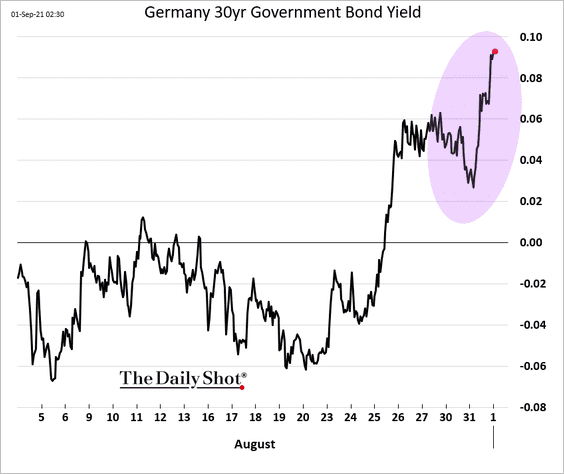
Bond yields climbed across Europe.
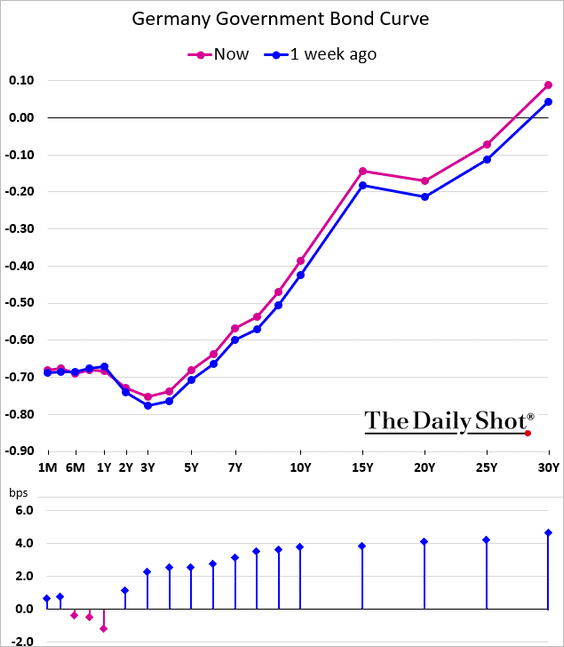
The Bund curve has been steepening.
——————–
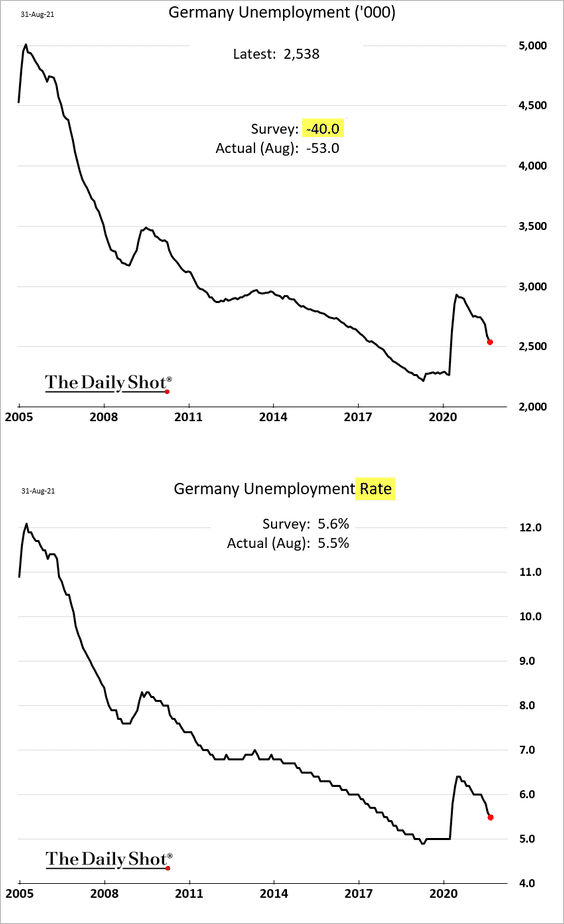
3. Germany’s labor market is healing rapidly.
Demand for workers is strengthening across the Eurozone.
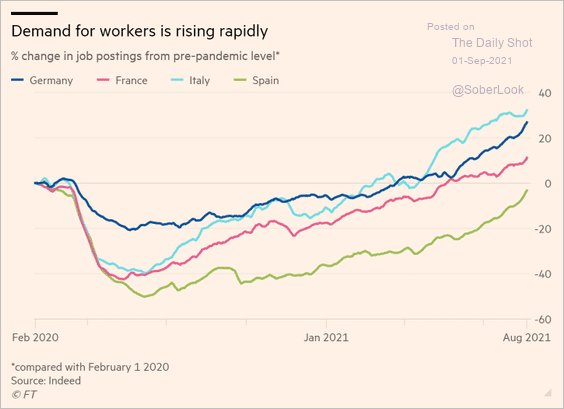 Source: @financialtimes Read full article
Back to Index
Japan
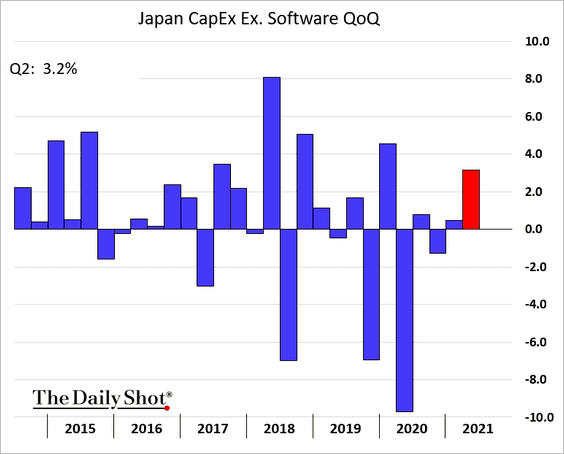
1. CapEx (business investment) was robust in the second quarter.
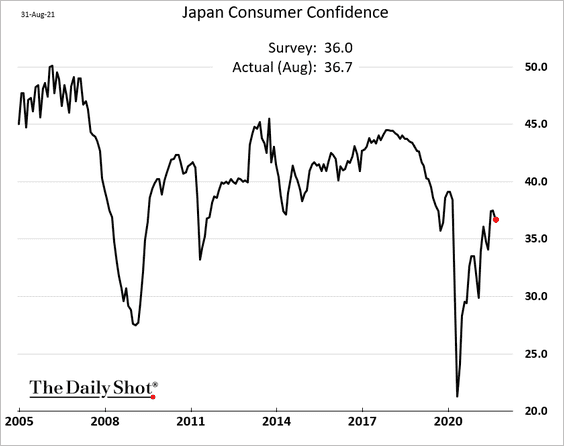
2. Consumer confidence remains resilient.
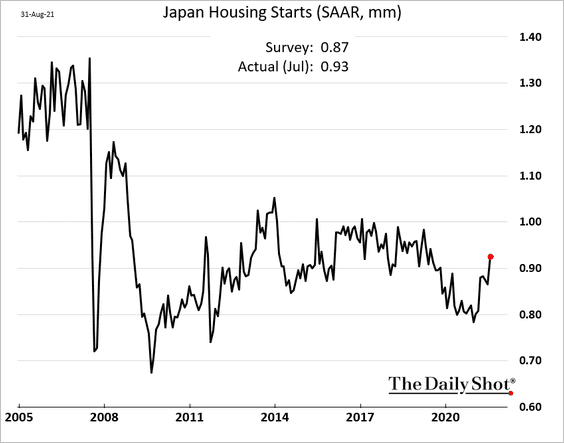
3. Housing starts continue to climb.
Back to Index
Asia – Pacific
1. South Korea’s manufacturing growth has slowed markedly.
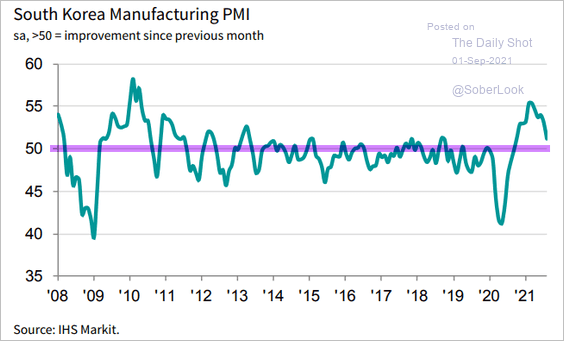 Source: IHS Markit
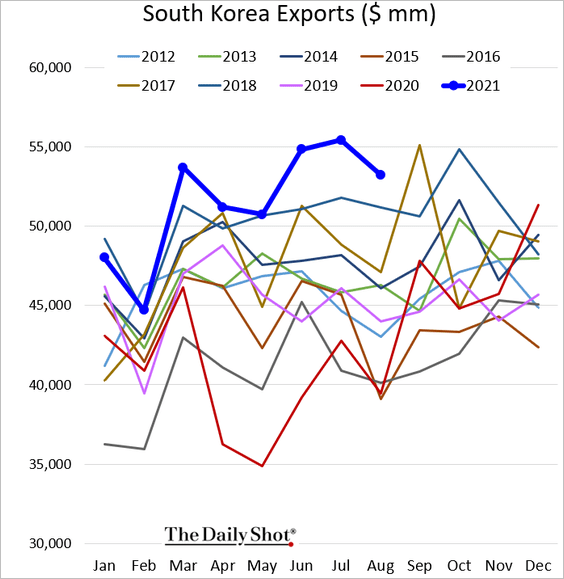
Exports have been robust.
——————–
2. Taiwan’s factory activity remains strong.
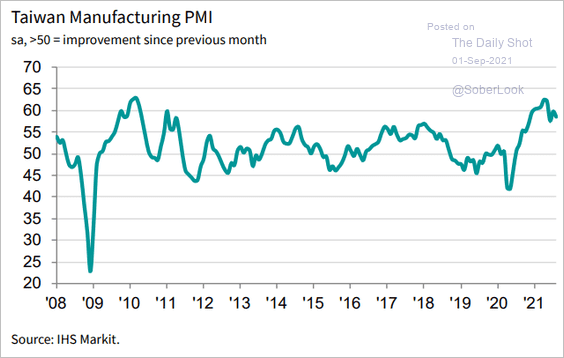 Source: IHS Markit
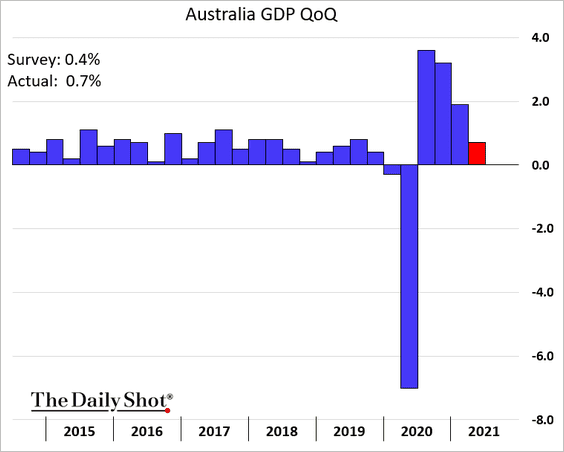
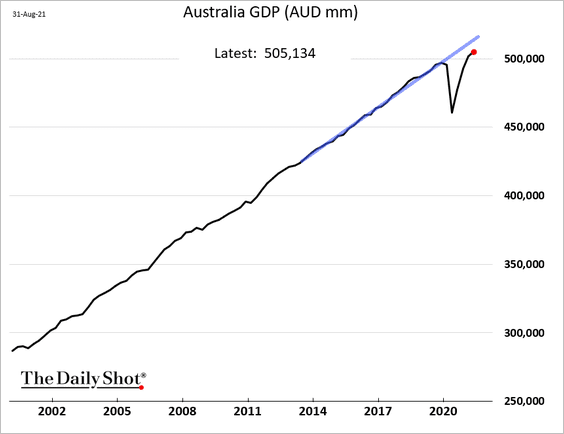
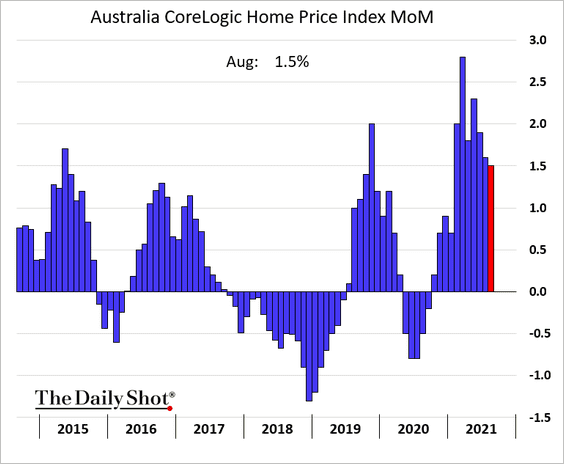
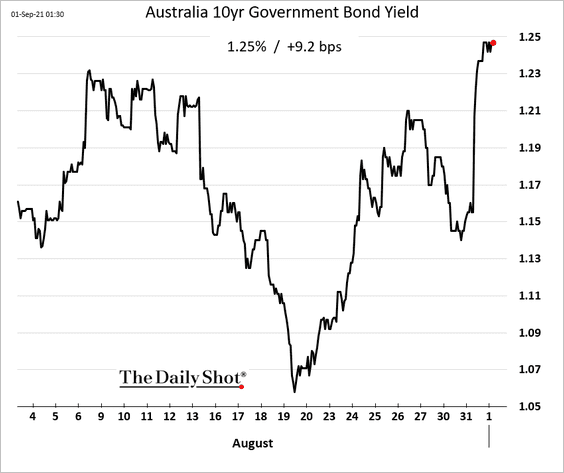
3. Next, we have some updates on Australia.
• Second-quarter economic growth topped forecasts.
• Home price appreciation remains elevated.
• Bond yields jumped today, partially in response to some hawkish ECB comments.
Back to Index
China
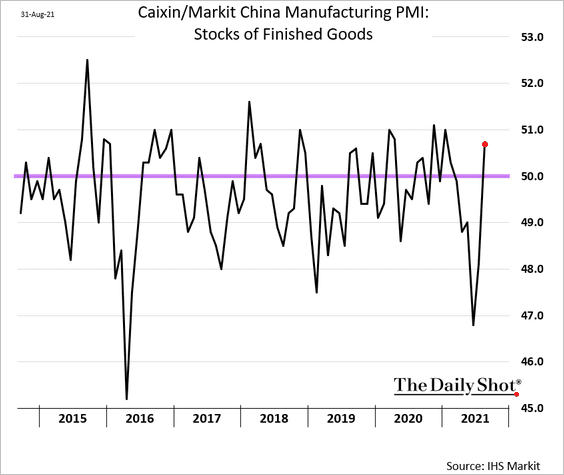
1. Markit’s manufacturing PMI confirmed what we saw in the official data yesterday. Business activity is slowing.
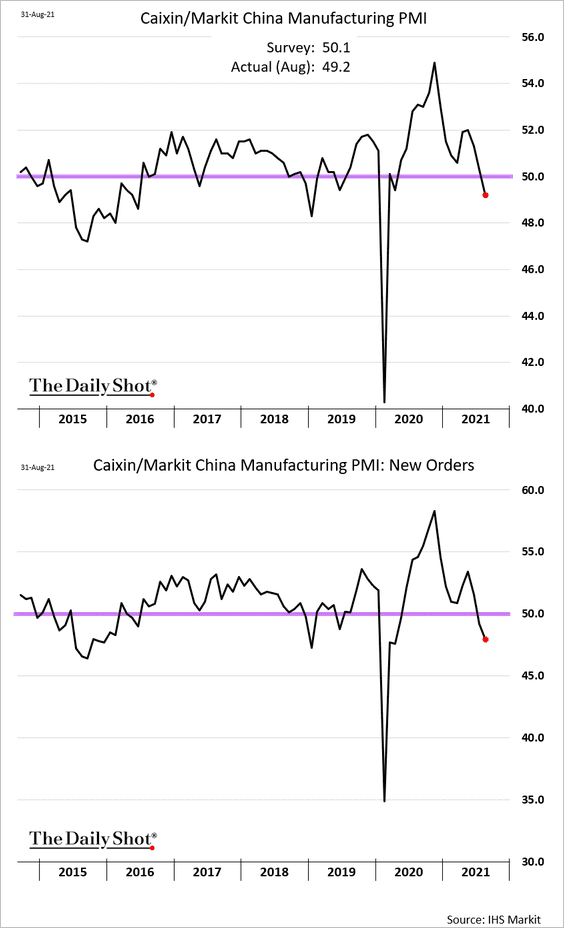
Moreover, manufacturing inventories are now rising.
——————–
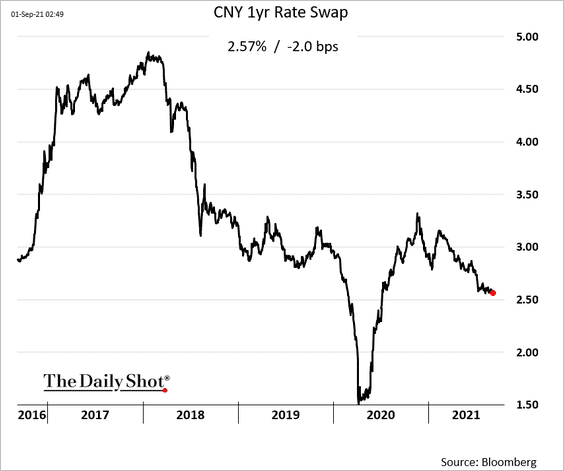
2. The market increasingly expects monetary easing.
• The 5yr bond yield:
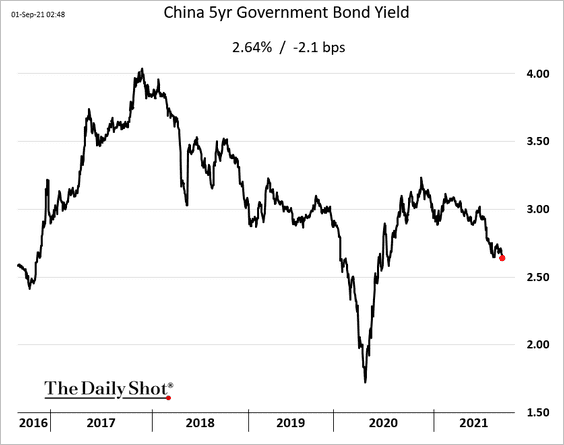
• The 1yr interest rate swap:
——————–
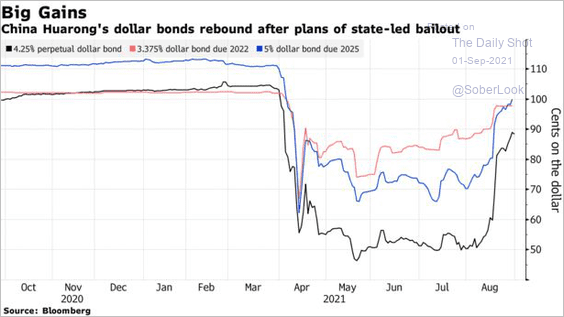
3. Huarong’s bonds continue to rebound in response to the bailout.
 Source: Bloomberg Read full article
4. Here are China’s biggest corporate borrowers.
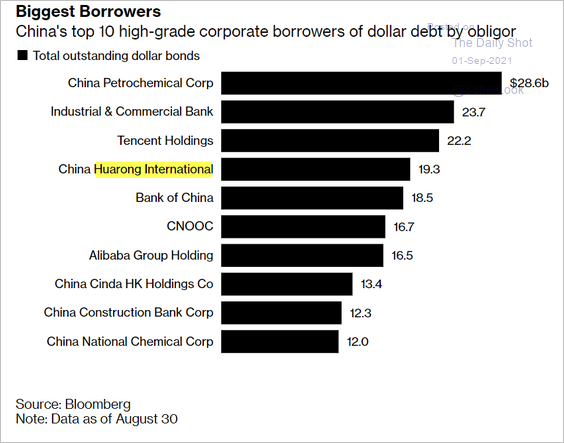 Source: Bloomberg Read full article
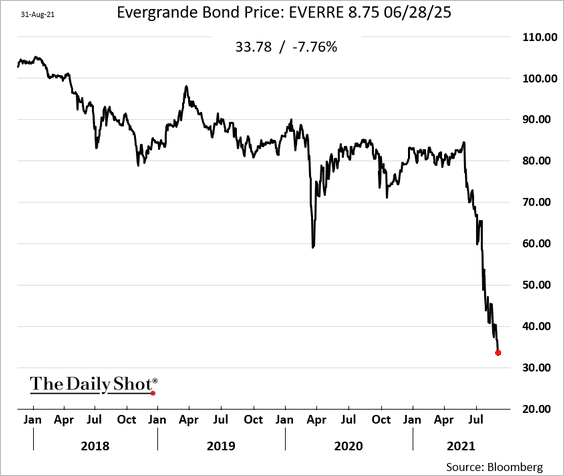
5. Evergrande’s bonds are collapsing amid talk of default.
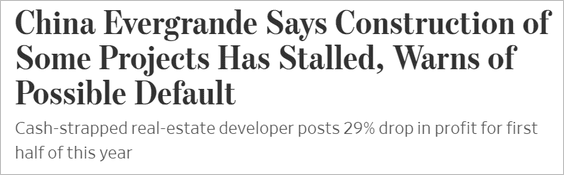 Source: @WSJ Read full article
——————–
6. Stocks have decoupled from the yuan.
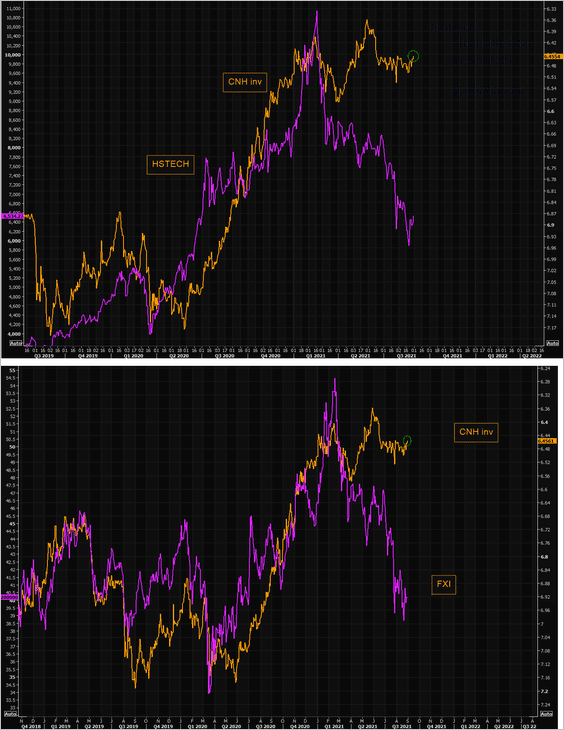 Source: @themarketear
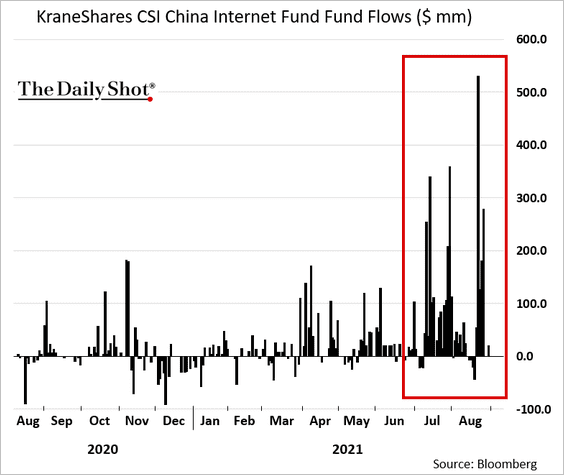
7. KraneShares’ China internet ETF has been seeing substantial inflows.
Back to Index
Emerging Markets
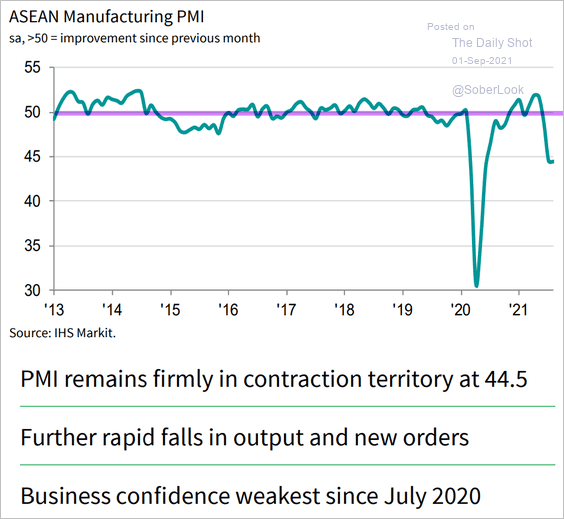
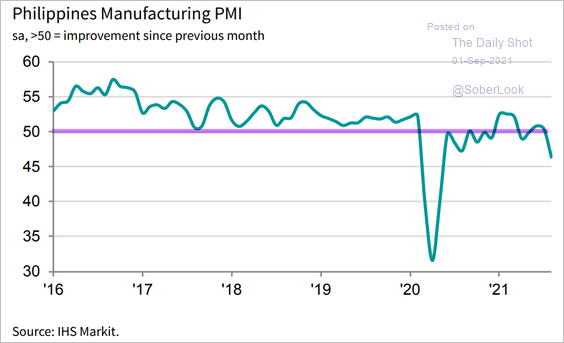
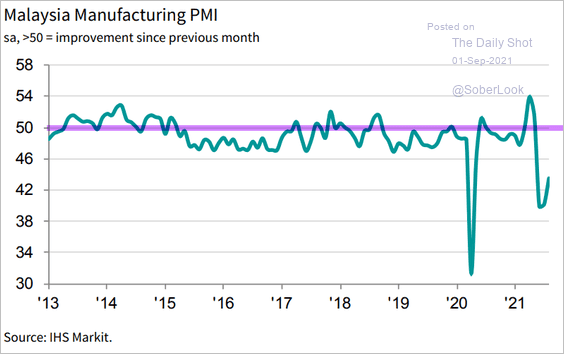
1. Asian PMI reports point to an ongoing manufacturing recession (PMI < 50 = contraction).
• ASEAN:
 Source: IHS Markit
• The Philippines:
 Source: IHS Markit
• Malaysia:
 Source: IHS Markit
• Thailand:
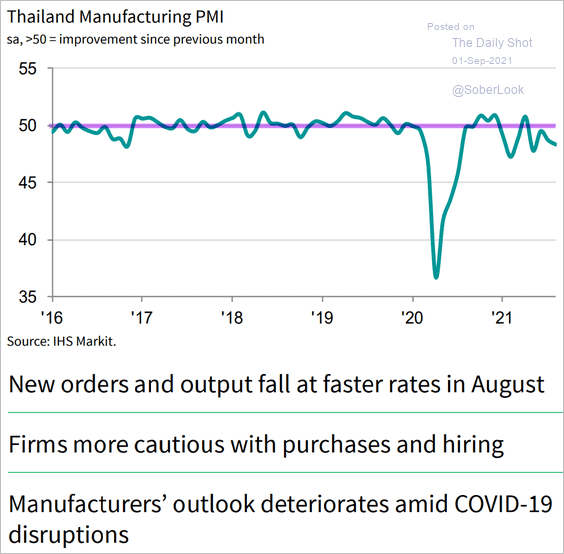 Source: IHS Markit
• Indonesia:
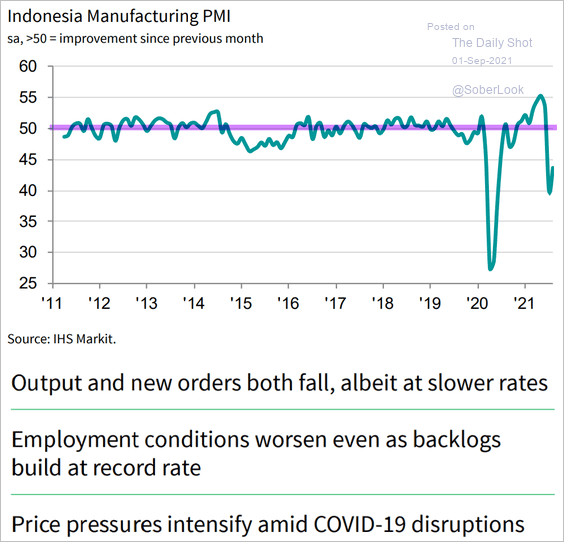 Source: IHS Markit
• Vietnam:
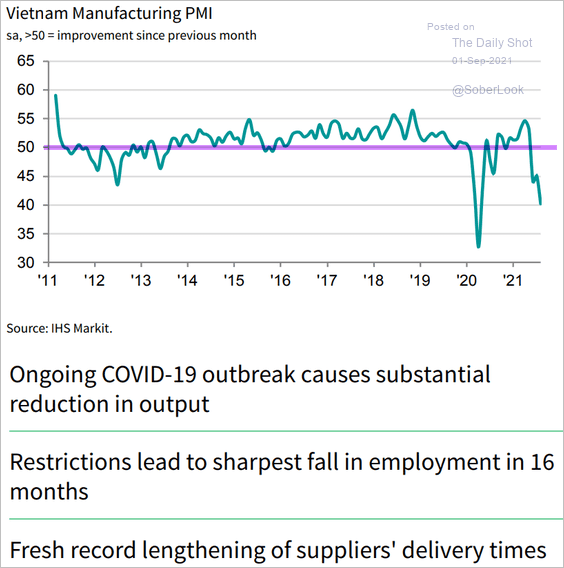 Source: IHS Markit
——————–
2. Columbia, Russia, and Brazil are among some of the EM currencies trading far below fair value, according to Oxford Economics.
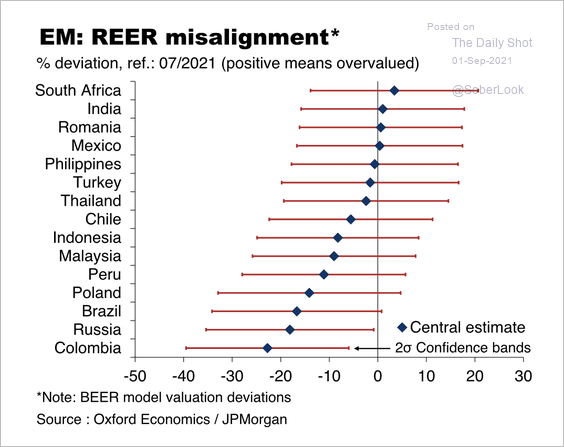 Source: Oxford Economics
• The Colombian peso has never managed to fully recover since the 2014 oil market crash.
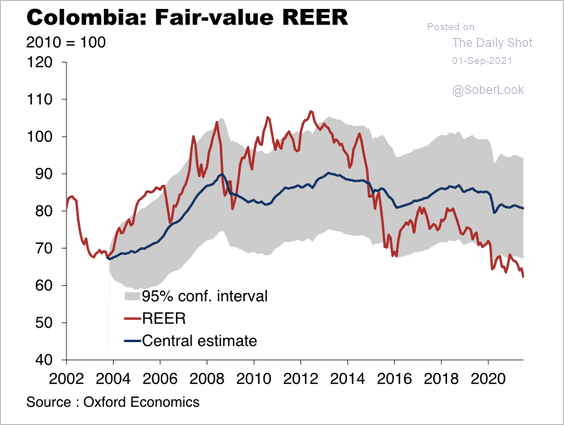 Source: Oxford Economics
• The Mexican peso is the only Latin American currency trading at a “fair price”, according to Oxford Economics.
 Source: Oxford Economics
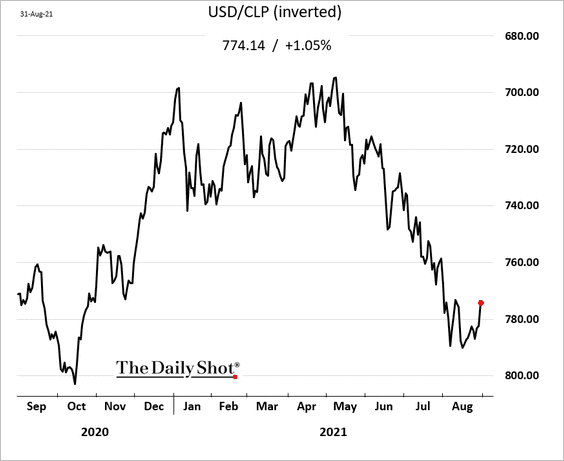
• The Chilean peso appears to have bottomed.
Back to Index
Cryptocurrency
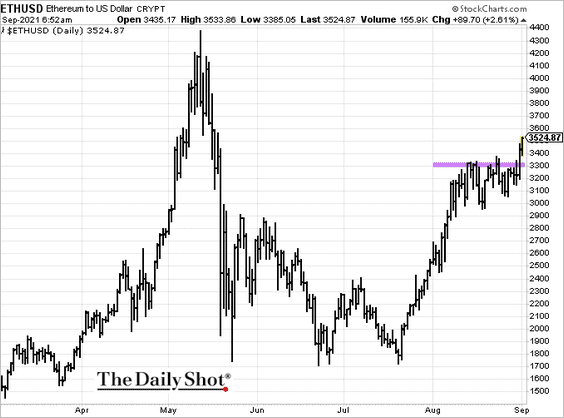
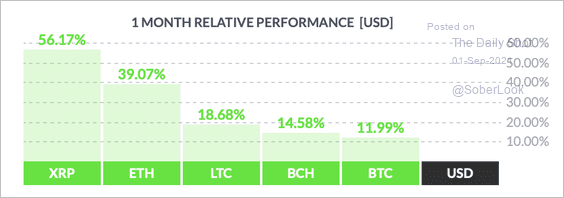
1. Ether is surging after breaking above resistance.
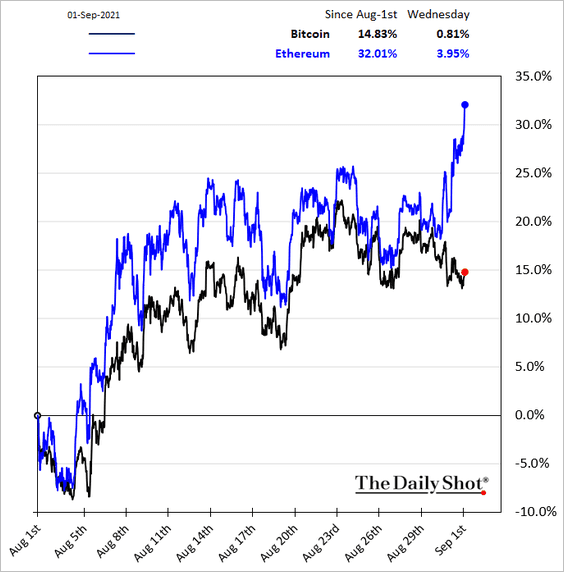
Bitcoin underperformed some of the largest cryptocurrencies in August. Altcoins led the way higher.
 Source: FinViz
——————–
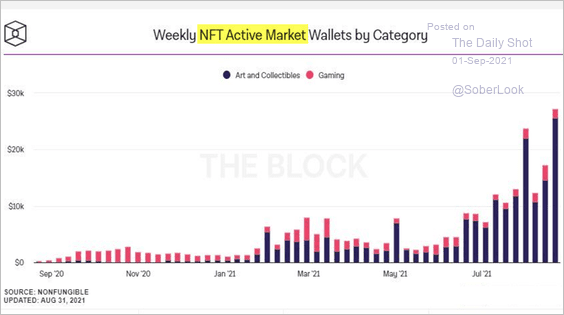
2. Transaction fees on the Ethereum blockchain have spiked recently, partly due to the resurgence of non-fungible token (NFT) activity (second chart).
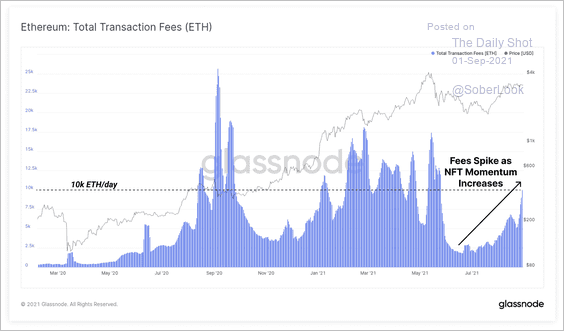 Source: Glassnode Read full article
 Source: @michaelbatnick Read full article
——————–
3. This chart shows the rise in total value locked in decentralized finance (DeFi) chains.
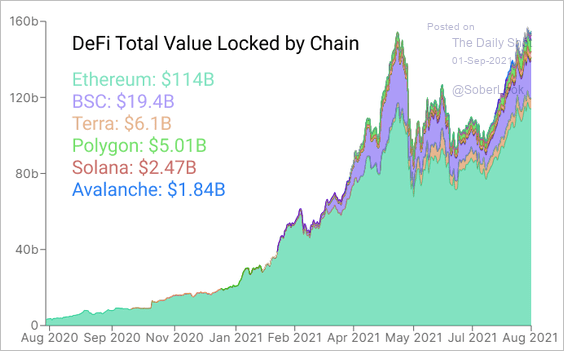 Source: Glassnode Read full article
Blockchain transaction activity has reached new lows for some of the largest DeFi tokens.
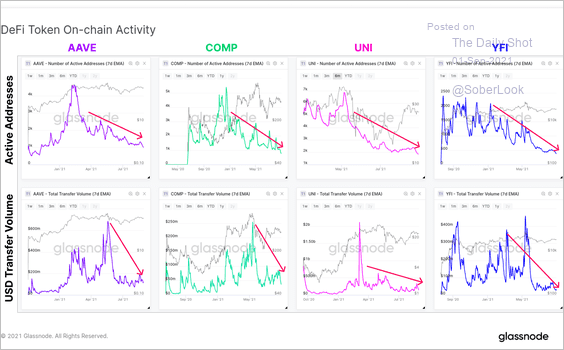 Source: Glassnode Read full article
Back to Index
Commodities
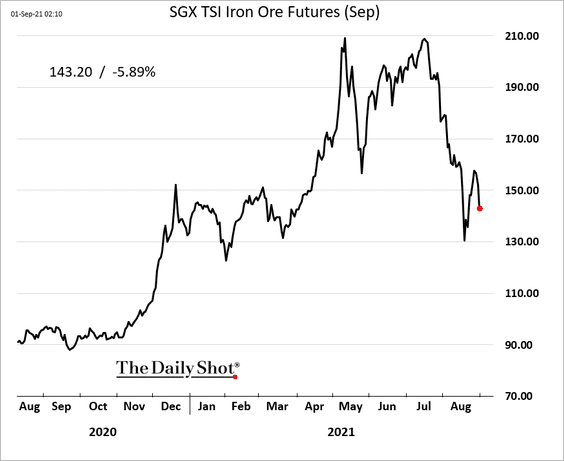
1. Iron ore is under pressure again as China’s economic growth weakens.
 Source: MINING.COM Read full article
——————–
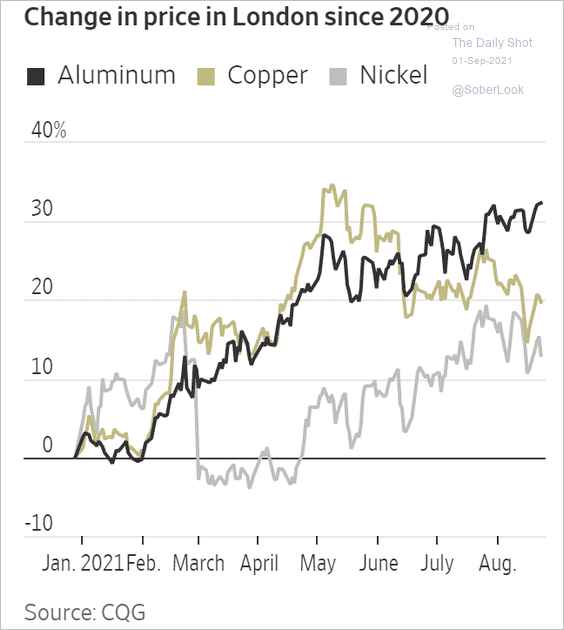
2. Aluminum has been outperforming other industrial metals.
 Source: @WSJ Read full article
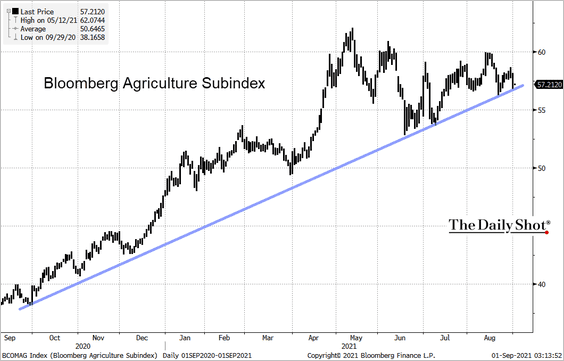
3. Bloomberg’s agriculture index is testing support.
 Source: @TheTerminal, Bloomberg Finance L.P.
Back to Index
Energy
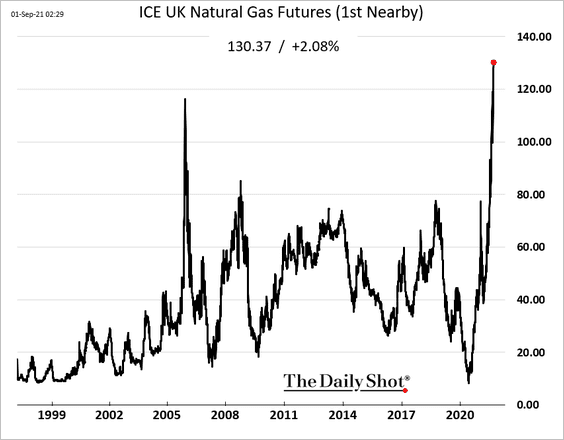
1. European natural gas prices have gone parabolic as Russia pumps less gas to Europe.
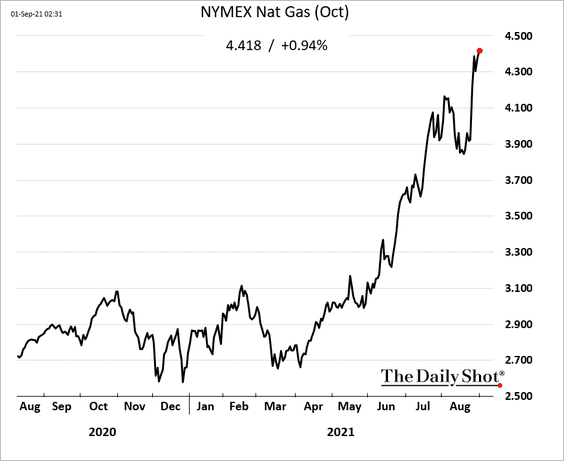
US gas prices are also surging.
——————–
2. This chart shows US coal-fired electric generating capacity.
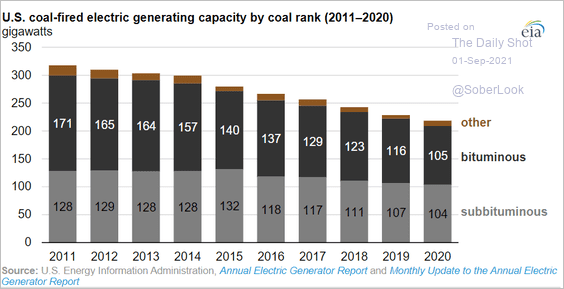 Source: EIA Read full article
Back to Index
Equities
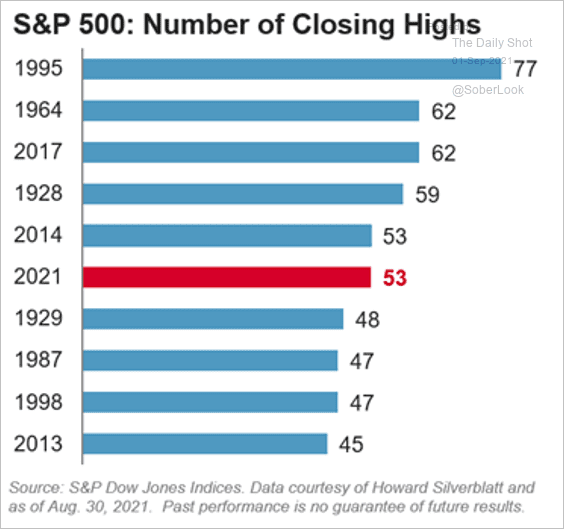
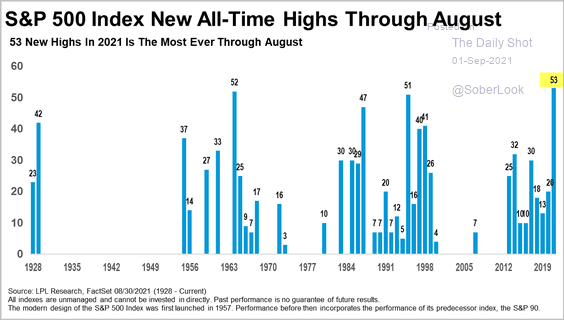
1. So far, the S&P 500 hit 53 new highs this year, …
 Source: S&P Global Market Intelligence
… the most ever through August.
 Source: LPL Research
——————–
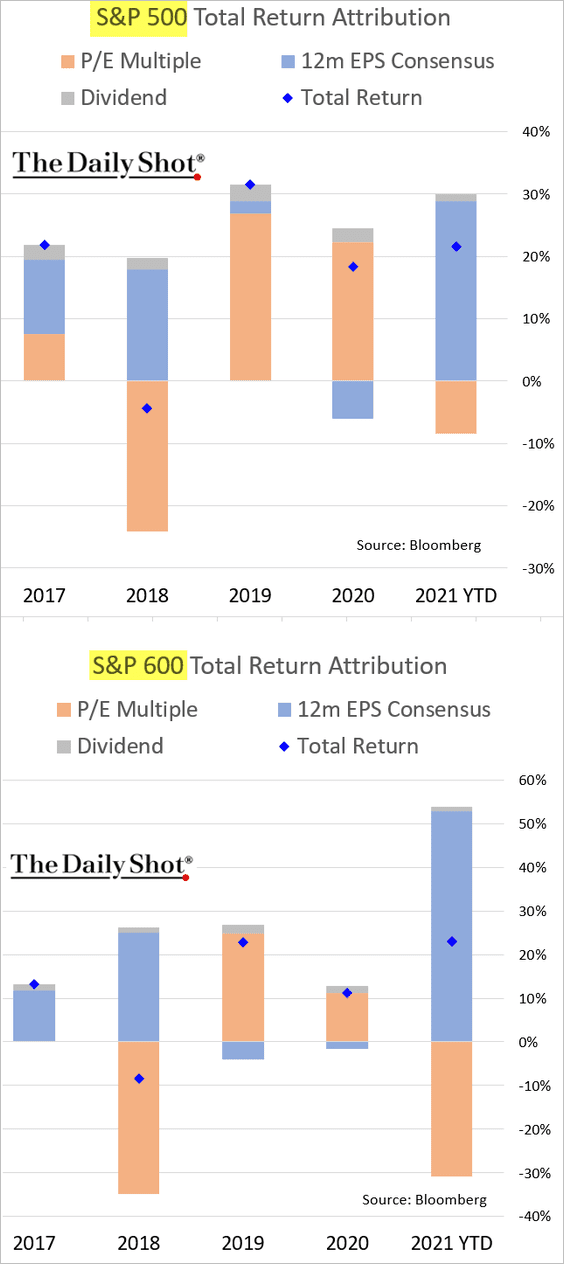
2. Returns have been driven by rising earnings expectations.
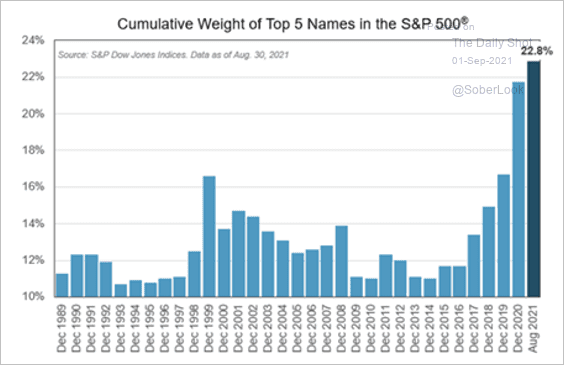
3. Top five names now represent 22.8% of the S&P 500.
 Source: S&P Global Market Intelligence
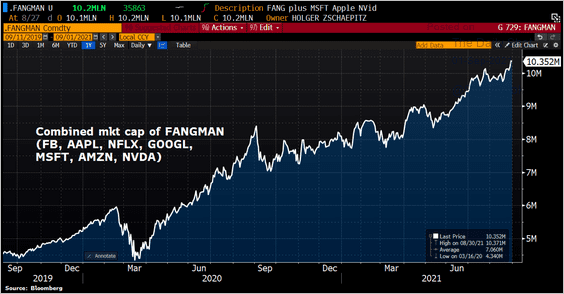
The market value of the US tech mega-caps is now above $10 trillion.
 Source: @Schuldensuehner
——————–
4. Retail brokers could face substantial revenue losses if the SEC prohibits order flow sales. Such an outcome would result in lower market liquidity. Will we also see a return to transaction fees?
 Source: Barron’s Read full article
——————–
5. EPS growth is peaking, with tougher comps ahead.
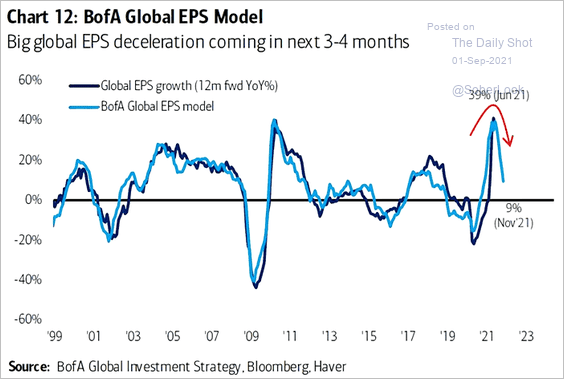 Source: @ISABELNET_SA, @BofAML
6. September can be a challenging month for stock returns.
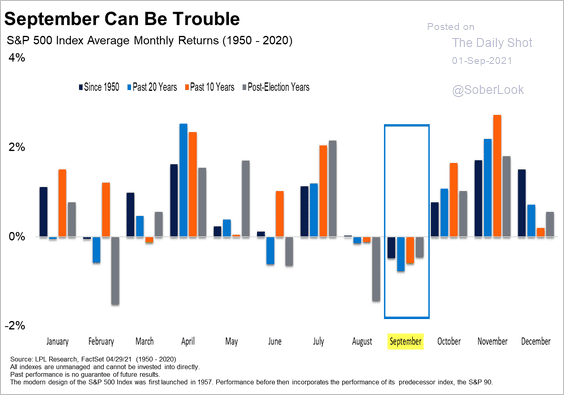 Source: LPL Research
7. Small-cap funds have been experiencing outflows.
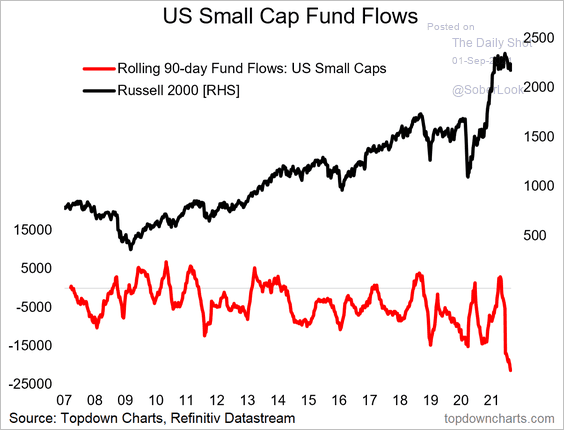 Source: @topdowncharts Read full article
8. Speculative assets have not recovered from the selloff at the beginning of the year.
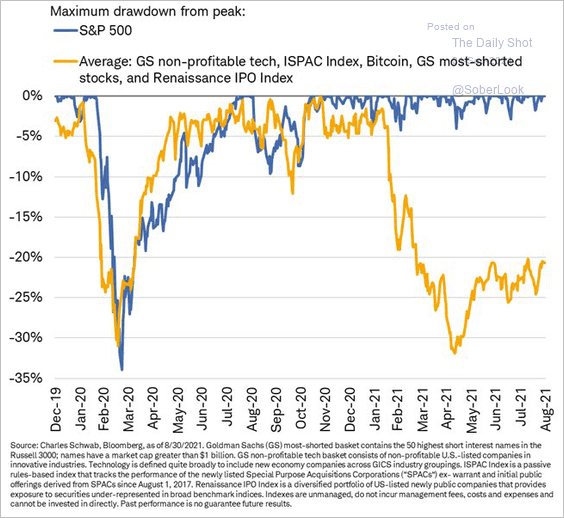 Source: @LizAnnSonders
9. The gap between stocks and consumer confidence continues to widen.
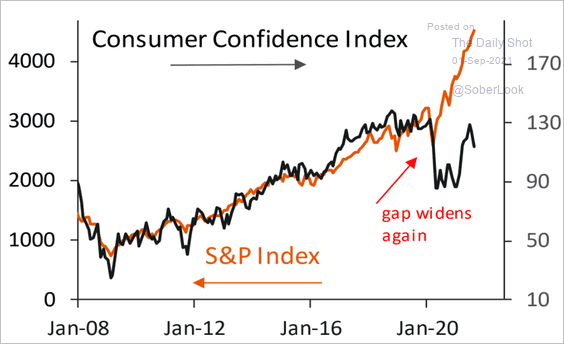 Source: Piper Sandler
10. Companies with weak balance sheets have been underperforming this summer.
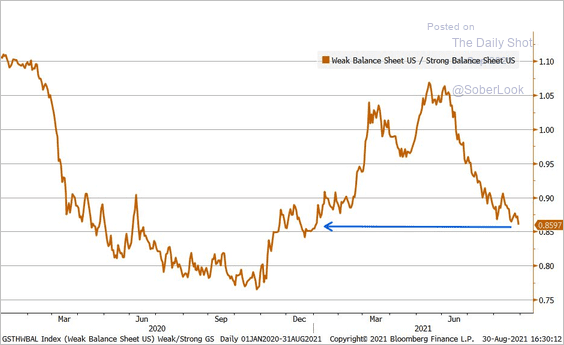 Source: @LizAnnSonders
Back to Index
Rates
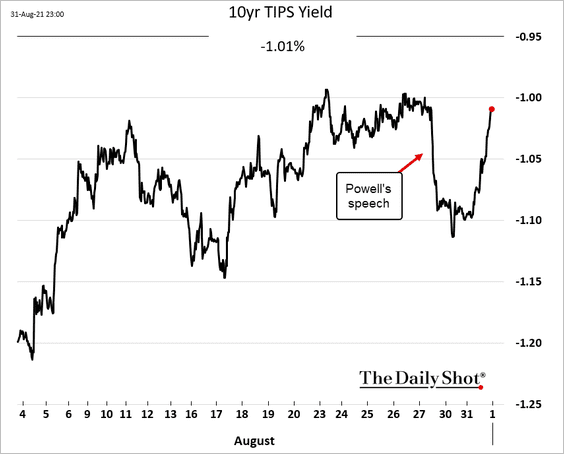
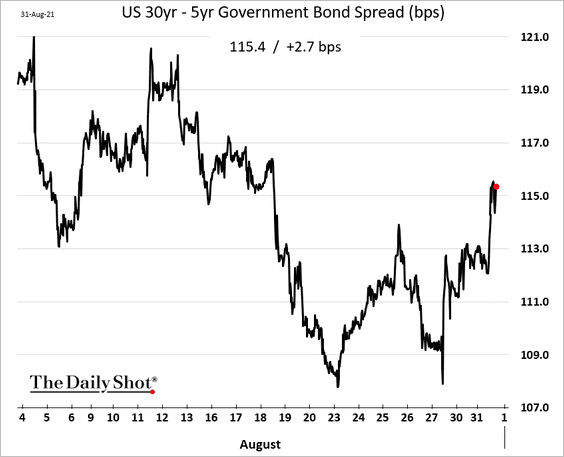
1. Real yields rebounded going into month-end.
The Treasury curve steepened at the longer end.
——————–
2. The US 10yr breakeven rate (inflation expectations) remains stuck in a range.
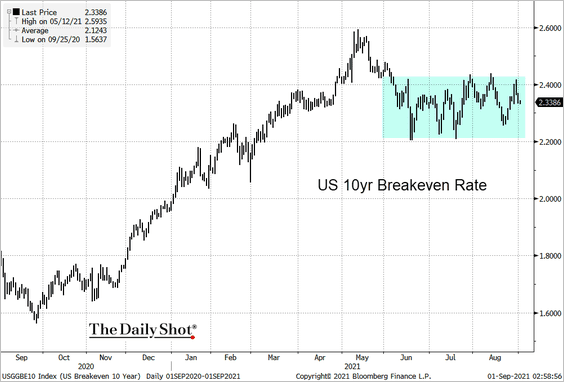 Source: @TheTerminal, Bloomberg Finance L.P.
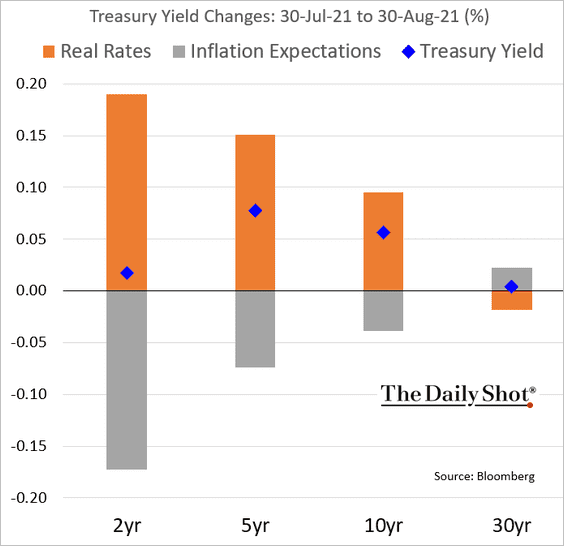
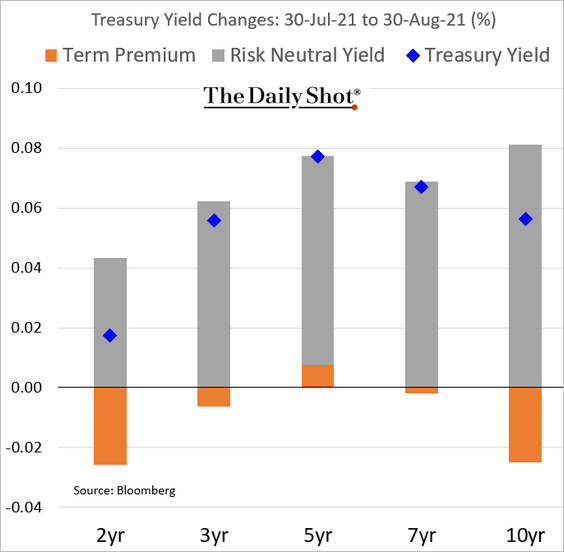
3. Here is the attribution of Treasury yield changes in August.
• Inflation expectations vs. real rates:
• Term premium vs. risk-neutral yield (expectations of short-term rates):
Back to Index
Global Developments
1. Here is a look at asset class returns in August.
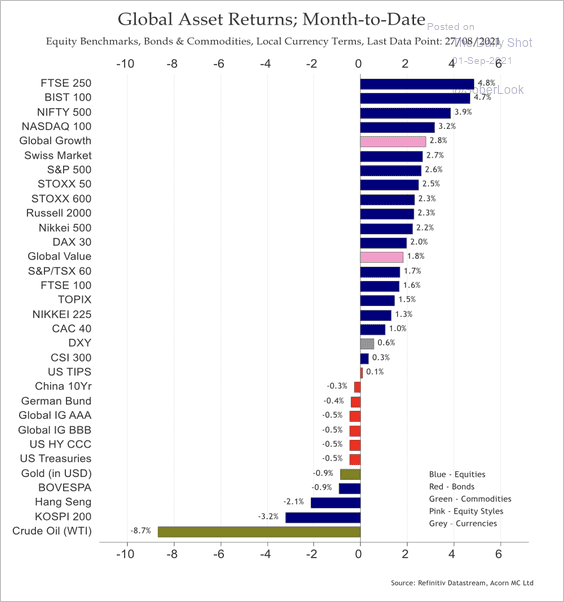 Source: Acorn Macro Consulting
2. This table shows UBS Asset Management’s five-year expected market returns (in dollar terms).
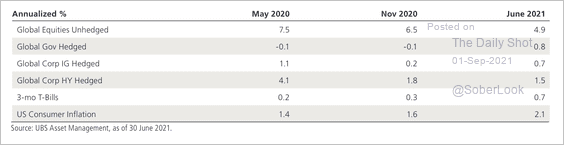 Source: UBS Asset Management
UBS expects negative real returns for most fixed-income assets over the next five years.
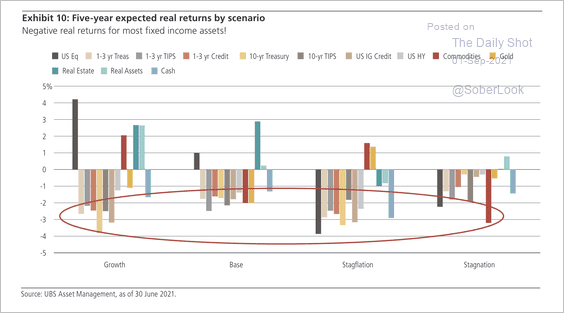 Source: UBS Asset Management
——————–
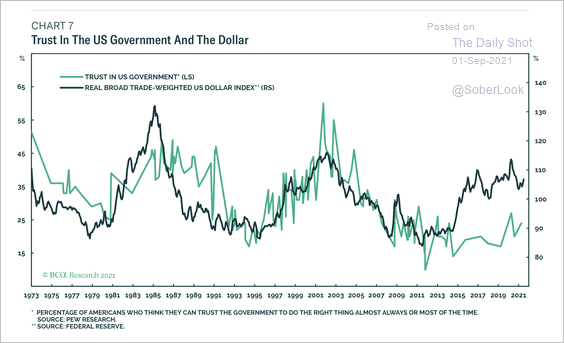
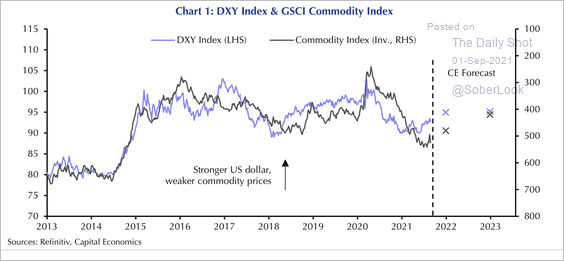
3. Moves in the dollar have correlated with trust in the US government.
 Source: BCA Research
Capital Economics expects the dollar to rise further as commodity prices fall and long-term government bond yields rise in the US more than elsewhere.
 Source: Capital Economics
——————–
Food for Thought
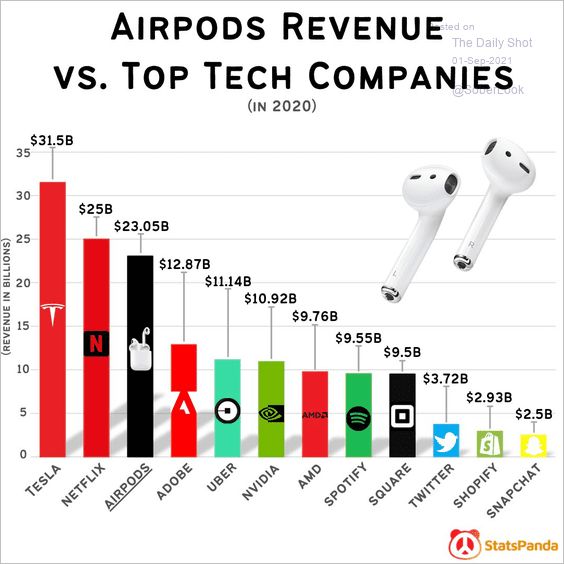
1. Airpods revenue in perspective:
 Source: @statspanda1, @nxthompson Read full article
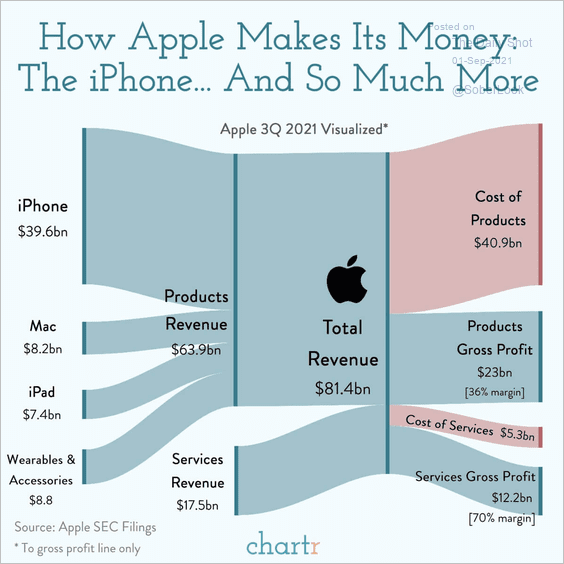
2. How Apple makes its money:
 Source: @chartrdaily
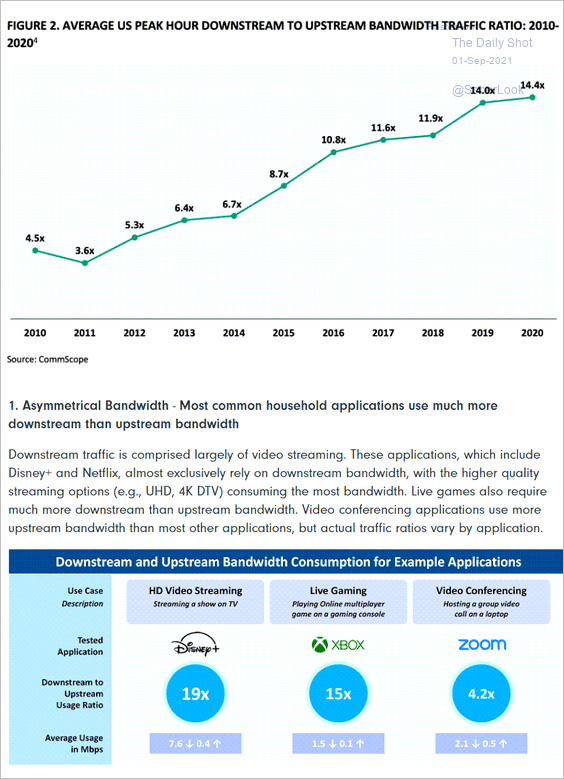
3. Downstream-to-upstream internet traffic ratio:
 Source: NCTA Read full article
4. Emissions reduction from EVs:
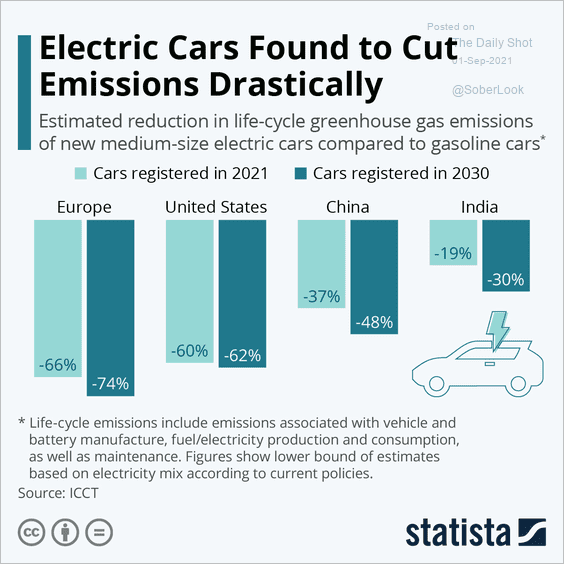 Source: Statista
5. Warm nights:
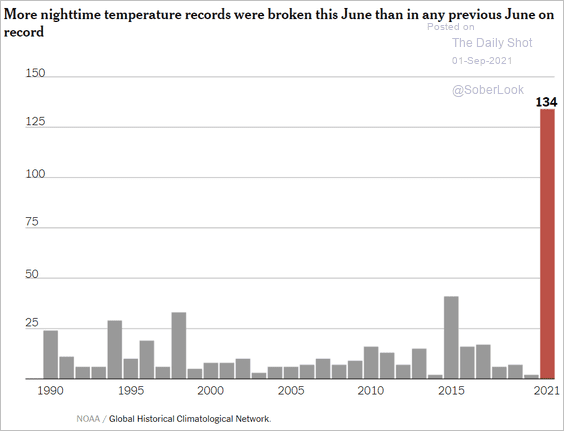 Source: The New York Times Read full article
6. Billion-dollar weather disasters:
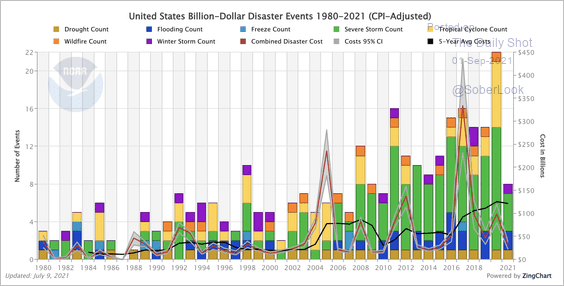 Source: NOAA Further reading
7. Share of the population that is 65+ and not fully vaccinated – the US vs. the UK:
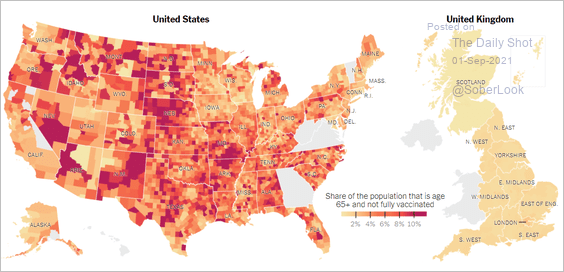 Source: The New York Times Read full article
8. Afghanistan’s mineral deposits:
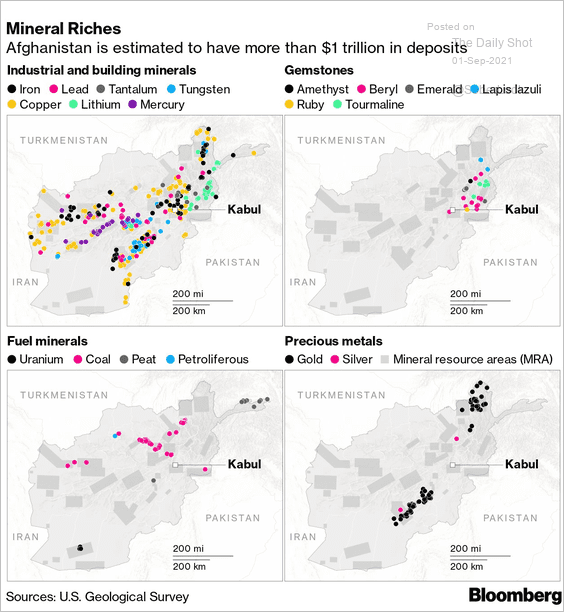 Source: @economics, @iainmarlow, @EndaCurran Read full article
9. Hate crime incidents in the US:
 Source: Statista
10. The shortest city name in each state:
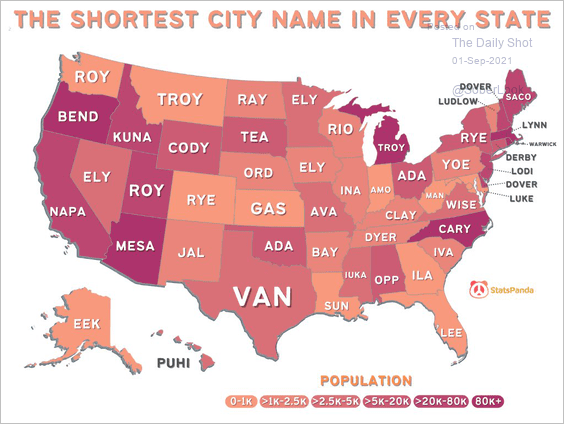 Source: @statspanda1
——————–
Back to Index