
The Daily Shot: 02-Sep-21
• The United States
• Canada
• The United Kingdom
• The Eurozone
• Europe
• Asia – Pacific
• China
• Emerging Markets
• Cryptocurrency
• Energy
• Equities
• Global Developments
• Food for Thought
——————–
• As a reminder, the next Daily Shot will be out on Tuesday, September 6th.
——————–
The United States
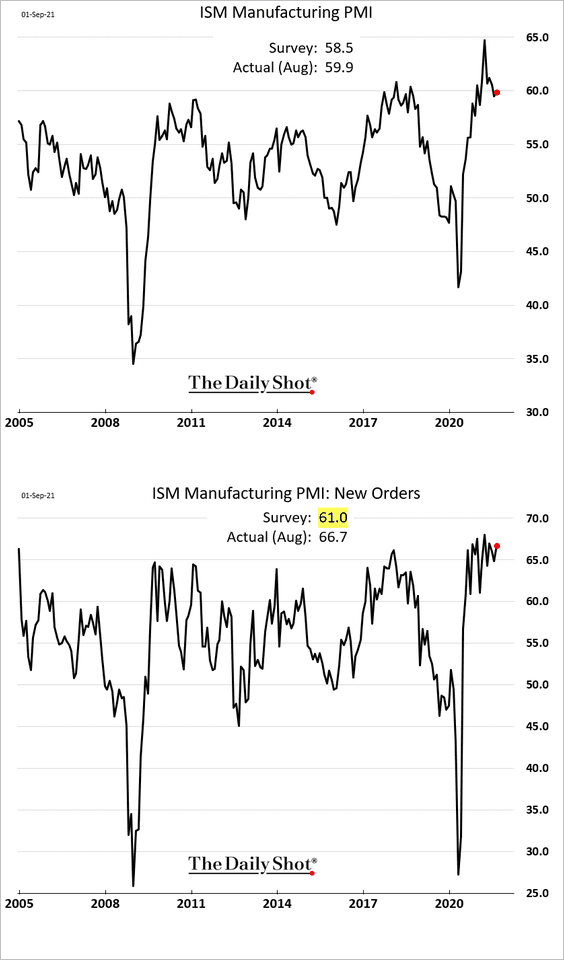
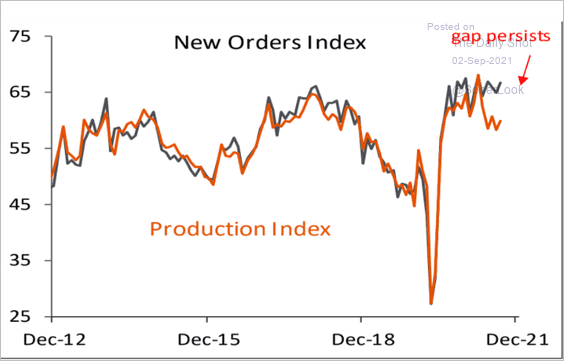
1. The ISM Manufacturing PMI report showed robust US factory activity in August despite shortages of supplies and labor. New orders have been holding up well.
Here are the contributions to the index.
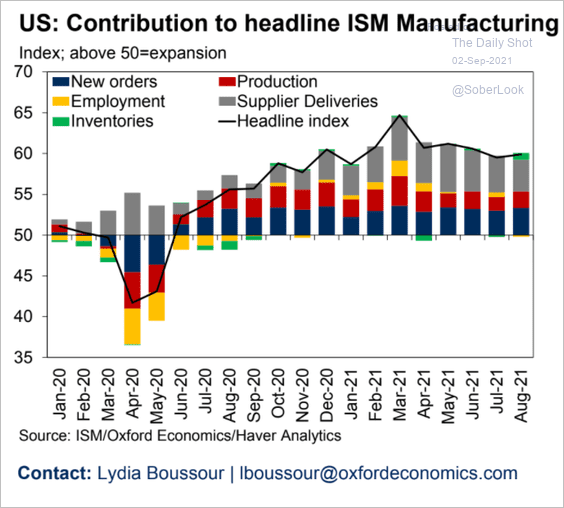 Source: Oxford Economics
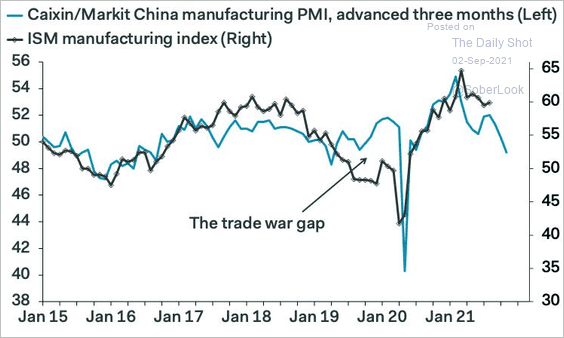
However, given the recent weakness in China, we could see growth softening in the months ahead (2 charts).
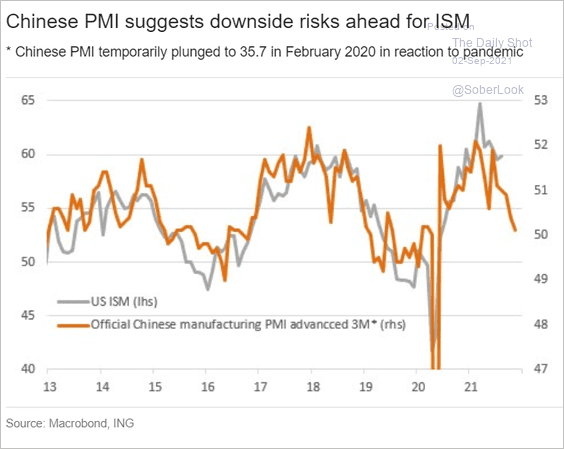 Source: ING
 Source: Pantheon Macroeconomics
• The divergence between new orders and production indicates supply-chain challenges.
 Source: Piper Sandler
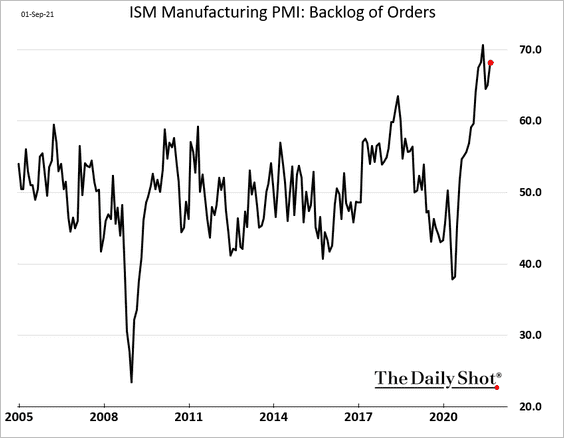
• Order backlogs remain elevated.
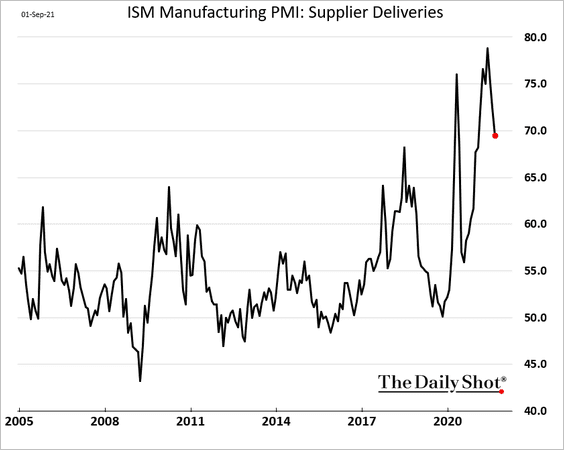
– Supplier deliveries are still massively delayed, but the index has peaked.
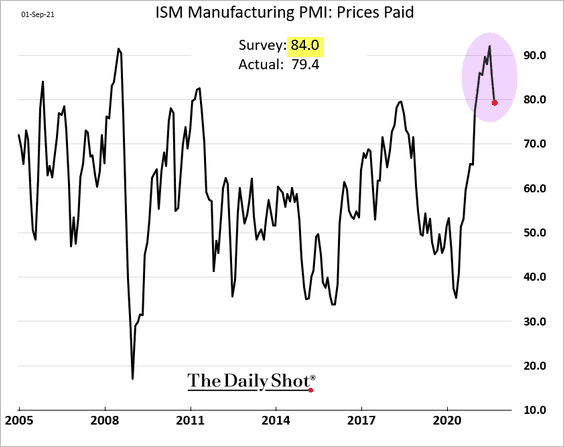
– And the “prices paid” indicator surprised to the downside.
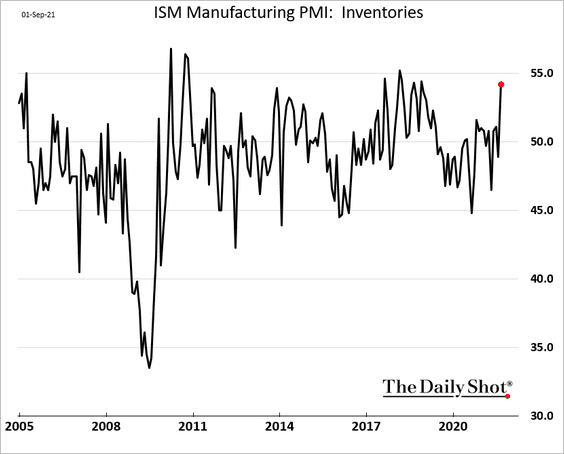
• Businesses are rebuilding inventories.
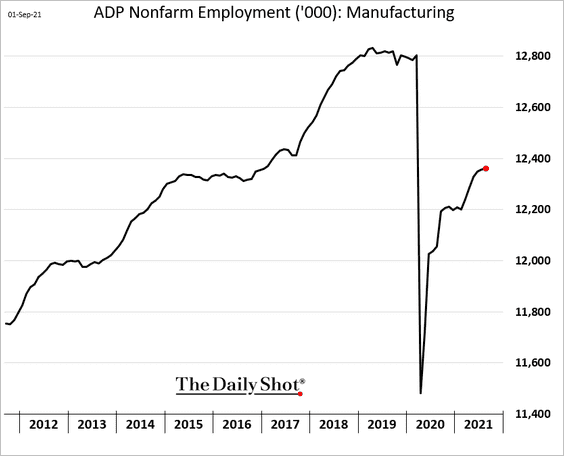
• Hiring at US factories has stalled (PMI < 50 means contraction).
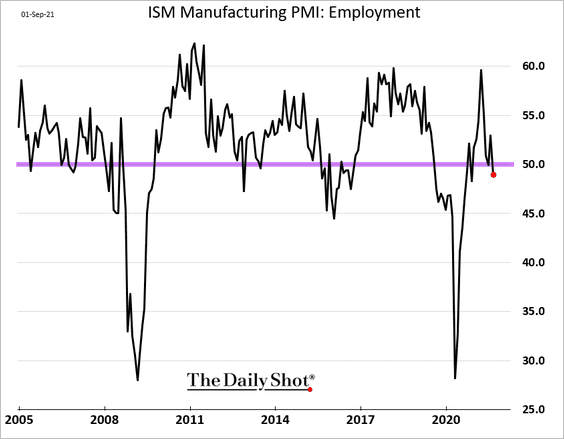
By the way, the ADP payrolls index also shows a much slower pace of hiring in manufacturing.
——————–
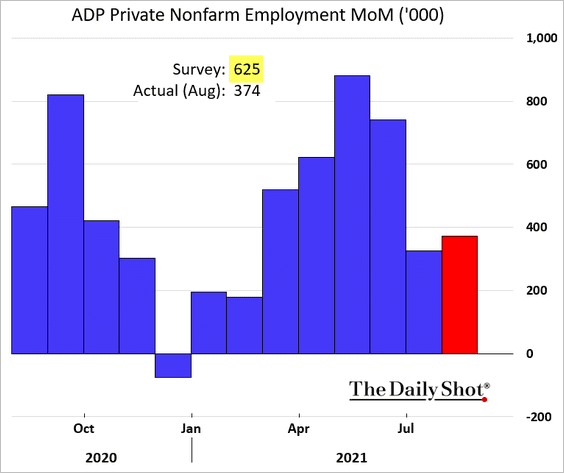
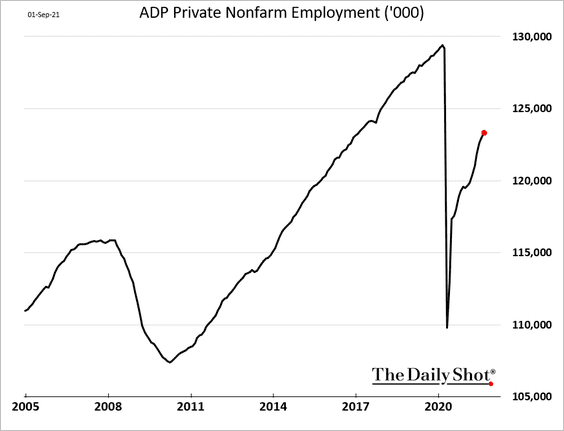
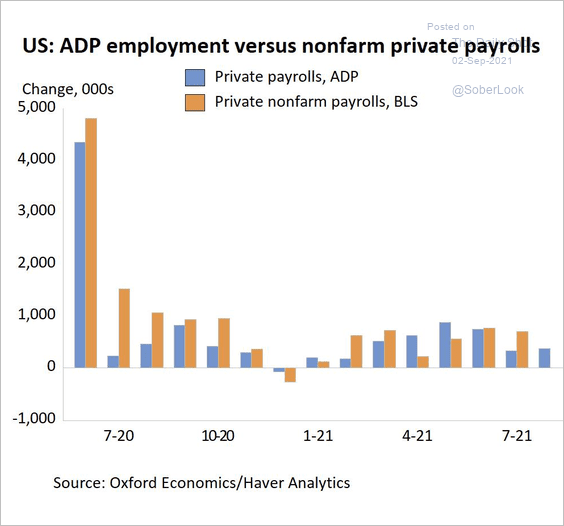
2. The ADP private employment report was well below forecasts.
• Job gains in Leisure and Hospitality increased from July.

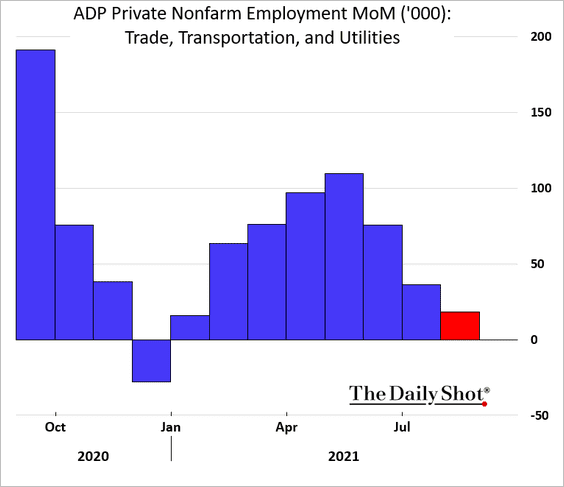
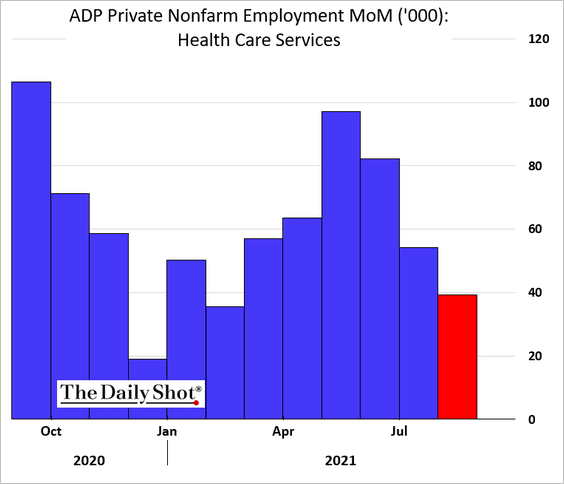
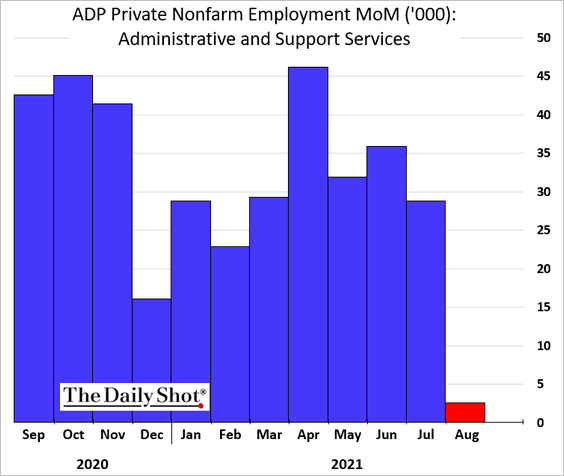
But several other sectors saw weaker growth in payrolls.
– Trade, Transportation, and Utilities:
– Healthcare:
– Administrative Services:
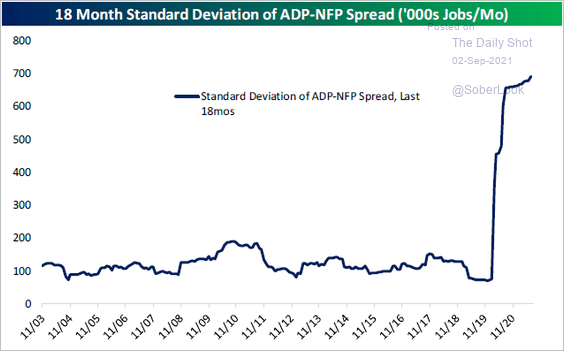
• ADP hasn’t been a good predictor of the official payrolls figures (2 charts).
 Source: @GregDaco, @ADP
 Source: @bespokeinvest Read full article
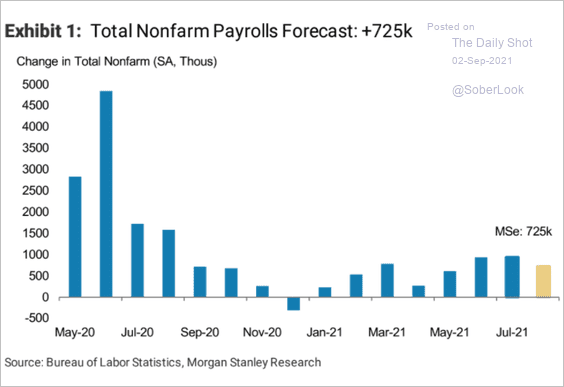
• Morgan Stanley estimates a gain of 725k jobs last month.
 Source: Morgan Stanley Research
——————–
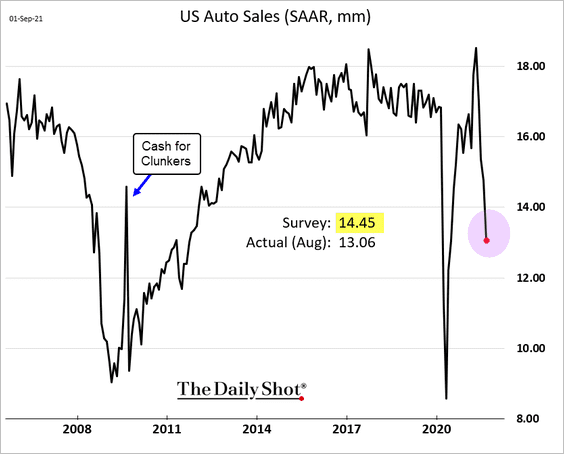
3. US auto sales tumbled further in August. Outside of the pandemic, sales haven’t been this weak in a decade.
4. The divergence between residential and non-residential construction spending persists.
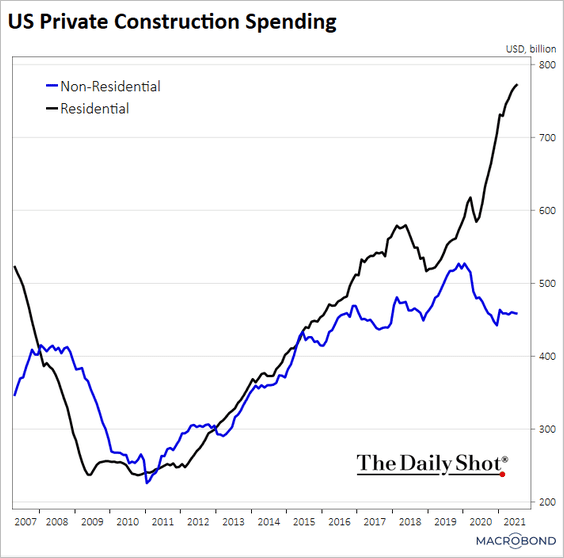 Source: Chart and data provided by Macrobond
5. Mortgage applications are holding up well.
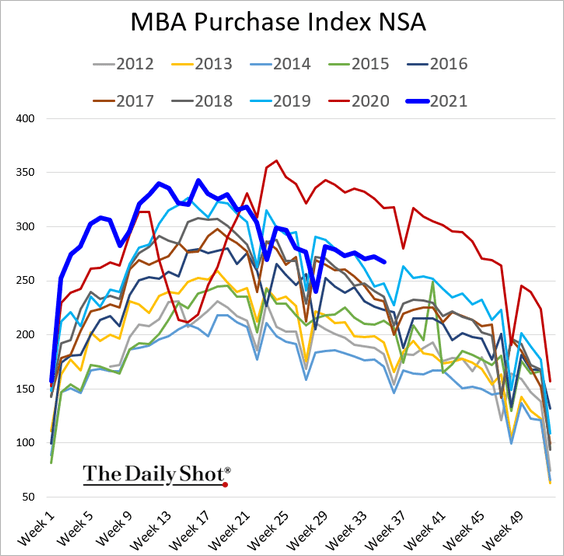
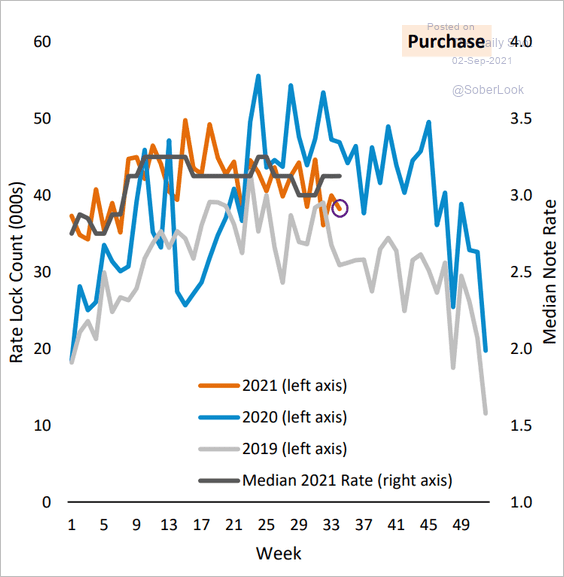 Source: AEI Center on Housing Markets and Finance
——————–
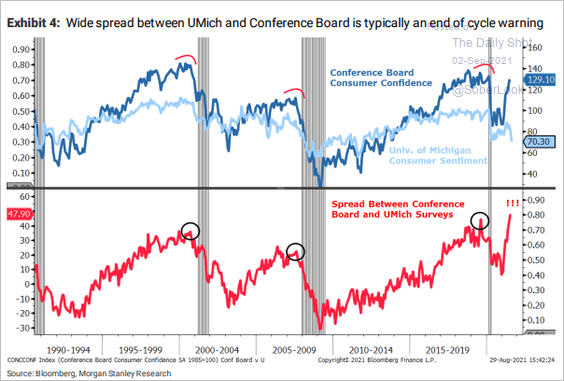
6. The HPS-CS economic sentiment index confirmed the weakness in consumer confidence.
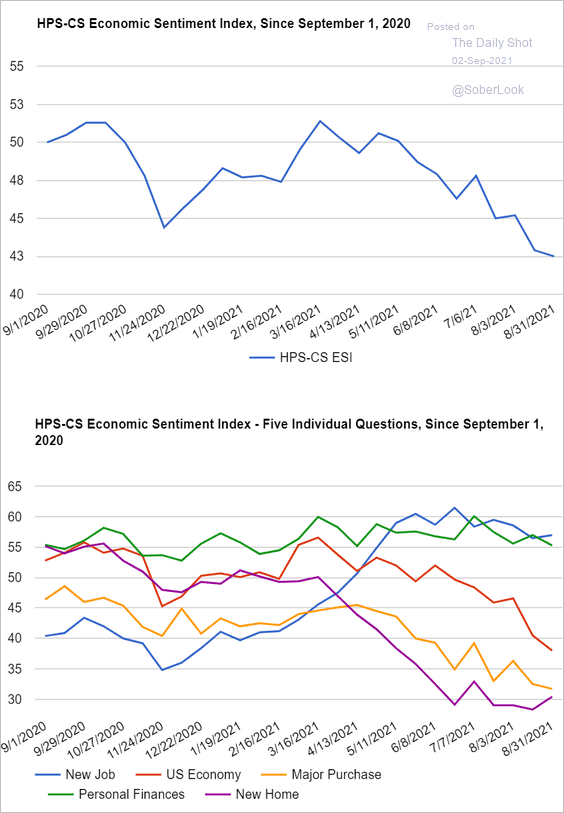 Source: Hamilton Place Strategies & CivicScience, Inc. Read full article
By the way, a large divergence between the U. Michigan’s and Conference Board’s sentiment indicators typically signals a cycle end (recession).
 Source: Morgan Stanley Research
——————–
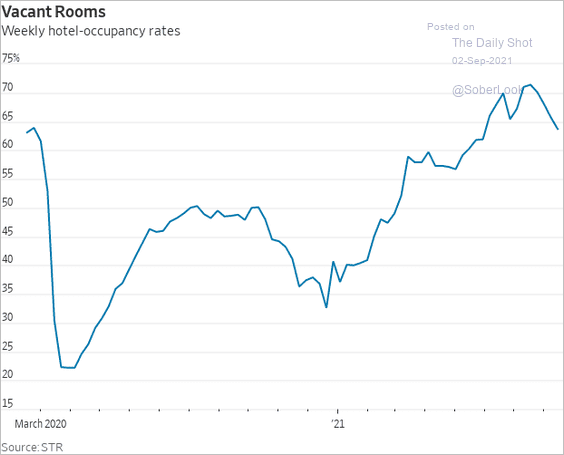
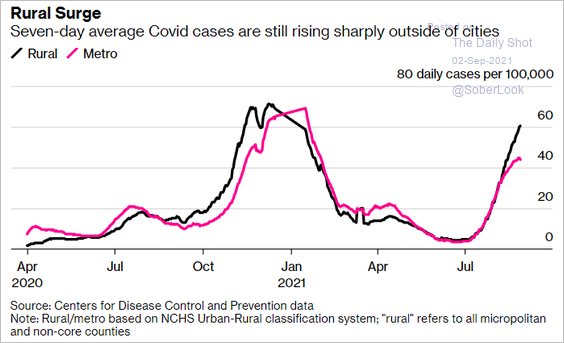
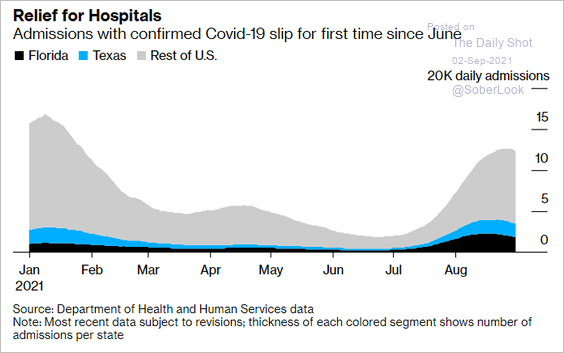
7. Next, we have some high-frequency indicators.
• Hotel-occupancy rates:
 Source: @WSJ Read full article
• COVID cases in rural and urban areas:
 Source: Bloomberg Read full article
• Hospital admissions:
 Source: Bloomberg Read full article
Back to Index
Canada
1. Canada’s manufacturing growth held up well last month.
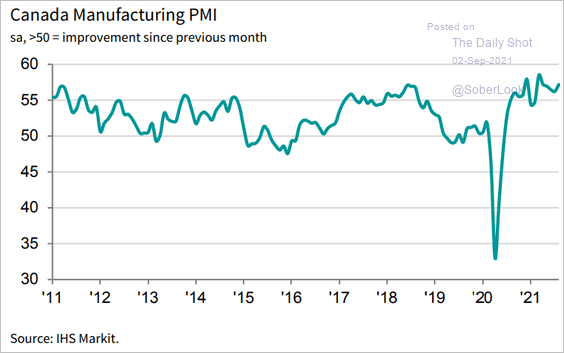 Source: IHS Markit
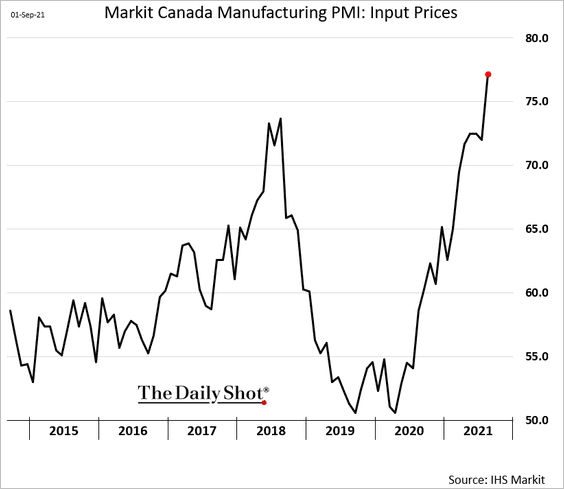
But input prices are surging.
——————–
2. Downside GDP surprises no longer seem to be impacting the Canadian dollar.
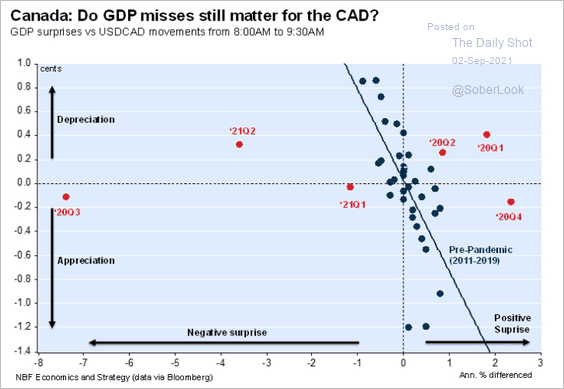 Source: Economics and Strategy Group, National Bank of Canada
Back to Index
The United Kingdom
1. The updated manufacturing PMI report continues to show supply challenges and price pressures.
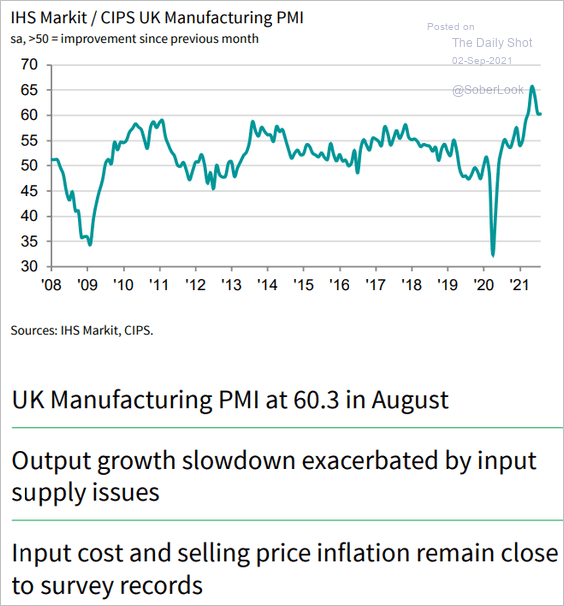 Source: IHS Markit
2. Soft consumer credit expansion will dampen the GDP growth.
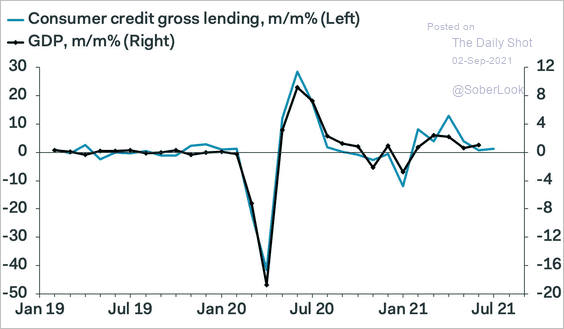 Source: Pantheon Macroeconomics
3. Spending, as measured by credit and debit card payments in the UK, has been flat since May.
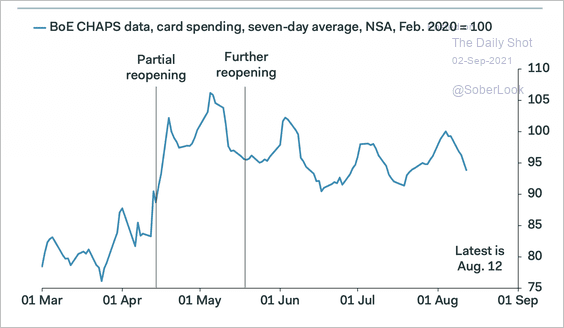 Source: Pantheon Macroeconomics
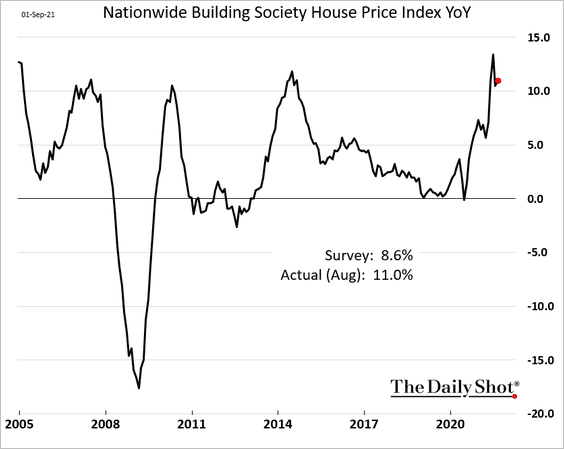
4. Nationwide’s home price appreciation index topped forecasts.
Back to Index
The Eurozone
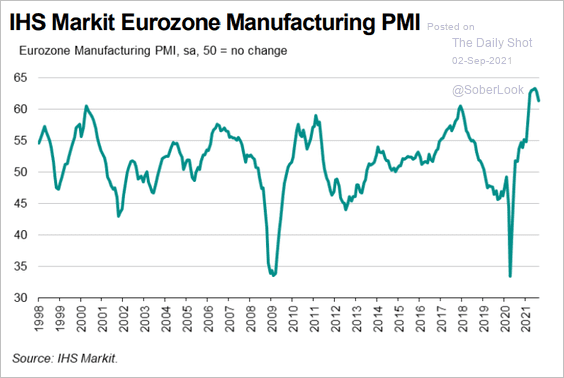
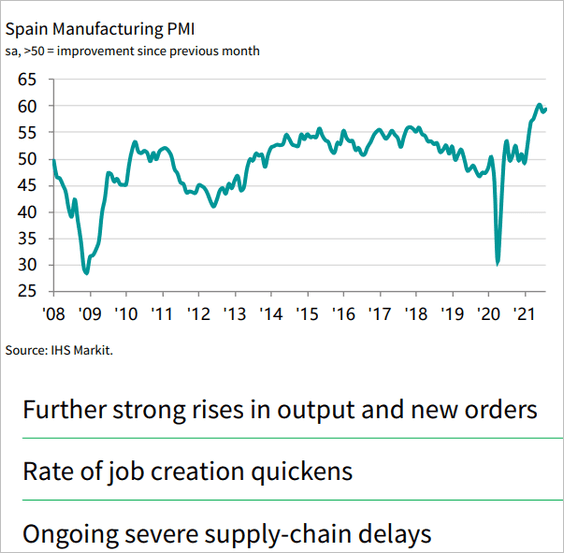
1. Manufacturers had another exceptionally strong month, but growth has peaked.
• Updated euro-area PMI:
 Source: IHS Markit
• Italy:
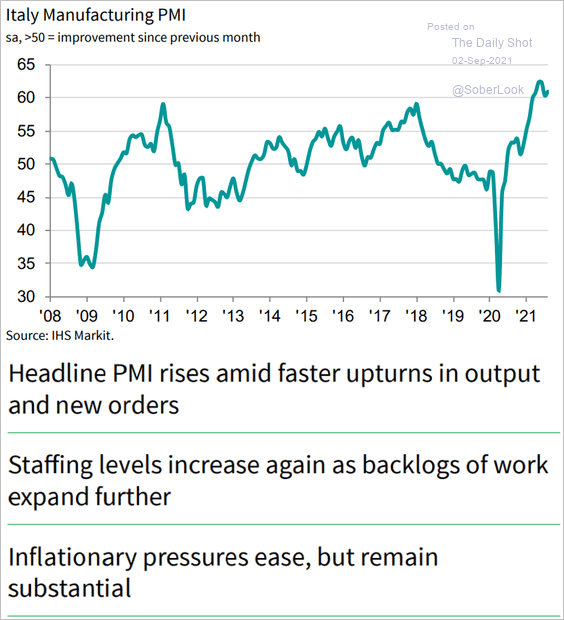 Source: IHS Markit
• Spain:
• Greece:
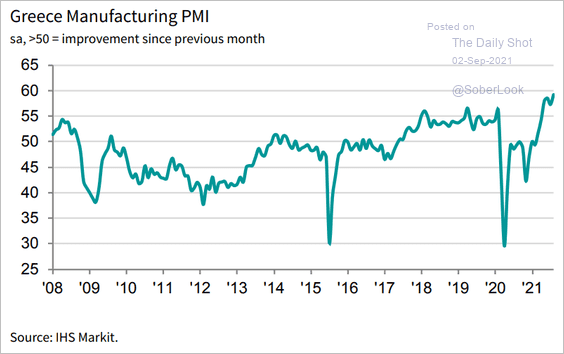 Source: IHS Markit
——————–
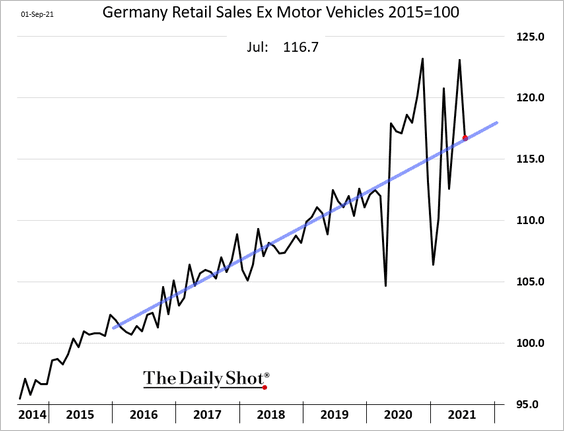
2. German retail sales are back to their multi-year trend.
• French household consumption surprised to the downside.

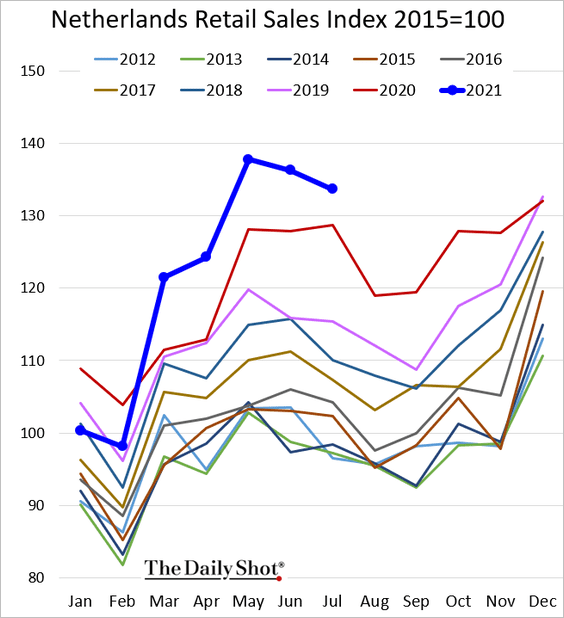
• Dutch retail sales remain strong.
——————–
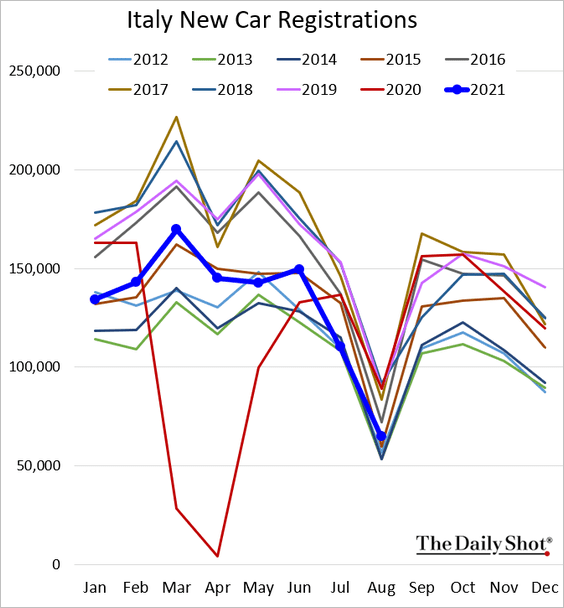
3. Italian car sales have been soft.
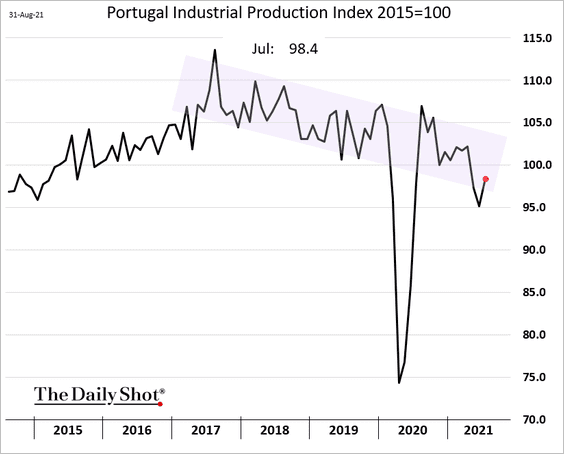
4. Portugal’s industrial production remains on a downward trajectory.
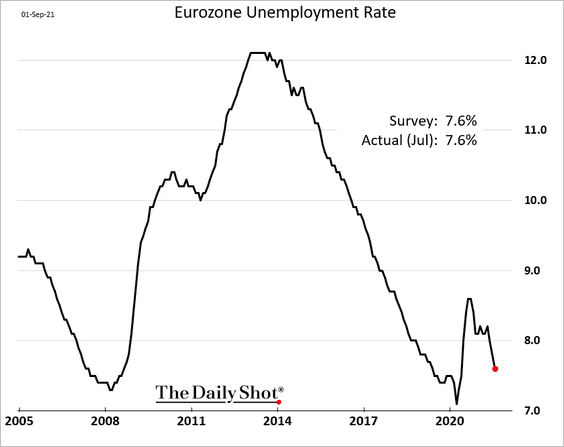
5. Euro-area unemployment has been declining at a healthy pace.
6. If the ECB allows real rates to increase a bit, then EUR/USD can avoid a big sell-off, according to Nordea.
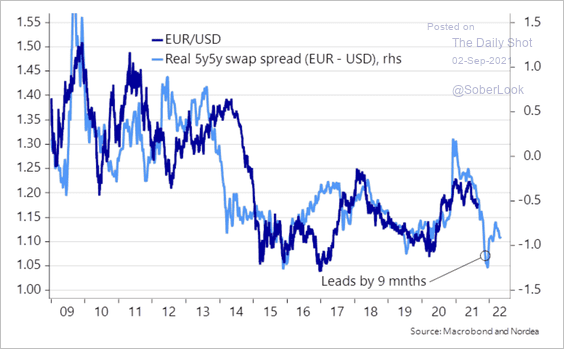 Source: Nordea Markets
7. This chart shows the ECB’s purchases of sovereign debt as a percentage of total issuance.
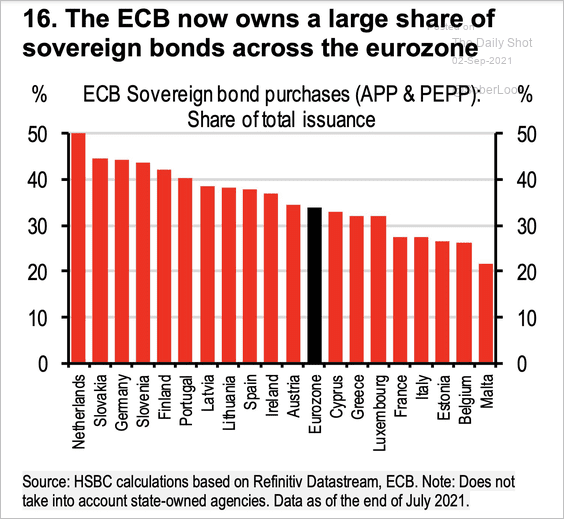 Source: HSBC
Back to Index
Europe
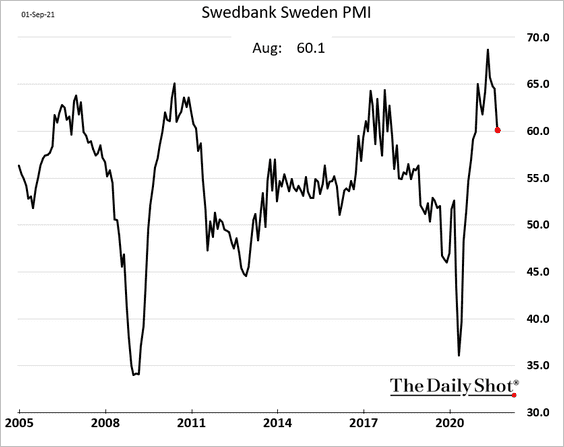
1. Sweden’s manufacturing growth slowed last month but remains robust.
2. Manufacturing growth in Poland and the Czech Republic also peaked.
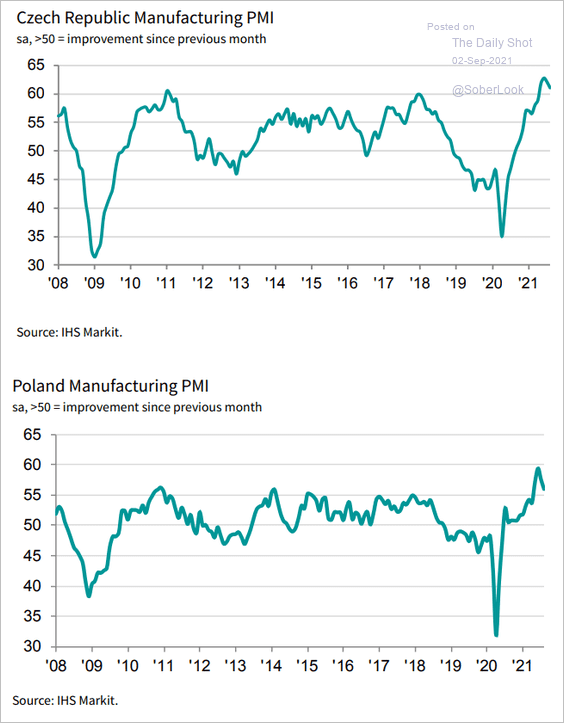 Source: IHS Markit
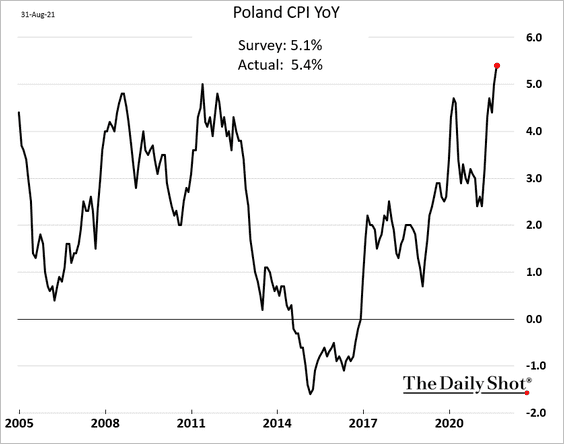
3. Poland’s inflation is surging.
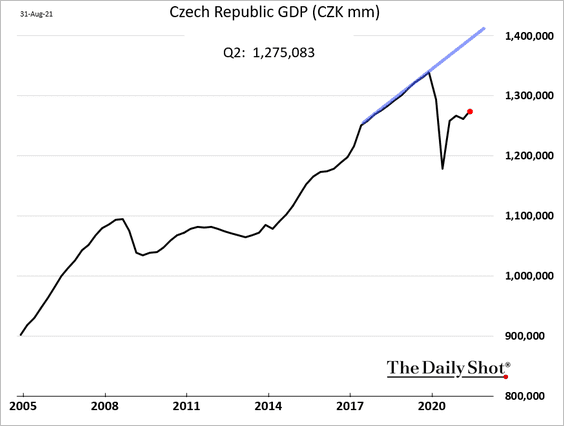
4. Czech GDP recovery will take a while.
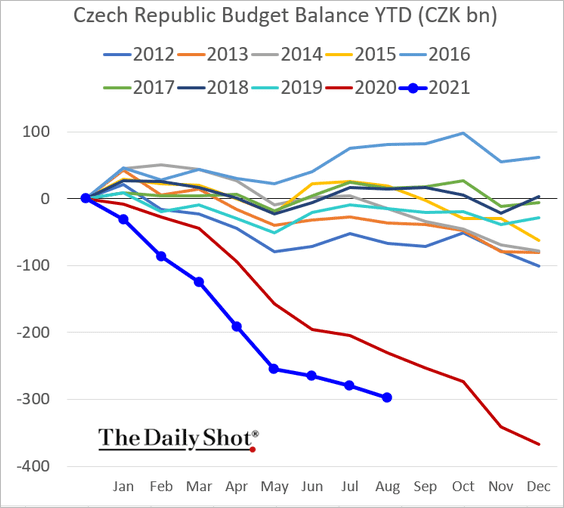
Here is the Czech Republic’s budget balance.
Back to Index
Asia – Pacific
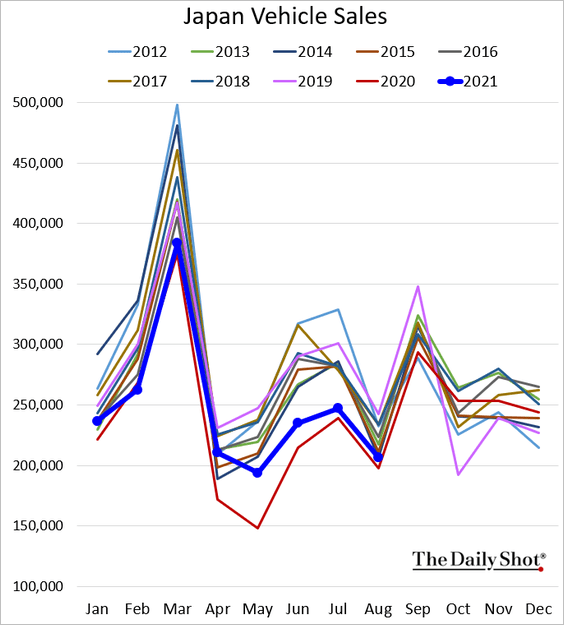
1. Car sales in Japan are not much higher than they were this time last year.
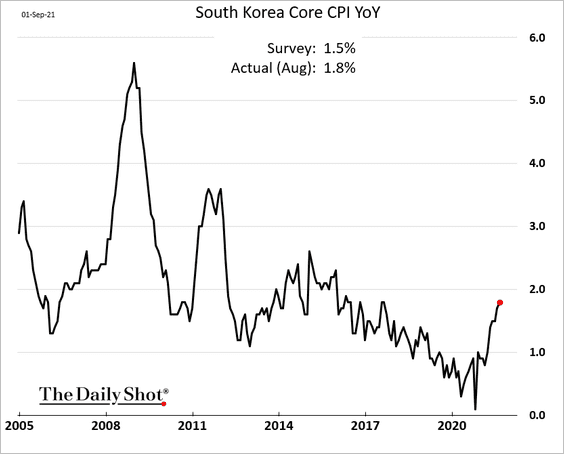
2. South Korea’s CPI topped market forecasts.
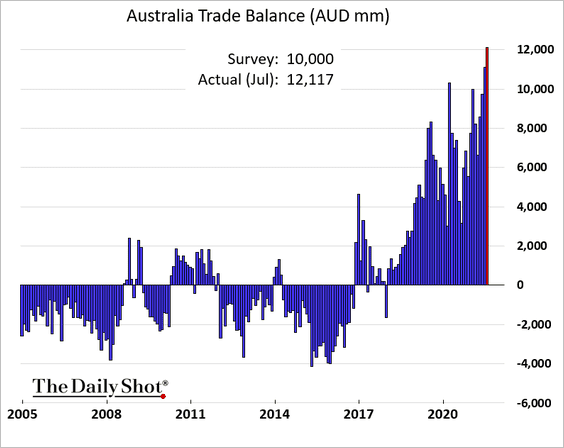
3. Australia’s trade surplus hit a record high.
Back to Index
China
1. A stronger renminbi will be a drag on manufacturing activity.
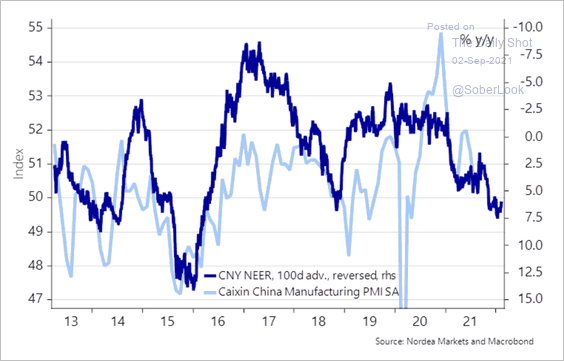 Source: Nordea Markets
2. Chinese small-cap stocks have outperformed this year.
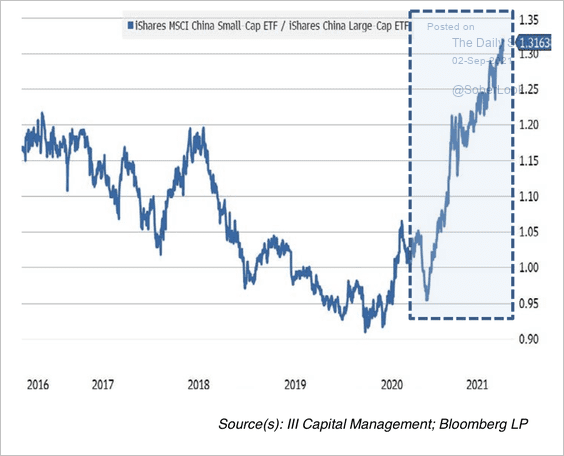 Source: III Capital Management
3. China’s Single’s Day is now bigger than all the major US shopping holidays combined.
 Source: J.P. Morgan Asset Management
4. Based on current enrolment, China will be graduating twice as many STEM (Science, Technology, Engineering, Mathematics) PhDs as the US.
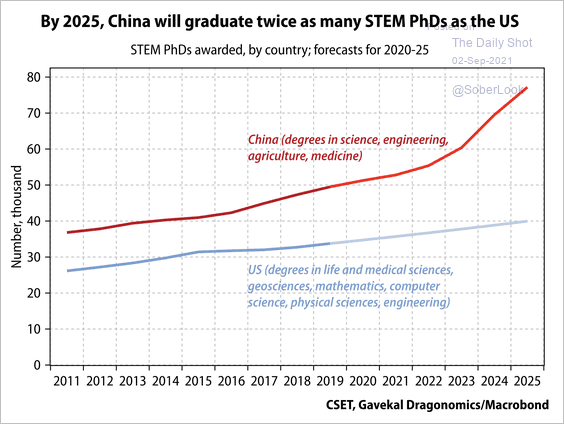 Source: Gavekal Research
Back to Index
Emerging Markets
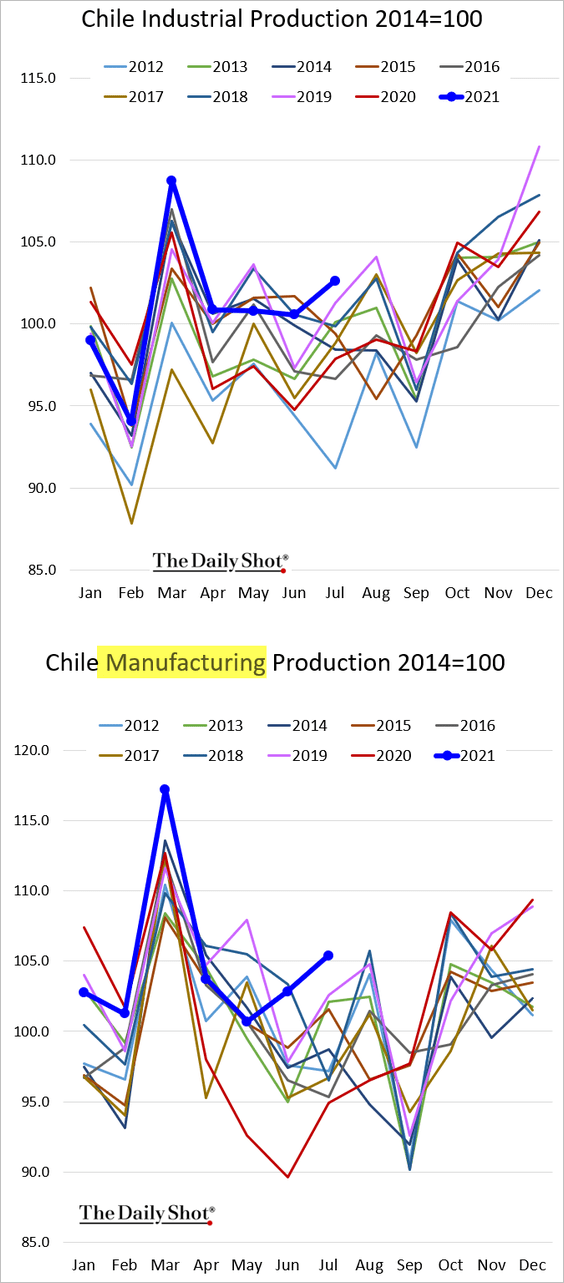
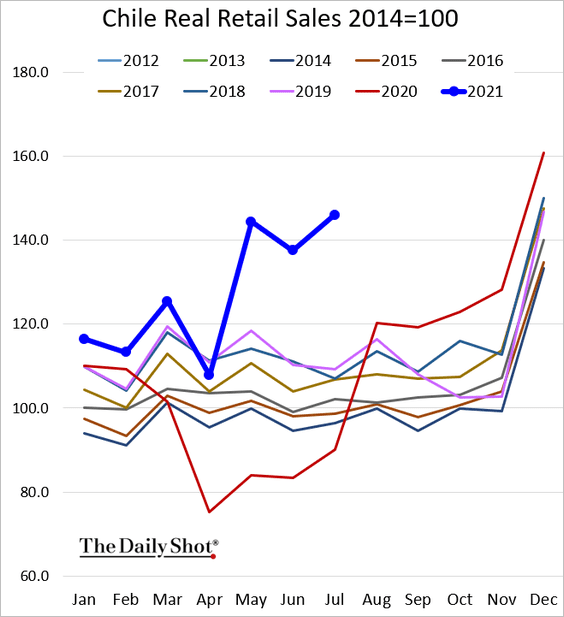
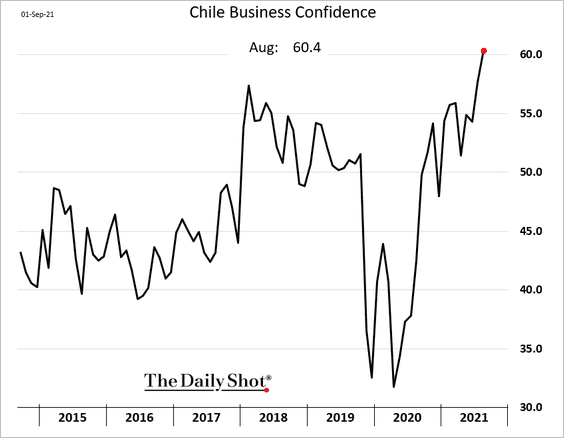
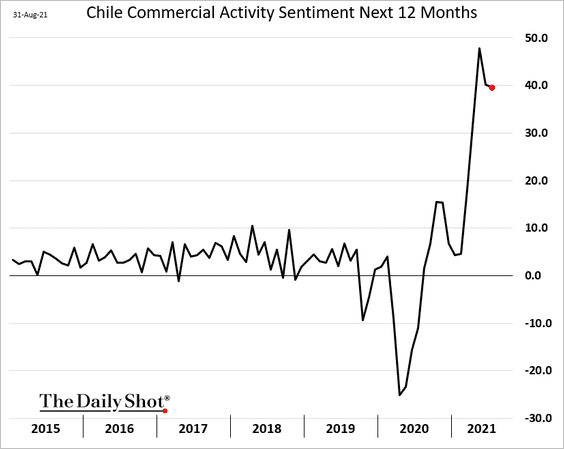
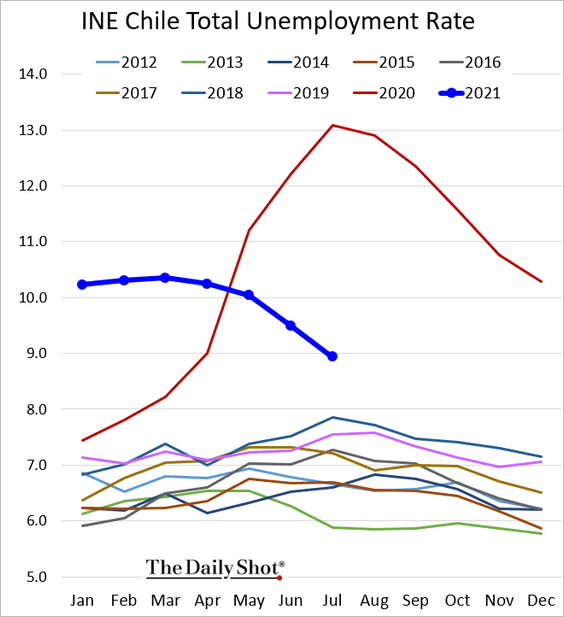
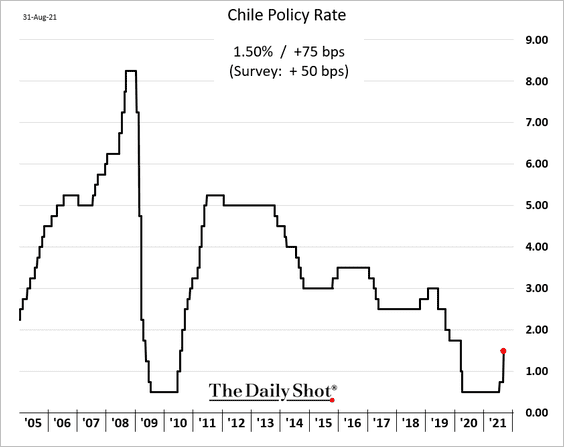
1. Let’s begin with Chile, where economic growth is surging.
• Industrial production (new highs for this time of the year):
• Retail sales:
• Business confidence:
• Unemployment:
• Economic growth:
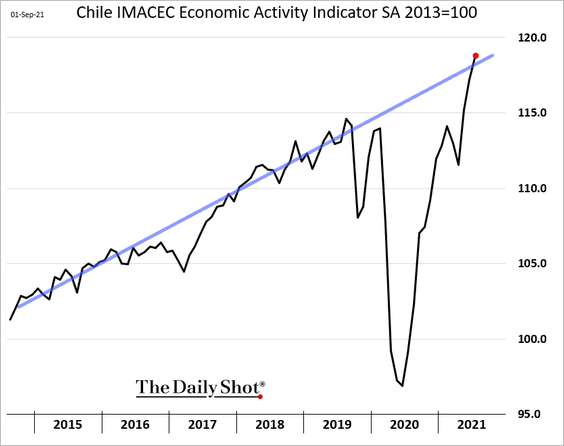
As a result, the central bank hiked rates by 75 bps (more than expected).
——————–
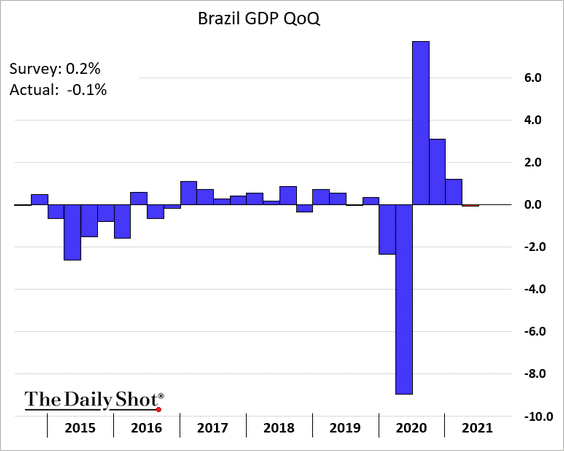
2. Brazil’s GDP unexpectedly declined last quarter.
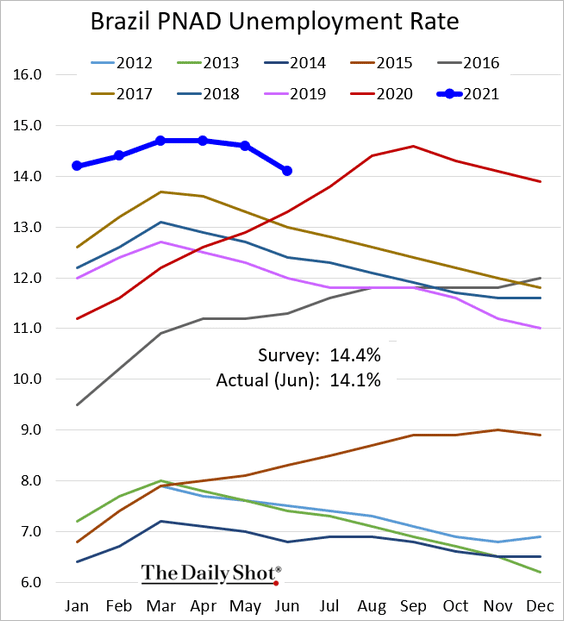
• Unemployment is still elevated.
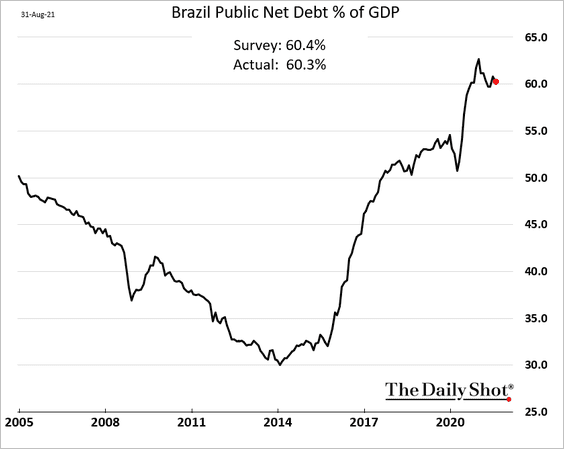
• The fiscal situation remains a concern.
——————–
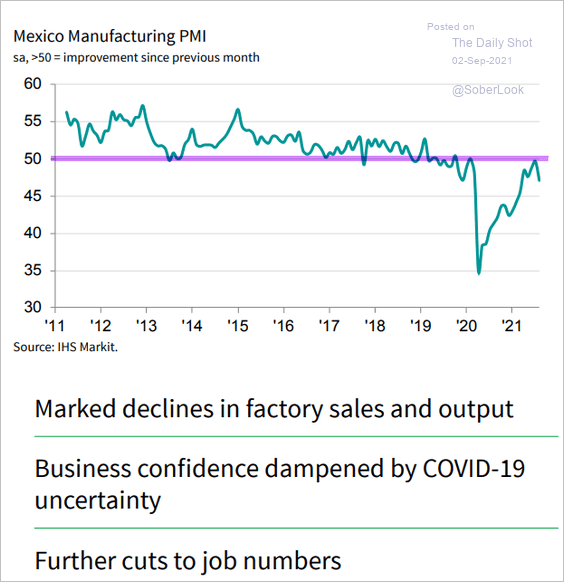
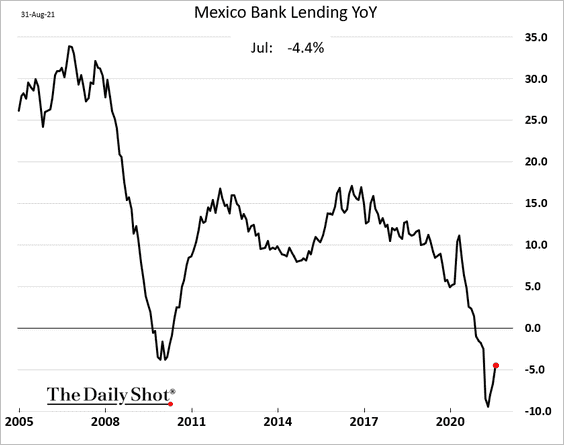
3. Next, we have some updates on Mexico.
• Factory activity deteriorated again.
 Source: IHS Markit
• Credit growth has bottomed.
• Remittances hit a record high, …
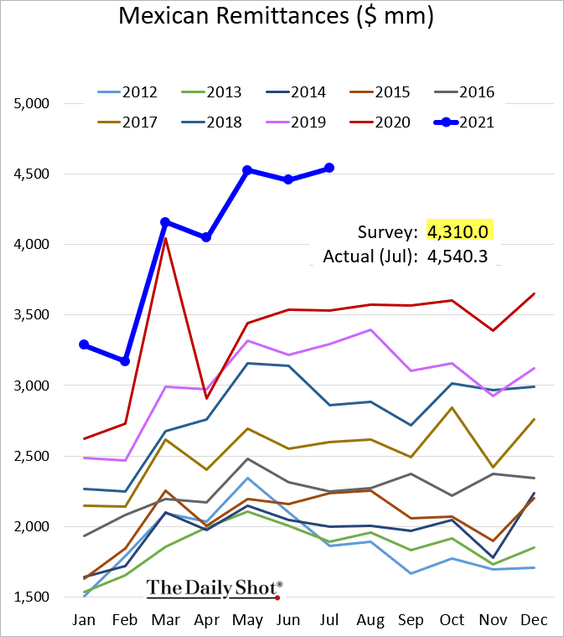
… putting upward pressure on the peso.
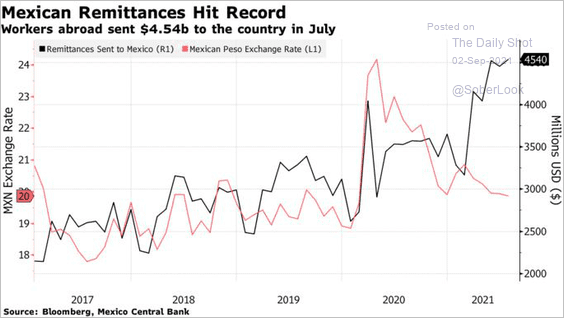 Source: @markets Read full article
——————–
4. Latin American stocks have declined along with the pullback in industrial metal prices.
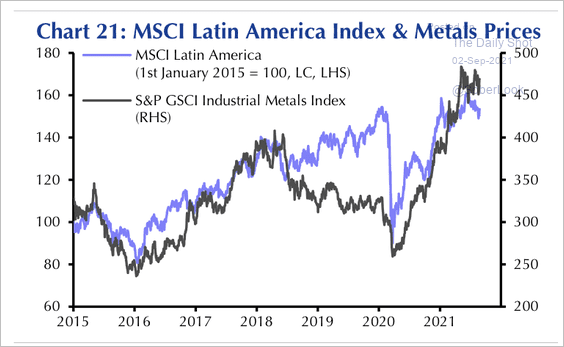 Source: Capital Economics
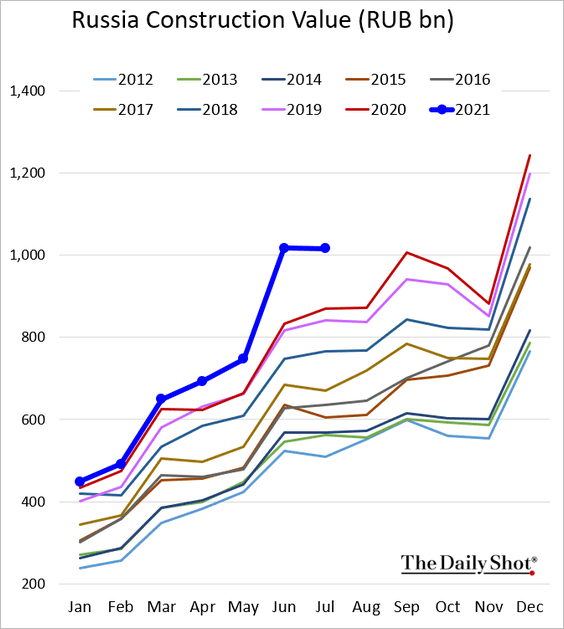
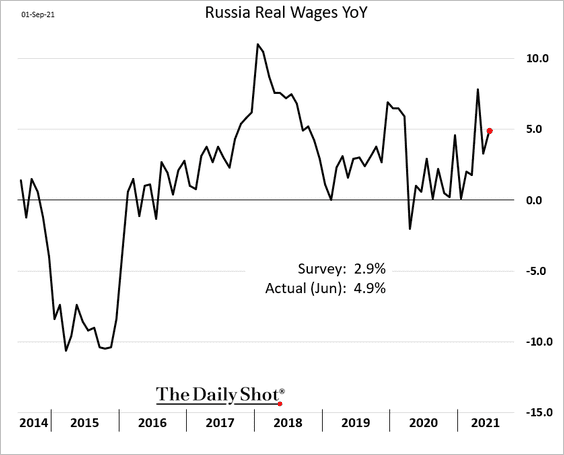
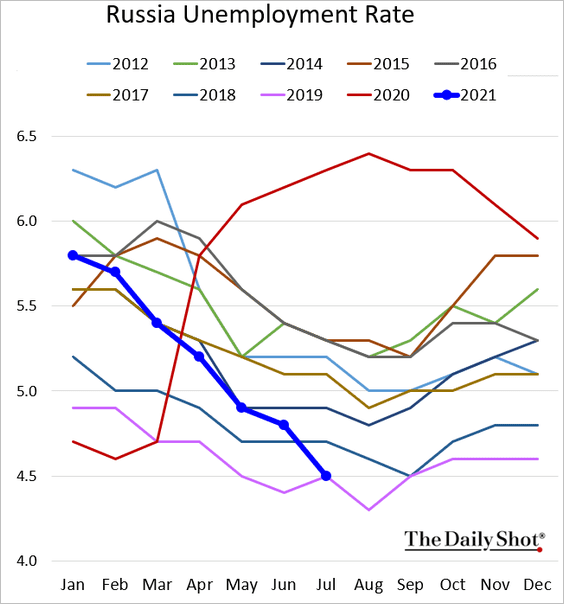
5. Here are some updates on Russia.
• Manufacturing activity (shrinking):
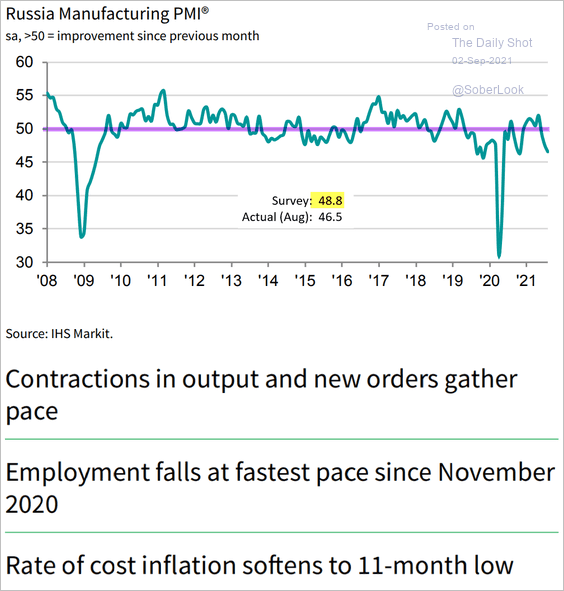 Source: IHS Markit
• Construction:
• Wage growth:
• Unemployment:
——————–
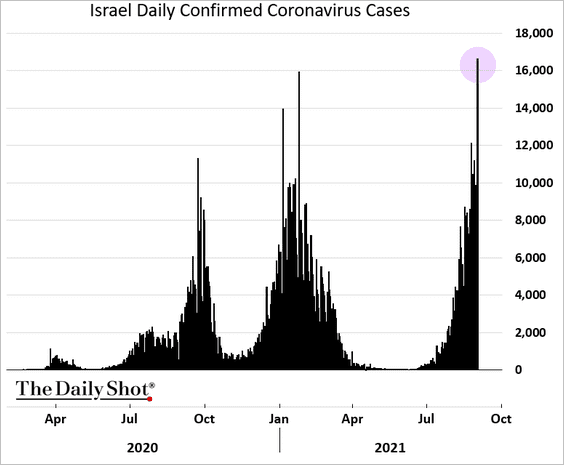
6. Israel’s COVID cases hit a record despite a high vaccination rate.
7. India’s second-quarter GDP slumped as the pandemic took its toll.
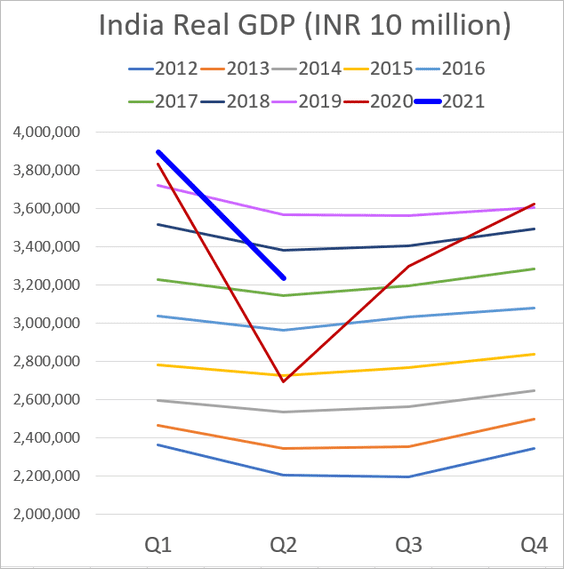
Factory activity held up last month.
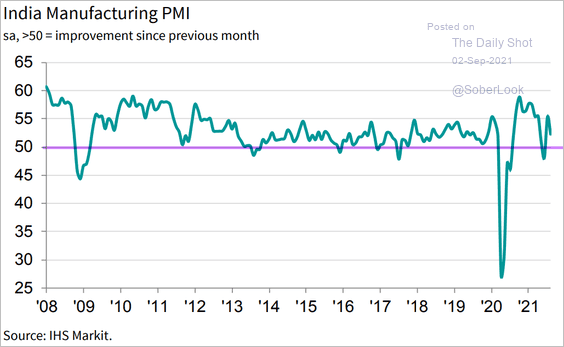 Source: IHS Markit
——————–
8. The largest EM equity ETF broke above the 50-day moving average.
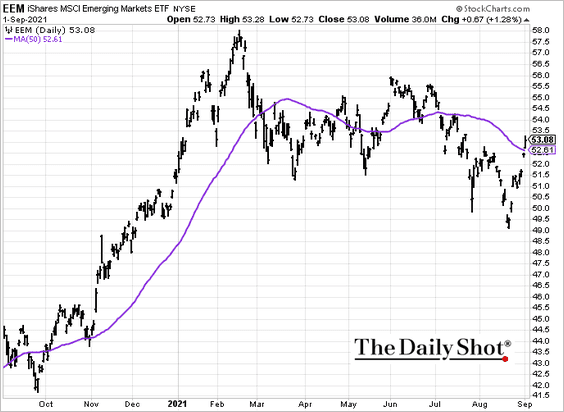 h/t @farahesque Read full article
Back to Index
Cryptocurrency
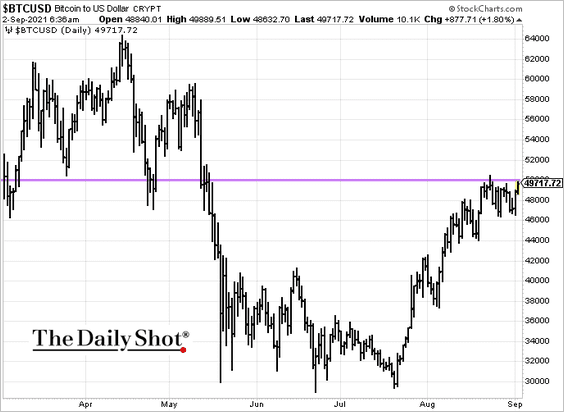
1. Bitcoin is probing resistance at $50k.
2. Ether’s market share of the total crypto market capitalization has been rising since 2019.
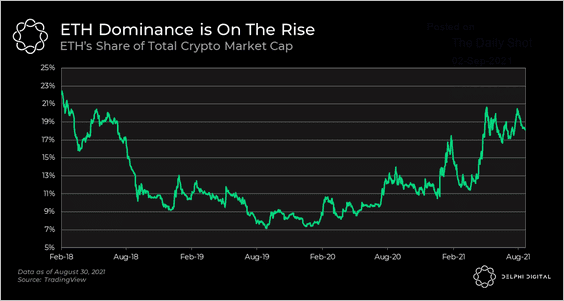 Source: Delphi Digital Read full article
3. Based on the latest beta, a complete BTC crash to $0 would correspond with a -1.3% return on global stocks, or about a $1.23 trillion reduction in worldwide equity wealth, according to Cornerstone Macro.
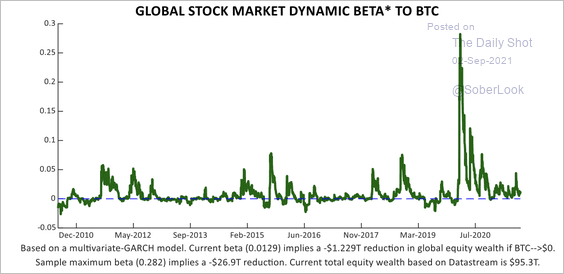 Source: Cornerstone Macro
Spillovers from BTC to global stocks tend to be positive rather than negative.
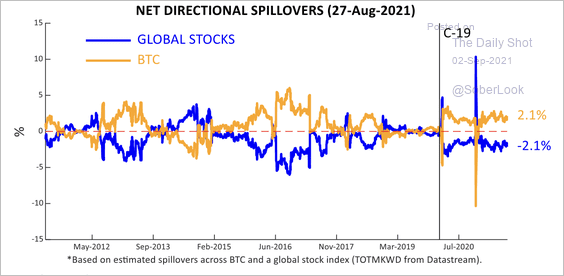 Source: Cornerstone Macro
——————–
4. Open interest in CME bitcoin futures saw steady growth last month.
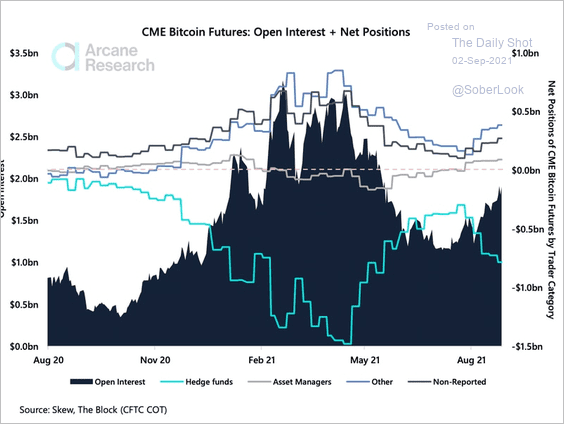 Source: Arcane Research
5. The chart below shows the recent performance of DeFi tokens relative to BTC and ETH.
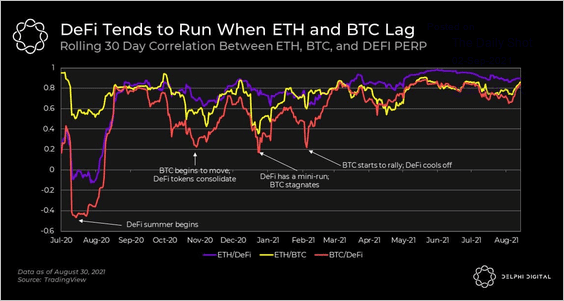 Source: Delphi Digital Read full article
Back to Index
Energy
1. OPEC is staying the course.
 Source: @WSJ Read full article
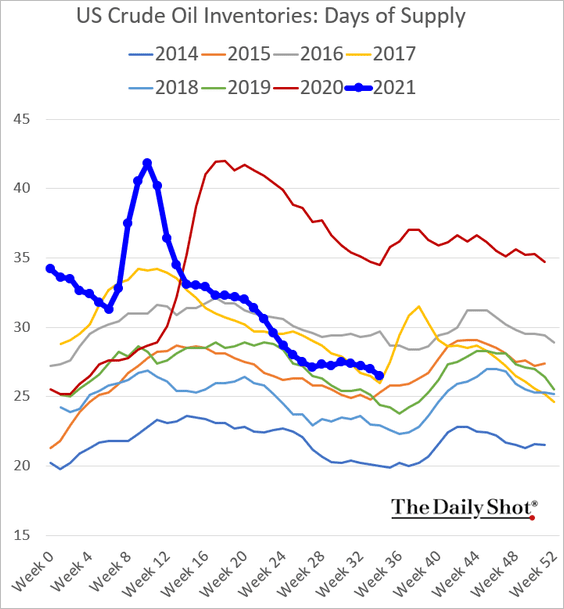
2. US crude oil inventory is holding at 2017 levels, with the latest decline exceeding expectations.
3. US implied oil demand is climbing, …
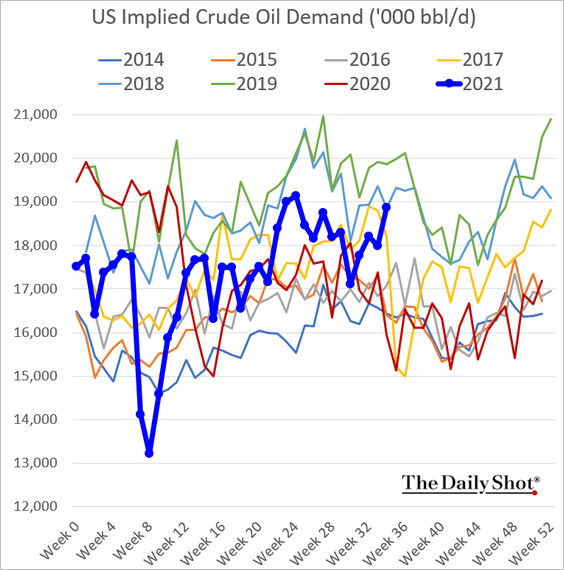
… as the amount of product supplied surges.
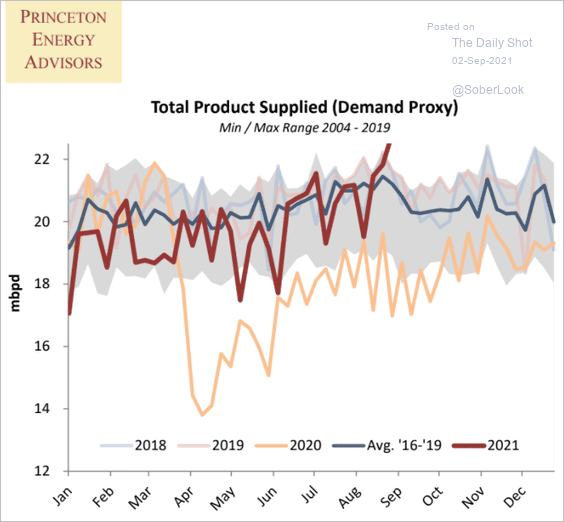 Source: Princeton Energy Advisors
Jet fuel demand has been strengthening.
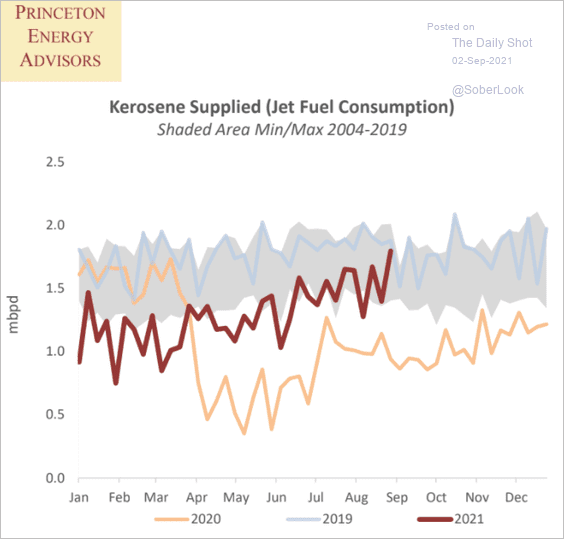 Source: Princeton Energy Advisors
——————–
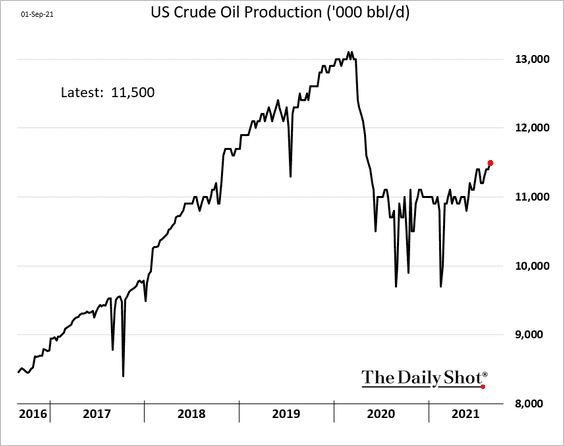
4. US oil output keeps climbing, but we should see a dip from Ida next week.
5. Mexico’s PEMEX crude oil production is starting to rise.
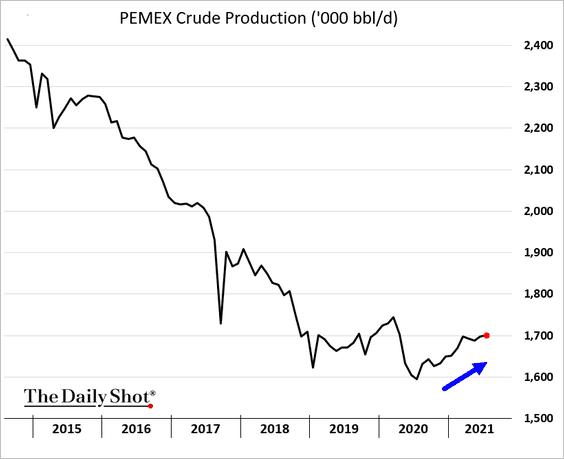
Mexico’s finance ministry has a preliminary forecast of $60 per barrel for its crude oil exports.
 Source: Reuters Read full article
——————–
6. Clean energy stocks have given up their lead versus traditional energy this year.
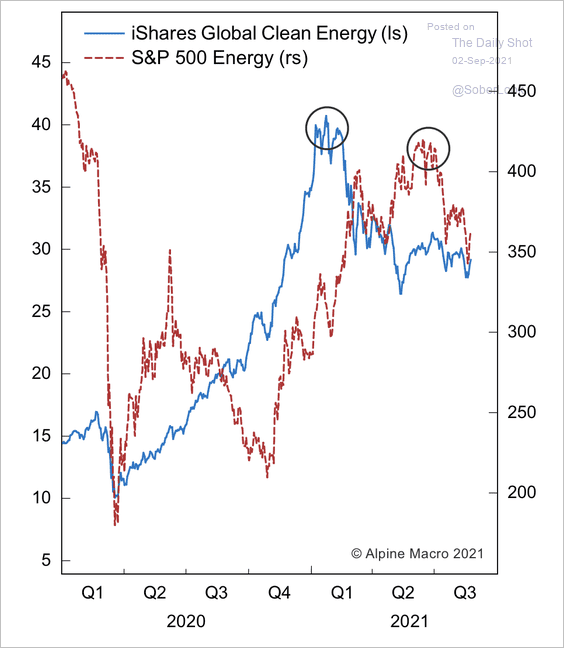 Source: Alpine Macro
Back to Index
Equities
1. Let’s start with last month’s S&P 500 performance by sector.
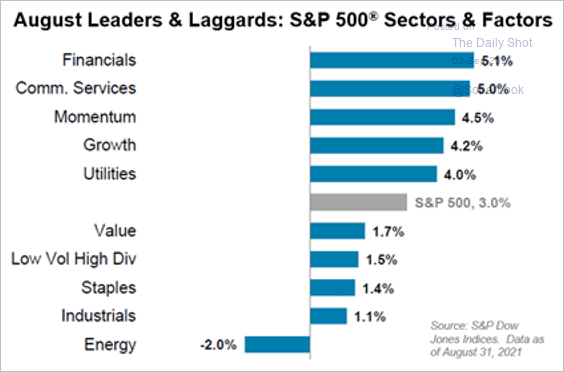 Source: S&P Global Market Intelligence
This chart shows large-cap performance around the world.
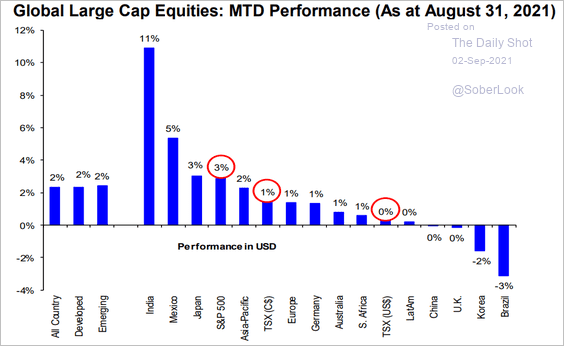 Source: Hugo Ste-Marie, Portfolio & Quantitative Strategy Global Equity Research, Scotia Capital
——————–
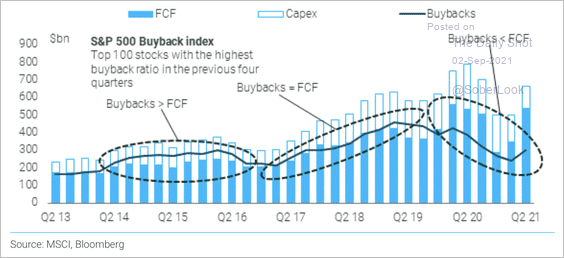
2. Corporate balance sheets have improved after the pandemic shock, boosting share buyback activity (2 charts).
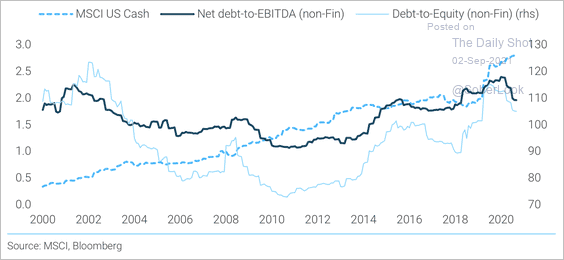 Source: TS Lombard
 Source: TS Lombard
——————–
3. Buybacks have been concentrated in large caps.
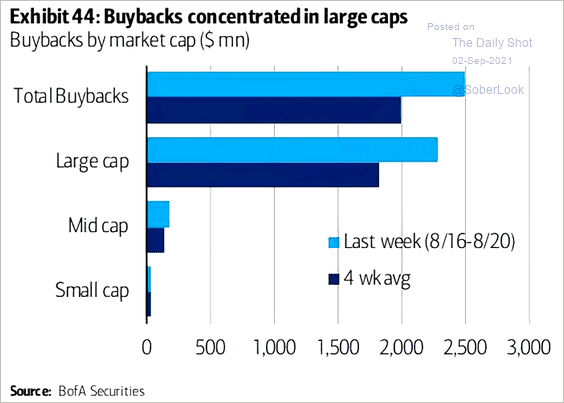 Source: @ISABELNET_SA, @BofAML
Sectors with the highest buyback activity tend to outperform.
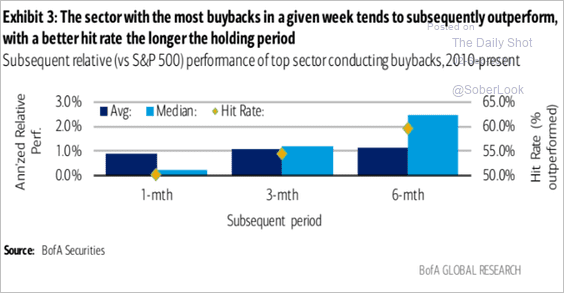 Source: BofA Global Research
——————–
4. Reflation equity trades have recovered over the past two weeks, along with the rise in breakevens (inflation expectations).
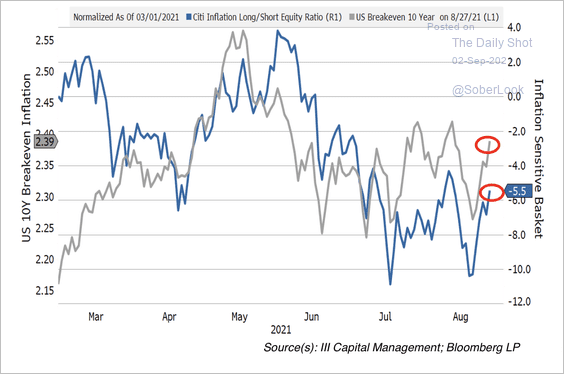 Source: III Capital Management
5. Return on invested capital (ROIC) for communication equipment companies has stabilized at high levels. This is partly due to an industry shift from network hardware to higher-margin software, according to Variant Perception.
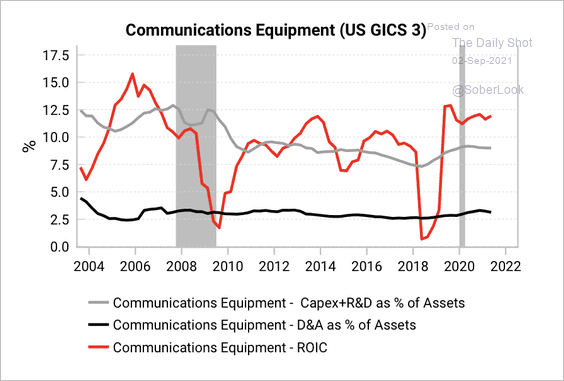 Source: Variant Perception
ROICs for life science tools/service companies have risen, partly as a result of COVID-led demand for testing kits and vaccination solutions.
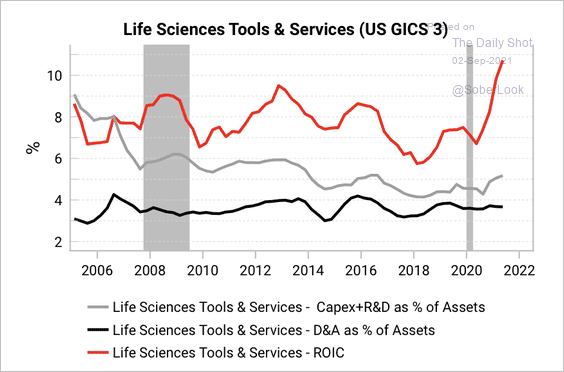 Source: Variant Perception
——————–
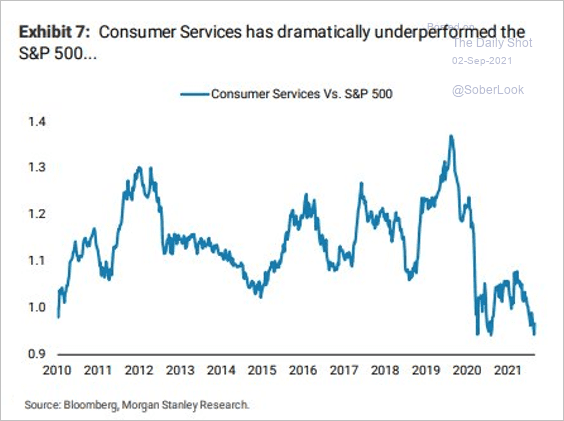
6. Consumer services shares have been underperforming.
 Source: Morgan Stanley Research
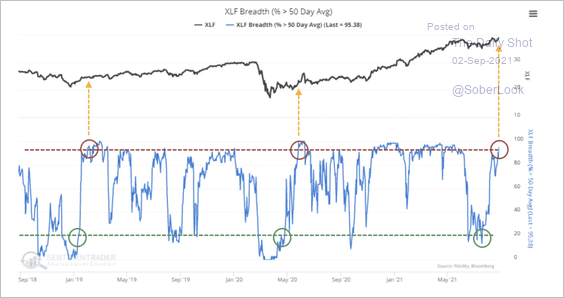
7. Nearly 95% of stocks in the SPDR Financial Sector ETF (XLF) are trading above their 50-day moving average, which typically precedes strong returns for the sector.
 Source: SentimenTrader
8. Next, we have the seasonality of value vs. growth relative performance.
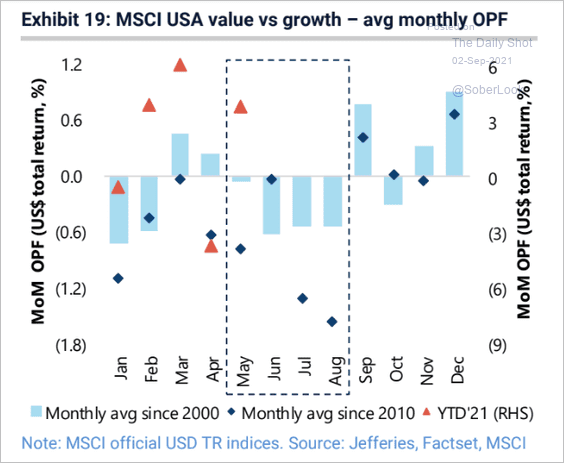 Source: Jefferies
Back to Index
Global Developments
1. Global manufacturing growth has peaked.
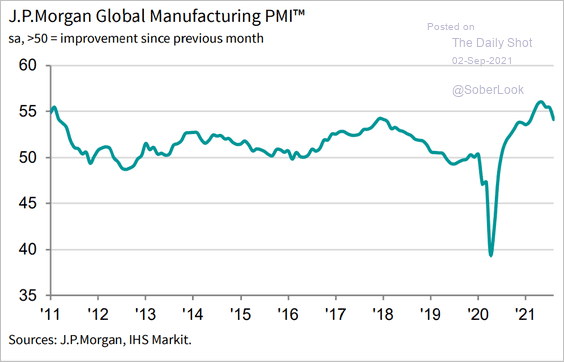 Source: IHS Markit
Here are the August PMIs by country.
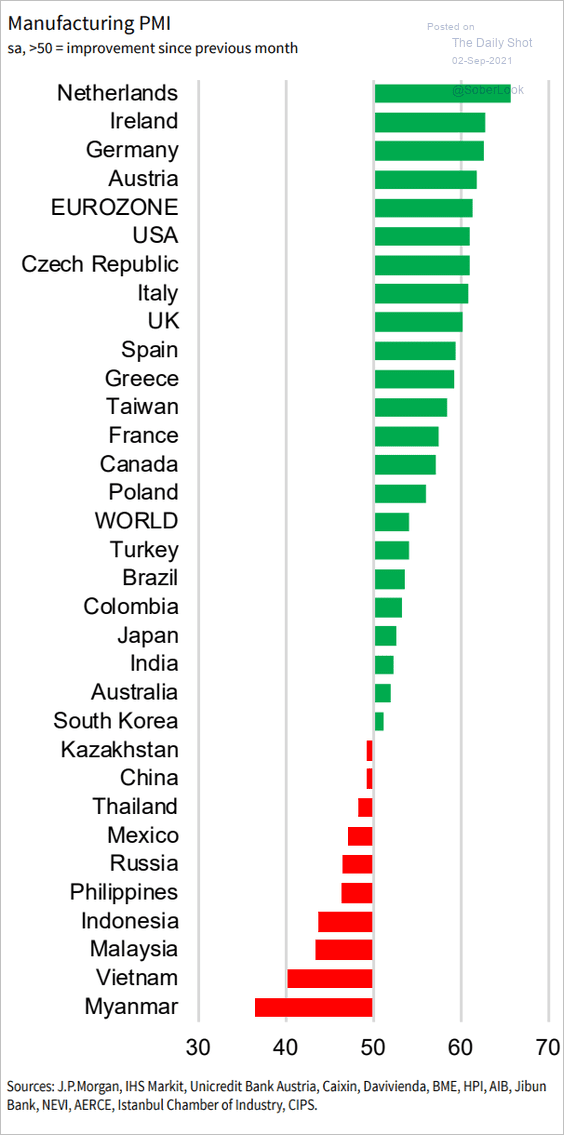 Source: IHS Markit
——————–
2. This chart shows the relationship between manufacturing production PMIs and COVID vaccination rates.
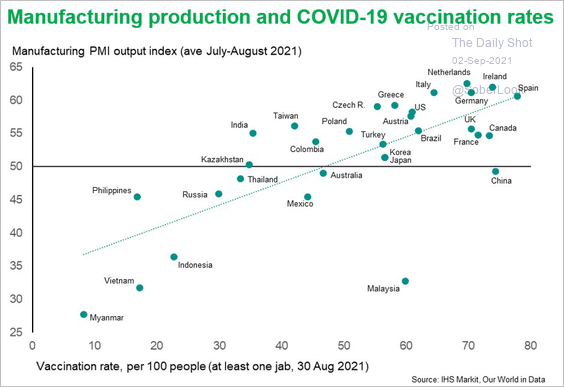 Source: @WilliamsonChris
3. Investor positioning in reflation assets has moderated.
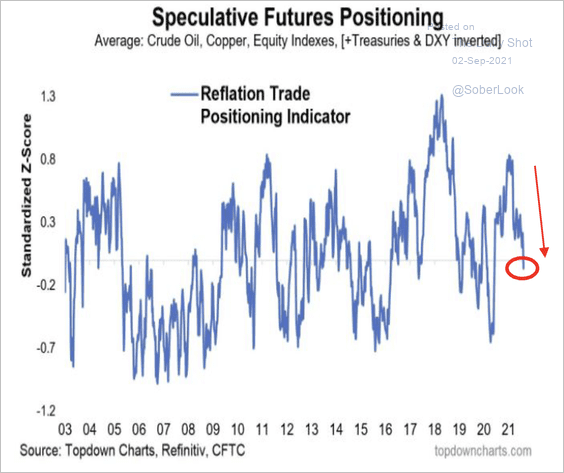 Source: @topdowncharts
4. Citi’s Global Economic Surprise Index turned negative, ending its second-longest positive streak in almost 20 years.
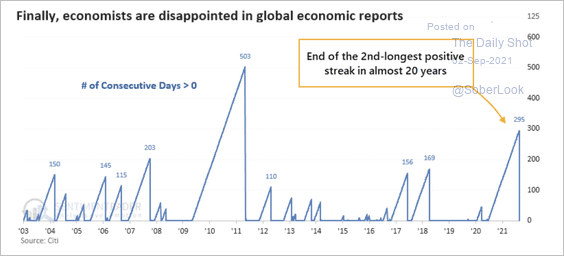 Source: SentimenTrader
5. How long will it take to return to pre-pandemic employment rates?
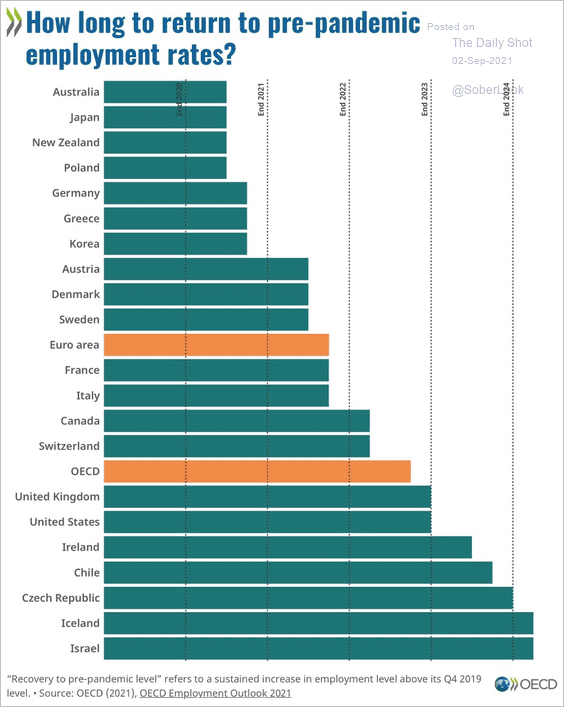 Source: @OECD Read full article
6. The rapid rise in food prices, which typically coincides with geopolitical stress, is starting to moderate.
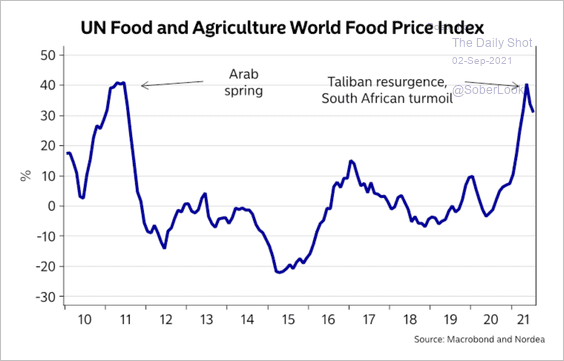 Source: Nordea Markets
——————–
Food for Thought
1. Companies slashing travel budgets:
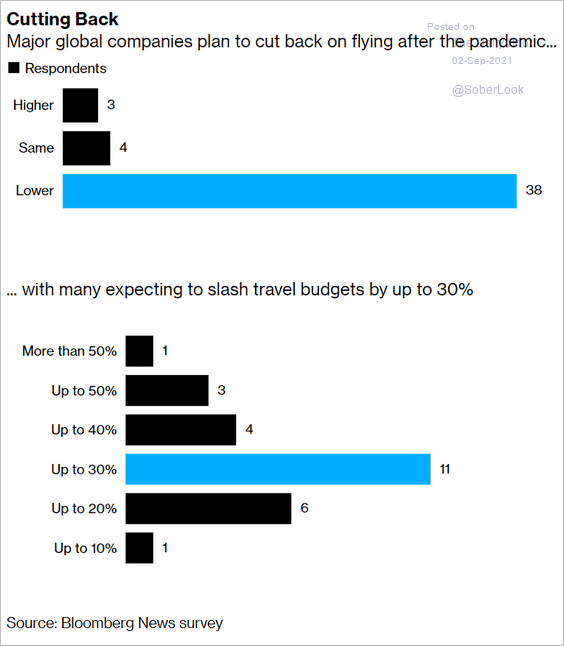 Source: @business; h/t @DiMartinoBooth Read full article
2. The world’s most expensive cities for construction:
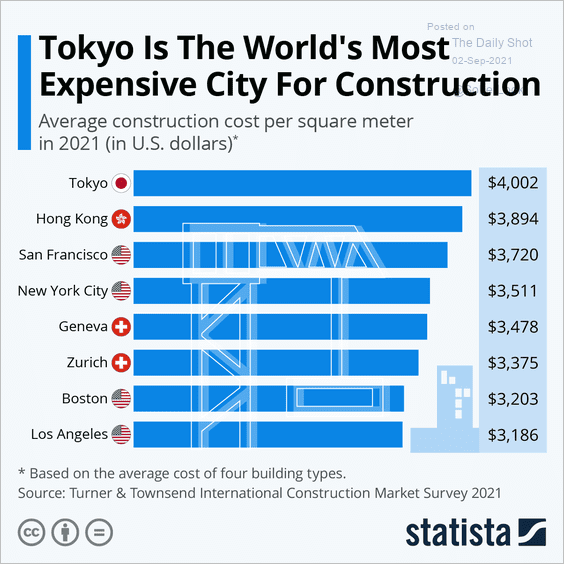 Source: Statista
3. US almond production:
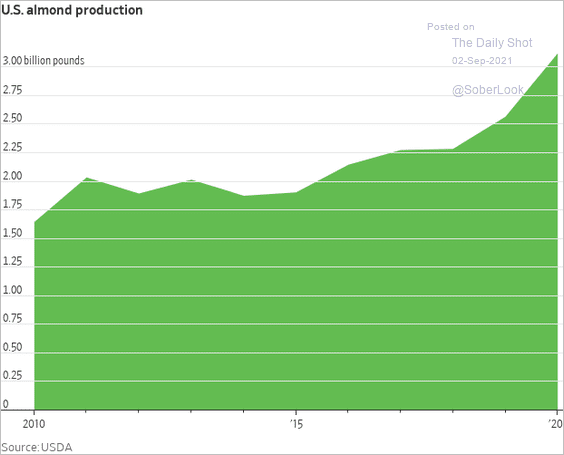 Source: @WSJ Read full article
4. Vegas is back:
 Source: @axios
5. US COVID relief packages’ impact on a family of four:
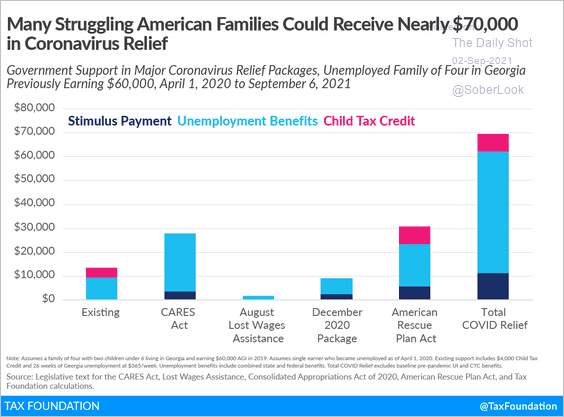 Source: Tax Foundation
• Three-year change in US poverty rate:
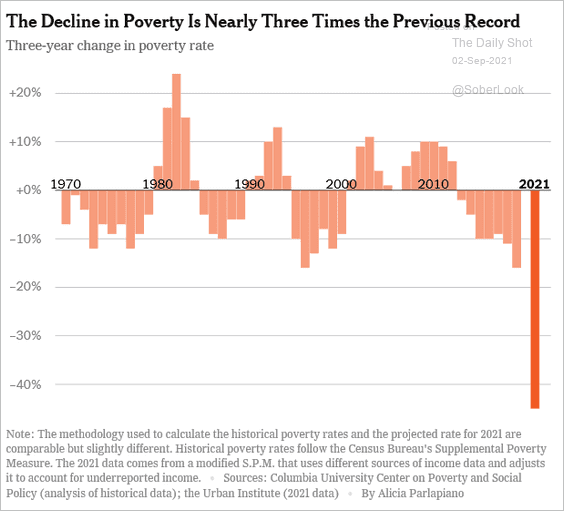 Source: The New York Times Read full article
——————–
6. US supermarket and restaurant wages:
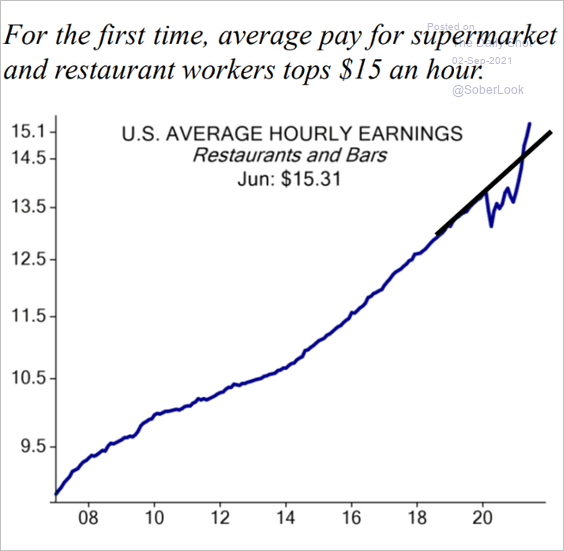 Source: Evercore ISI
7. The US federal budget:
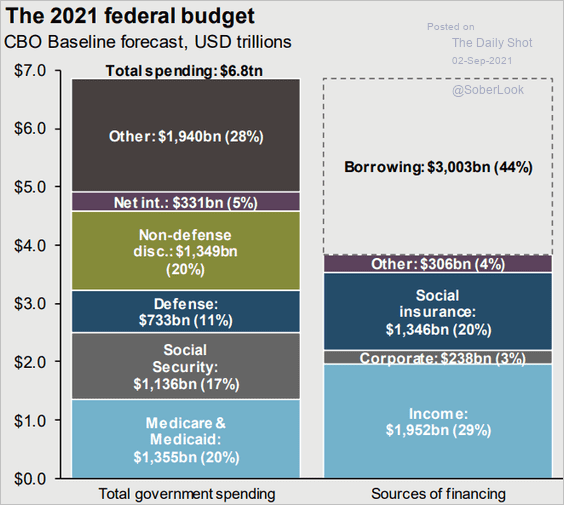 Source: @JPMorganAM
8. Manufacturing employment in advanced economies:
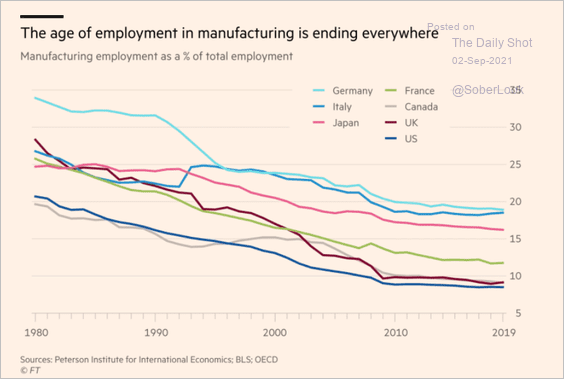 Source: @financialtimes Read full article
9. The Taliban’s new arsenal:
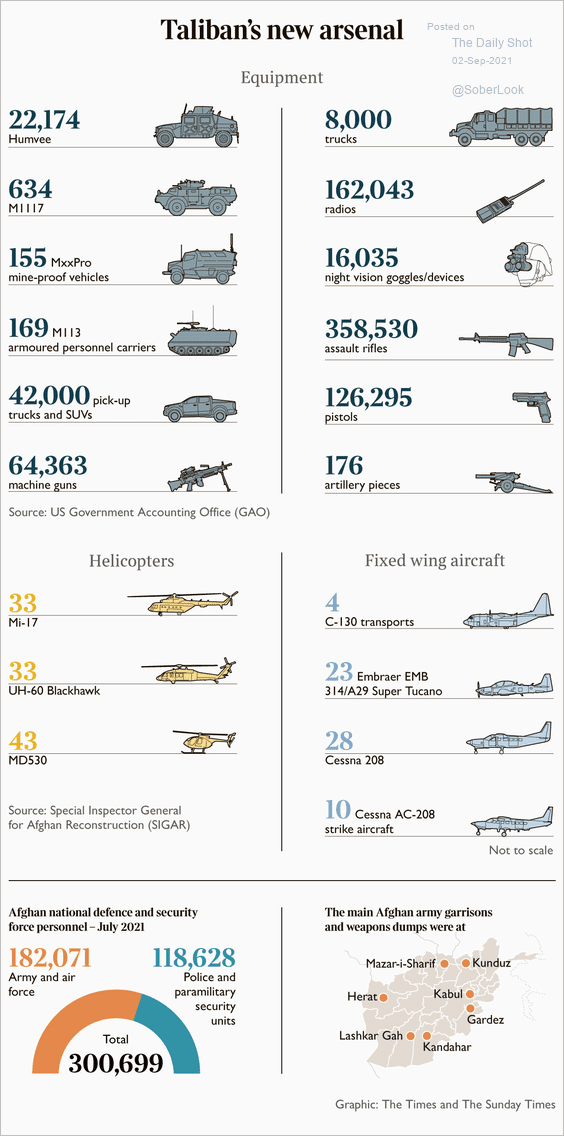 Source: @NoahCRothman Read full article
10. US voters’ concerns about security:
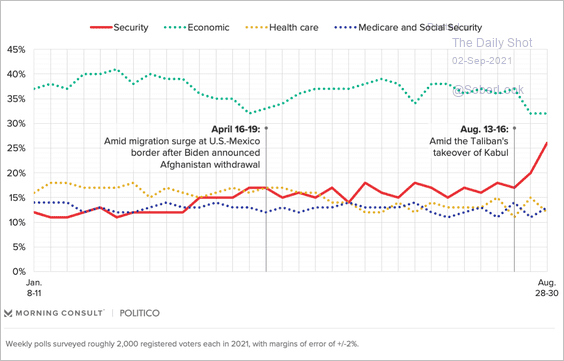 Source: Morning Consult Read full article
11. Actors with the highest swear count:
 Source: @statspanda1
——————–
The next Daily Shot will be out on Tuesday.
Have a great weekend!
Back to Index