
The Daily Shot: 17-Sep-21
• The United States
• Canada
• The Eurozone
• Asia – Pacific
• China
• Emerging Markets
• Cryptocurrency
• Energy
• Equities
• Rates
• Global Developments
• Food for Thought
The United States
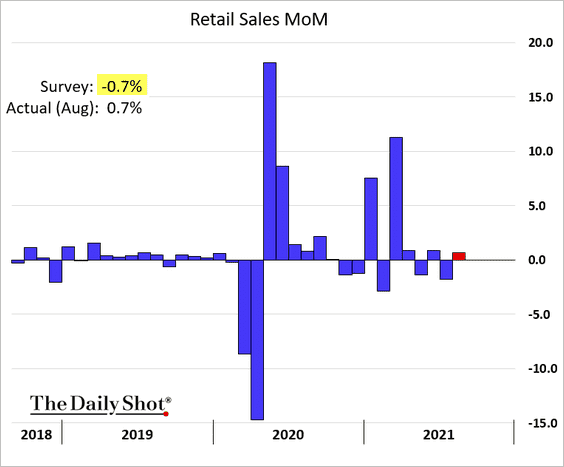
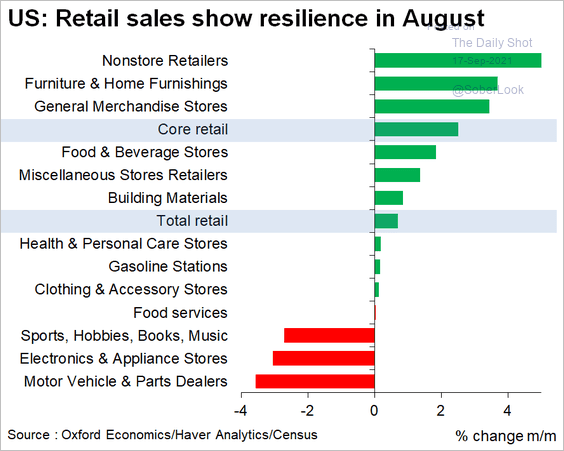
1. August retail sales topped economists’ forecasts.
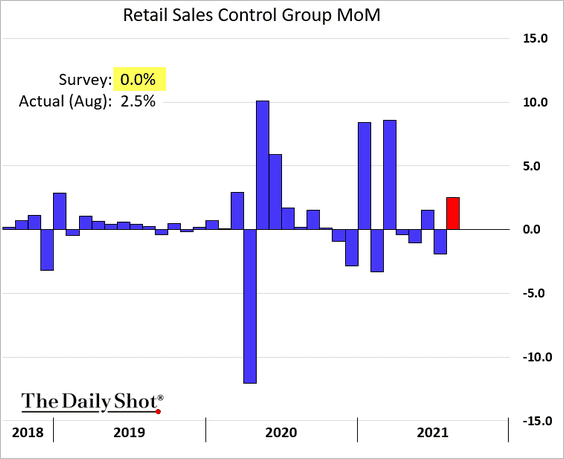
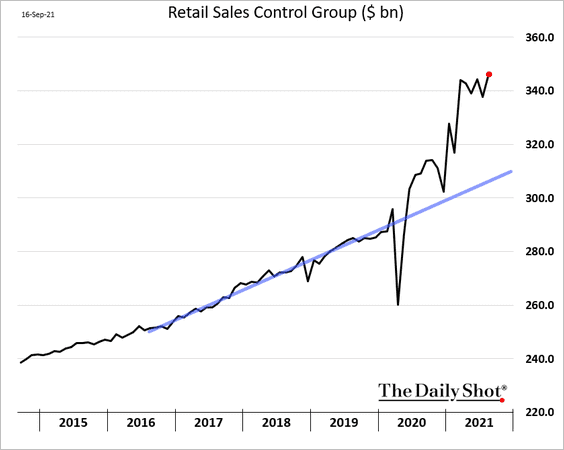
• Here is the control group which excludes volatile items (autos, building materials, gas, office supplies, mobile homes, and tobacco).
The absolute level of retail sales is well above the pre-COVID trend.
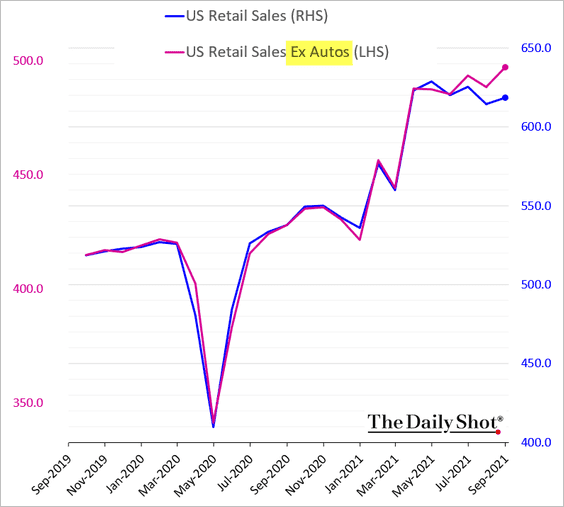
• Autos have been a drag on retail sales in recent months.
• Below are the changes in sales by sector.
 Source: @GregDaco
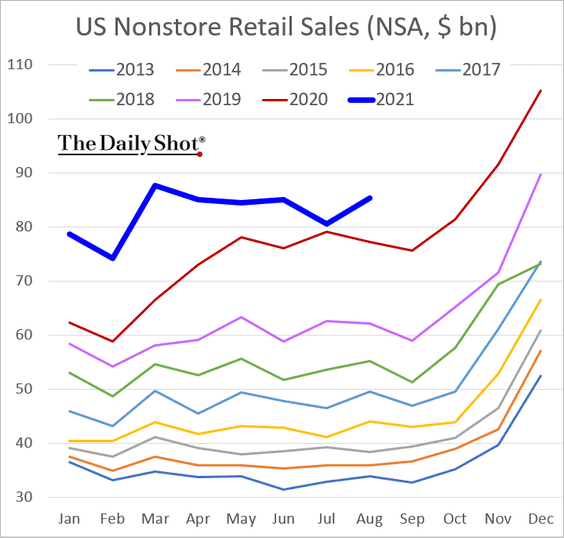
• Online sales are still running above last year’s blistering pace.
——————–
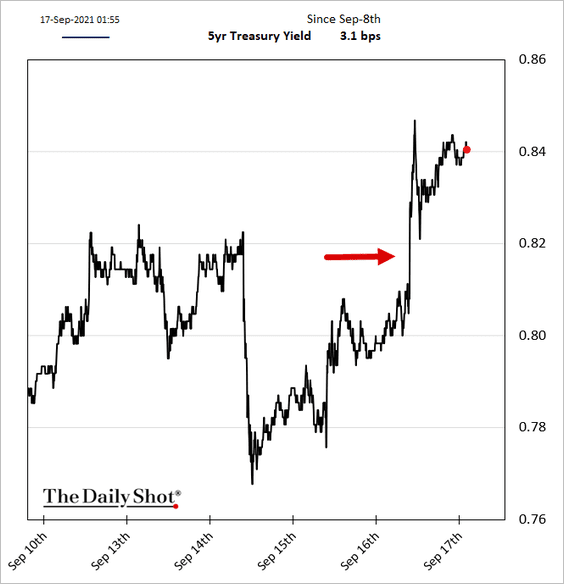
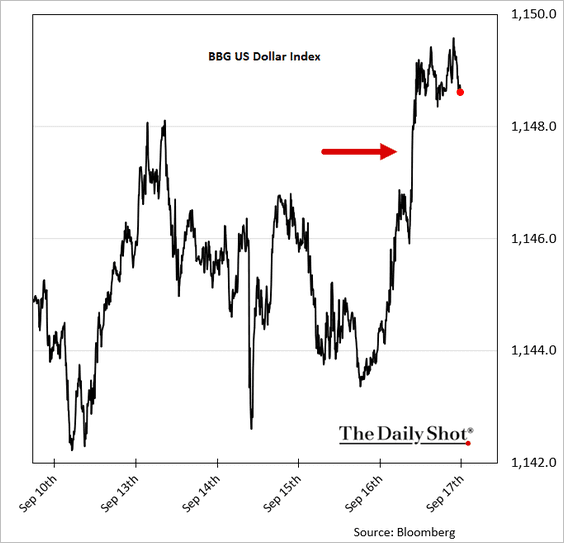
2. Treasury yields and the dollar climbed in response to the retail sales beat.
——————–
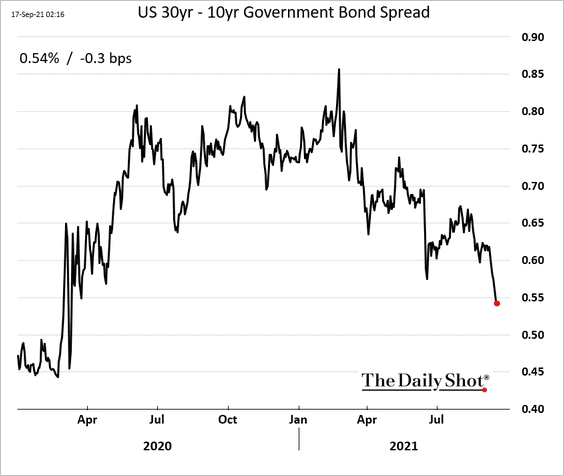
3. The Treasury curve has been flattening at the longer end, which may signify falling inflation expectations.
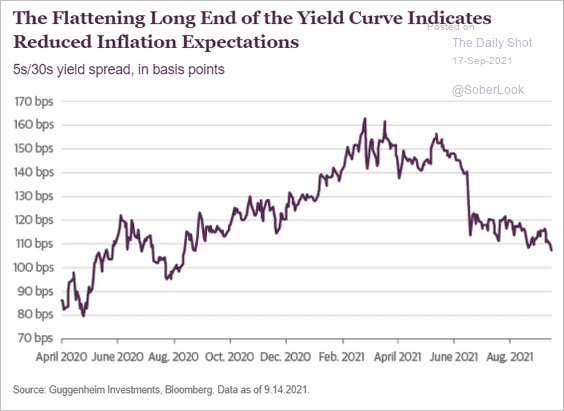 Source: Guggenheim
Fund managers increasingly see inflation as transitory.
![]() Source: BofA Global Research
Source: BofA Global Research
——————–
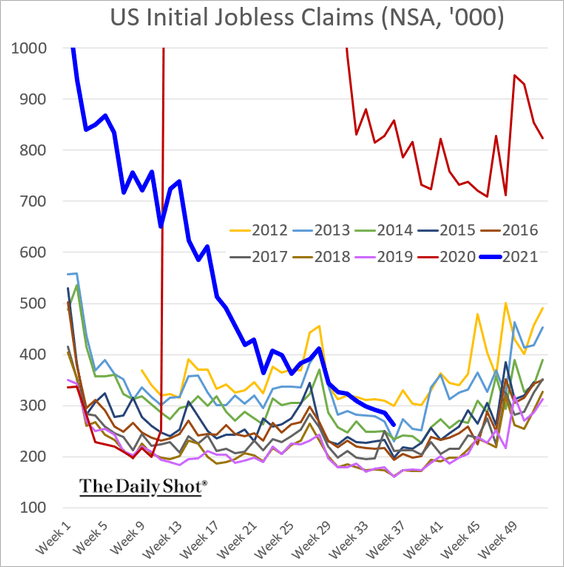
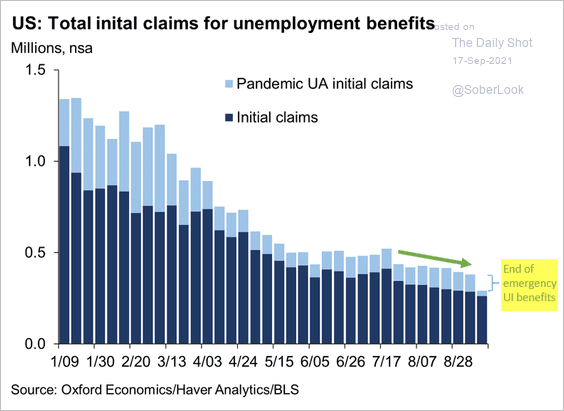
4. Initial jobless claims have been trending lower.
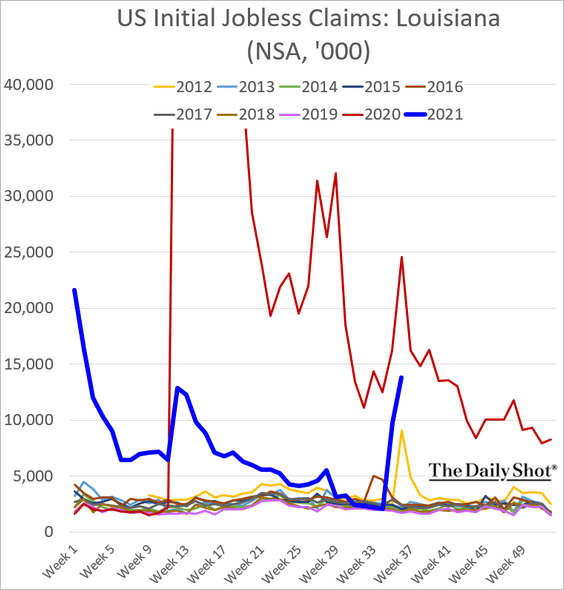
• Louisiana saw a spike in unemployment applications due to Hurricane Ida.
 Source: The Daily Advertiser Read full article
• Emergency benefits programs have ended. Will labor shortages ease now?
 Source: @GregDaco
——————–
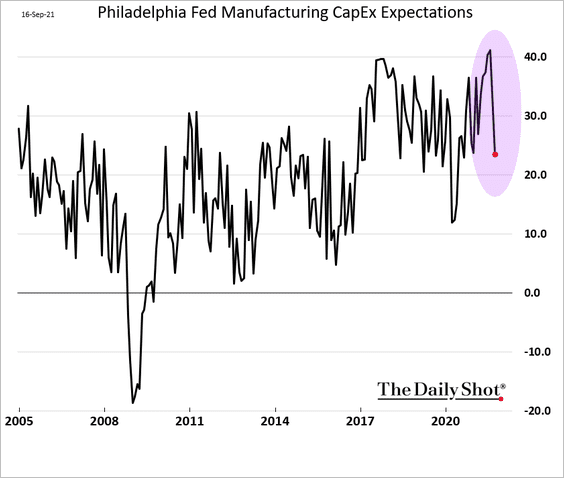
5. The Philly Fed’s regional manufacturing index surprised to the upside.
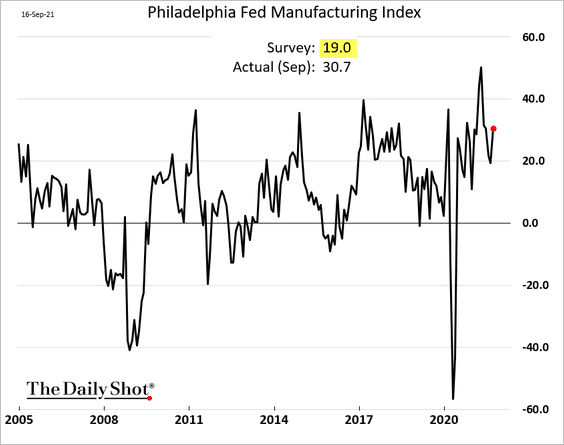
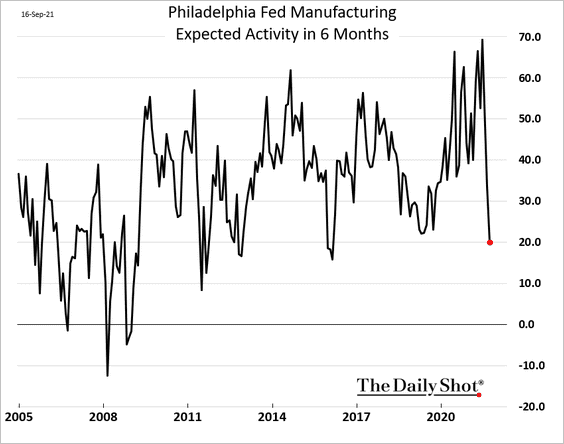
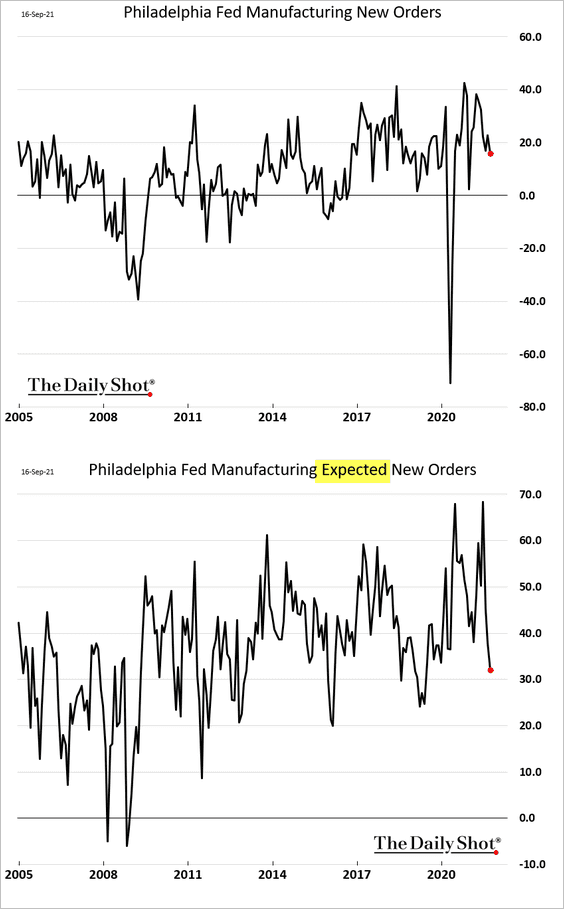
However, forward-looking components of the index showed deterioration (manufacturers are less upbeat about the future).
• Expected activity:
• New orders:
• CapEx:
• Leading vs. lagging components (this indicator doesn’t bode well for manufacturing at the national level):
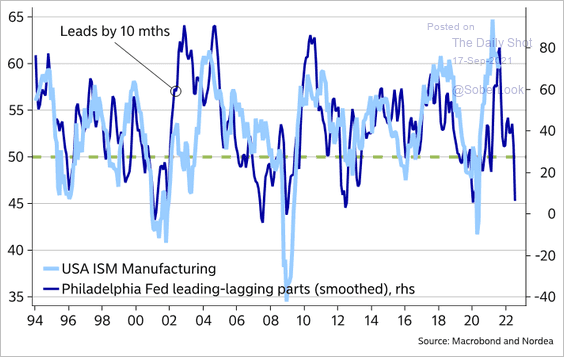 Source: @MikaelSarwe
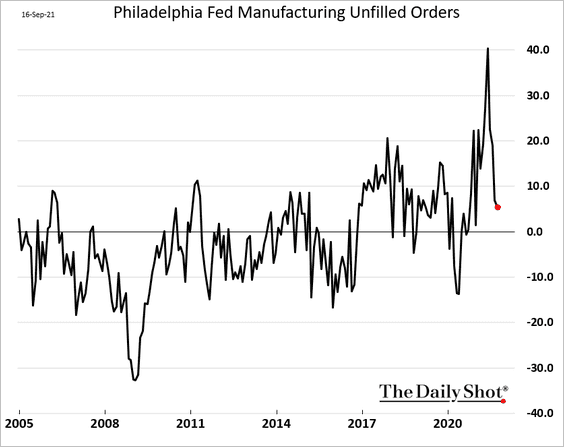
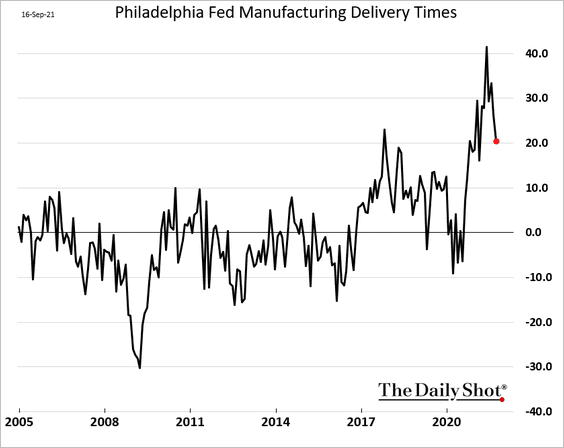
Supplier bottlenecks appear to be moderating.
• Unfilled orders:
• Delivery times:
——————–
5. Has the Citi Economic Surprise Index bottomed?
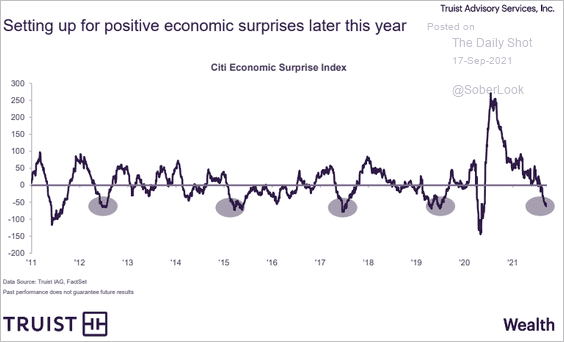 Source: Truist Advisory Services
6. Past recoveries saw consumers grow less optimistic after a strong economic rebound.
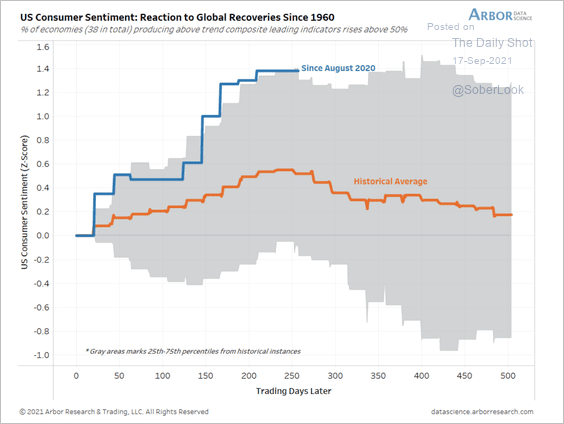 Source: Arbor Research & Trading
7. Job postings on Indeed continue to climb.
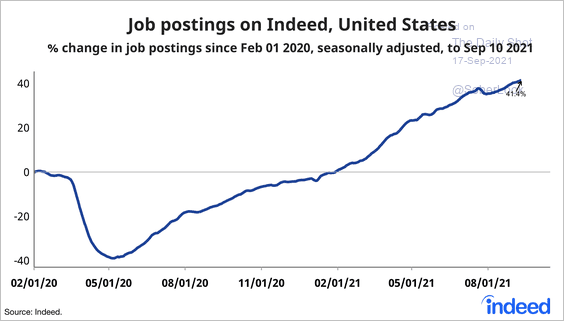 Source: @AE_Konkel, @indeed
8. Will COVID cases surge again in the winter?
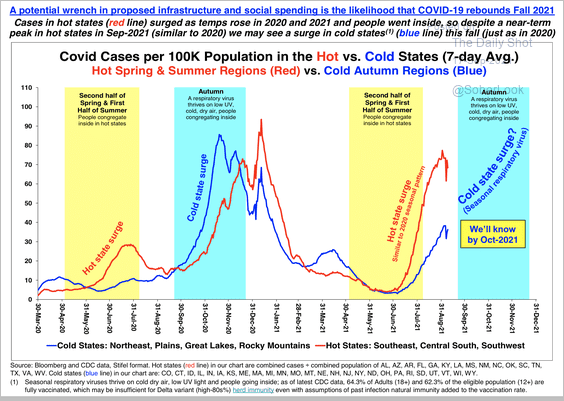 Source: Stifel
Back to Index
Canada
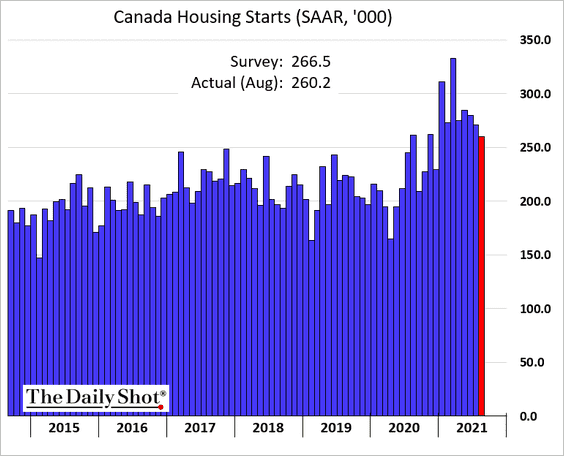
1. Housing starts are off the peak but remain robust.
2. Manufacturing sales eased in July.
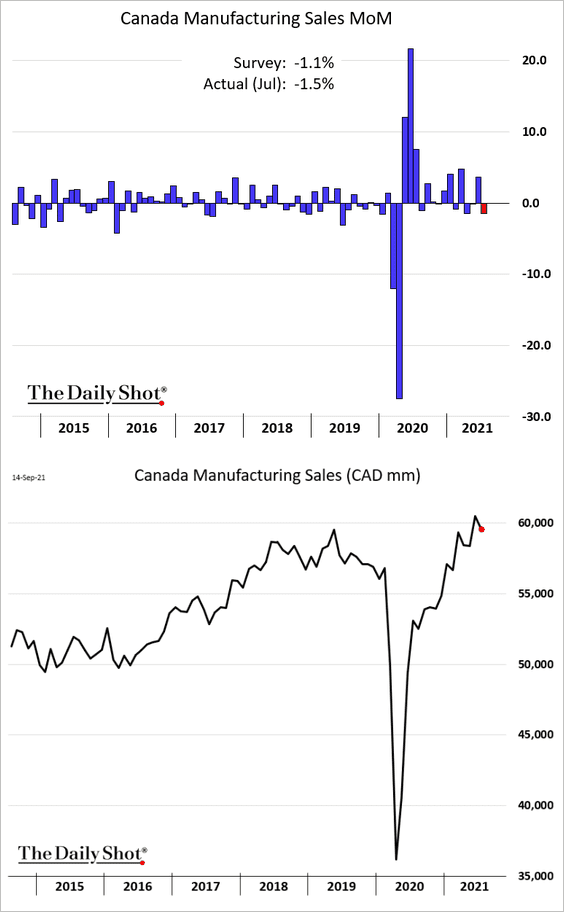
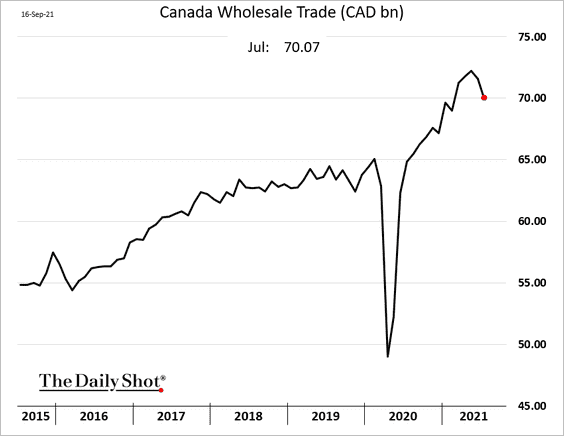
Wholesale trade is moderating.
3. This chart shows a forecast for Canada’s government budget.
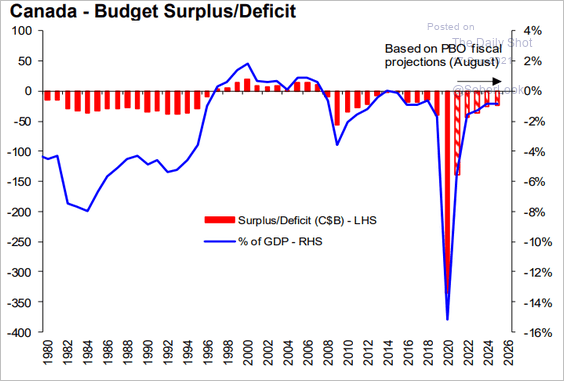 Source: Hugo Ste-Marie, Portfolio & Quantitative Strategy Global Equity Research, Scotia Capital
Back to Index
The Eurozone
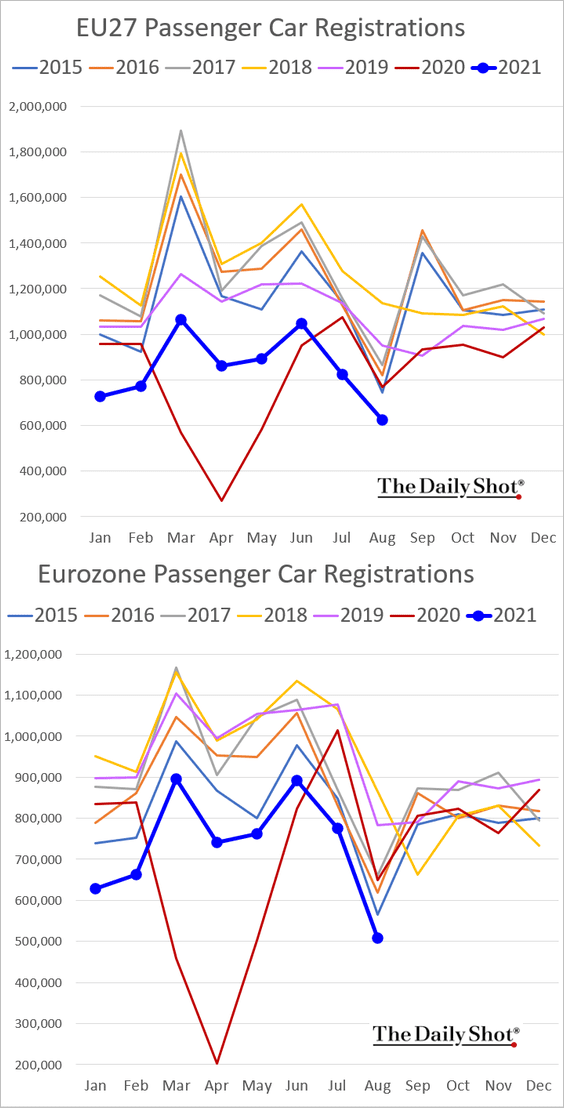
1. Car registrations remain soft.
2. The Eurozone’s industrial production has been lagging the rest of the EU.
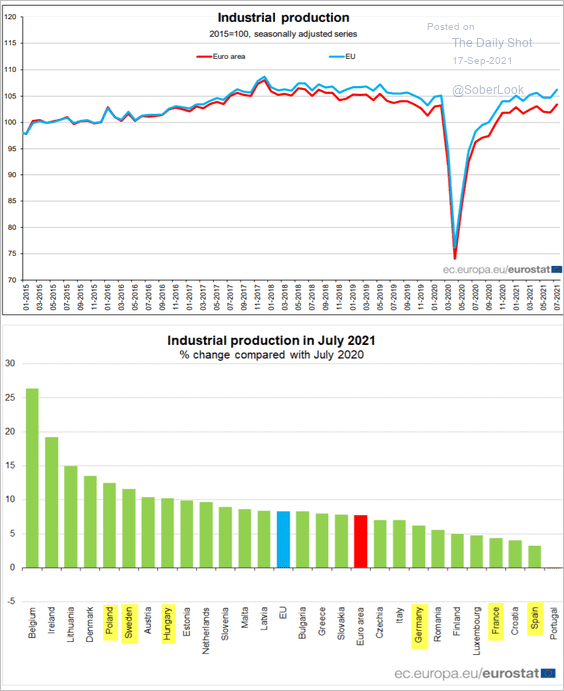 Source: Eurostat Read full article
Germany’s weakening automobile production has been a drag on industrial output.
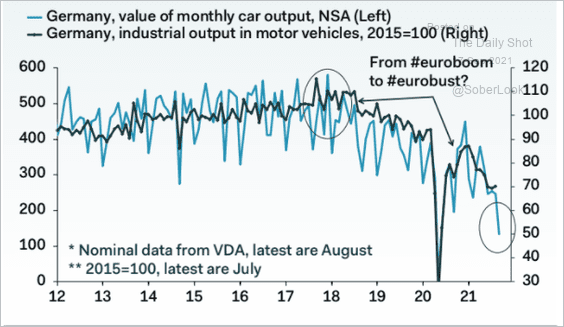 Source: Pantheon Macroeconomics
——————–
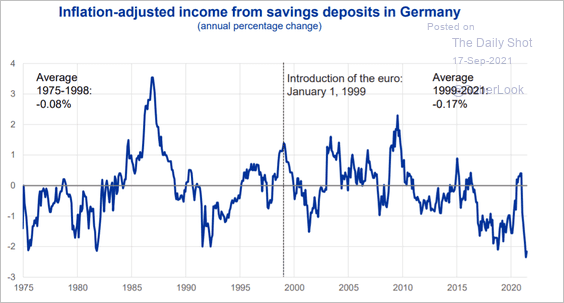
3. Banks have been passing on negative rates to some of their customers.
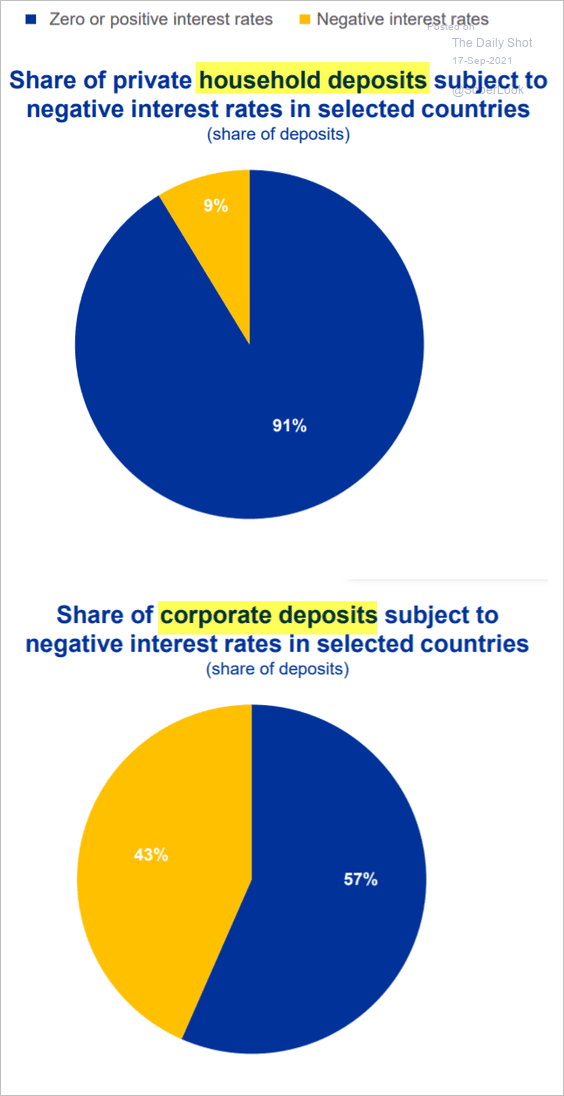 Source: ECB Read full article
This chart shows inflation-adjusted income from German savings deposits.
 Source: ECB Read full article
——————–
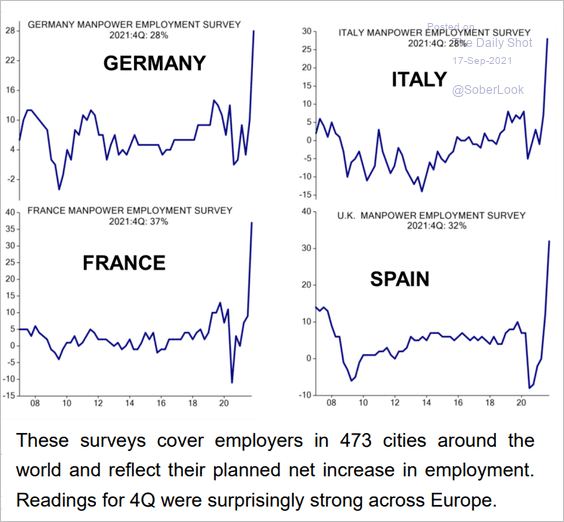
4. Companies are indicating that they plan to accelerate hiring next quarter.
 Source: Evercore ISI
Back to Index
Asia – Pacific
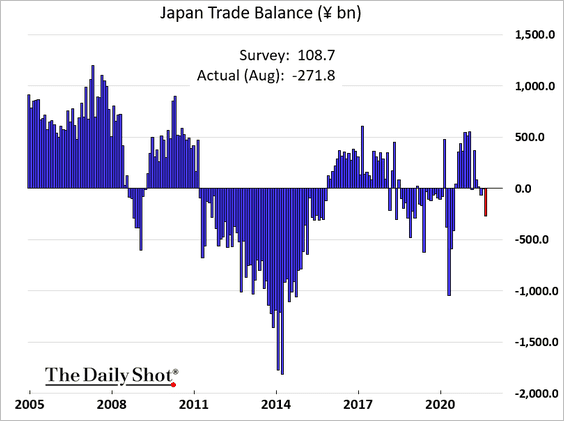
1. Japan’s trade balance unexpectedly swung into deficit.
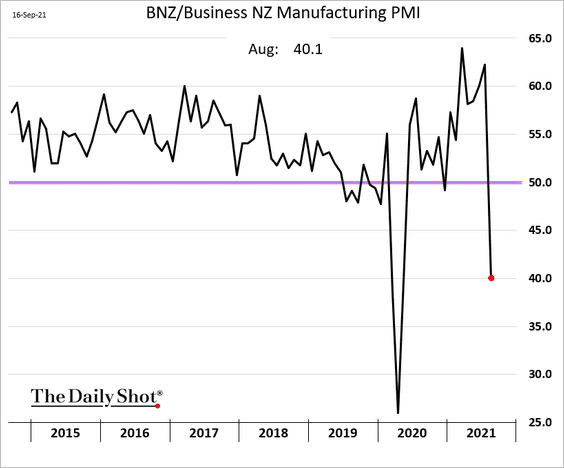
2. New Zealand’s factory activity contracted sharply last month.
Back to Index
China
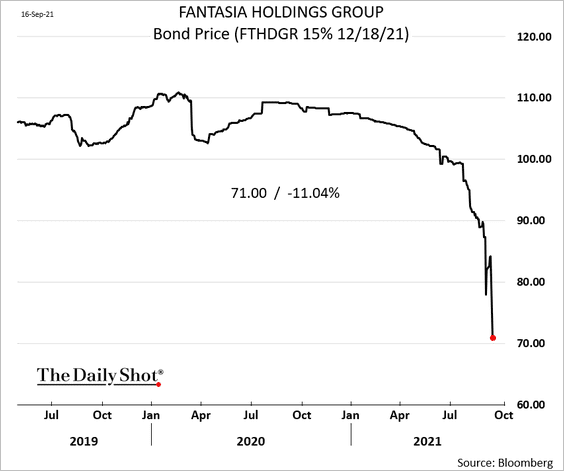
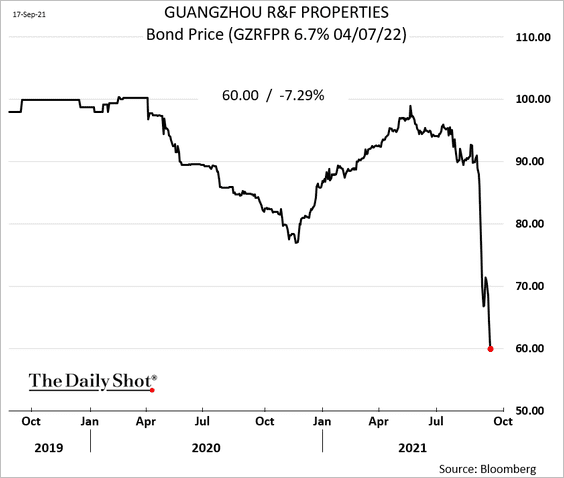
1. The Evergande credit contagion is spreading, with bonds of other leveraged developers tumbling.
• Fantasia:
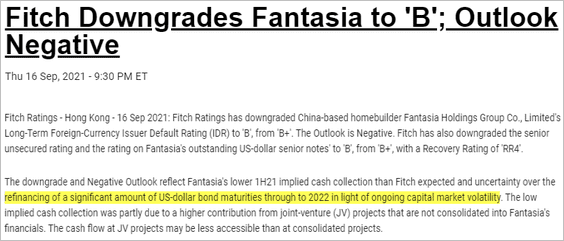 Source: Fitch Ratings
• Guangzhou R&F:
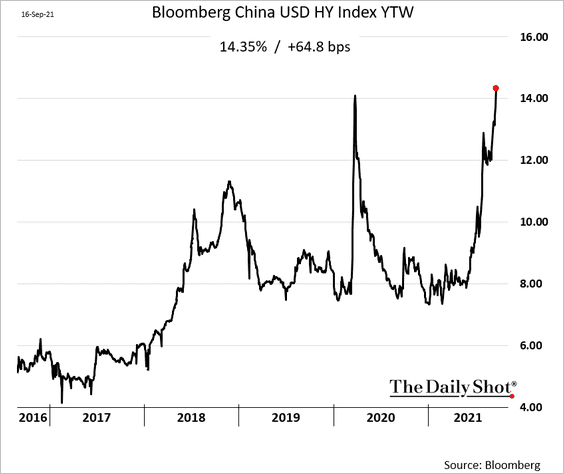
The high-yield index yield hit a multi-year high.
——————–
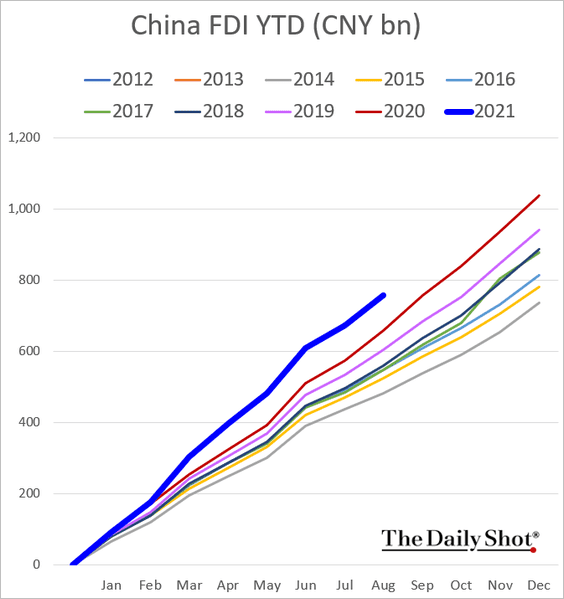
2. Foreign direct investment has been robust.
3. Is the renminbi too strong?
• CNY vs. RRR:
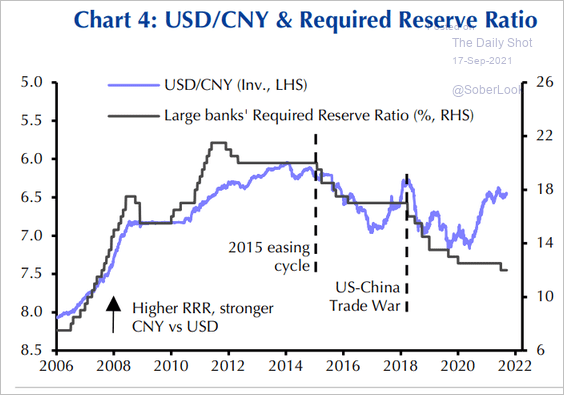 Source: Capital Economics
• CNY vs. stocks:
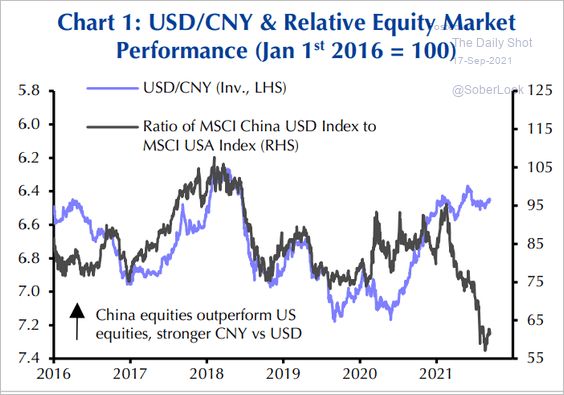 Source: Capital Economics
——————–
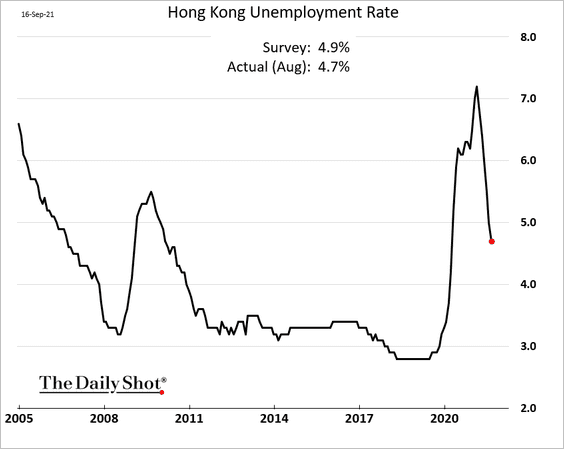
4. Hong Kong’s unemployment rate continues to fall.
5. China has seen a sharp increase in inequality, leading to the worst ranking among other regions.
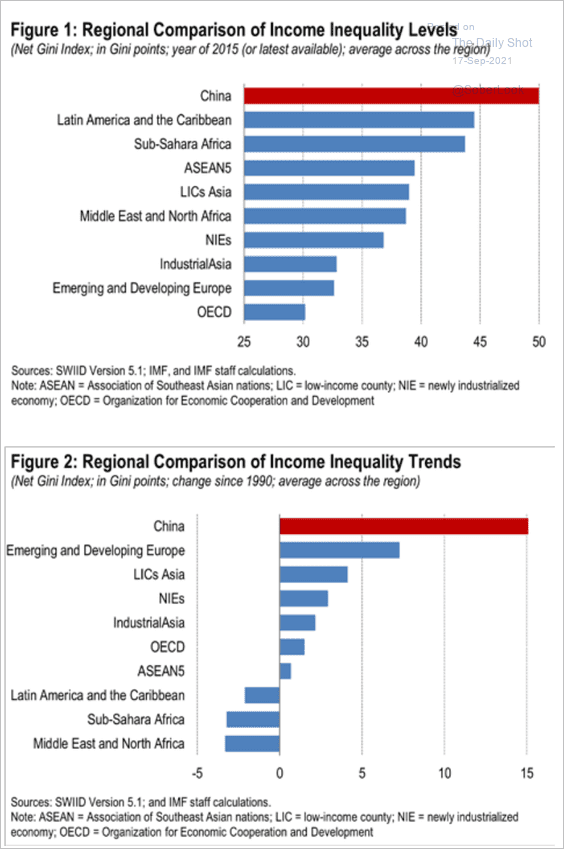 Source: IMF; h/t Hayden Capital, h/t Snippet.Finance
Back to Index
Emerging Markets
1. Emerging markets are seeing a broad-based slowdown in manufacturing growth.
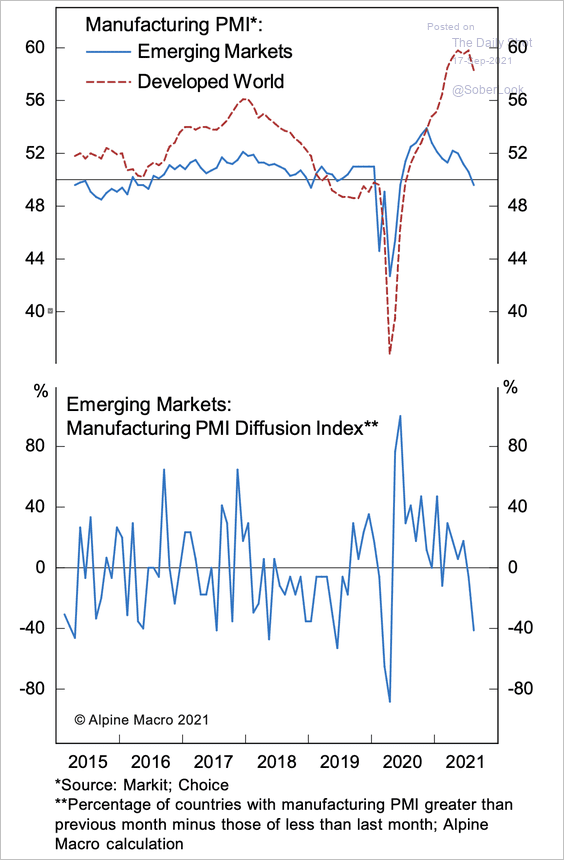 Source: Alpine Macro
2. Where are the various EM economies in the economic cycle?
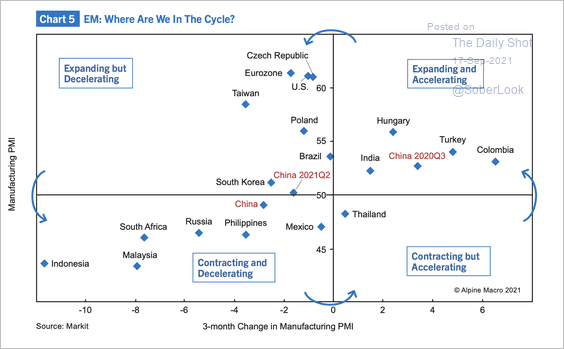 Source: Alpine Macro
3. Food inflation is disproportionally affecting EM countries.
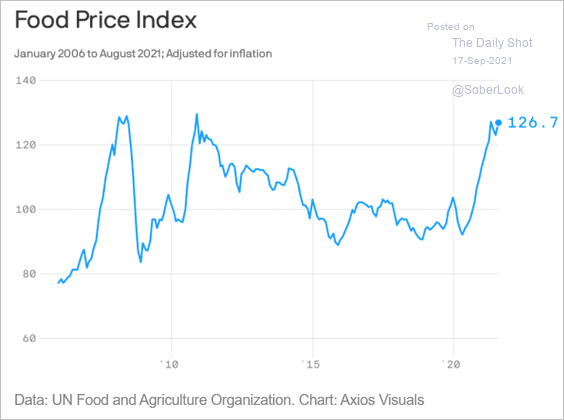 Source: @axios Read full article
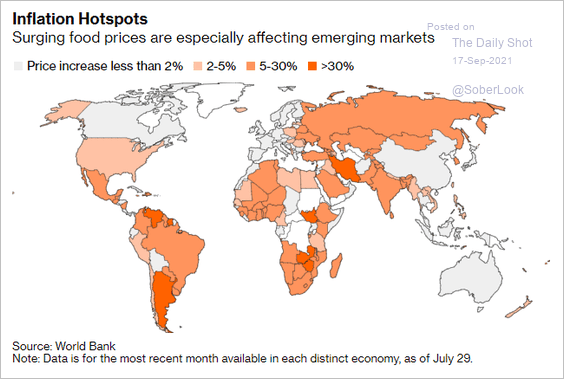 Source: @StuartLWallace, @AggieDeSousa, @_jsdiamond Read full article
Back to Index
Cryptocurrency
1. Bitcoin’s implied volatility is selling off as range-bound trading continues and the market heads into quarterly options expiry next week.
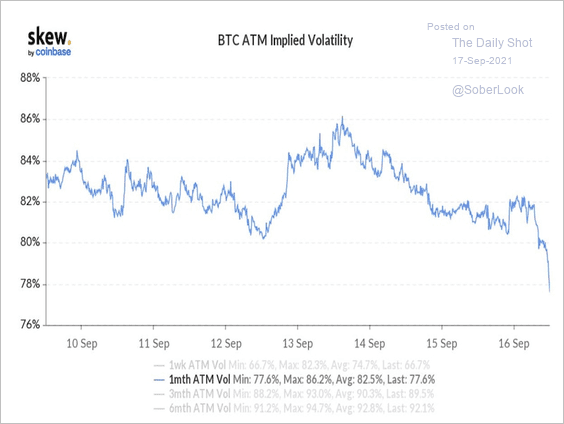 Source: Skew
2. Recently, large transaction volumes hit a two-year high of more than 10 million BTC, suggesting renewed bitcoin adoption by large investors.
![]() Source: IntoTheBlock Read full article
Source: IntoTheBlock Read full article
3. The chart below shows a declining correlation between bitcoin and gold, while the correlation between bitcoin and the S&P 500 has risen over the past few months.
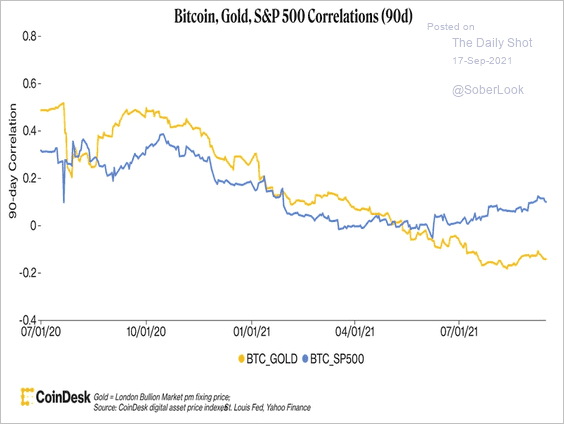 Source: CoinDesk Read full article
4. Is financial media losing interest in crypto markets?
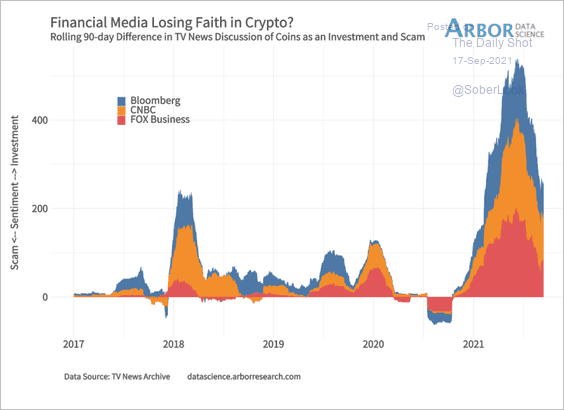 Source: Arbor Research & Trading
5. What’s the profile of US crypto investors relative to the broader population?
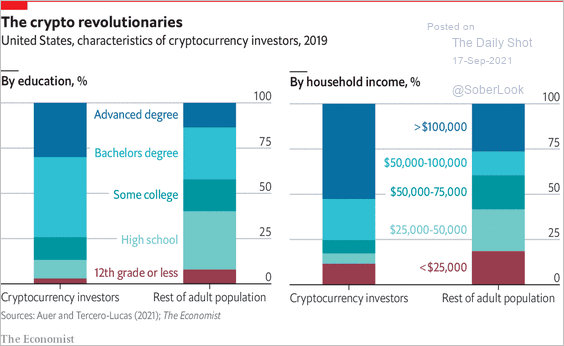 Source: The Economist Read full article
Back to Index
Energy
1. Brent is testing long-term resistance.
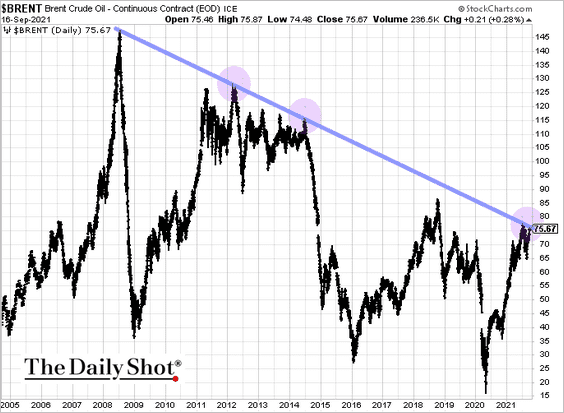 h/t @AkshayChinchal4
2. European gas storage inventory is well below the 10-year range.
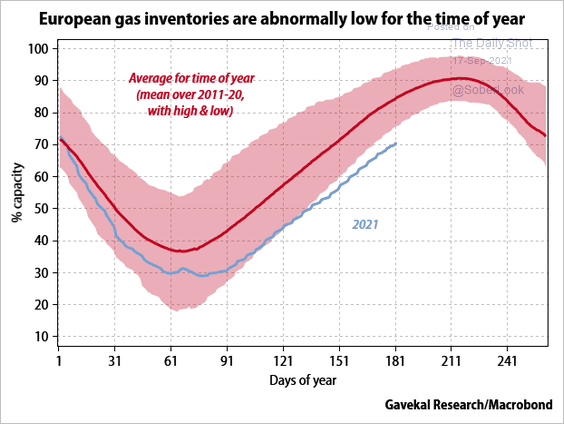 Source: Gavekal Research
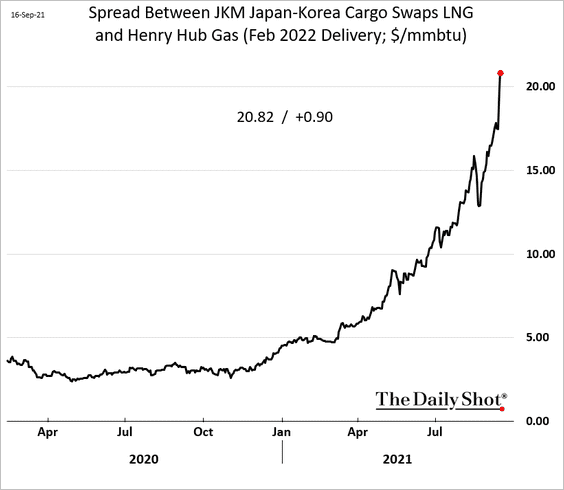
3. US LNG export business is becoming extremely profitable.
Back to Index
Equities
1. The S&P 500’s past 200 days (shown in blue) are most similar to the following years, which preceded pullbacks. This time, however, upside momentum has been strong, with most stocks trading above their long-term trends.
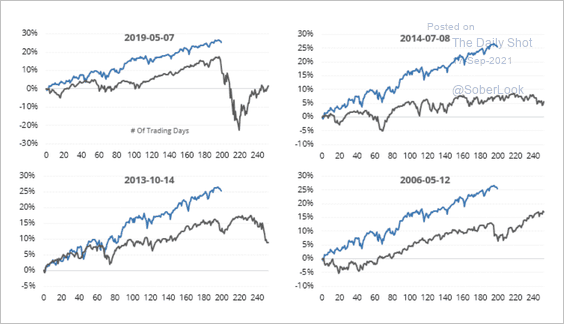 Source: SentimenTrader
2. Retail traders prefer short-term options (betting on rapid rebounds).
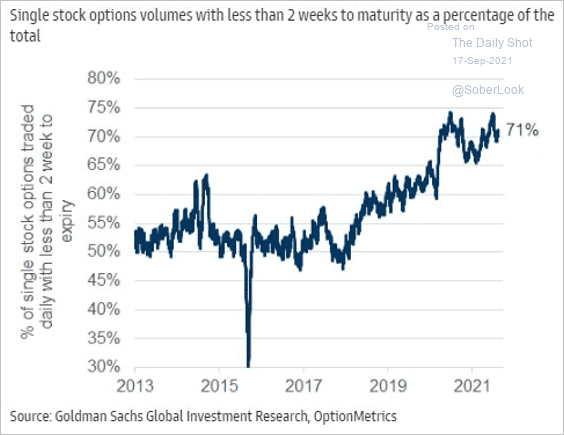 Source: Goldman Sachs
3. Historically, owning stocks only during favorable credit conditions has outperformed a buy-and-hold strategy.
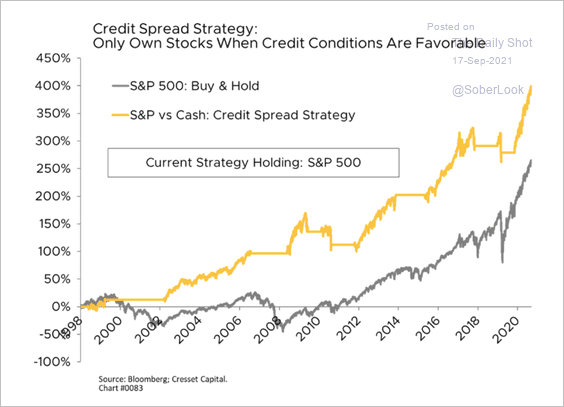 Source: Jack Ablin, Cresset Wealth Advisors
4. As we saw previously (#3 here), fund managers’ equity exposure has diverged from their views on the economy.
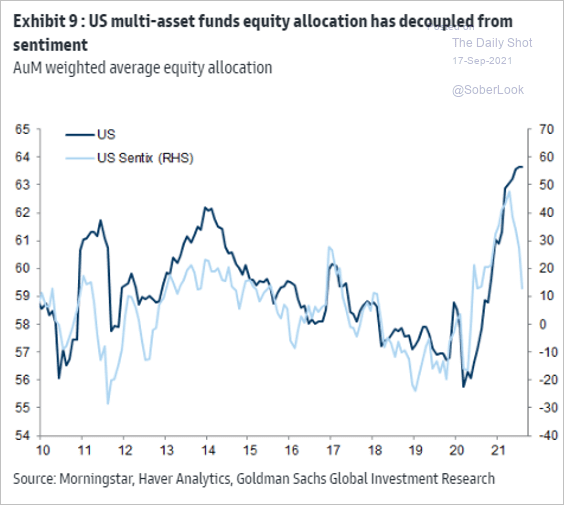 Source: Goldman Sachs
5. This chart shows the evolution of sentiment by sector.
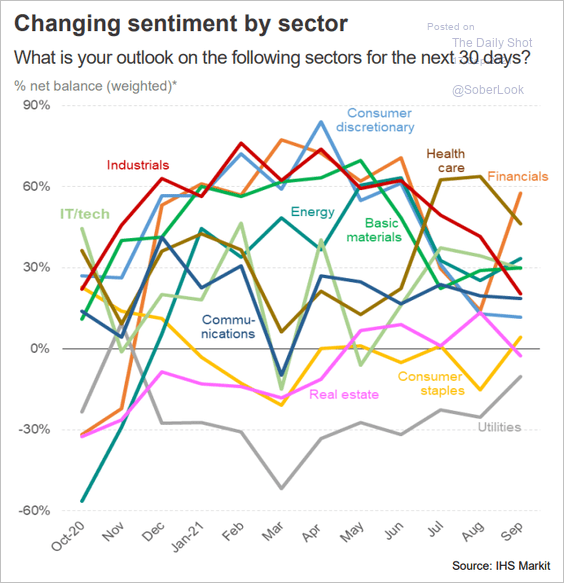 Source: @IHSMarkitPMI
6. Tech stocks in the Nasdaq 100 have massively outperformed the rest of the index.
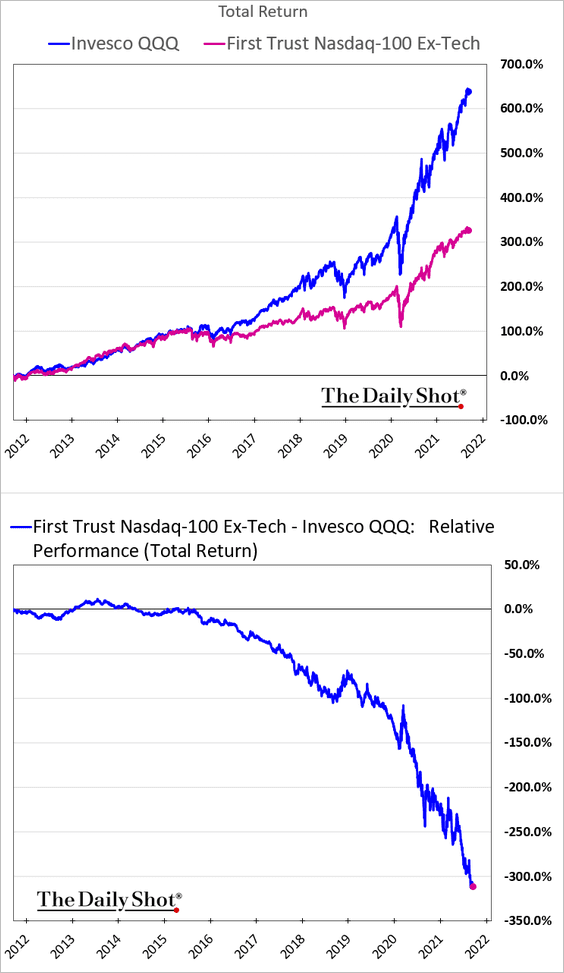 h/t @AndrewThrasher
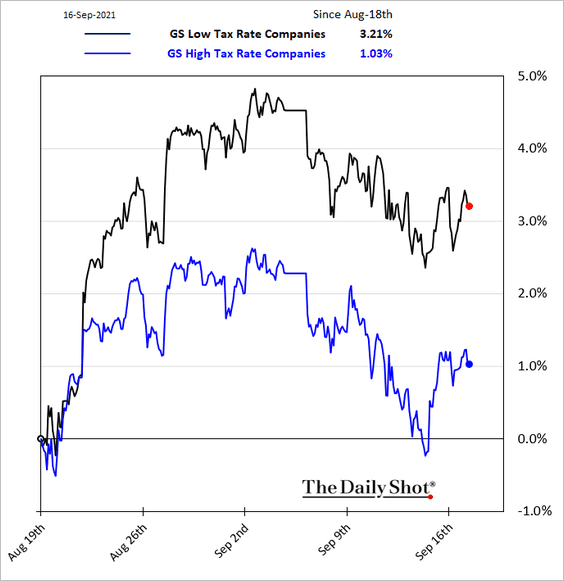
7. Shares of companies with high effective tax rates have underperformed over the past month amid talk of tax hikes.
8. This chart shows the average company lifespan on the S&P 500 index.
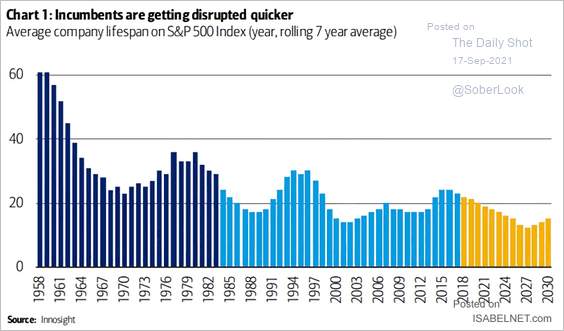 Source: @ISABELNET_SA, @BofAML
9. Just 1.5% of global stocks have generated net wealth over the past three decades.
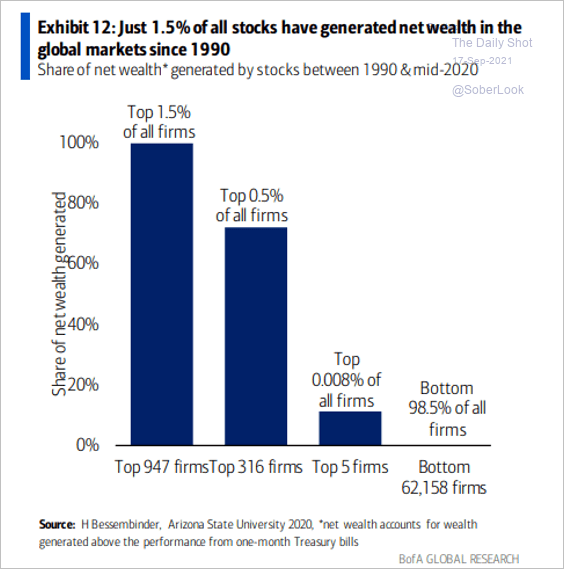 Source: BofA Global Research; @MikeZaccardi
Back to Index
Rates
1. Most 10yr Treasury futures trading activity has occurred near the 1.28% support level since February.
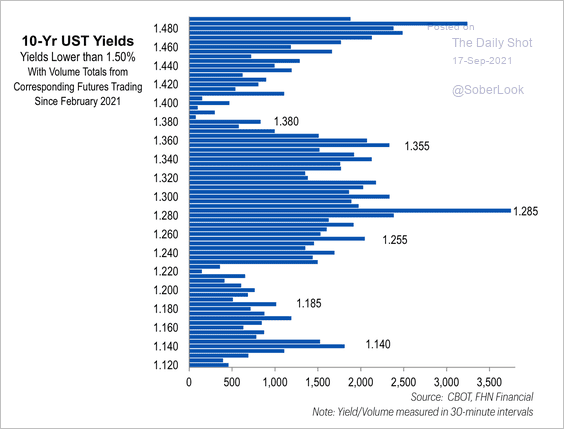 Source: FHN Financial
2. Foreign holdings of Treasury notes and bonds keep climbing, putting downward pressure on yields.
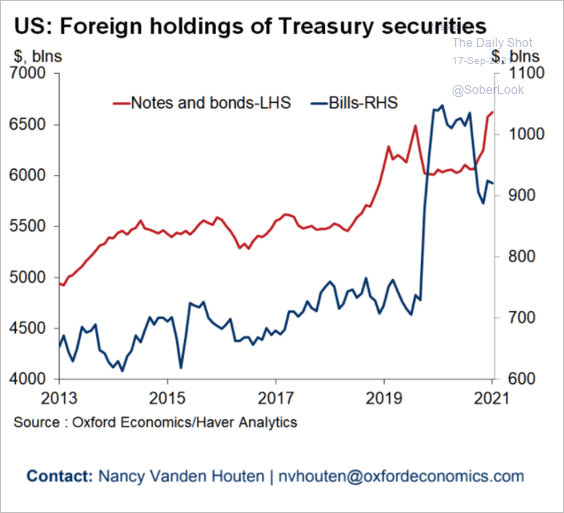 Source: Oxford Economics
3. Flows into TIPS ETFs remain robust, boosting returns.
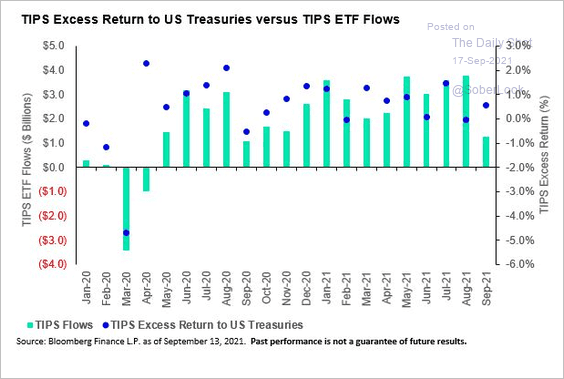 Source: Matthew Bartolini
Back to Index
Global Developments
1. Let’s begin with real returns on government bonds.
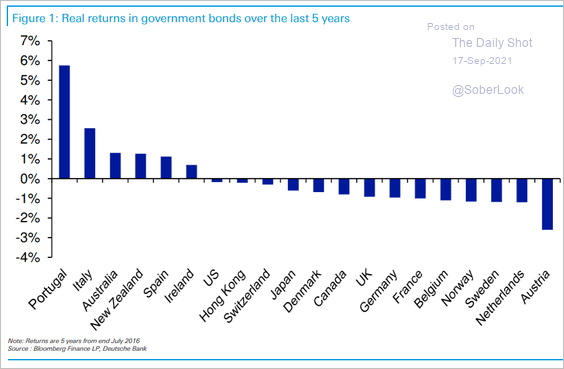 Source: Deutsche Bank Research
2. How do various currencies correlate with the renminbi?
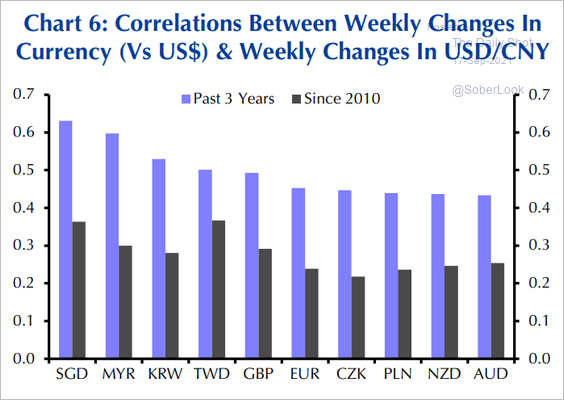 Source: Capital Economics
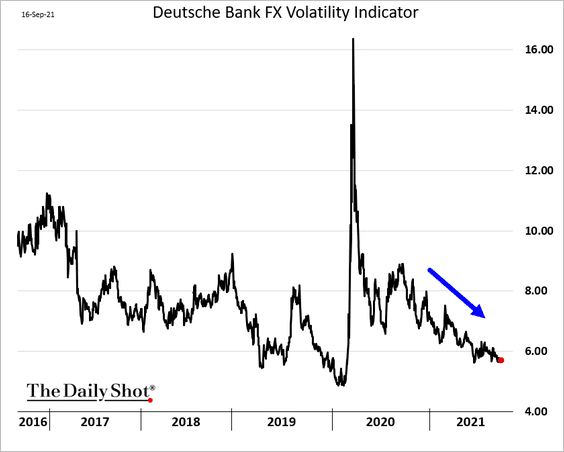
3. F/X volatility continues to trend lower.
4. Next, we have Deutsche Bank’s currency valuation rankings.
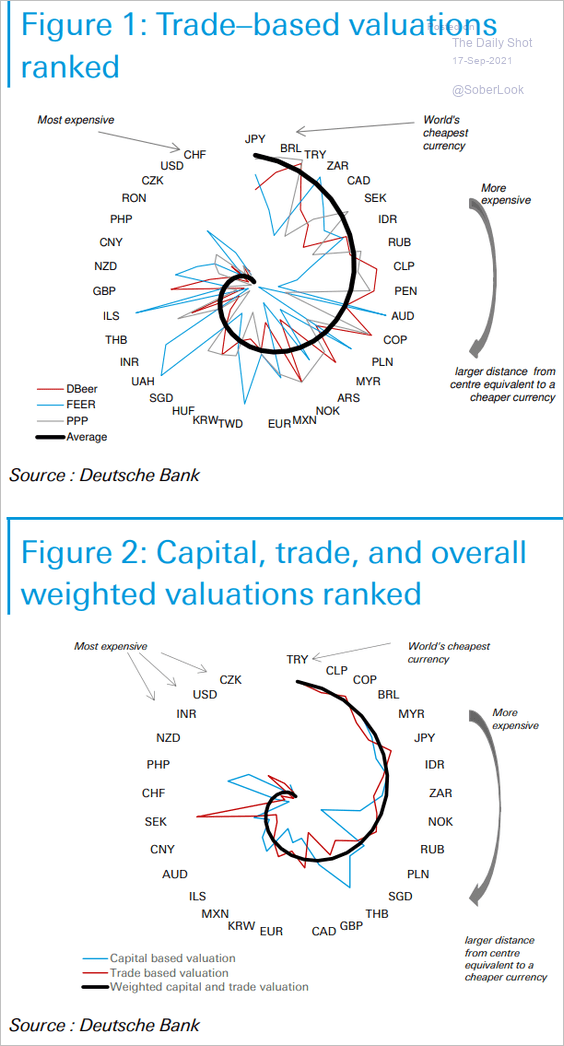 Source: Deutsche Bank Research
5. Over the short term, the correlation between inflation and money supply is low, but it strengthens over time.
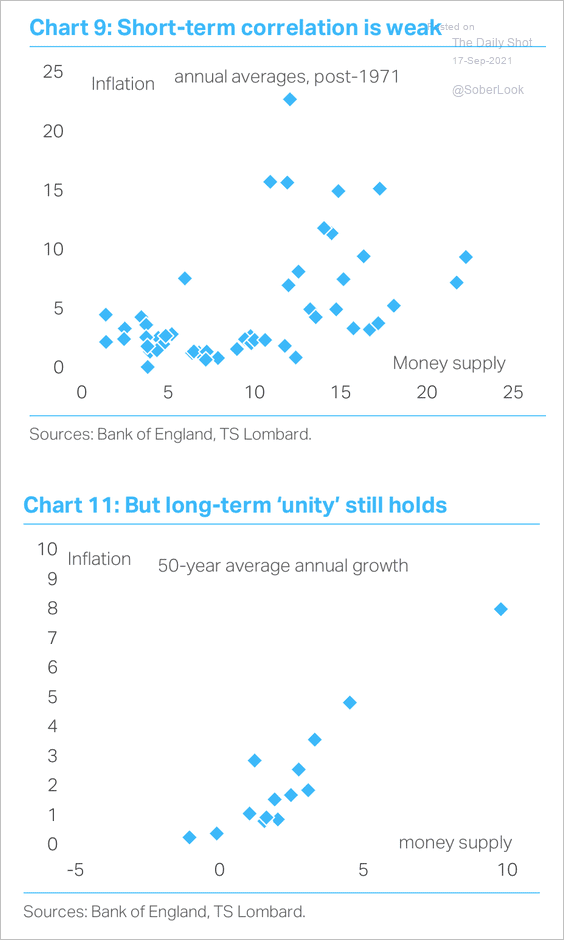 Source: TS Lombard
6. Container shipping costs continue to hit new highs.
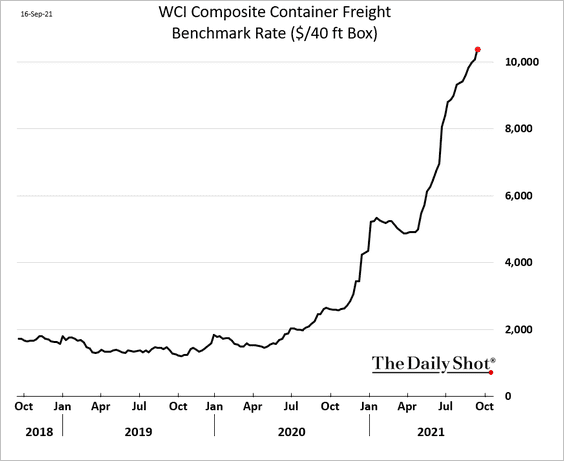
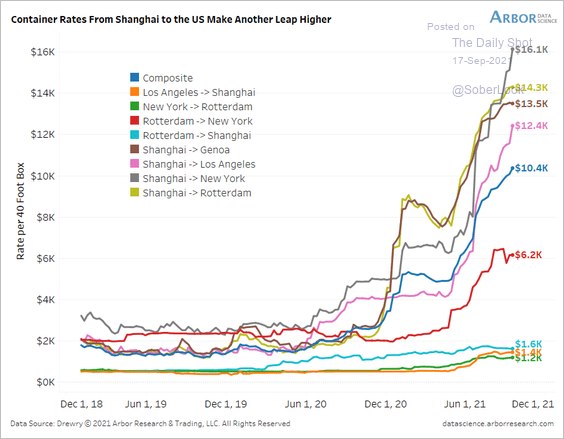 Source: @benbreitholtz
——————–
Food for Thought
1. iPhone prices:
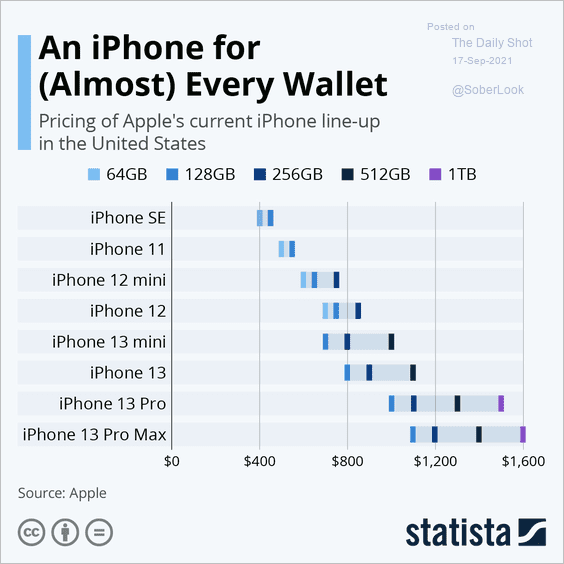 Source: Statista
2. Access to broadband by household income:
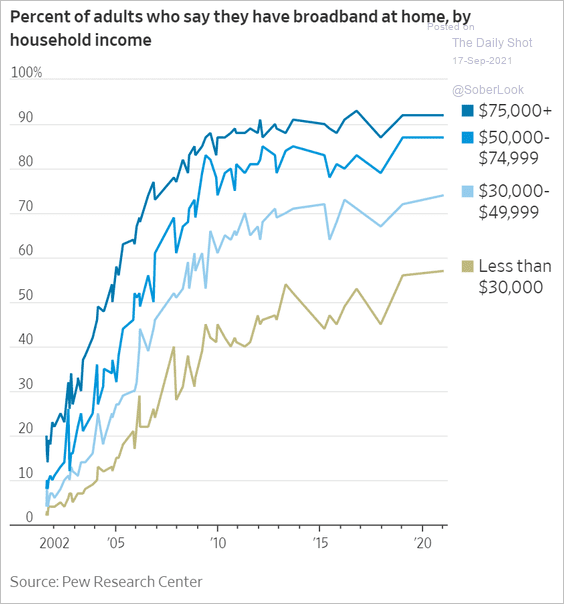 Source: @WSJ Read full article
3. Data recovery after ransomware attacks:
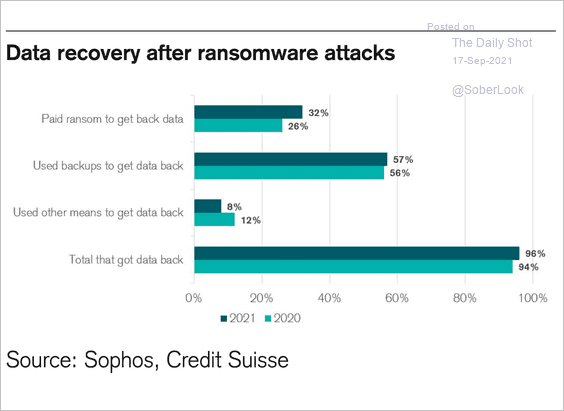 Source: @acemaxx, @csresearch
4. Disney and Netflix subscribers:
 Source: @chartrdaily
5. Tech workers ditching the office even before COVID:
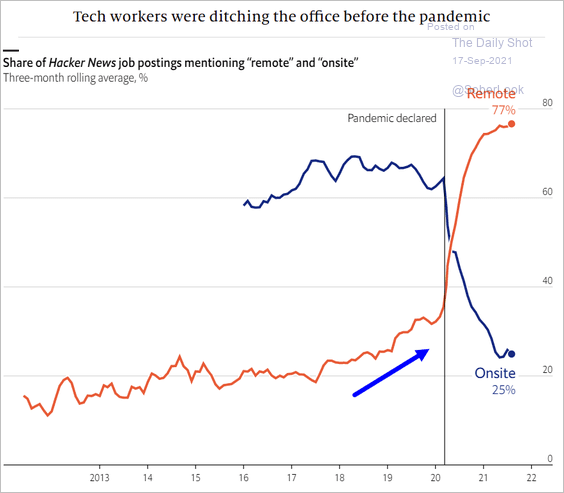 Source: @TheEconomist Read full article
6. Changes in hours worked vs. productivity by country:
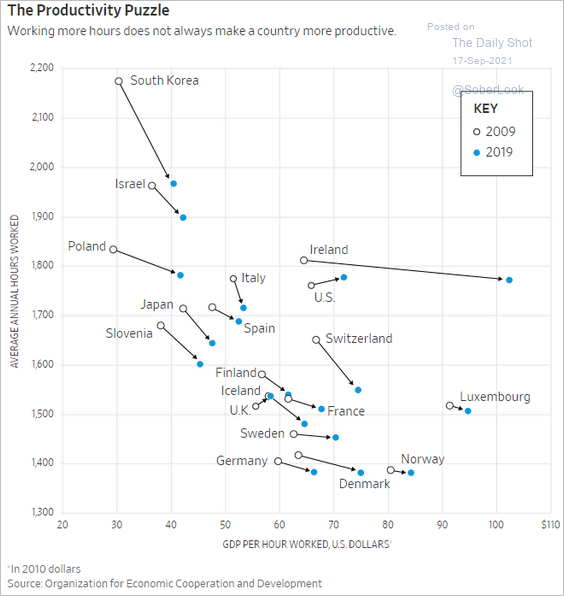 Source: @WSJ Read full article
7. Most desired aspects of a new job:
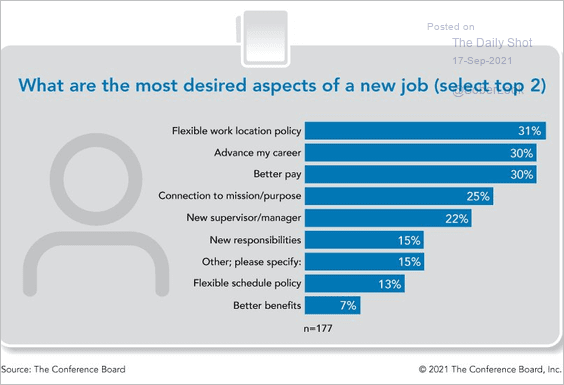 Source: @LizAnnSonders, @Conferenceboard
8. Where do you purchase your prescription drugs?
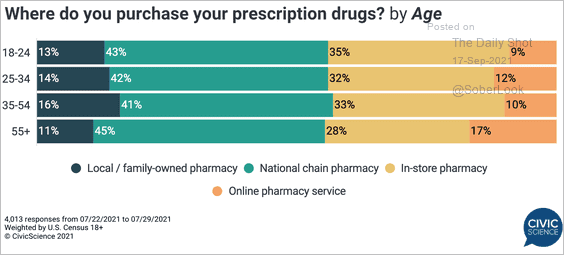 Source: @CivicScience
9. US mall visits compared to 2019:
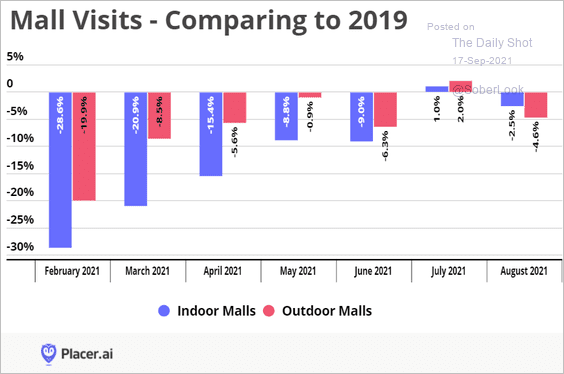 Source: Placer.ai
10. Cocaine prices by country:
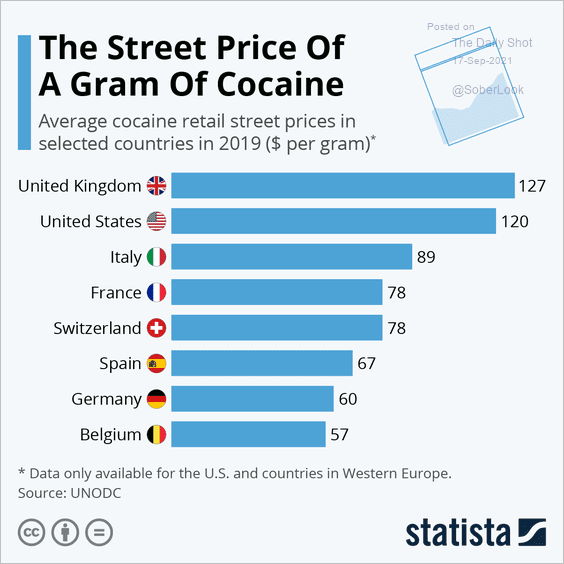 Source: Statista
——————–
Have a great weekend!
Back to Index