
The Daily Shot: 17-Dec-21
• The United States
• The United Kingdom
• The Eurozone
• Europe
• China
• Emerging Markets
• Cryptocurrency
• Commodities
• Energy
• Equities
• Global Developments
• Food for Thought
The United States
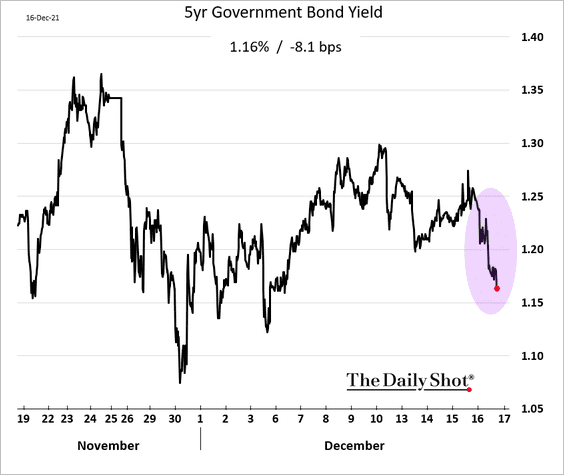
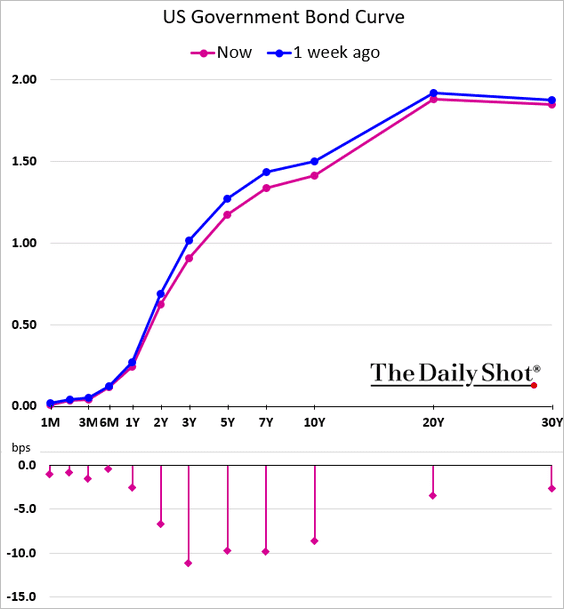
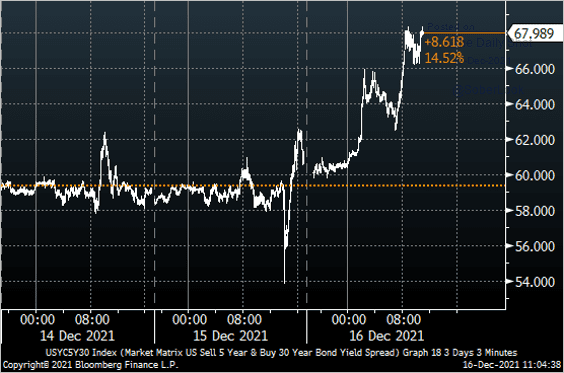
1. The market is still doubting the FOMC’s dot plot. Shorter and intermediate-maturity Treasury yields declined and the curve steepened.
Here is the 30yr – 5yr Treasury spread.
 Source: @Fullcarry
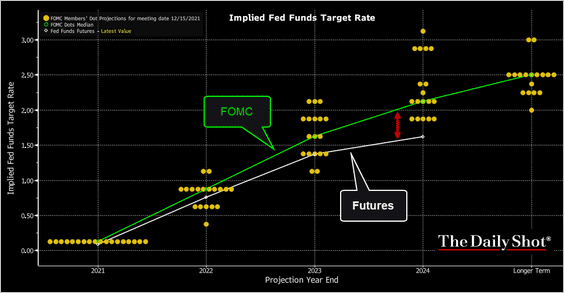
The rate trajectory implied by the fed funds futures shifted further below the FOMC’s forecasts.
 Source: @TheTerminal, Bloomberg Finance L.P.
——————–
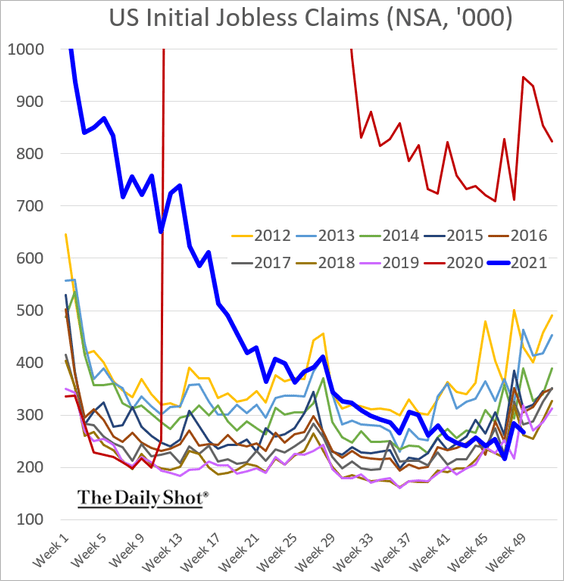
2. Initial jobless claims dipped below the 2019 levels, pointing to further declines in the unemployment rate.
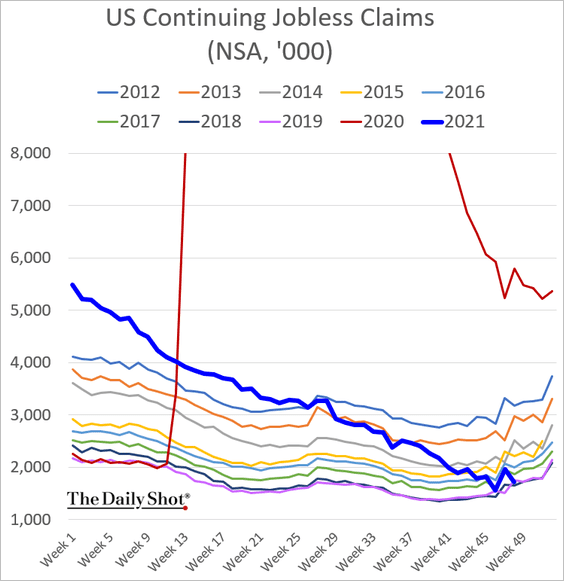
Continuing claims are near the lows as well.
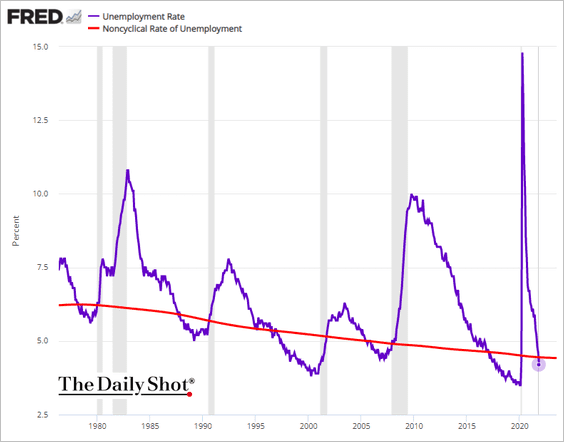
By the way, the unemployment rate dropped below NAIRU (Natural Unemployment) in November.
——————–
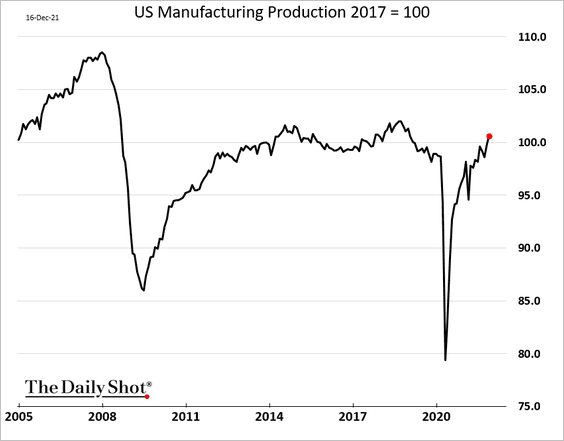
3. Industrial production was a touch below forecasts in November, although manufacturing output was in line with consensus (2nd panel).
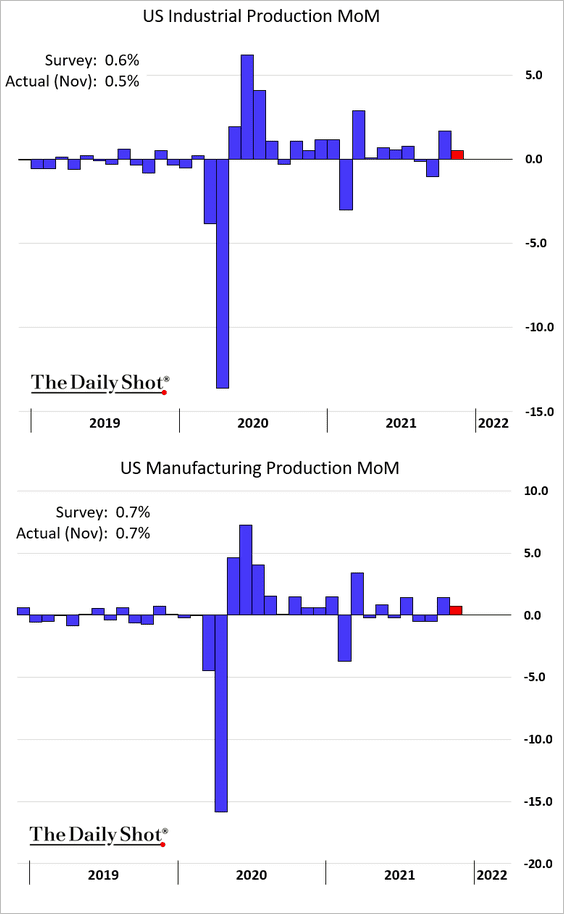
• Here is the manufacturing production index.
• Vehicle production increased for the second month.
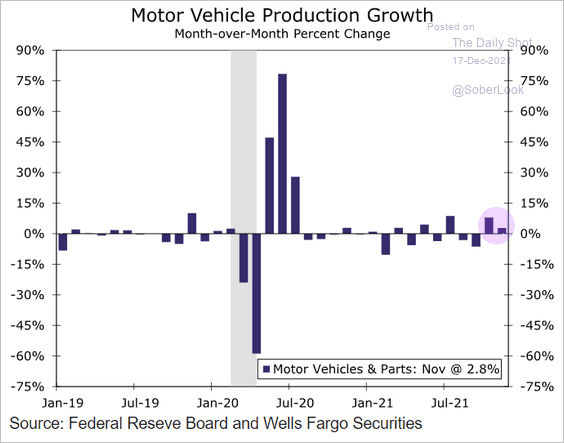 Source: Wells Fargo Securities
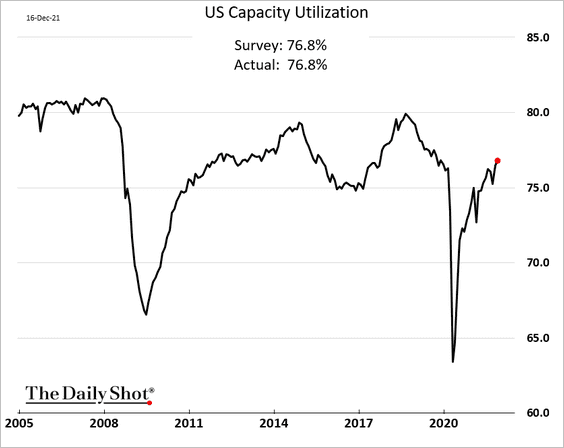
• Capacity utilization continues to climb.
——————–
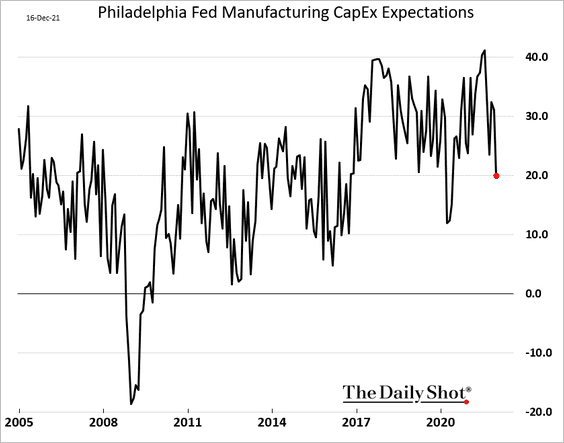
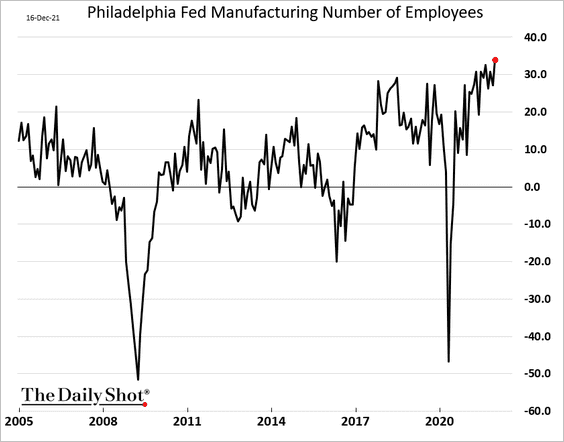
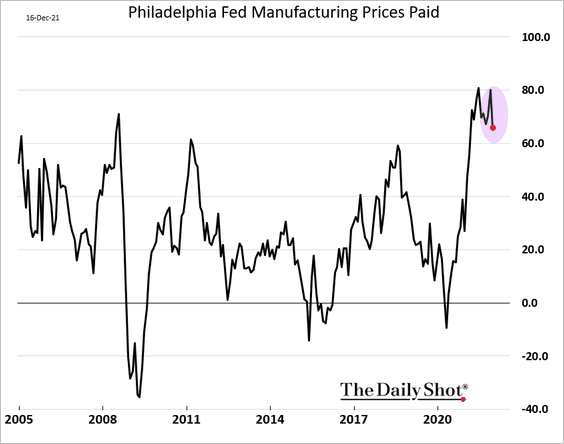
4. Unlike the data we saw from the NY Fed, the December Philly Fed’s manufacturing report was disappointing.
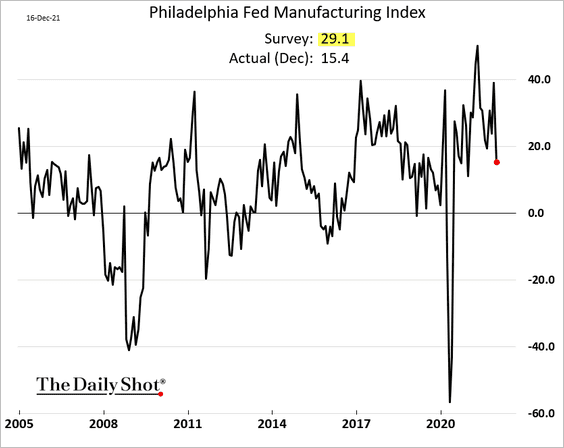
• CapEx expectations eased.
• But hiring accelerated further.
• The price index appears to have peaked.
——————–
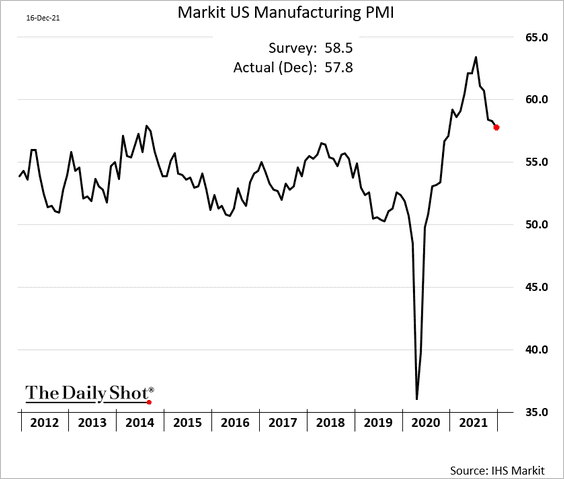
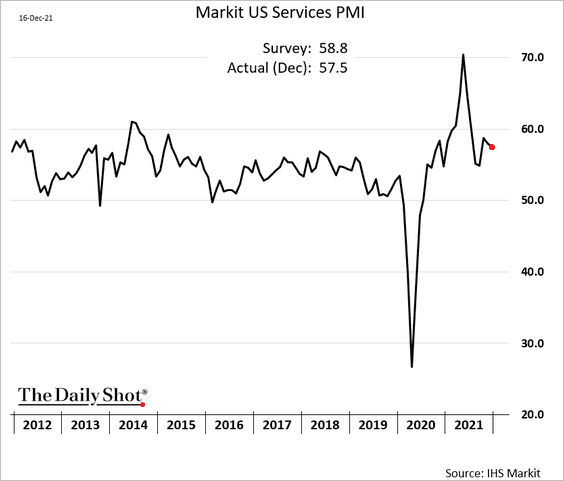
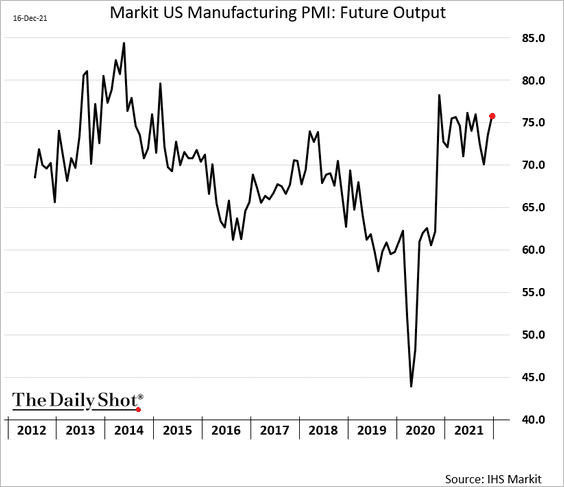
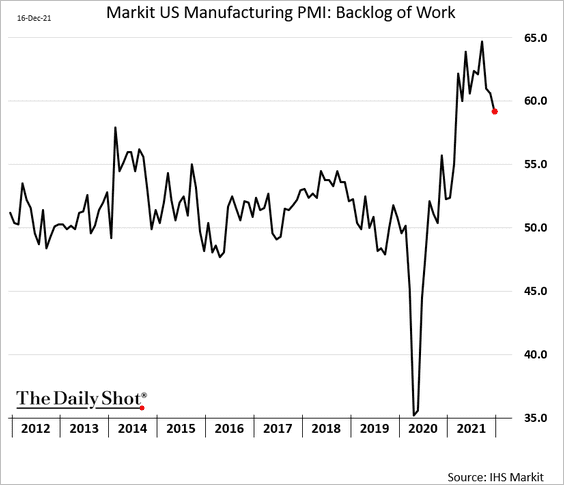
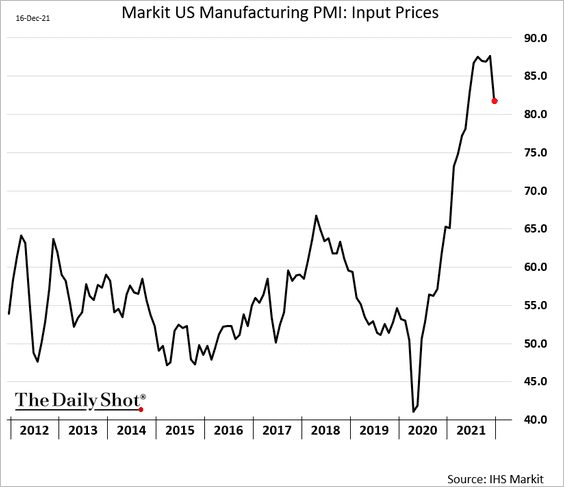
5. At the national level, the December flash Markit PMI report was also softer than expected.
– Manufacturing:
– Services:
• Manufacturers remain upbeat about the future.
• Manufacturing supply strains are starting to ease.
– Backlog of work:
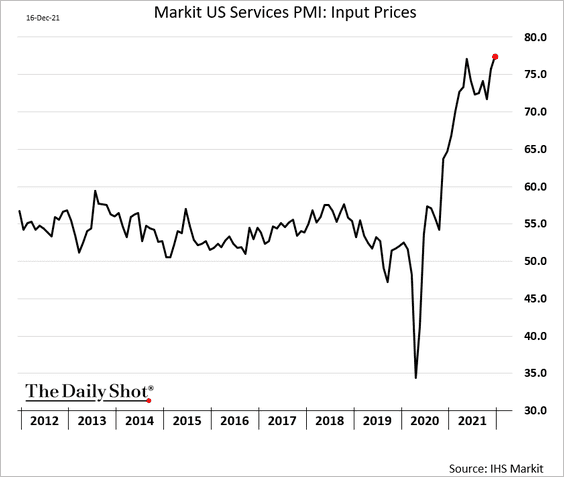
– Input prices:
• On the other hand, the service-sector input price index hit a new high.
——————–
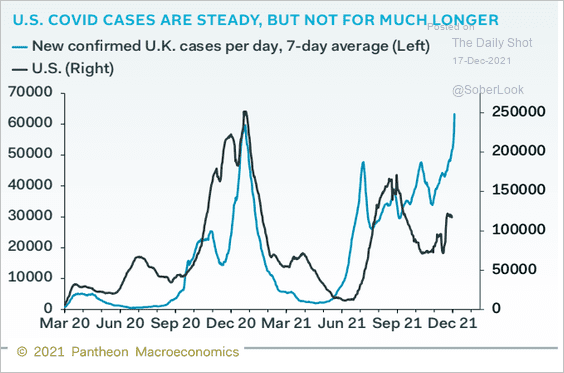
6. The recent surge in UK COVID cases points to risks for the US this winter.
 Source: Pantheon Macroeconomics
Back to Index
The United Kingdom
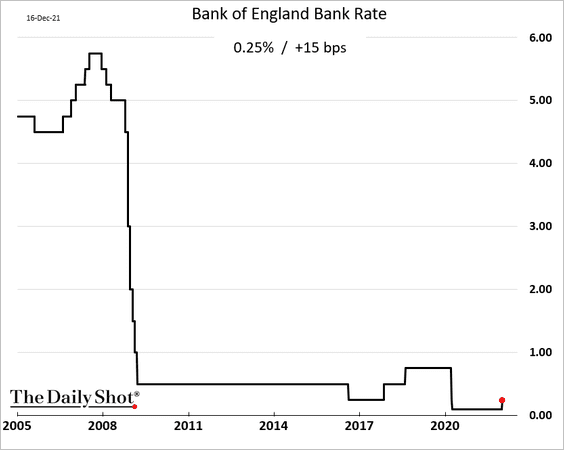
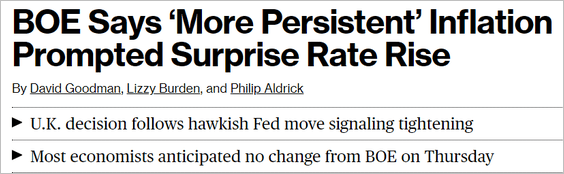
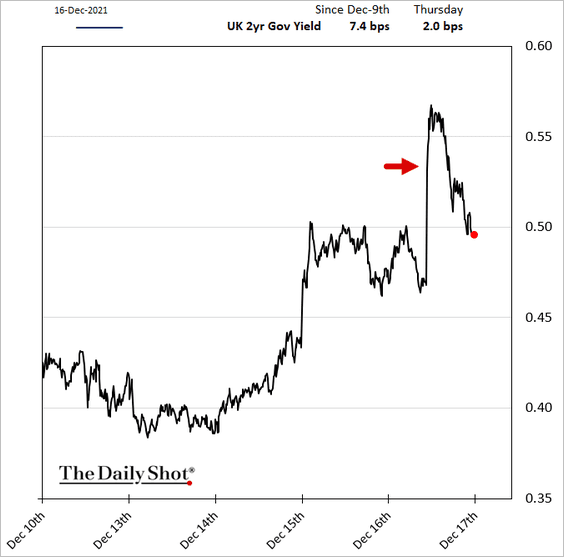
1. The BoE unexpectedly hiked rates by 15 bps as inflation accelerates. The market expected the central bank to be on hold.
 Source: Bloomberg Read full article
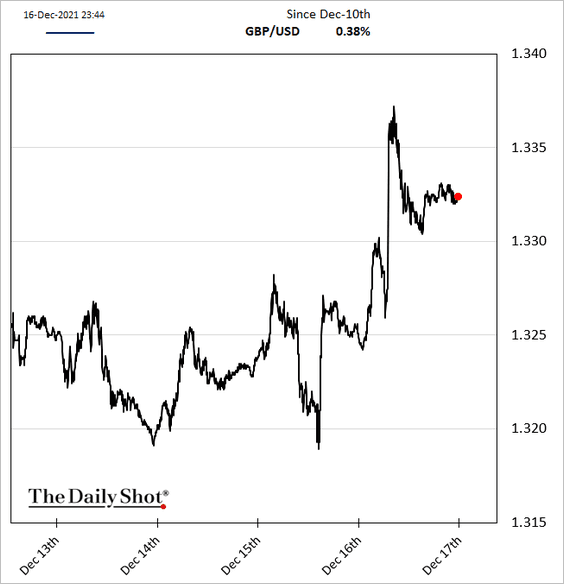
Just like in the US after the Fed’s hawkish tilt, short-term yields surged but retreated shortly after.
Here is the pound vs USD.
——————–
2. The December manufacturing PMI was in line with expectations, indicating that factory activity remains robust.
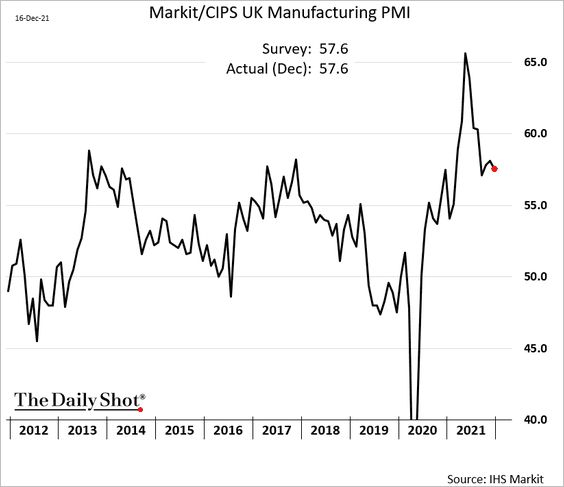
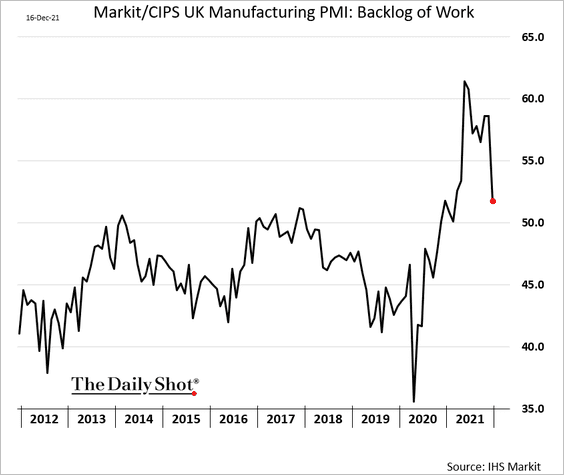
The manufacturing backlog is easing.
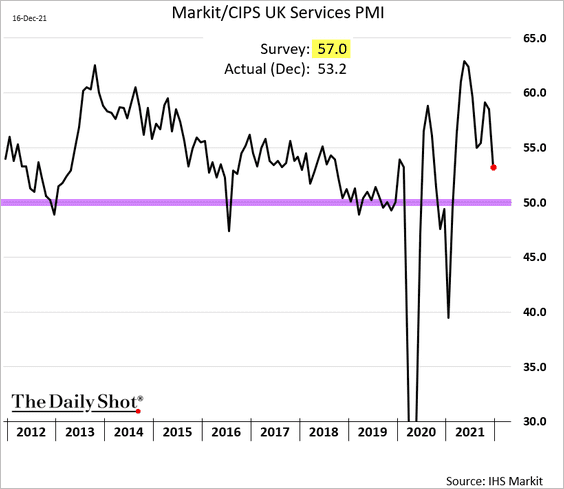
On the other hand, service-sector PMI declined sharply as the pandemic takes a toll. While growth slowed, it remains in positive territory.
——————–
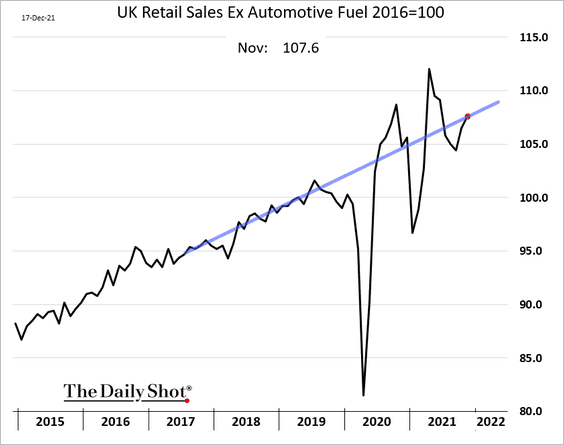
3. Retail sales improved in November and are back on the pre-COVID trend.
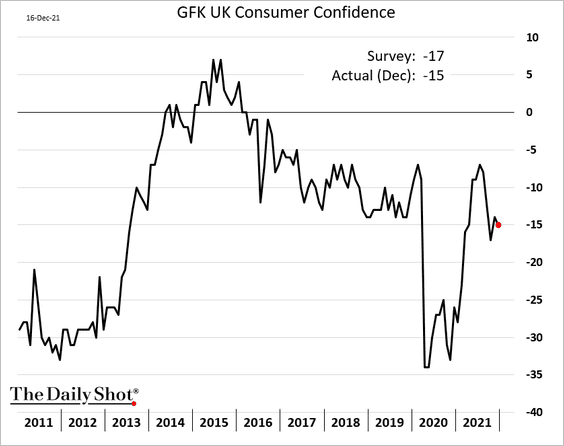
4. Consumer confidence is holding up.
5. Are COVID cases about to accelerate?
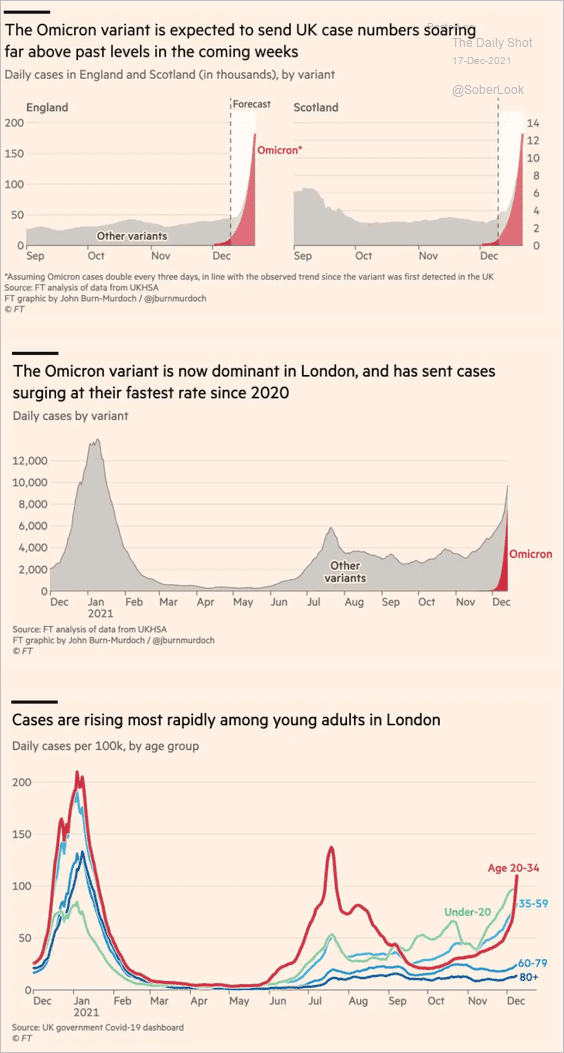 Source: @financialtimes Read full article
Back to Index
The Eurozone
1. The ECB adjusted its QE program to make the taper from the emergency program smoother. Here is a forecast for QE going forward from Nordea.
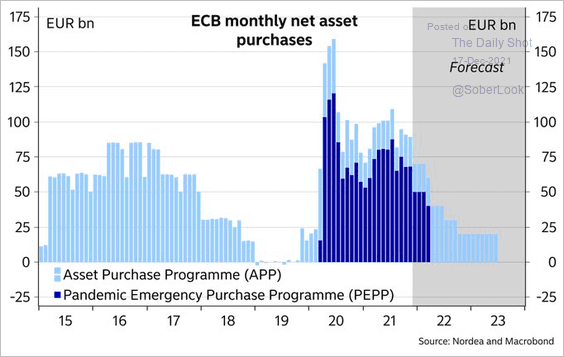 Source: @JanVonGerich
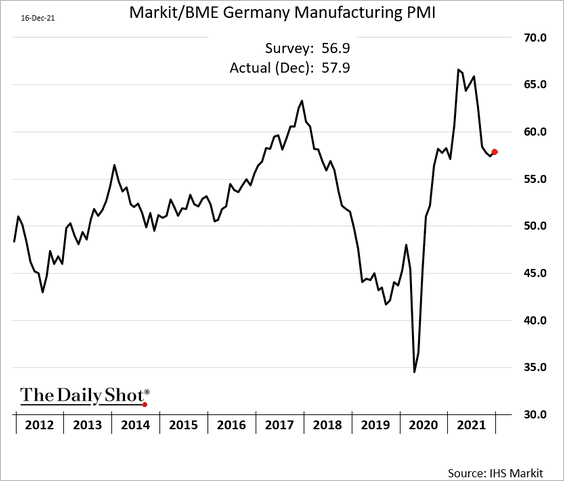
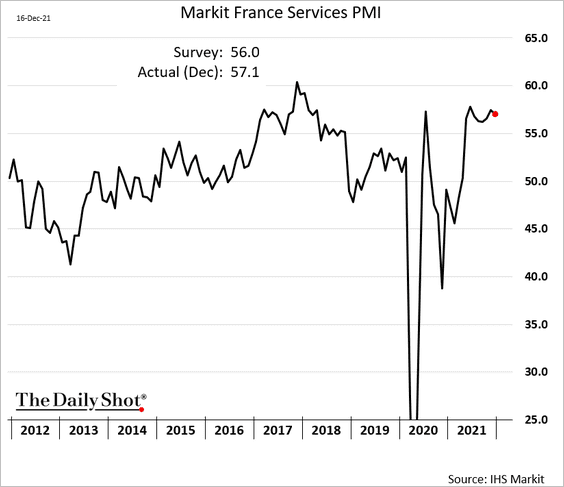
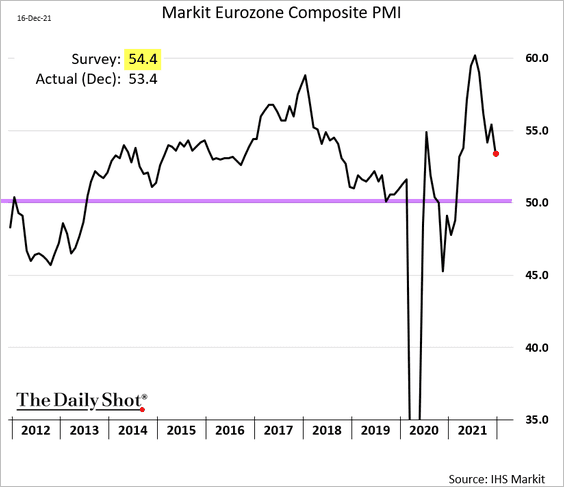
2. The December PMI report was a bit softer than expected.
• Manufacturing:
– France:
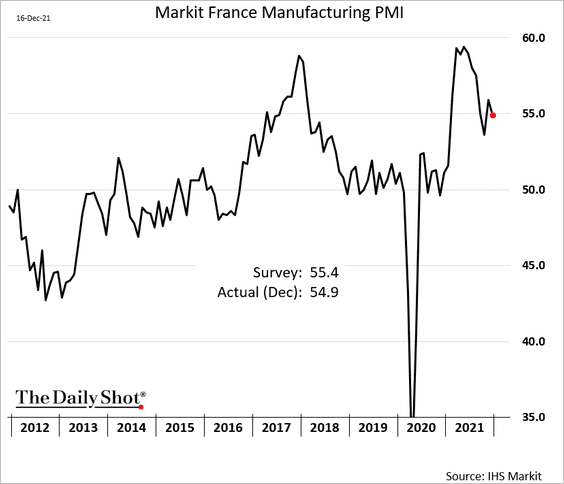
– Germany (a slight rebound):
• Services:
– France:
– Germany (in contraction territory):
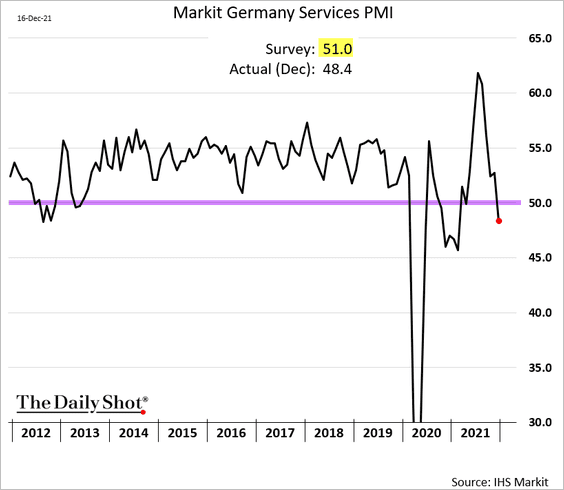
• Here is the composite PMI.
——————–
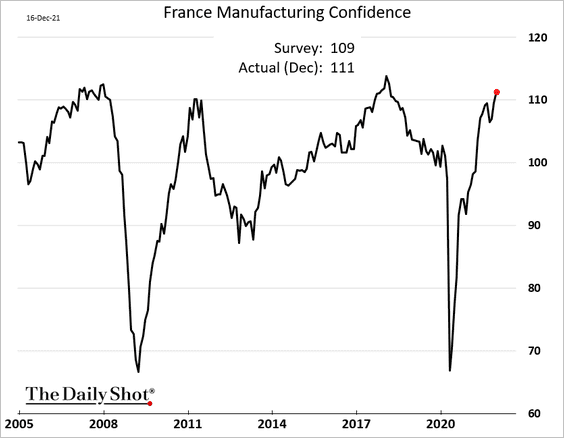
3. French manufacturing confidence continues to surge, topping forecasts.
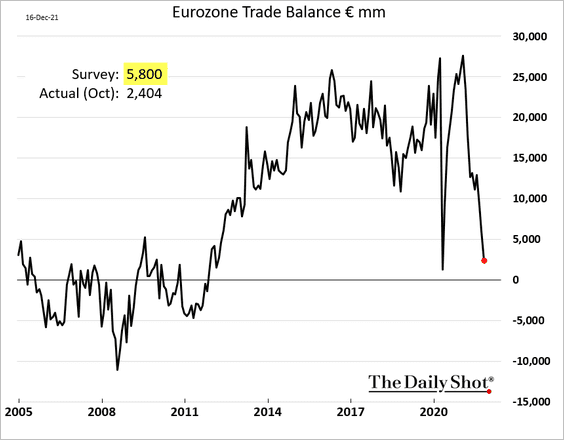
4. The Eurozone trade surplus is melting away, surprising to the downside (partially due to weak demand from China and lower vehicle sales).
Back to Index
Europe
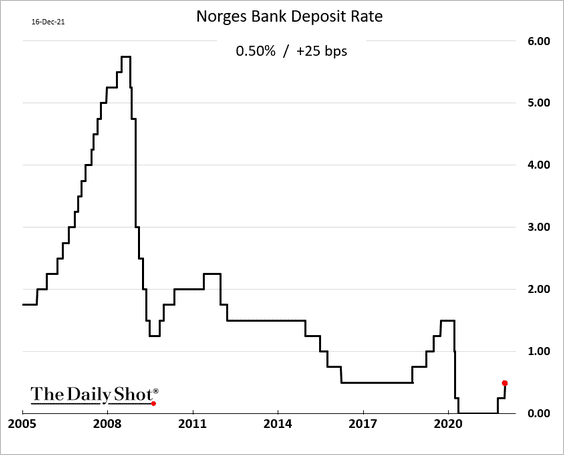
1. Norway’s central bank hiked rates again.
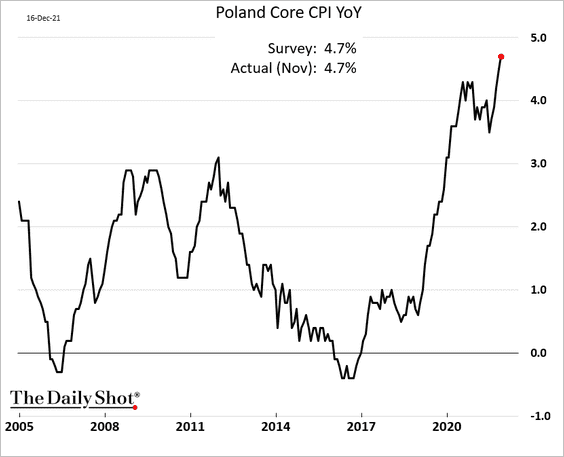
2. Poland’s inflation continues to climb.
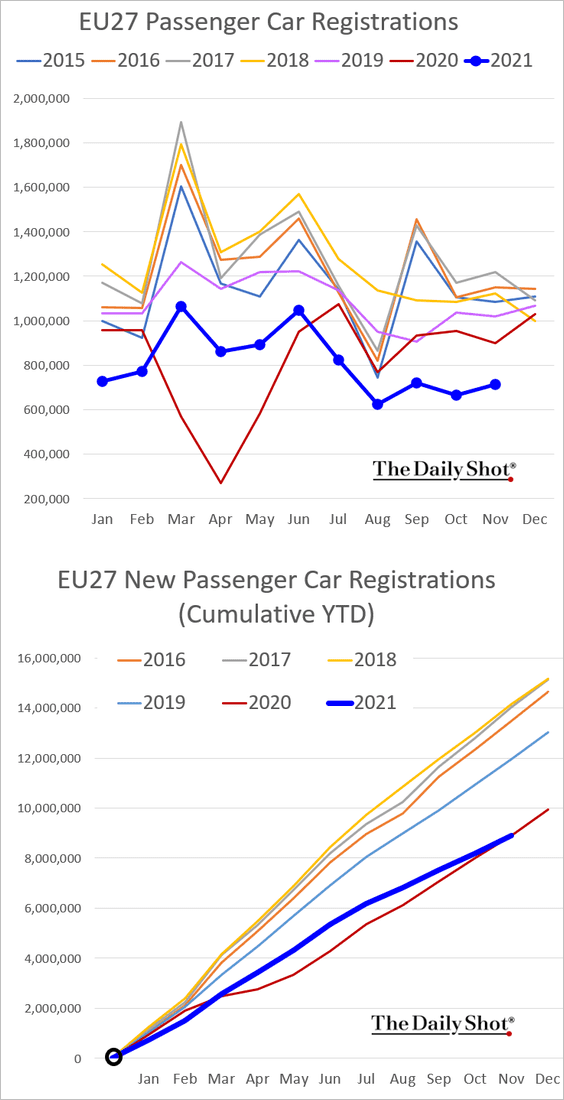
3. EU car registrations remain soft.
Back to Index
China
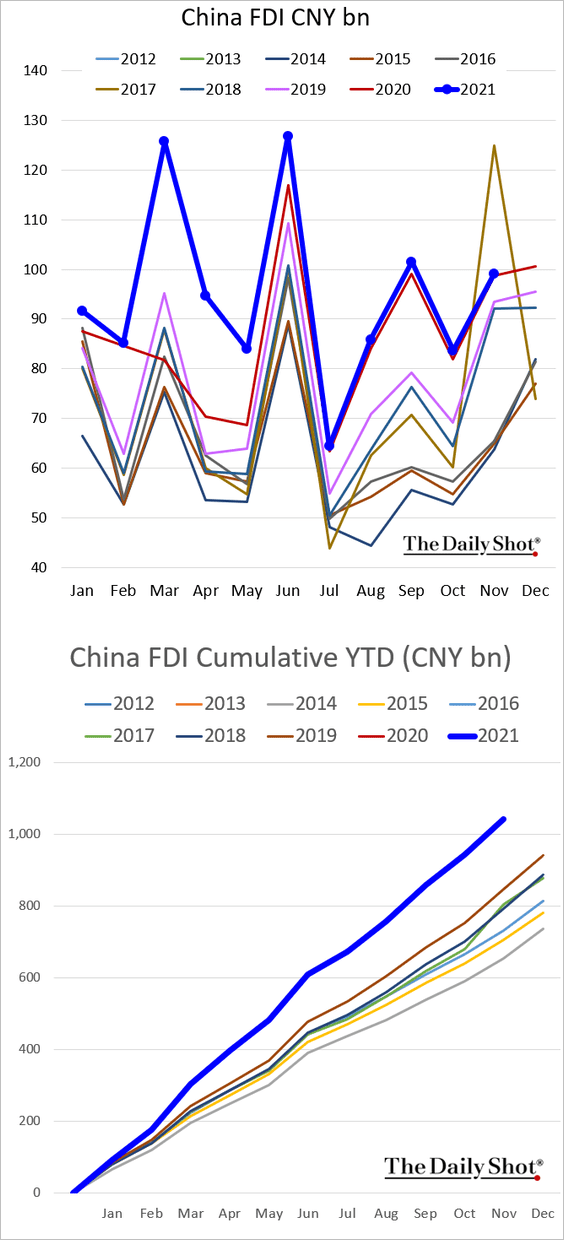
1. Foreign direct investment is running in line with last year’s levels, but on a year-to-date basis, FDI is at record highs.
2. Fixed-asset investment has been soft. Will we see a rebound?
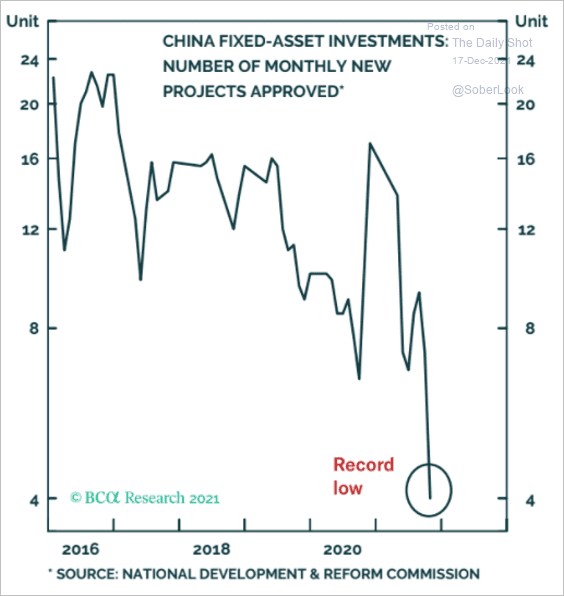 Source: BCA Research
Here is China’s cement production.
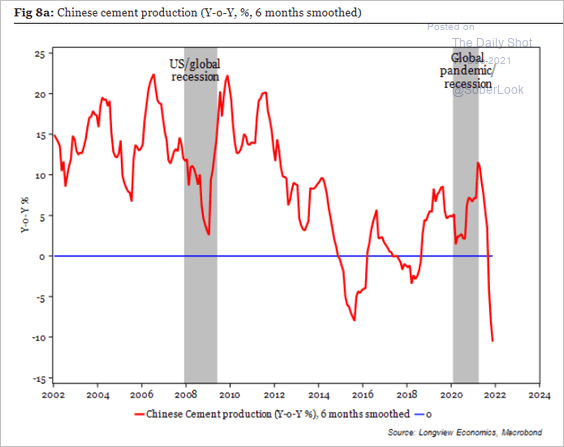 Source: Longview Economics
——————–
3. Property-related indicators appear to have stabilized.
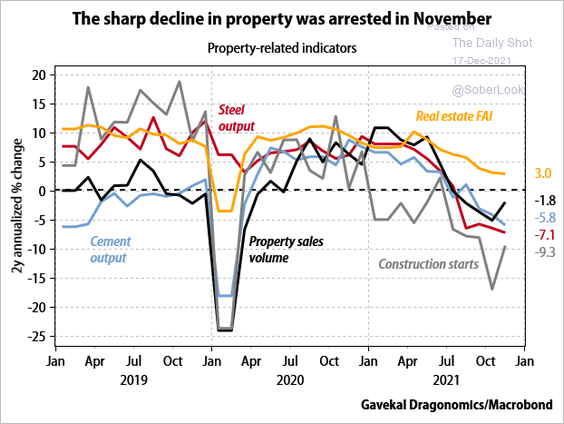 Source: Gavekal Research
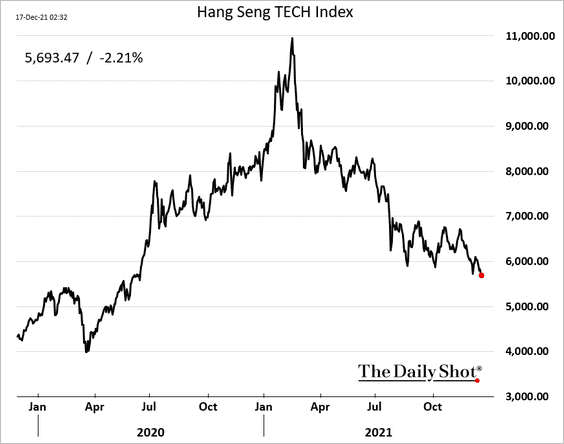
4. Tech stocks remain under pressure in Hong Kong.
Back to Index
Emerging Markets
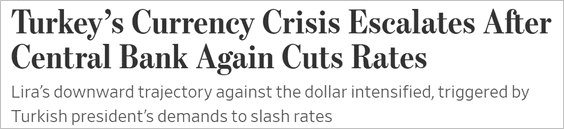
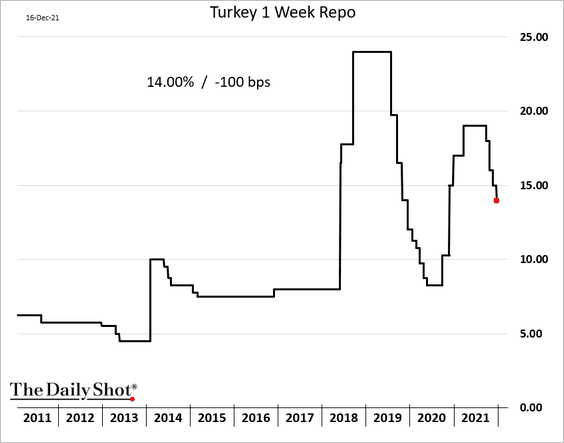
1. The Turkish central bank cut rates again, sending the lira past 16 to the dollar. Is the easing cycle over?
 Source: @WSJ Read full article
——————–
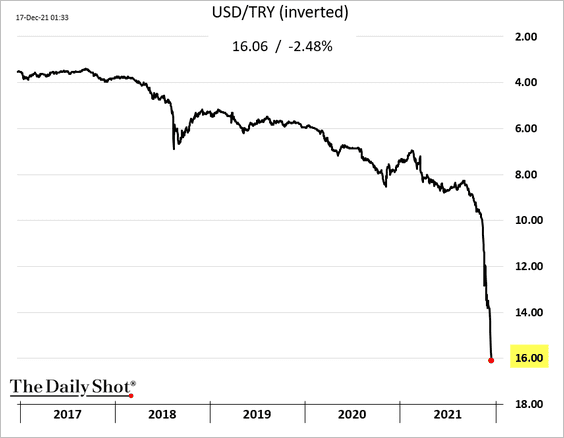
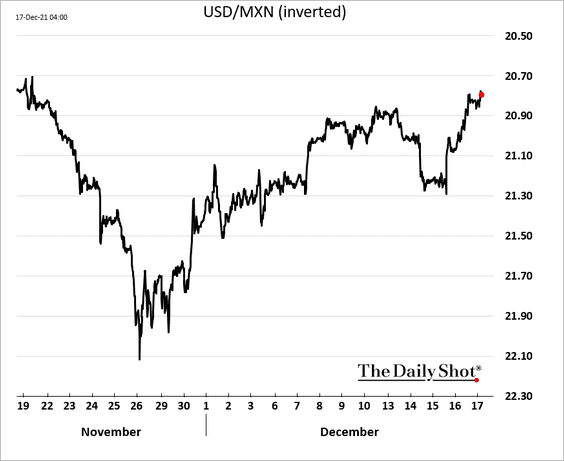
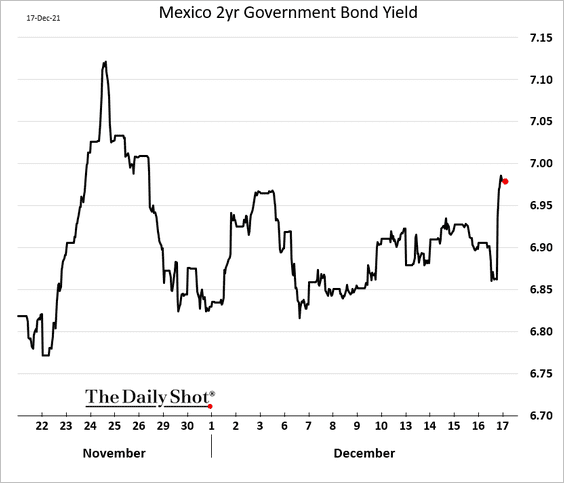
2. Banxico surprised the market with a 50 bps hike. The market expected 25 bps.
The peso strengthened further and yields climbed.
——————–
3. EM currencies appear deeply undervalued.
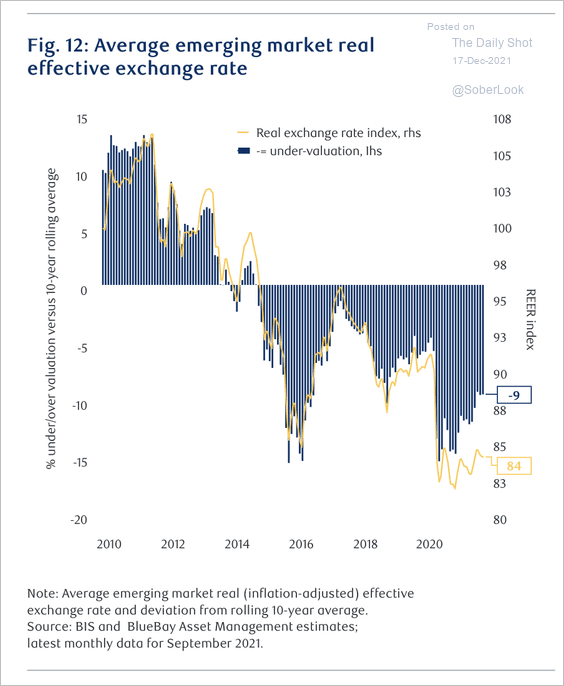 Source: RBC; BlueBay Asset Management
But they could weaken further, according to Numera Analytics.
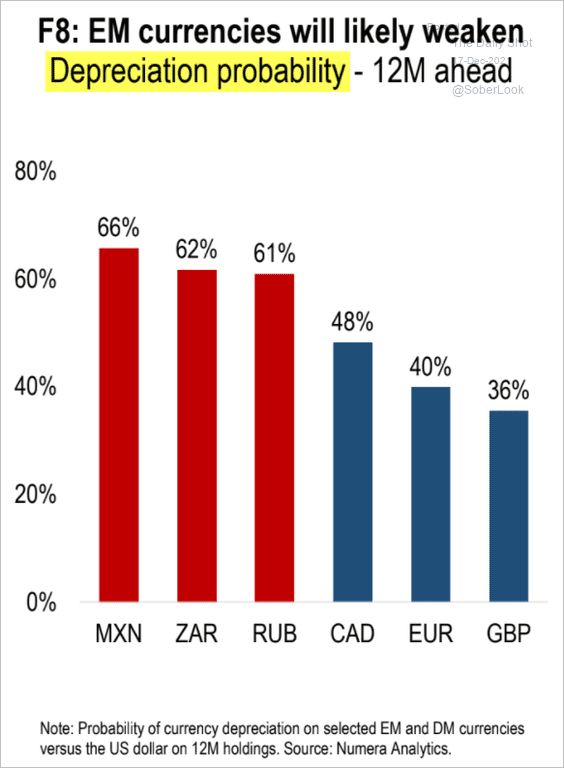 Source: Numera Analytics
Back to Index
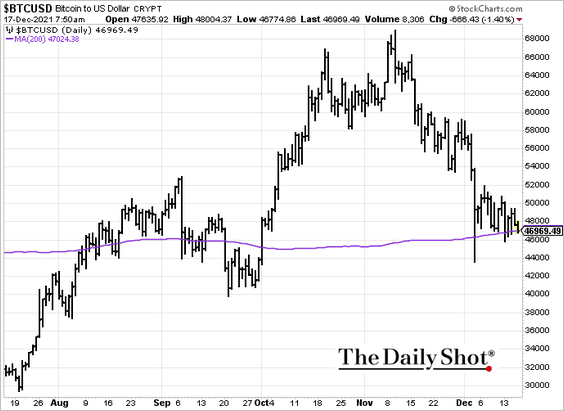
Cryptocurrency
Bitcoin is once again testing support at the 200-day moving average. It could get ugly.
Back to Index
Commodities
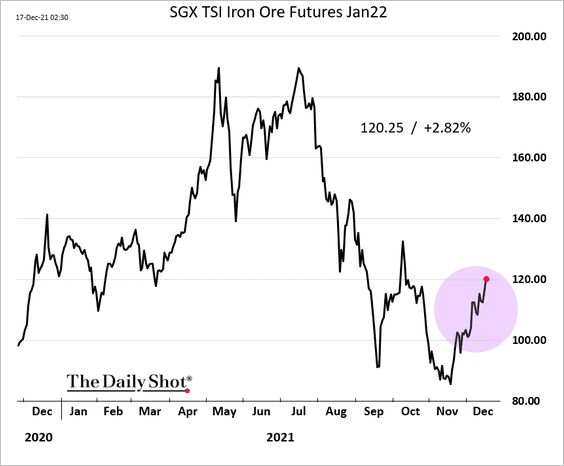
1. Iron ore is rebounding.
2. Energy, base and battery metals have significantly outperformed the commodity complex so far this year.
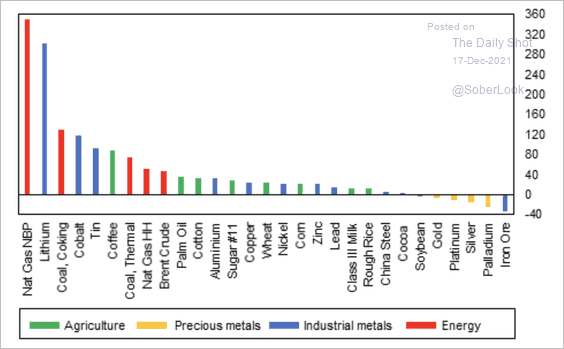 Source: Fitch Solutions Macro Research
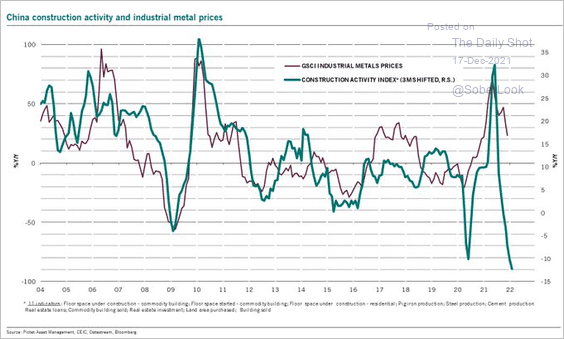
3. Soft construction activity in China doesn’t bode well for industrial metals.
 Source: @PkZweifel
Back to Index
Energy
1. European natural gas prices hit new highs on geopolitical worries and tight supplies.
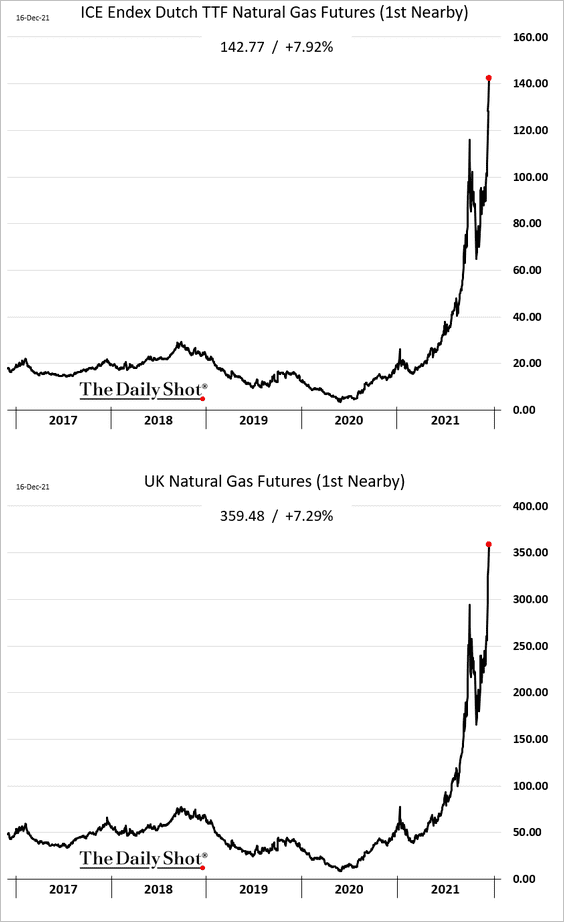
.
 Source: CNBC Read full article
• The gas curve is in deep backwardation.
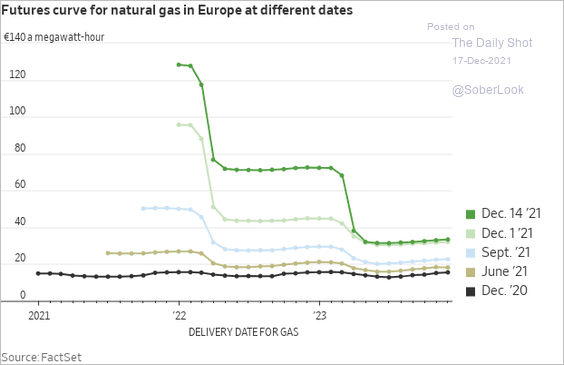 Source: @WSJ Read full article
• Power prices continue to surge.
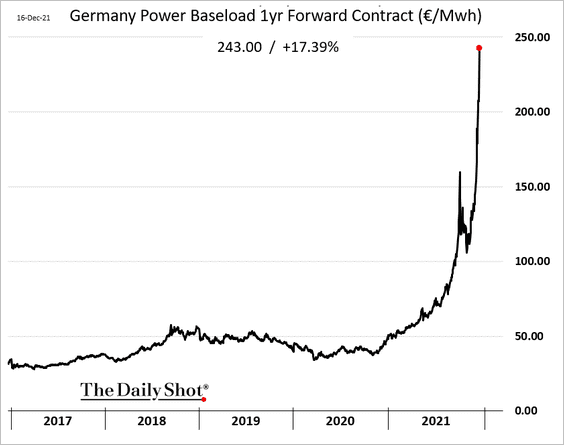
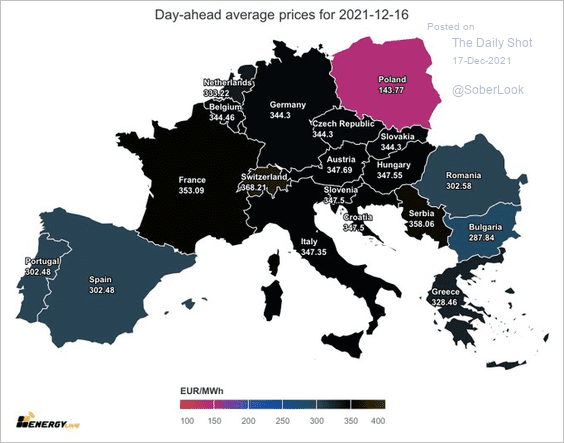 Source: @JavierBlas
——————–
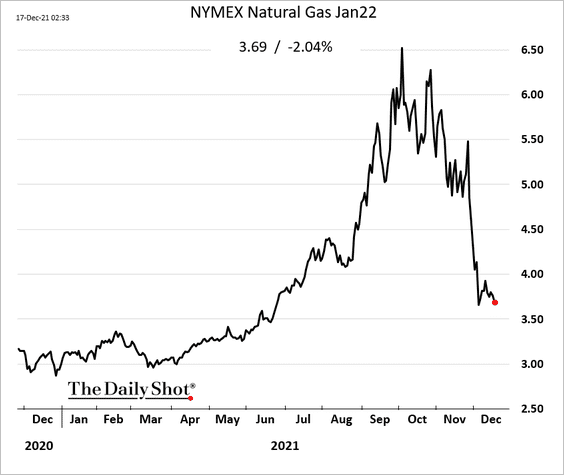
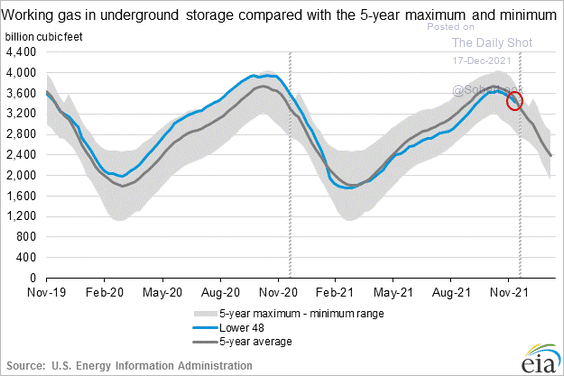
2. On the other hand, US natural gas prices keep trading lower amid mild weather and robust inventories.
——————–
3. Global oil rig counts remain low given the current price levels.
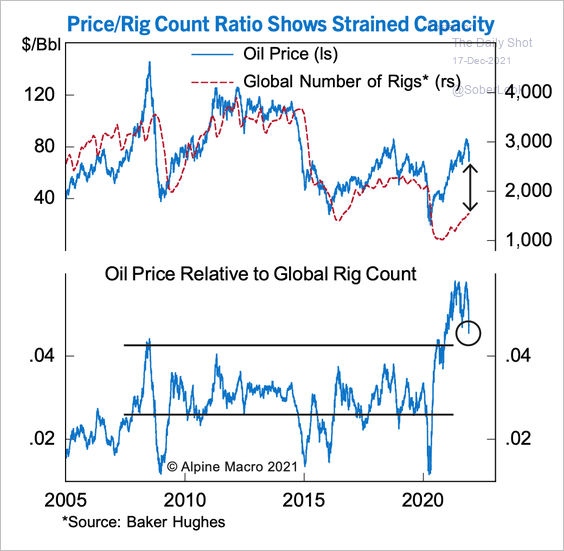 Source: Alpine Macro
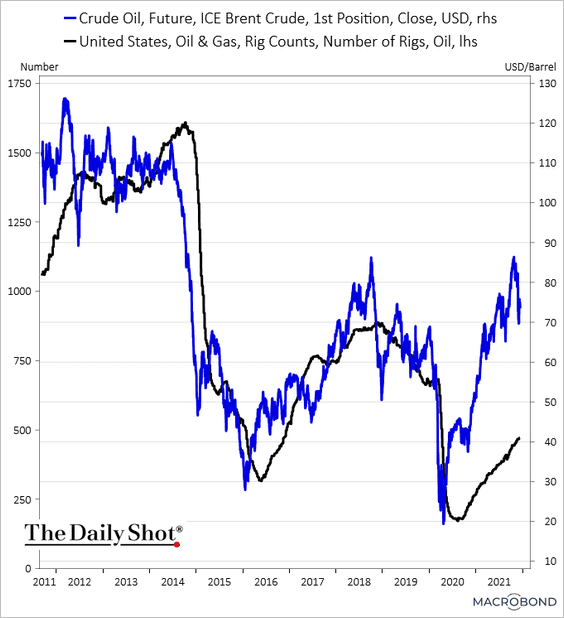 Source: Chart and data provided by Macrobond
Back to Index
Equities
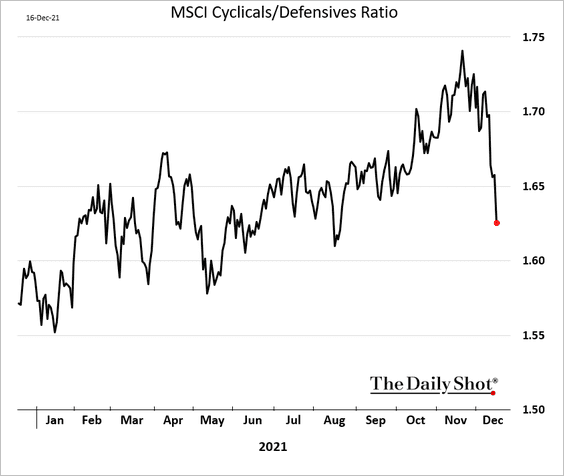
1. Investors have been rotating out of cyclical stocks into defensives.
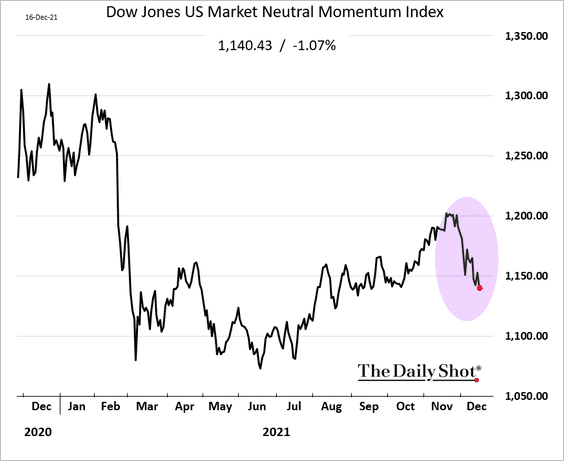
2. Momentum stocks are underperforming.
3. Speculative growth stocks continue to struggle, …
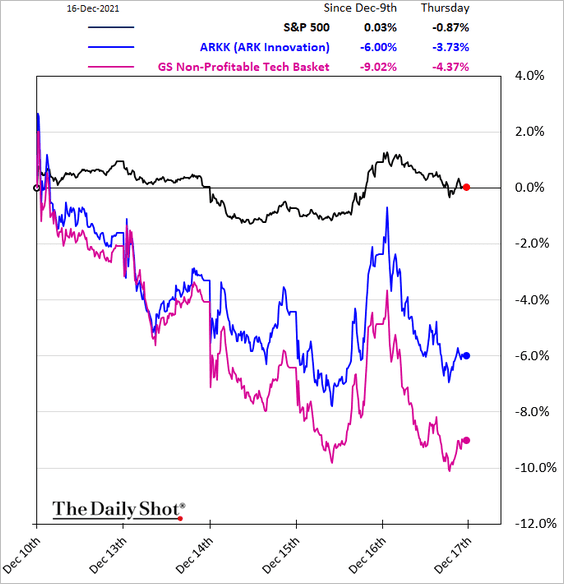
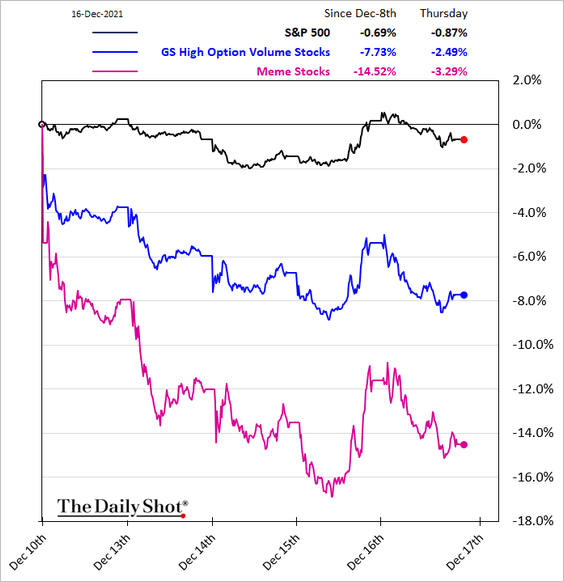
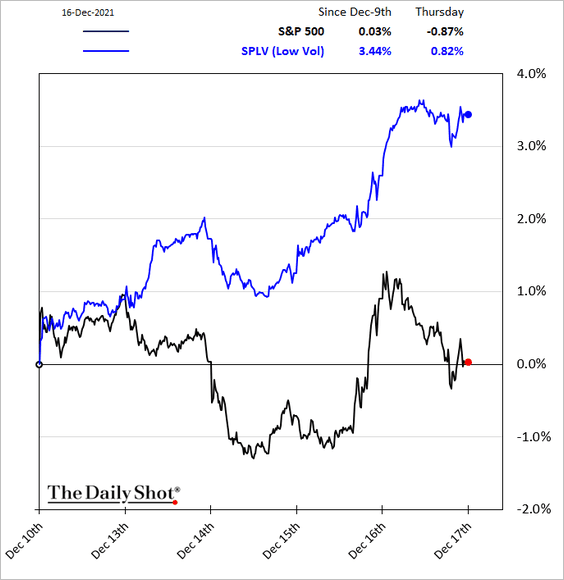
… as investors move into low-vol shares.
——————–
4. Next, we have some sector updates.
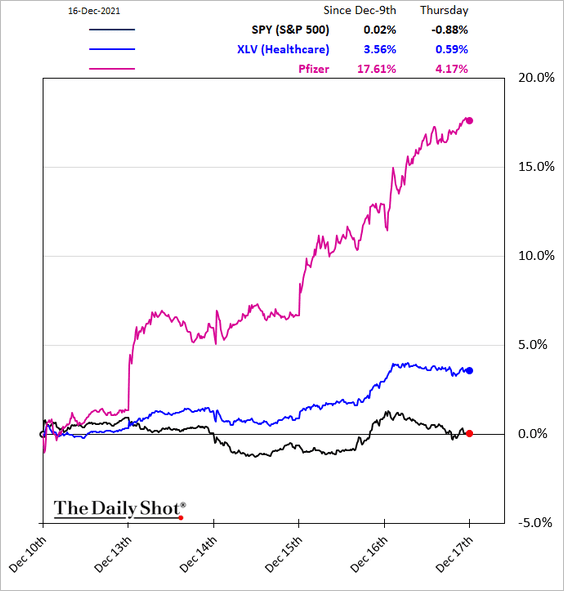
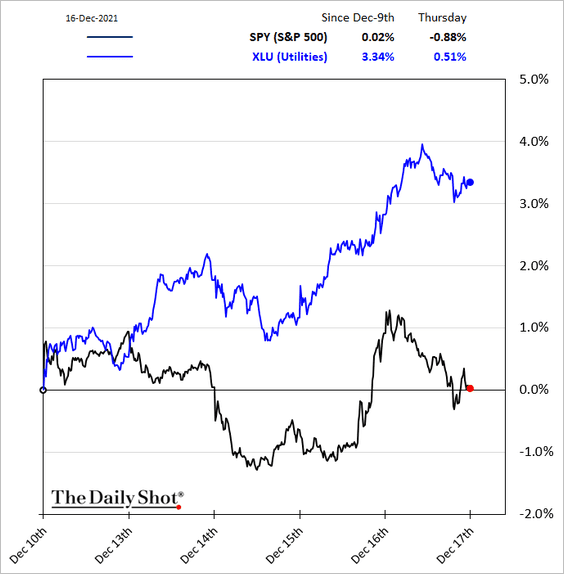
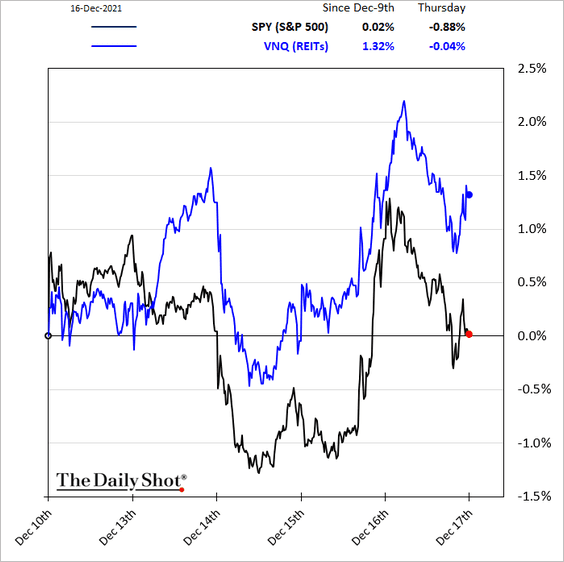
• Defensive shares outperformed in recent days.
– Healthcare:
– Utilities:
– REITs:
– Consumer staples (2 charts; AD = advance/decline line):
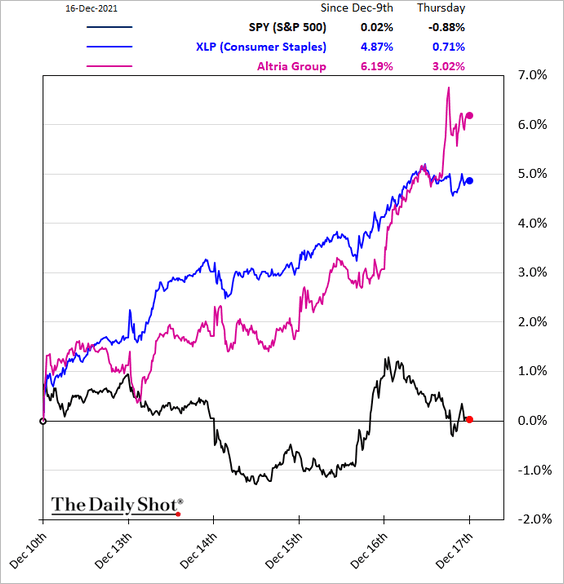
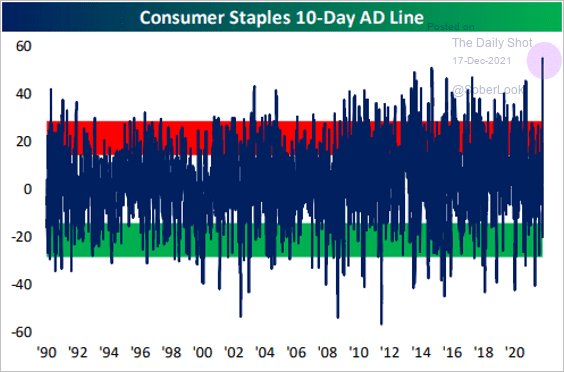 Source: @bespokeinvest Read full article
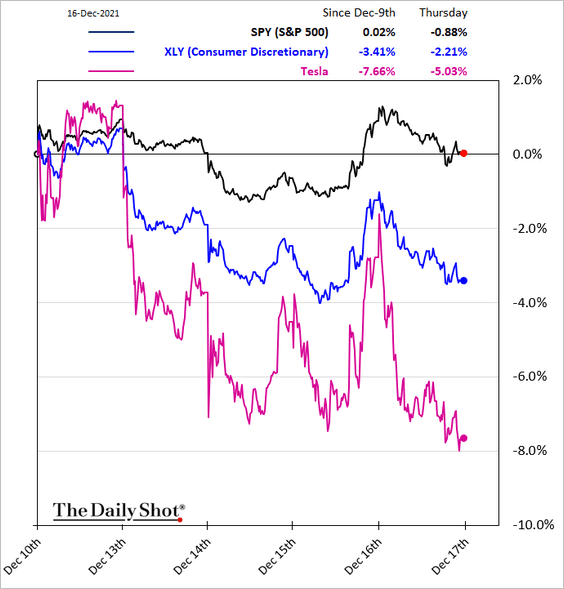
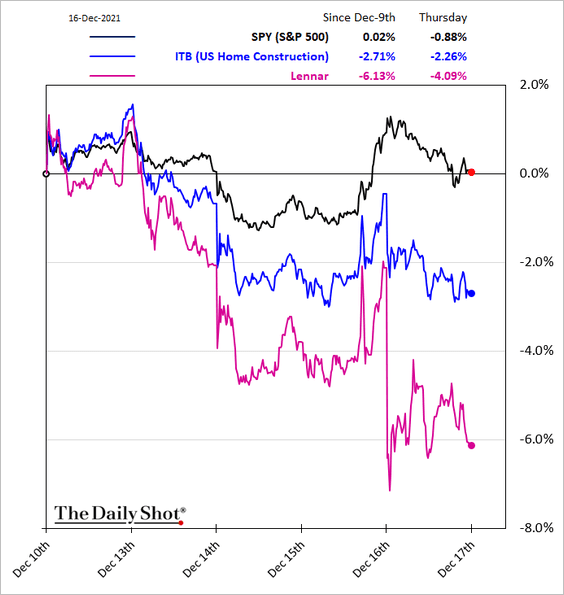
• Here are some of the underperforming sectors.
– Consumer discretionary:
– Housing:
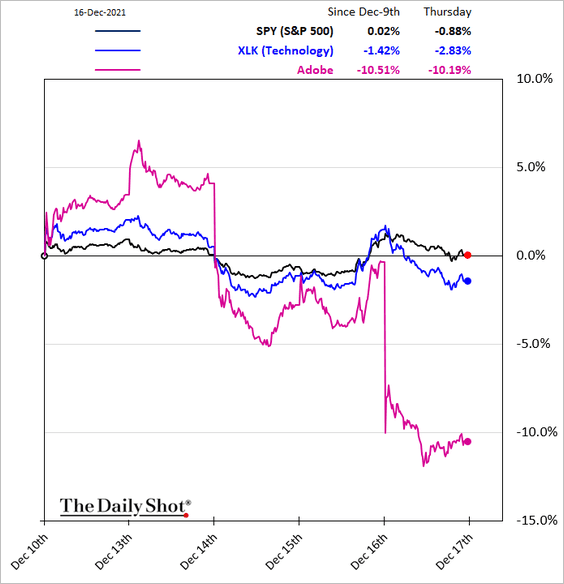
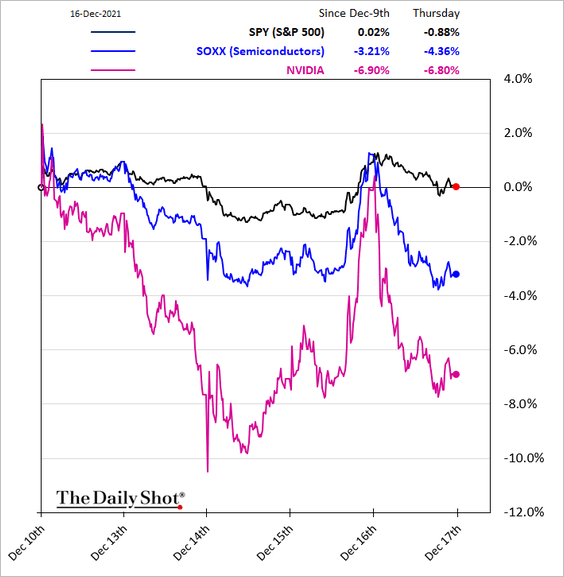
– Tech and semiconductors:
——————–
5. Will small and large-cap growth stocks underperform value going forward?
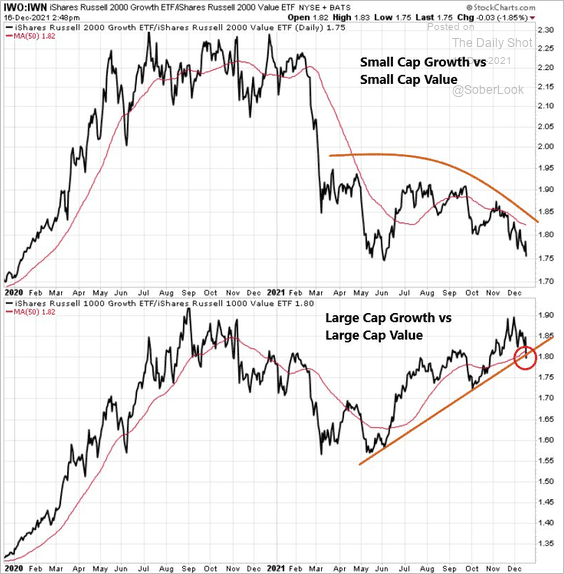 Source: @dlundgren3333
For now, the decline in real yields has supported higher growth stock valuations relative to value stocks.
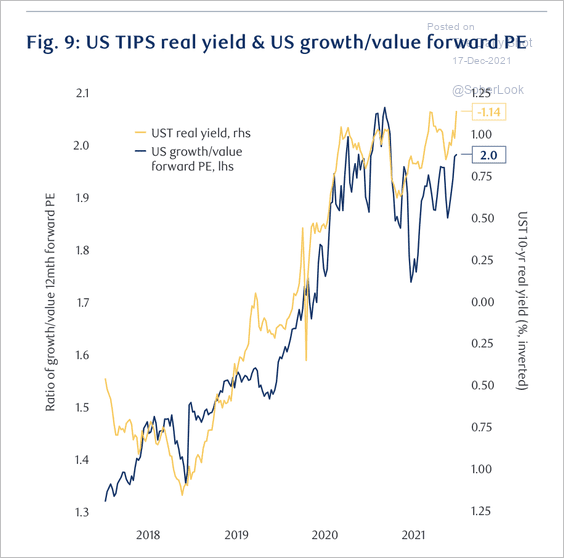 Source: RBC; BlueBay Asset Management
——————–
6. This chart shows the average performance of the S&P 500 index around hiking cycles. Markets tend to peak around 253 days (ca. 9 months) after the hike and then drift from there.
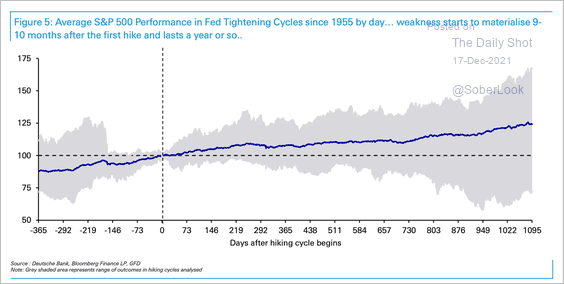 Source: Deutsche Bank Research
Back to Index
Global Developments
1. Risk assets saw substantial outflows recently.
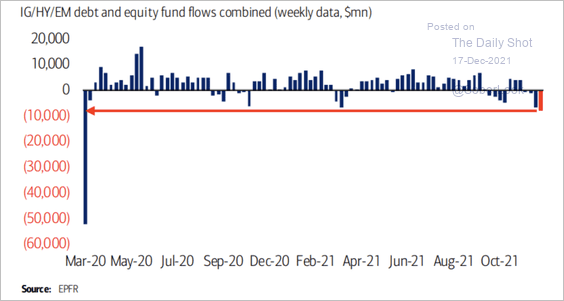 Source: III Capital Management
2. Risk-taking has been supported by extraordinarily accommodative monetary conditions.
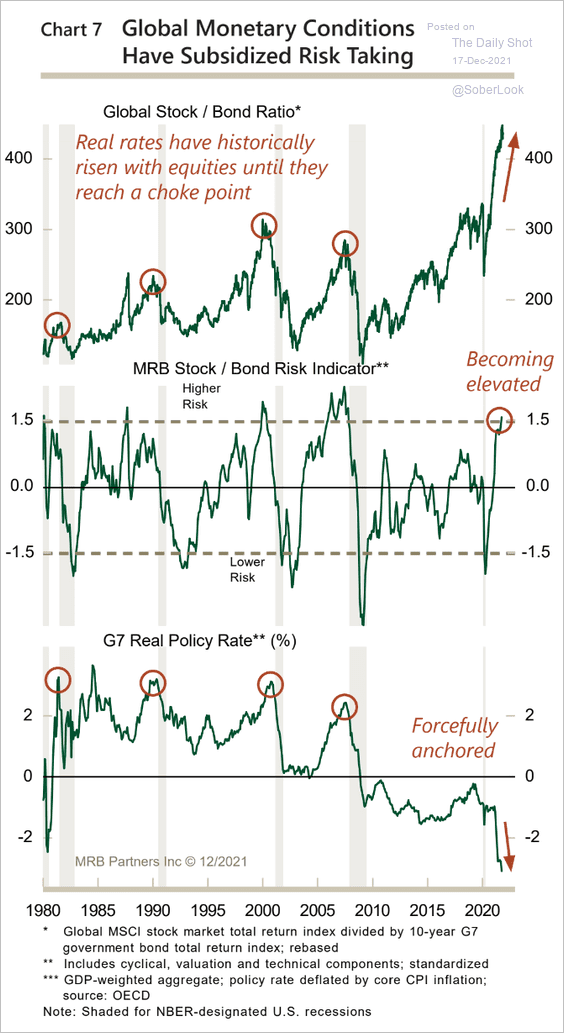 Source: MRB Partners
3. Property sector returns are forecast to struggle under an inflationary scenario.
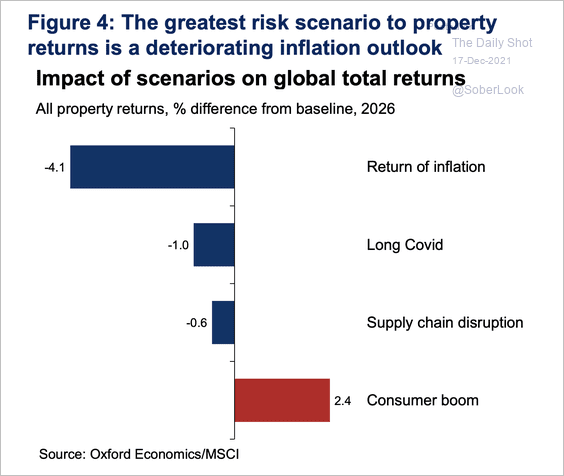 Source: Oxford Economics
——————–
Food for Thought
1. US healthcare spending (as % of GDP):
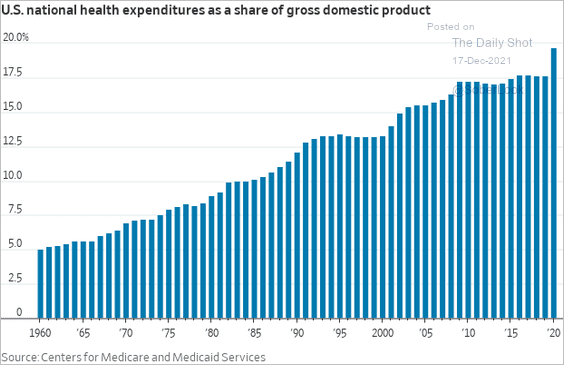 Source: @WSJ Read full article
2. HIV infections worldwide:
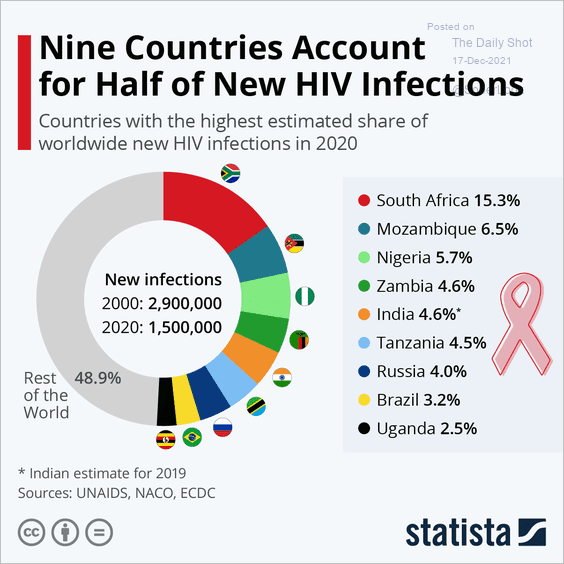 Source: Statista
3. Global robot stock:
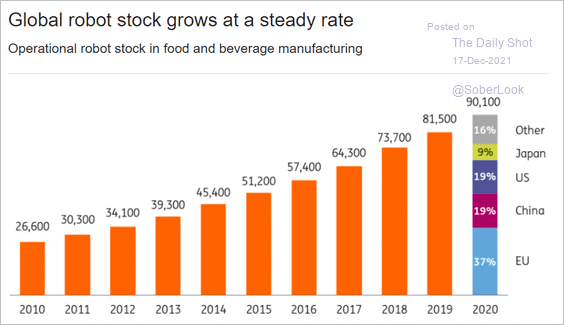 Source: ING
4. How Spotify makes its money:
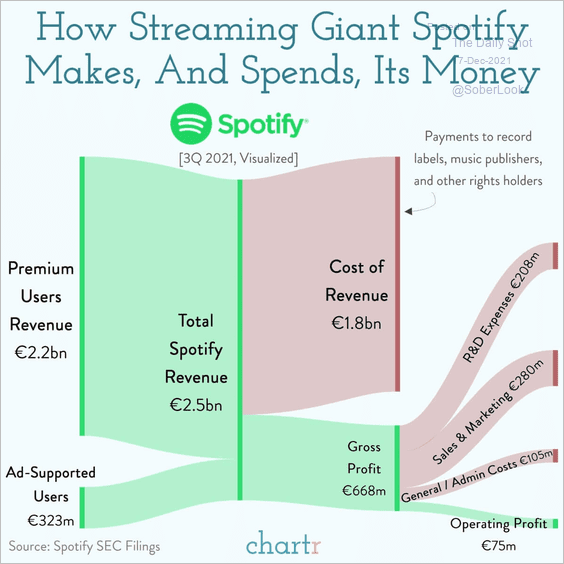 Source: @chartrdaily
5. Production costs of cultivated meat:
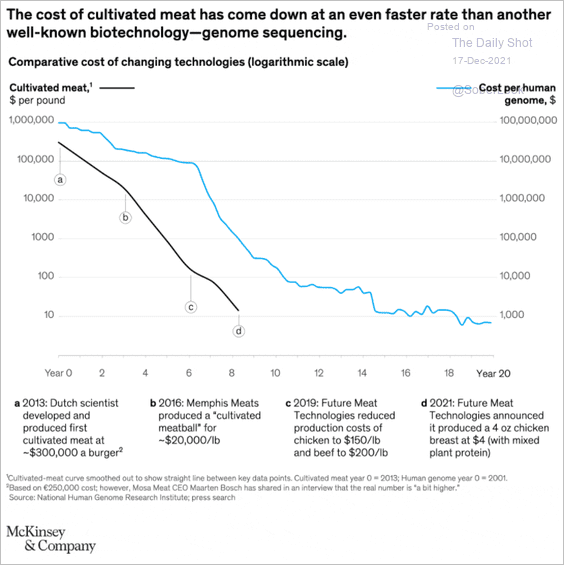 Source: McKinsey Read full article
6. Reasons for quitting a job:
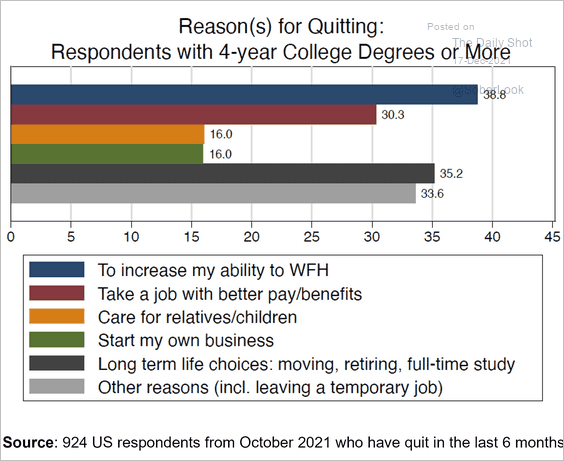 Source: @I_Am_NickBloom
7. The backlog in US immigration courts:
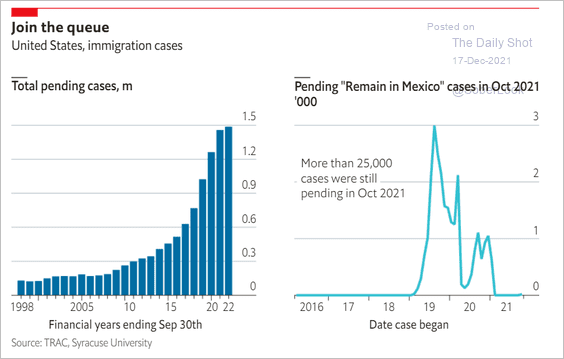 Source: The Economist Read full article
8. Growth in advanced air mobility:
 Source: McKinsey Read full article
——————–
Have a great weekend!
Back to Index