
The Daily Shot: 22-Jun-22
• The United States
• Canada
• The United Kingdom
• The Eurozone
• Asia – Pacific
• China
• Emerging Markets
• Cryptocurrency
• Commodities
• Energy
• Equities
• Credit
• Global Developments
• Food for Thought
The United States
1. Let’s begin with the housing market.
• Existing home sales were in line with forecasts, dipping to 2015 levels.
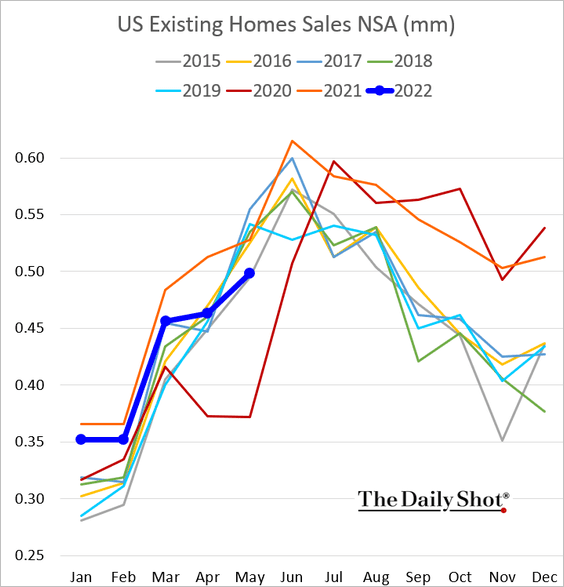
Sales are down almost 9% from a year ago.
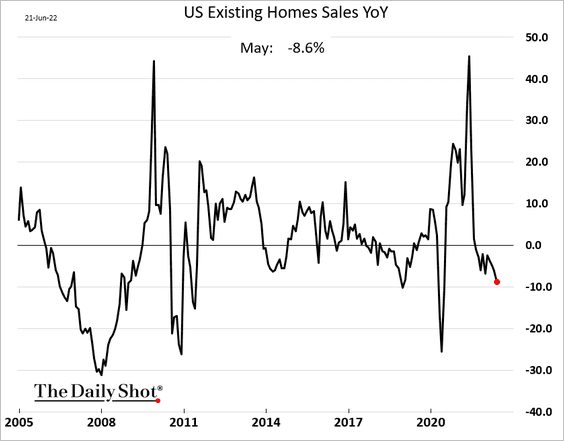
And there is more pain on the way.
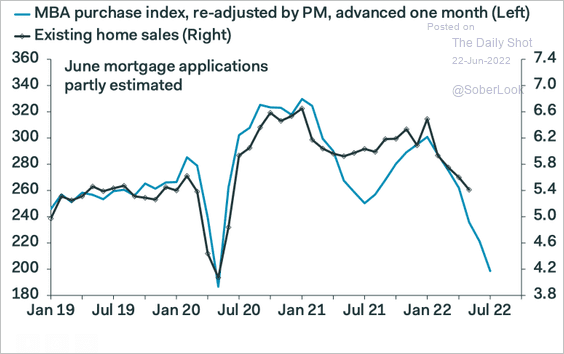 Source: Pantheon Macroeconomics
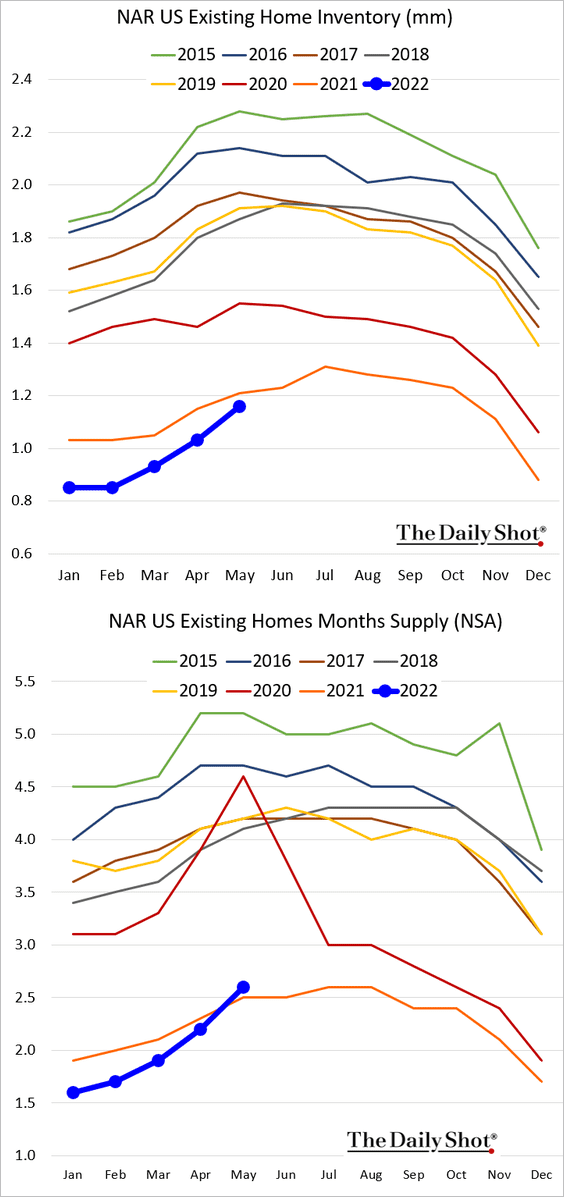
• Housing inventories remain exceptionally tight but are starting to move higher.
Here is a similar index from AEI.
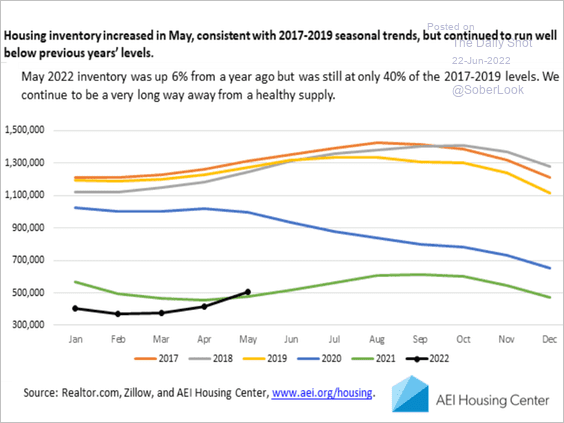 Source: AEI Center on Housing Markets and Finance
• Price gains have slowed but remain positive.
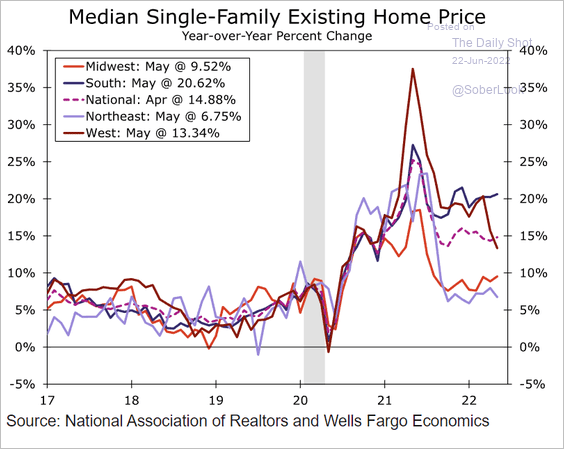 Source: Wells Fargo Securities
• Cash sales are up vs. last year.
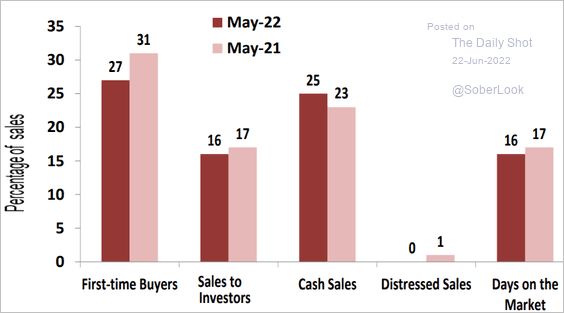 Source: NAR
• Mortgage payments (based on the median asking price) keep climbing, putting further pressure on affordability.
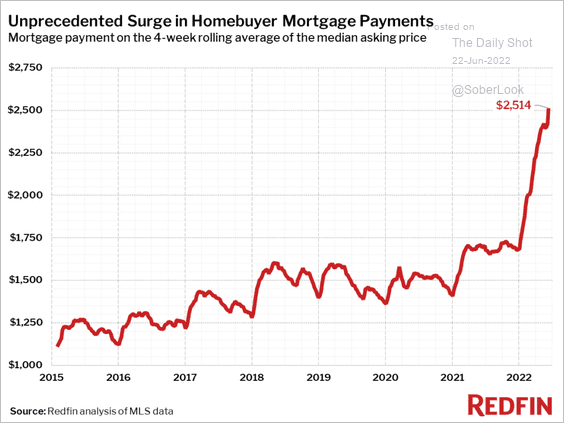 Source: Redfin
• More sellers are lowering listing prices.
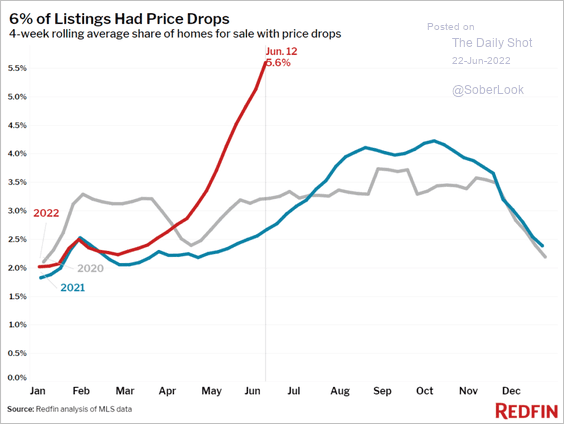 Source: Redfin
• Redfin’s housing demand index continues to move lower but is not crashing.
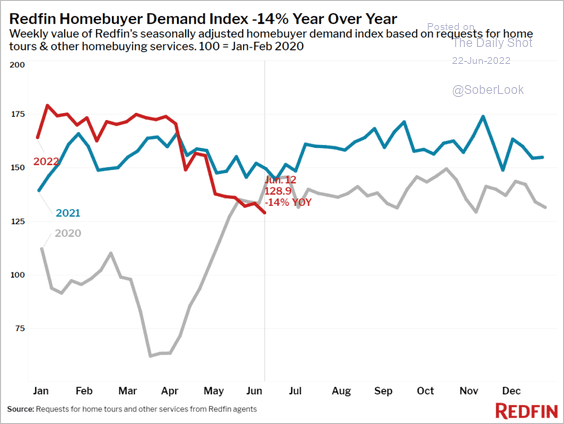 Source: Redfin
• Residential construction activity could slow substantially, …
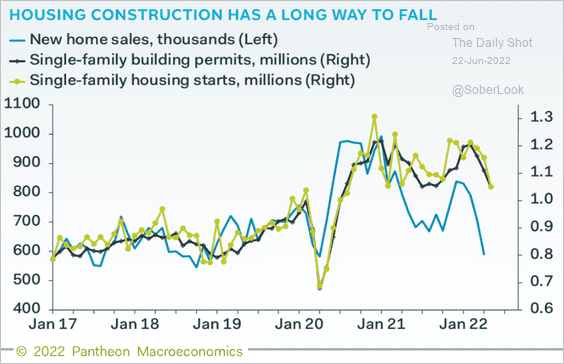 Source: Pantheon Macroeconomics
… prompting analysts to downgrade homebuilder share price targets.
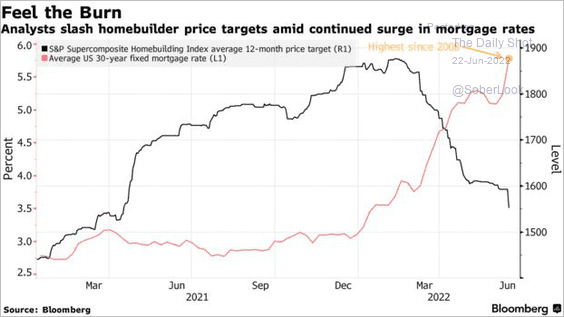 Source: Bloomberg Read full article
• Household leverage has been relatively modest during the recent housing boom.
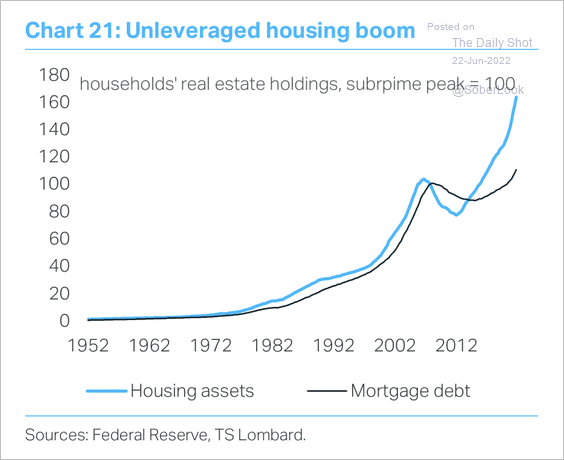 Source: TS Lombard
• Single-family rents are about 14% higher than last year, with gains remaining broadly based.
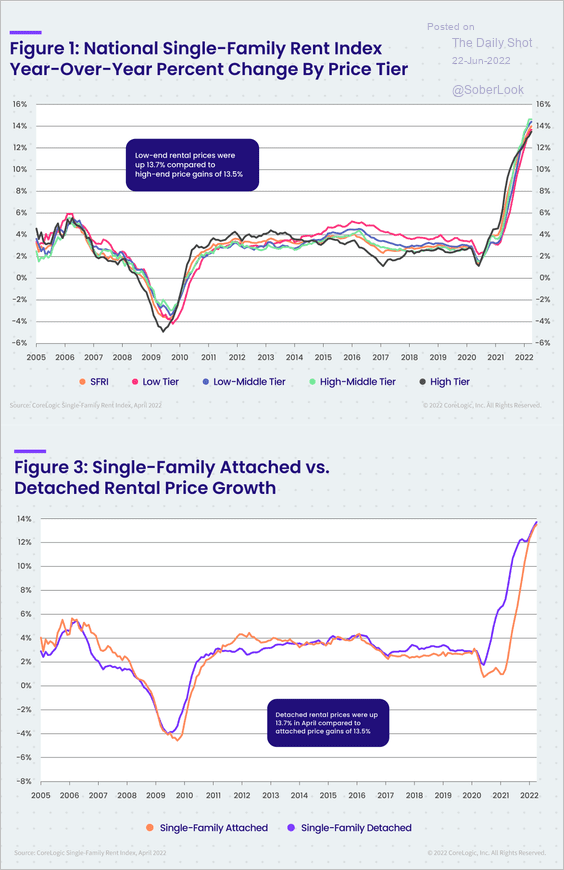 Source: CoreLogic
——————–
2. How does the expected Fed rate hike trajectory compare to previous cycles?
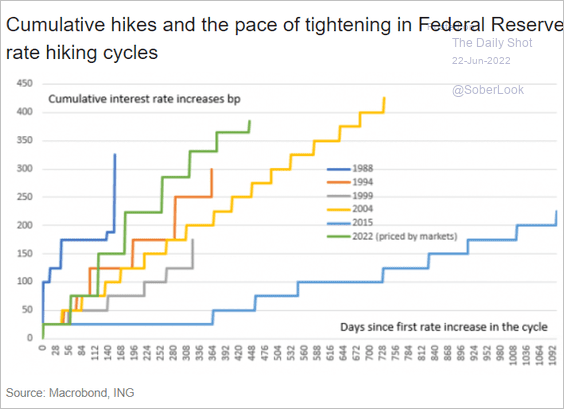 Source: ING
Will the real fed funds rate remain negative through the cycle?
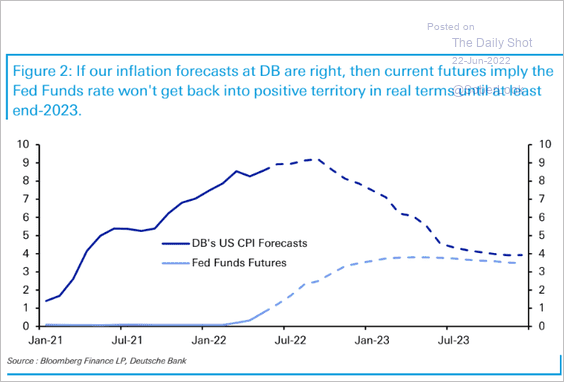 Source: Deutsche Bank Research
——————–
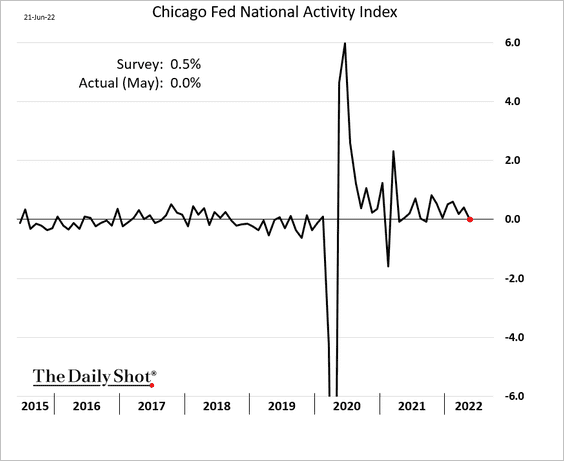
3. The Chicago Fed’s national activity index was lower than expected.
4. There has been some focus in the media on the recent increase in revolving credit (credit card debt), …
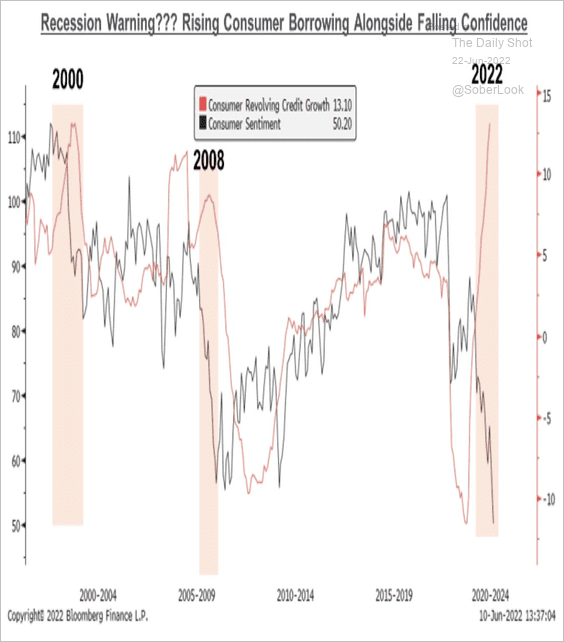 Source: @MichaelKantro
… especially as credit card rates surge.
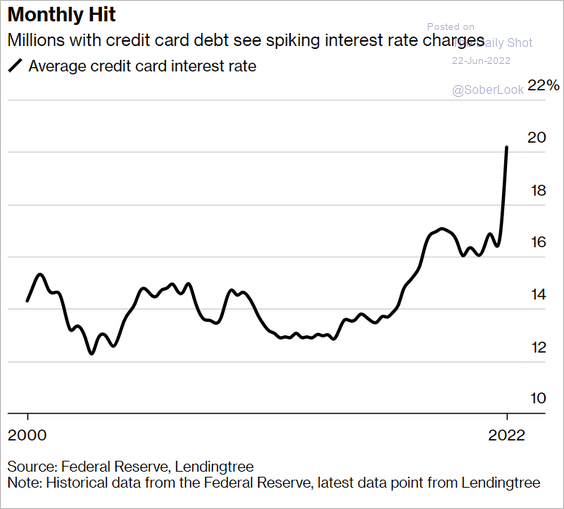 Source: @wealth Read full article
But as a share of disposable income, households’ revolving credit is still well below pre-COVID levels.
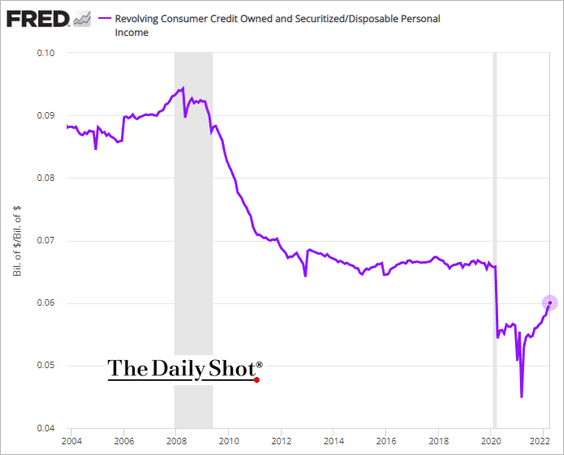 h/t @jasonfurman
Households and corporations are relatively well-positioned for the looming economic slowdown.
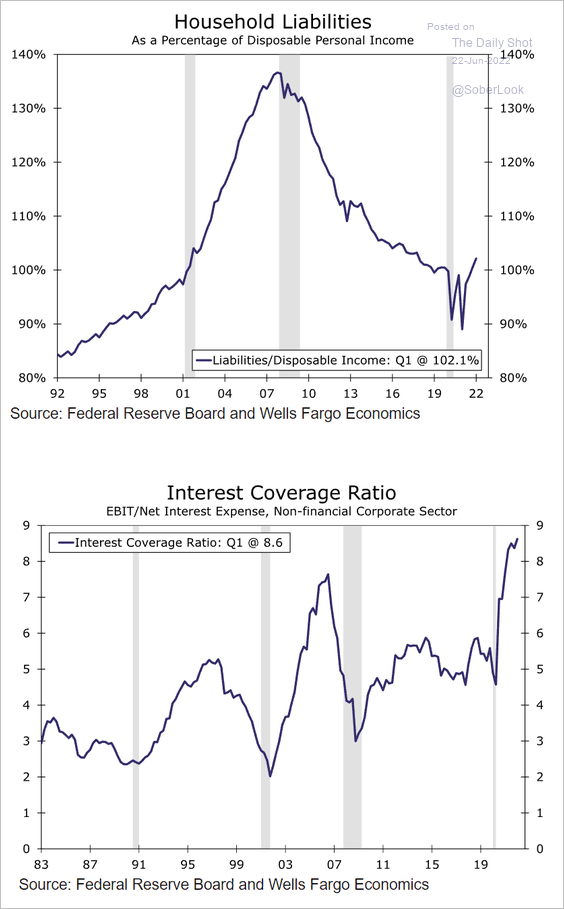 Source: Wells Fargo Securities
——————–
5. In another sign of slowing consumer demand, full-service restaurants are seeing a pullback in foot traffic.
 Source: Placer.ai
Apparel store foot traffic is lower as well.
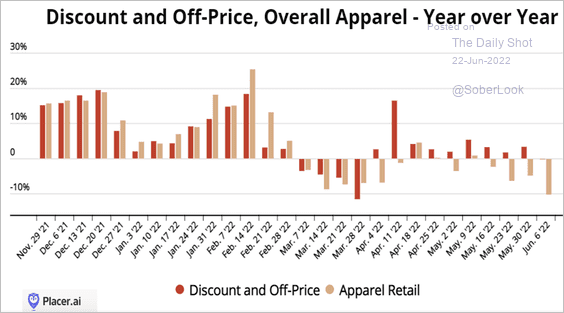 Source: Placer.ai
——————–
6. How many weeks of income does it take to purchase a new vehicle?
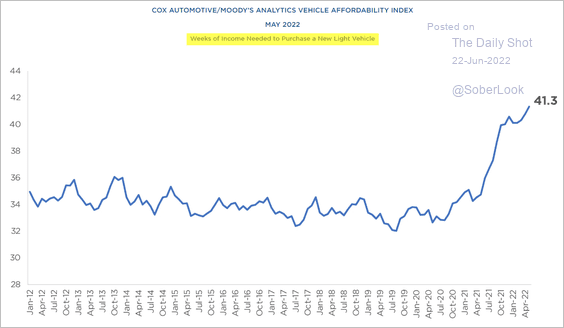 Source: Cox Automotive
Back to Index
Canada
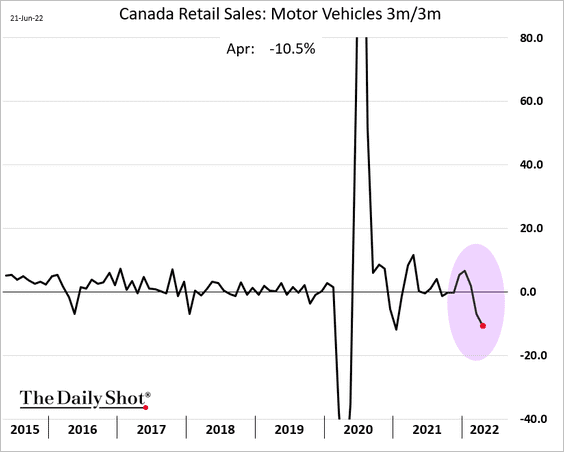
1. April retail sales surprised to the upside, which bodes well for the Q2 GDP growth.
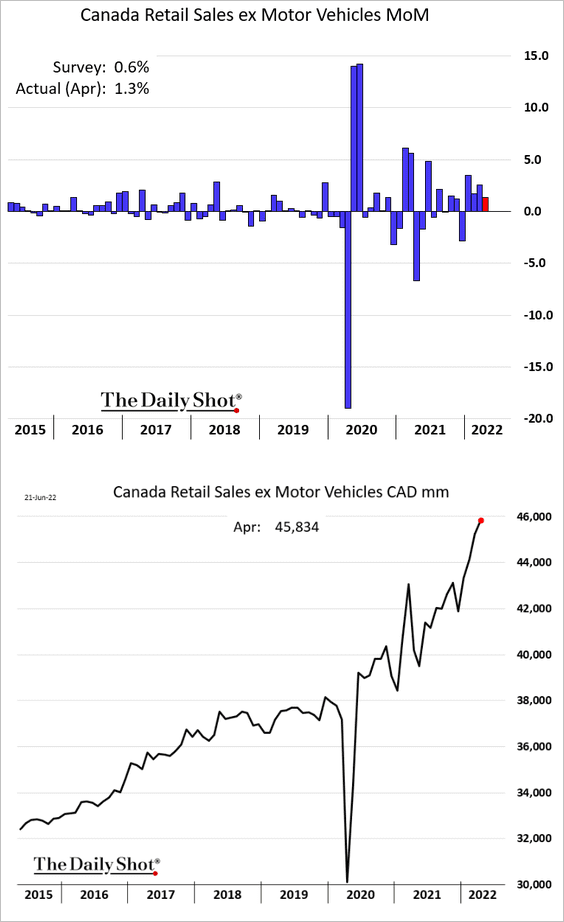
But vehicle sales have been deteriorating (chart shows 3-month rolling changes).
——————–
2. Consumer confidence continues to worsen, …
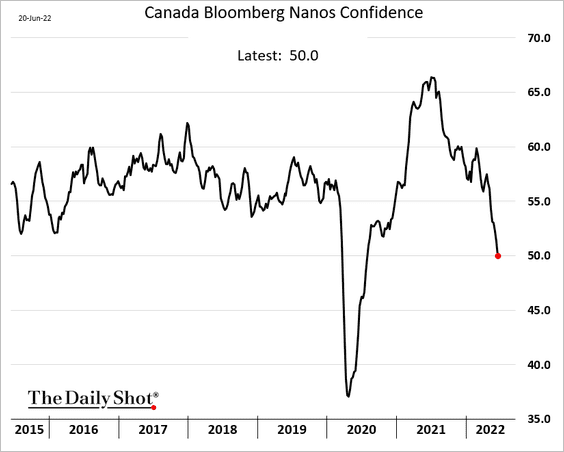
… as food and fuel inflation surges.
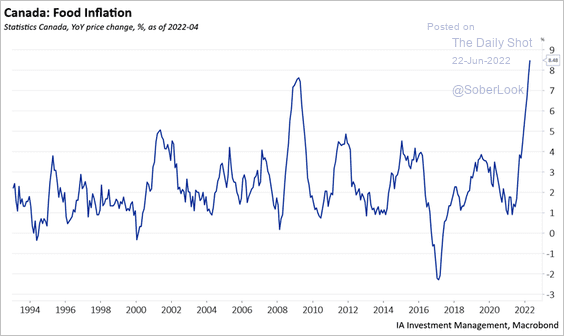 Source: Industrial Alliance Investment Management Inc.
——————–
3. Canada’s small caps are underperforming global peers.
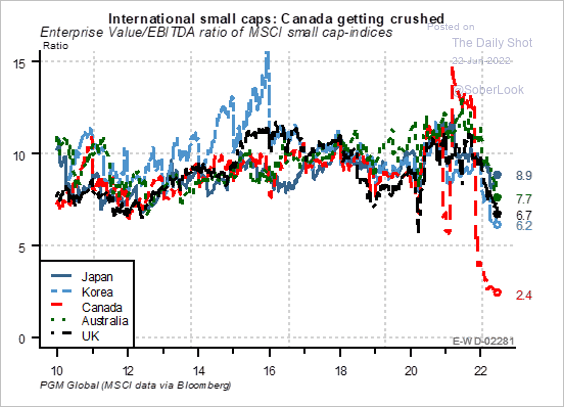 Source: PGM Global
Back to Index
The United Kingdom
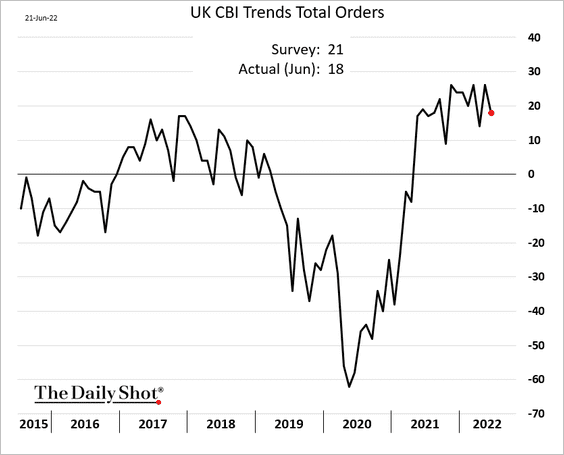
1. Industrial orders eased this month.
Selling prices are starting to moderate, …
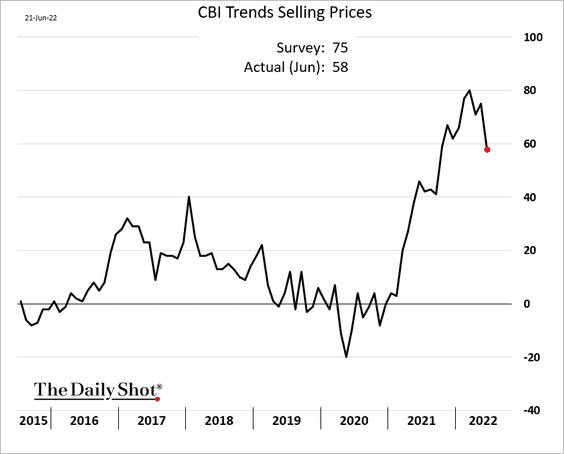
… which points to a peak in the PPI.
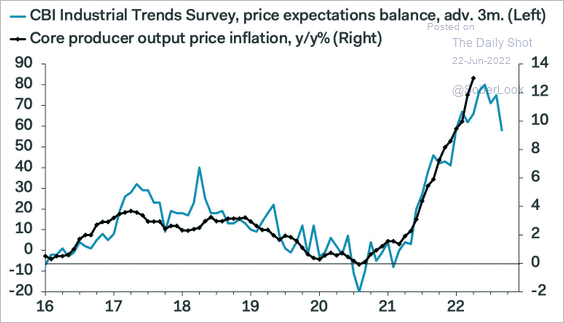 Source: Pantheon Macroeconomics
——————–
2. Market participants are gloomy about UK assets.
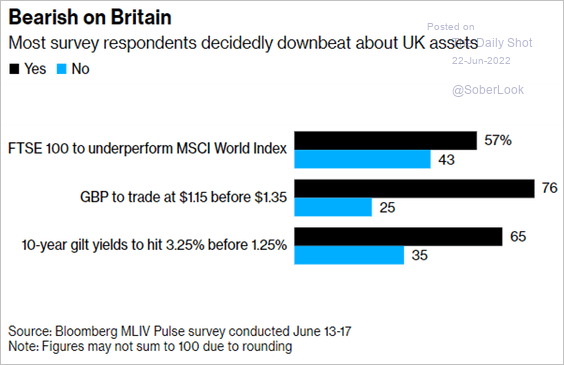 Source: @markets Read full article
Back to Index
The Eurozone
1. Here is the CPI projection from Barclays.
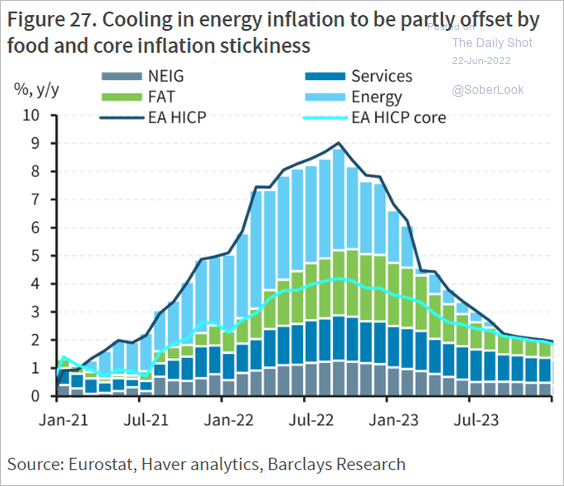 Source: Barclays Research
2. This chart shows Germany’s manufacturing employment growth by sector.
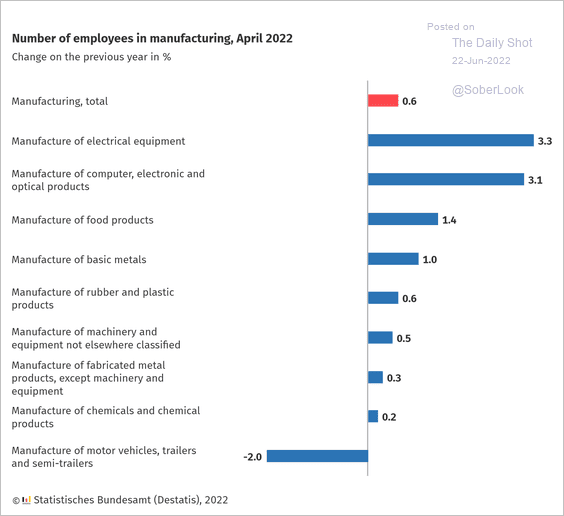 Source: Statistisches Bundesamt Read full article
3. Eurozone industrial production is lagging the overall EU output (mostly due to Germany).
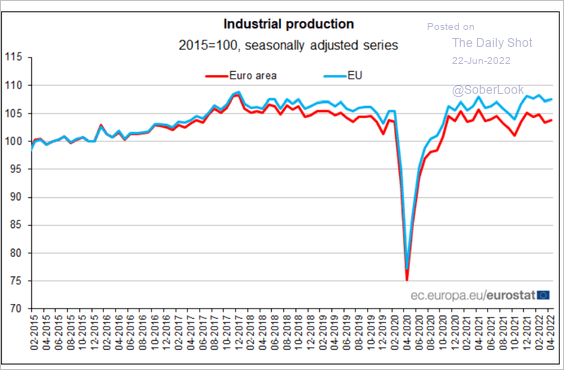 Source: Eurostat Read full article
4. Recession is coming.
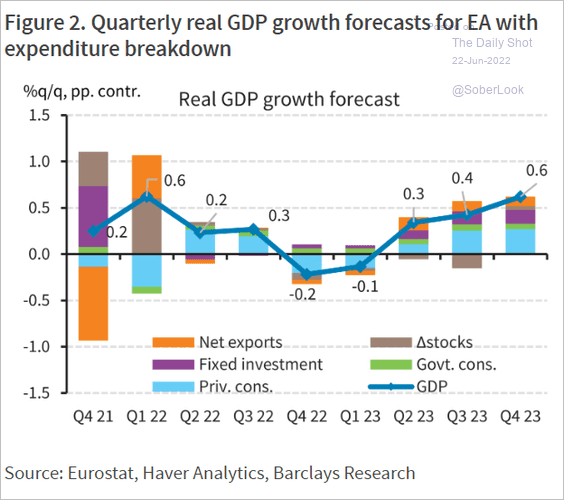 Source: Barclays Research
Back to Index
Asia – Pacific
1. The yen hit a multi-year low (chart shows the dollar surging vs. the yen).
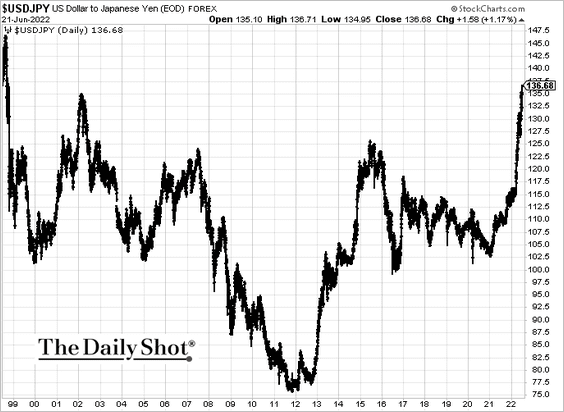
 Source: Reuters Read full article
Here is the key driver of the yen’s weakness. The pace of BoJ bond purchases has accelerated. The monthly run-rate is now double the pace of buying at “peak Abenomics,” according to Deutsche Bank.
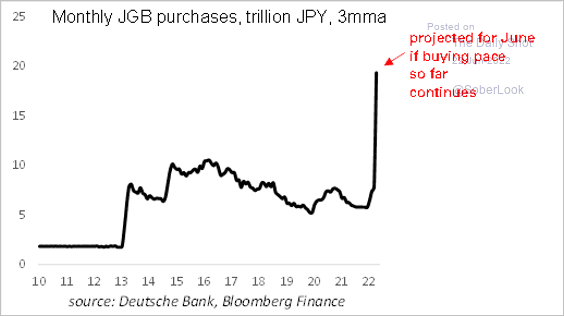 Source: Deutsche Bank Research
——————–
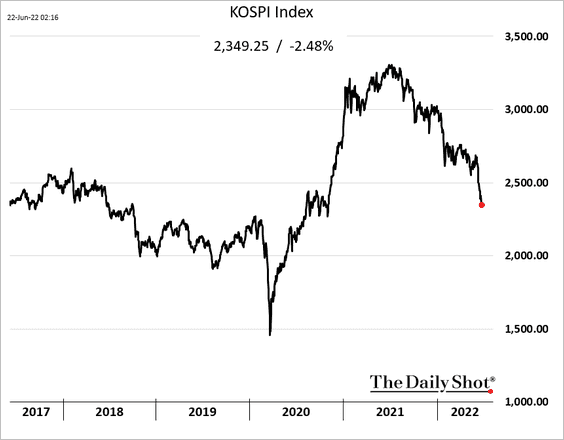
2. South Korea’s stocks remain under pressure.
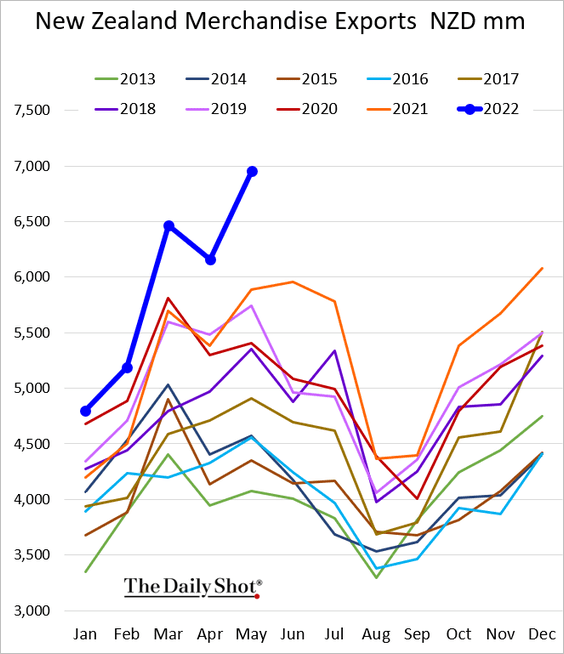
3. New Zealand’s exports hit a record high.
Back to Index
China
1. Road traffic is rebounding.
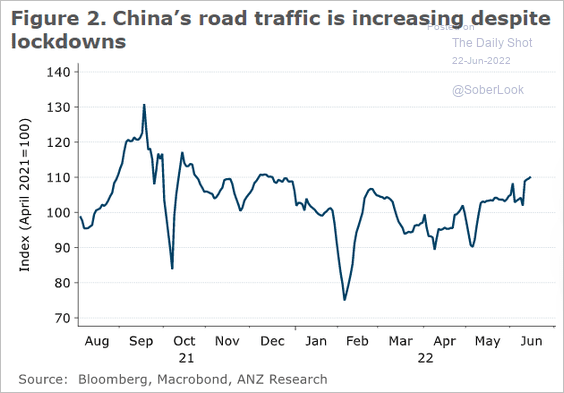 Source: @ANZ_Research
2. Steel output has diverged from construction activity.
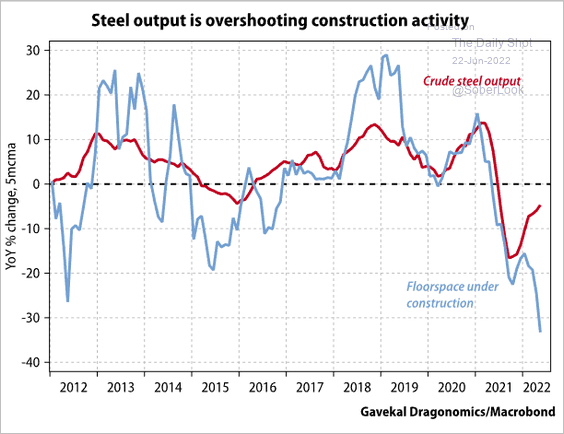 Source: Gavekal Research
3. Stock listing in Hong Kong slumped this year.
 Source: @WSJ Read full article
Back to Index
Emerging Markets
1. Emerging markets are seeing substantial capital outflows this quarter, …
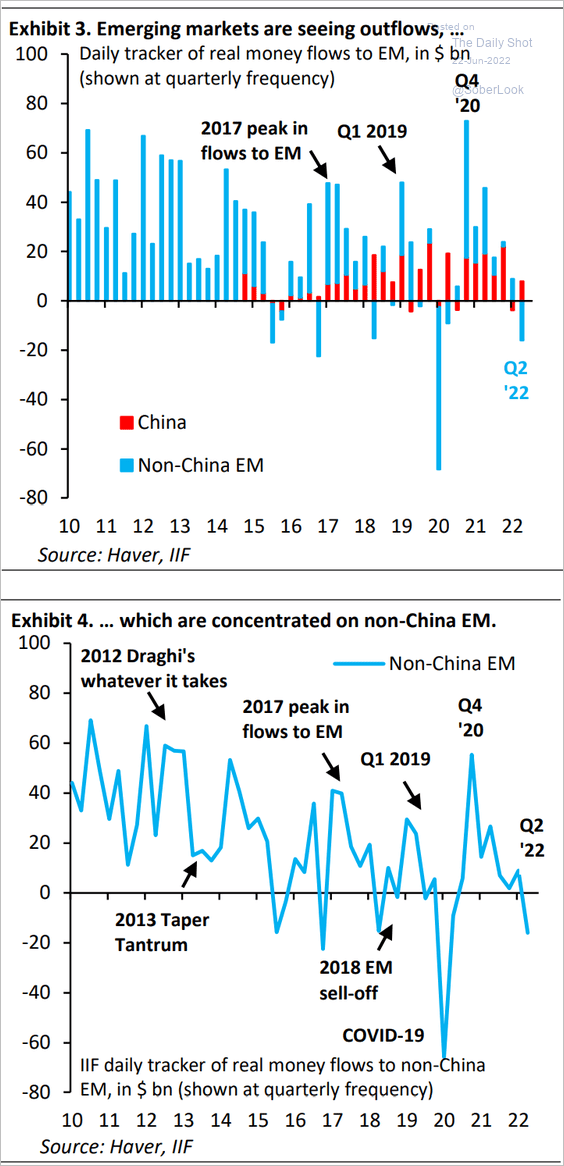 Source: IIF
… exacerbated by bond fund sales.
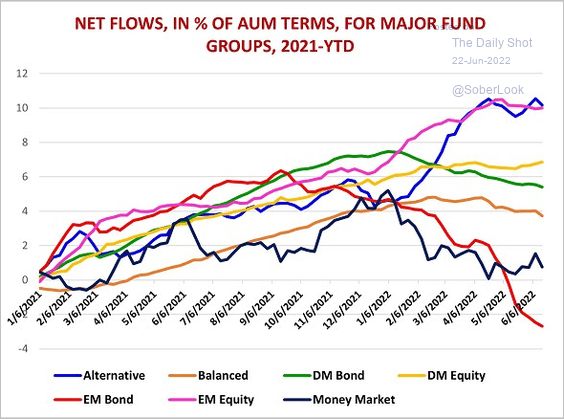 Source: EPFR Global
——————–
2. India’s business activity is now contracting, according to the June World Economics SMI report.
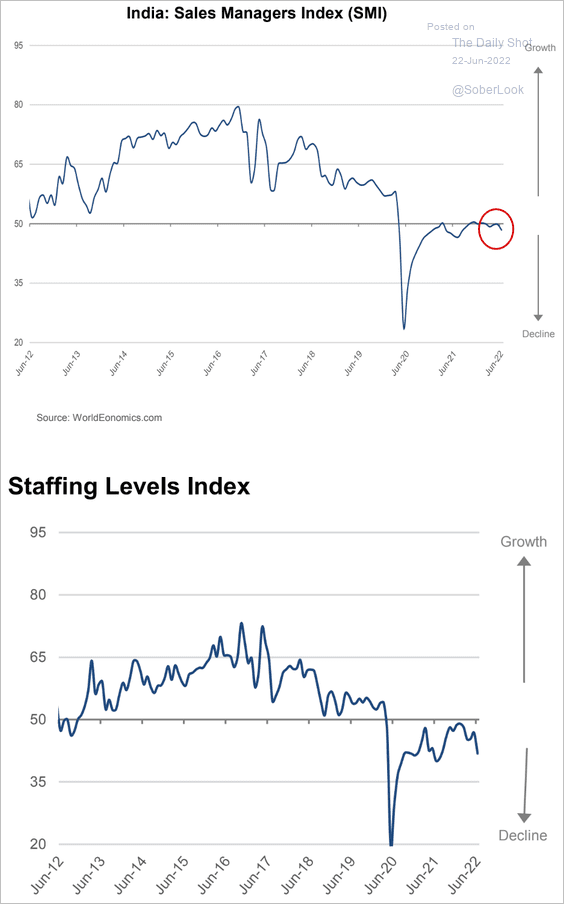 Source: World Economics
3. Will EM economies face further growth downgrades?
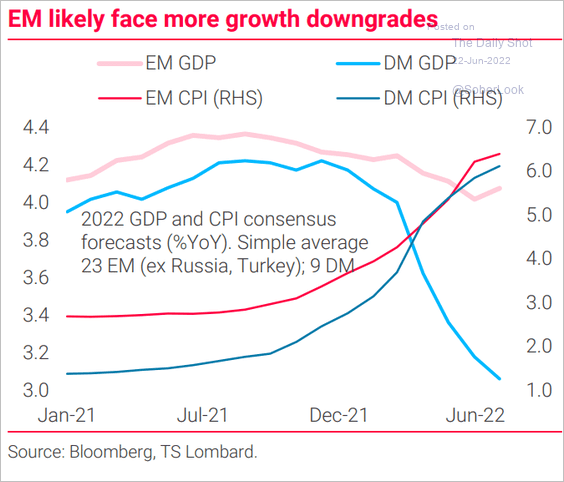 Source: TS Lombard
Back to Index
Cryptocurrency
1. Crypto investment products saw outflows totaling $39 billion last week.
 Source: CoinShares Read full article
Ethereum-focused funds saw the most outflows last week, while multi-asset funds saw inflows. Short-bitcoin funds experienced record outflows, suggesting that bearish sentiment is starting to fade.
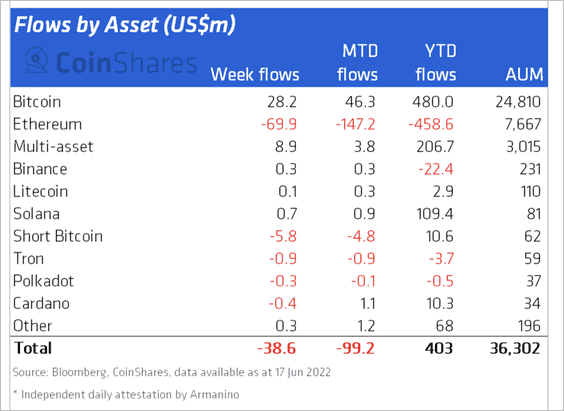 Source: CoinShares Read full article
By the way, the ProShares Short Bitcoin Strategy ETF (BITI) launched on Tuesday, the first of its kind in the US.
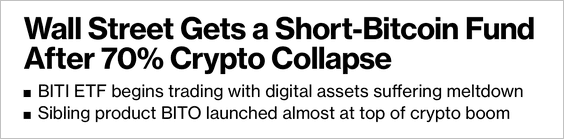 Source: Bloomberg Read full article
——————–
2. Crypto funds in Canada and Sweden have seen the most outflows.
 Source: CoinShares Read full article
3. Private capital is drying up in the crypto industry.
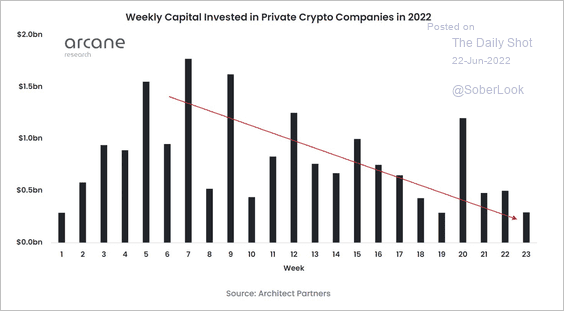 Source: @ArcaneResearch
Back to Index
Commodities
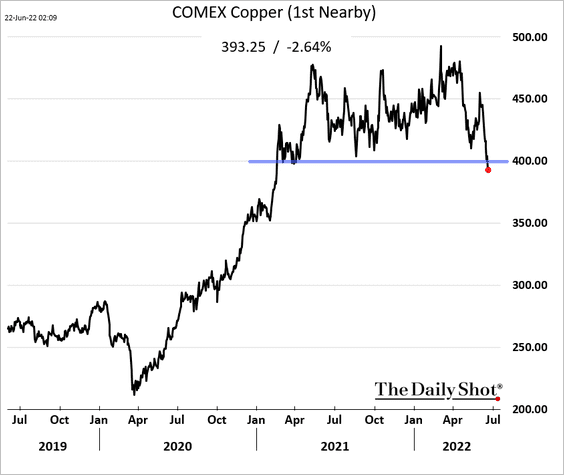
1. Copper remains under pressure amid concerns about China’s growth.
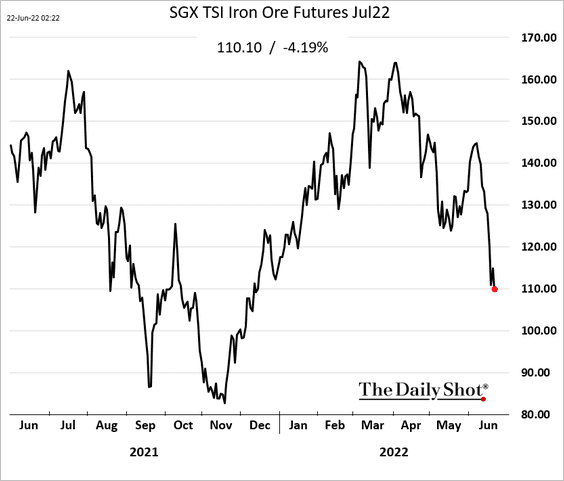
Iron ore resumed its decline.
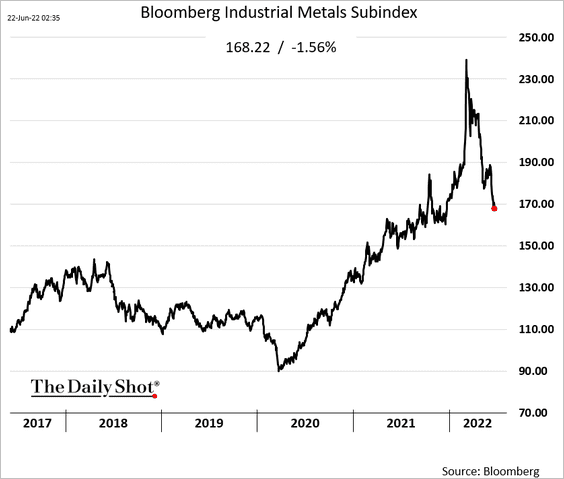
Here is Bloomberg’s industrial metals index.
——————–
2. The correlation between gold and the S&P 500 is back to 85%.
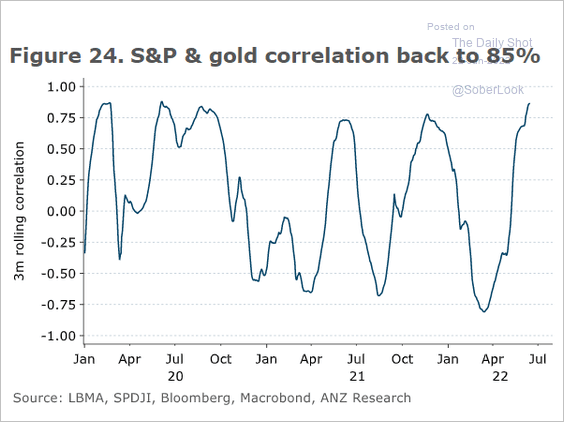 Source: @ANZ_Research
As we mentioned earlier, gold remains vulnerable to rising real yields.
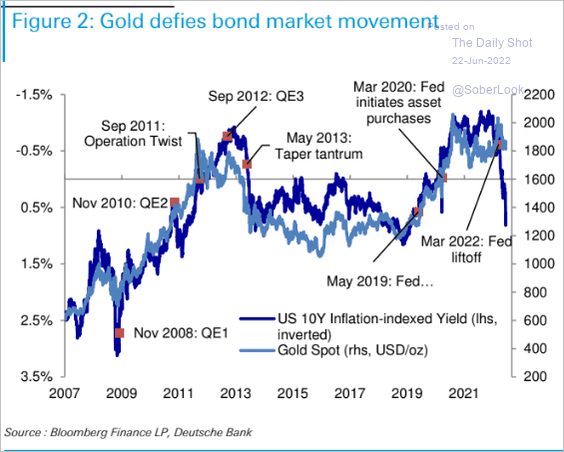 Source: Deutsche Bank Research
——————–
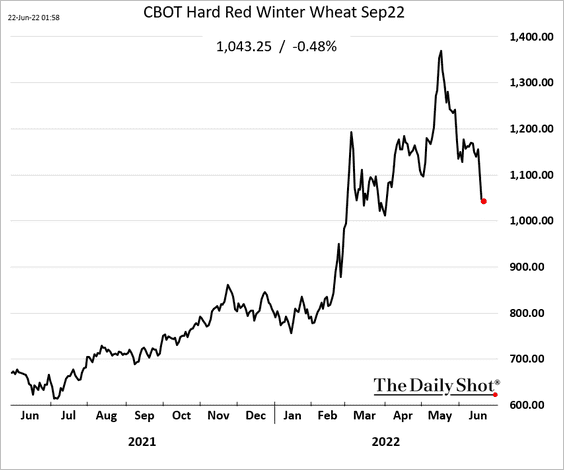
3. US grain prices continue to move lower amid recession concerns.
Back to Index
Energy
1. Brent crude is trending lower as sentiment shifts to risk-off.
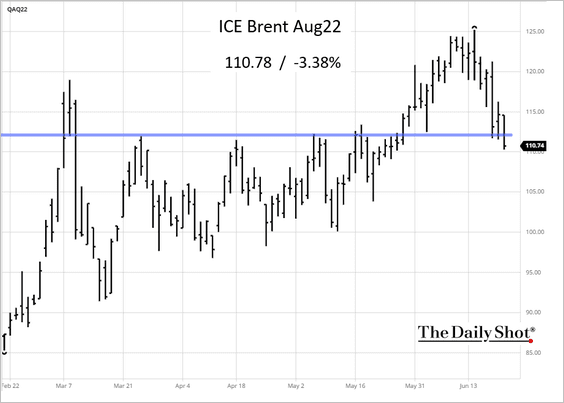 Source: barchart.com
2. Crack spreads remain at extreme levels.
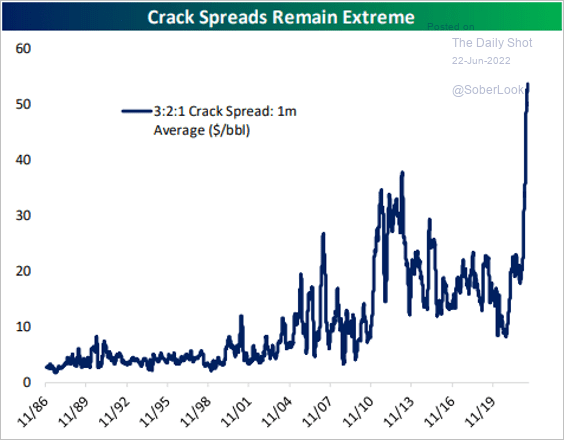 Source: @bespokeinvest Read full article
Back to Index
Equities
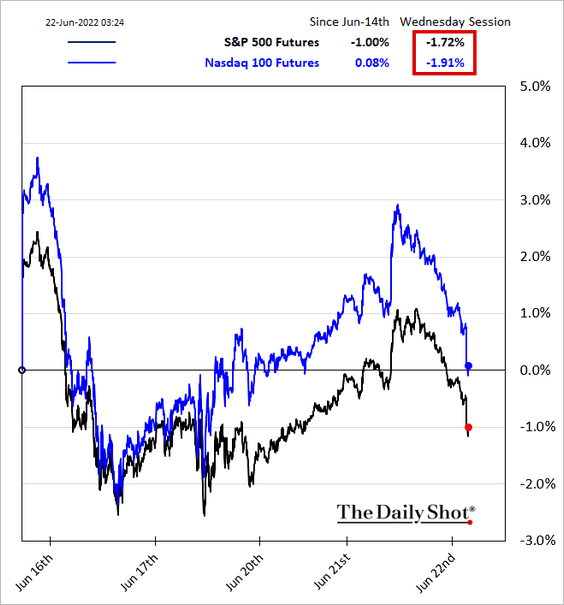
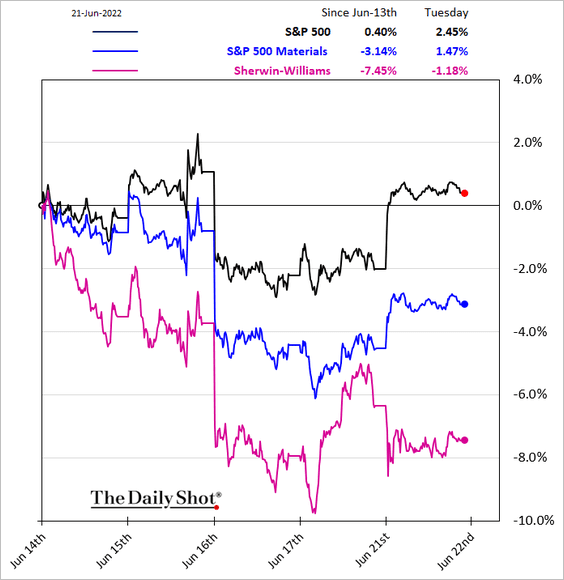
1. Stocks bounced on Tuesday, but futures are rapidly giving up all the gains this morning as recession risks mount. The Pavlovian response these days is to sell into rallies.
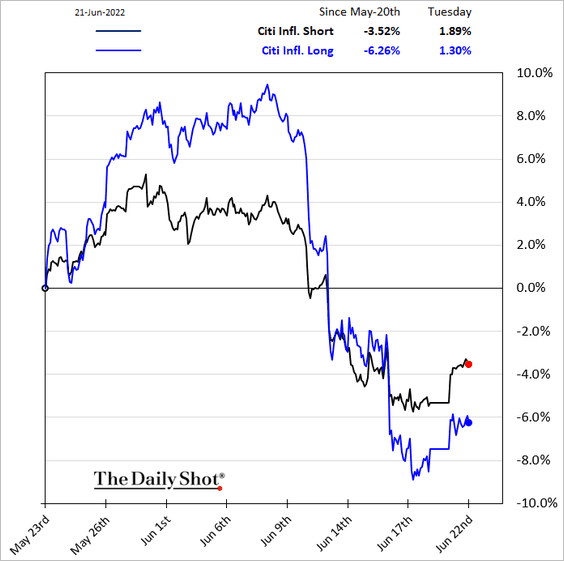
2. Recession risks are trumping inflation concerns, with shares that benefit from higher prices underperforming.
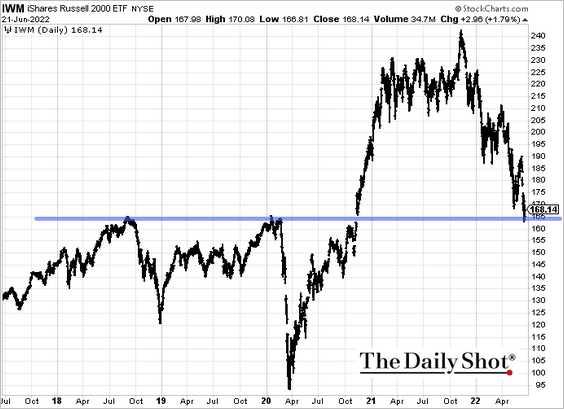
3. Will the IWM ETF (Russell 2000) hold support at the pre-COVID highs?
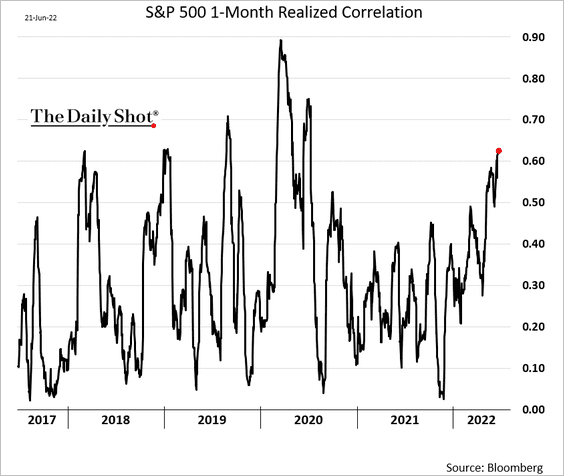
4. Correlations among S&P 500 stocks have been rising.
5. Fund flows have not registered market capitulation. This is not what we should expect in a correction (2 charts).
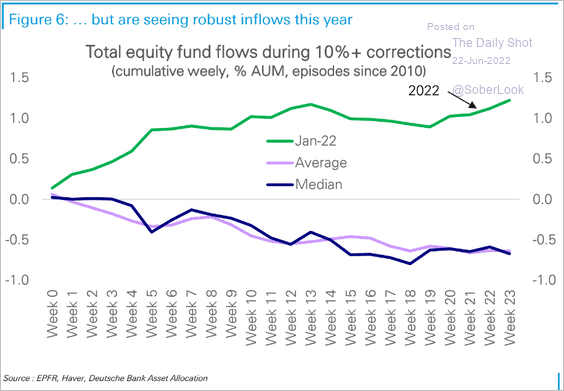 Source: Deutsche Bank Research
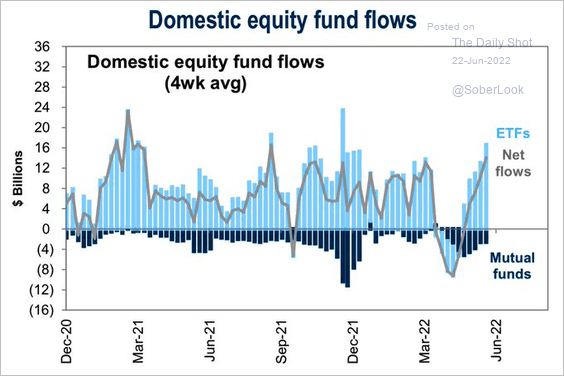 Source: Goldman Sachs; @WallStJesus
• Fund flows have decoupled from prices.
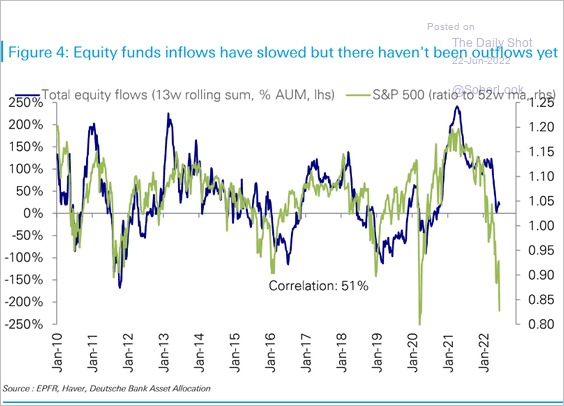 Source: Deutsche Bank Research
• US fund inflows continue to outperform global peers.
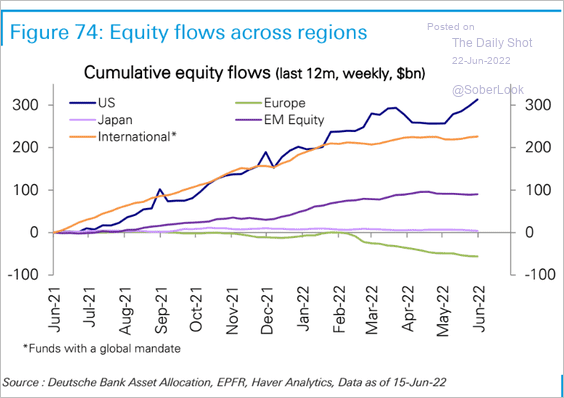 Source: Deutsche Bank Research
——————–
6. Next, we have some fund flow trends by sector.
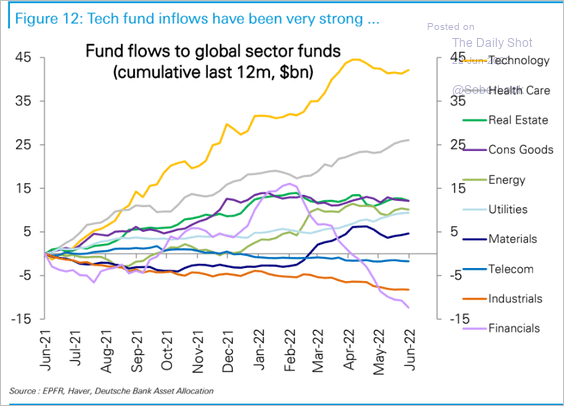 Source: Deutsche Bank Research
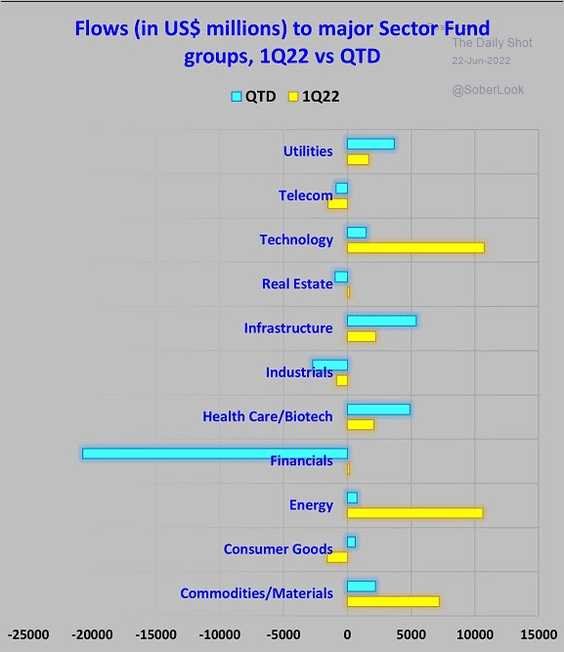 Source: EPFR Global
7. This chart shows global sectors’ correlation to cyclical activity.
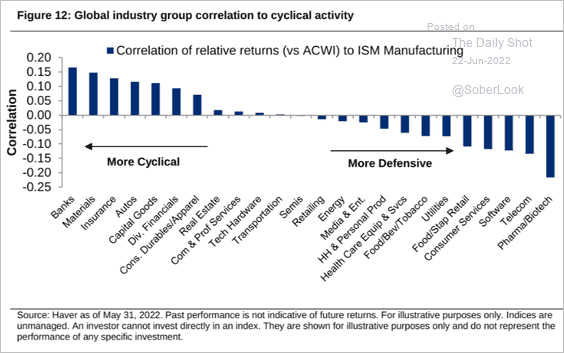 Source: Citi Private Bank
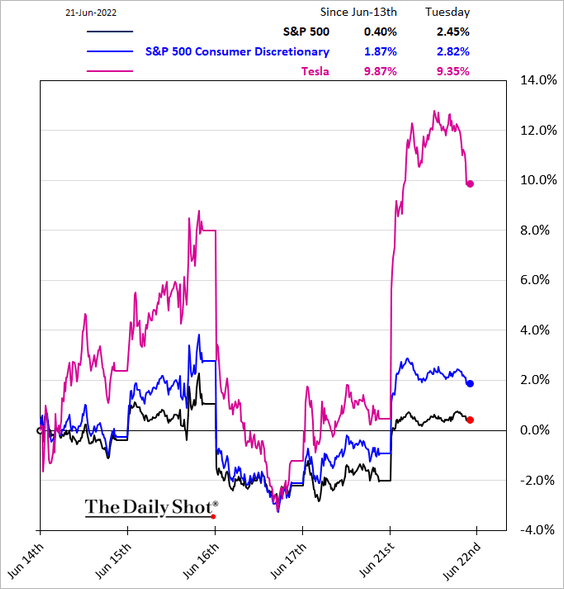
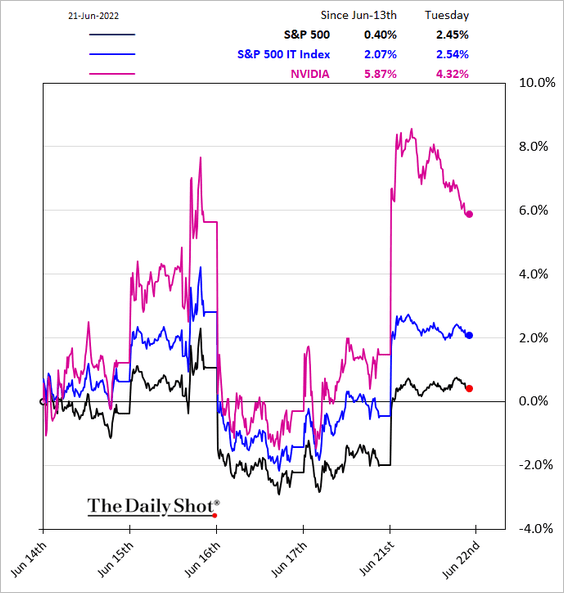
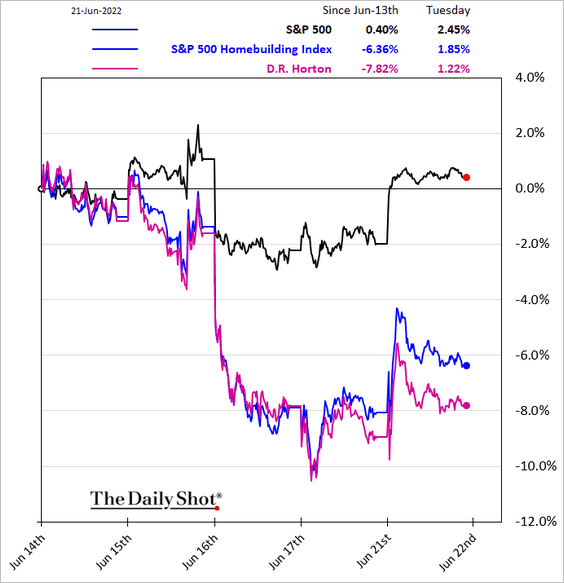
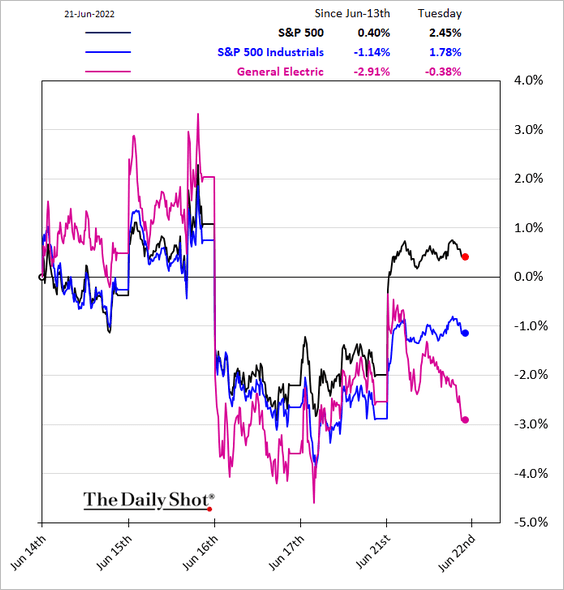
8. Now, let’s take a look at some sector performance data over the past few days.
• Consumer Discretionary:
• Tech:
• Homebuilders:
• Industrials:
• Materials:
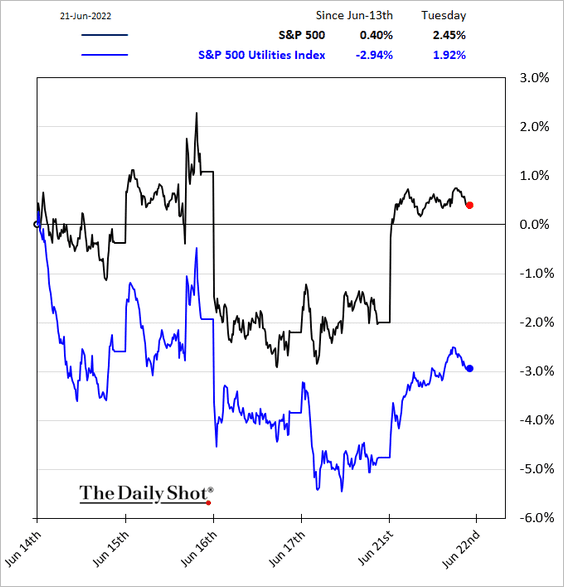
• Utilities:
——————–
9. On a relative basis, the S&P 500 drawdown hasn’t been nearly as severe as bonds.
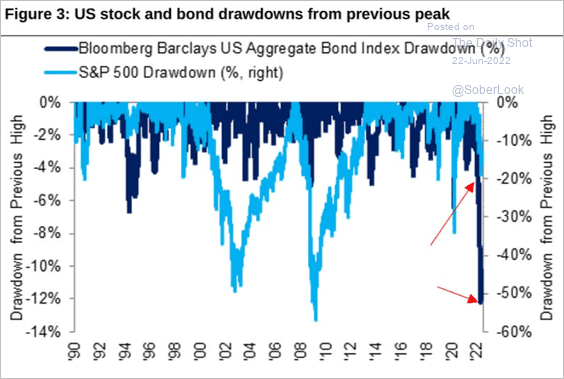 Source: Citi Private Bank
10. Implied volatility of stocks and bonds combined is now above 2020 levels.
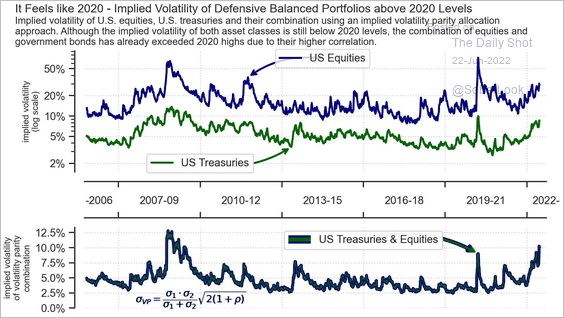 Source: Allianz Global Investors
Back to Index
Credit
1. Leveraged loan funds are registering significant outflows.
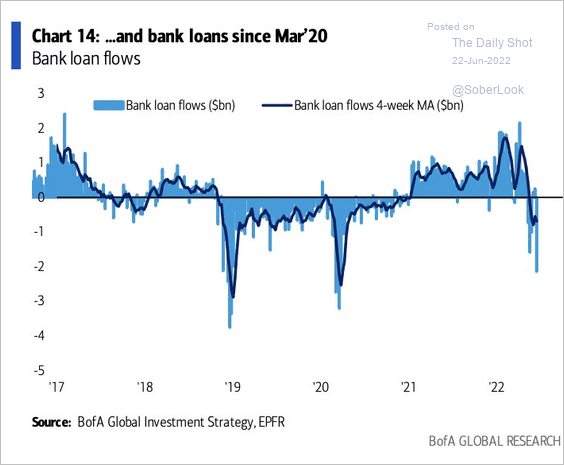 Source: BofA Global Research
This chart shows fund flows across credit asset classes.
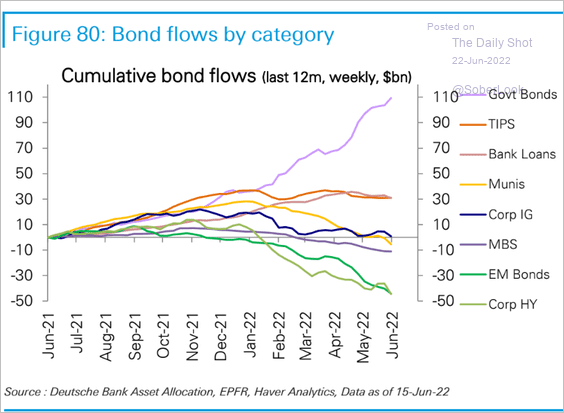 Source: Deutsche Bank Research
——————–
2. BofA argues that capitulation has taken place in credit but not in equities.
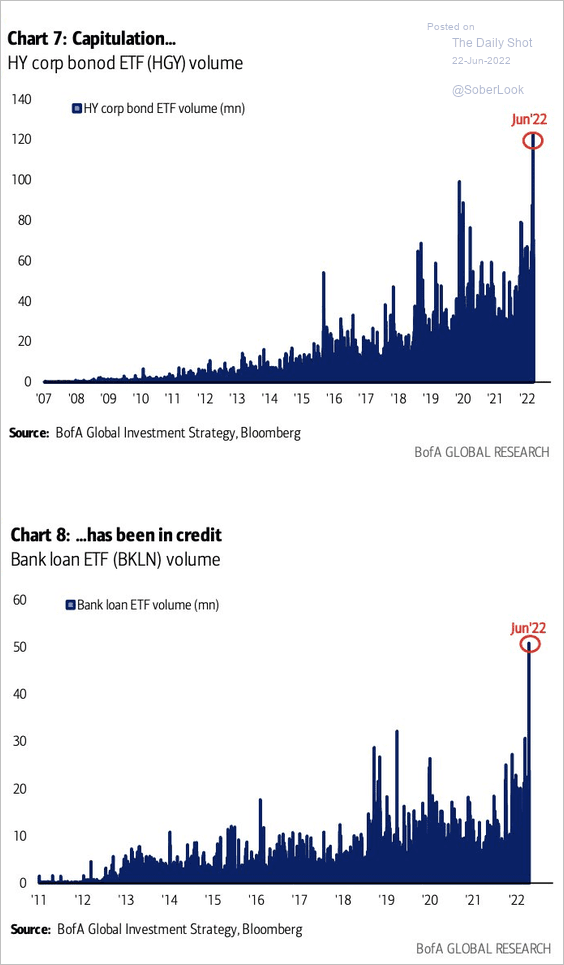 Source: BofA Global Research
3. How correlated are different fixed-income asset classes to equities?
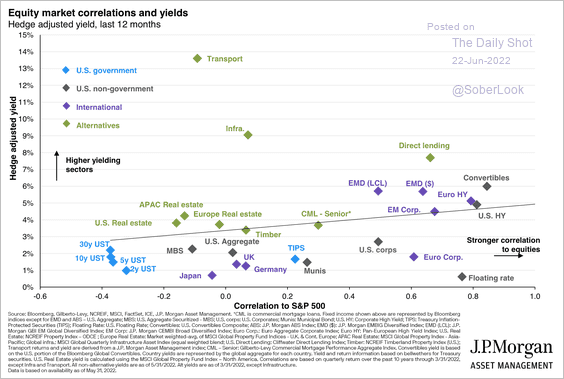 Source: J.P. Morgan Asset Management
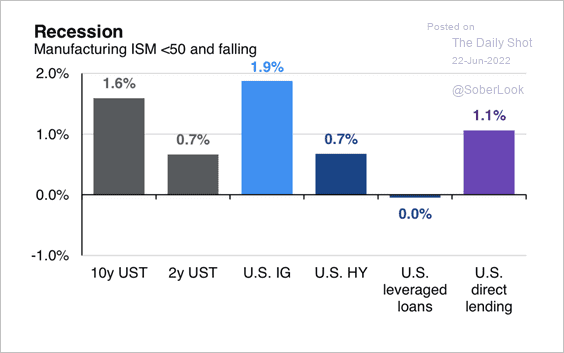
4. Here is a look at returns across recent late-stage and recession cycles since 2004 (2 charts).
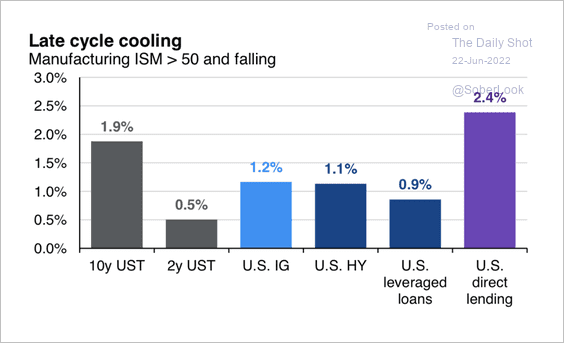 Source: J.P. Morgan Asset Management
 Source: J.P. Morgan Asset Management
Back to Index
Global Developments
1. Labor shortage indicators across G7 countries are showing tentative signs of easing.
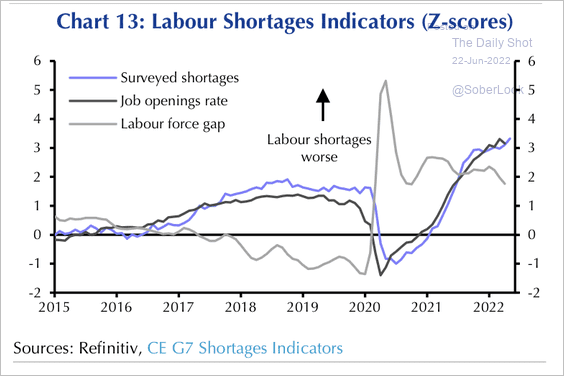 Source: Capital Economics
2. Economists continue to downgrade the 2022 growth forecasts.
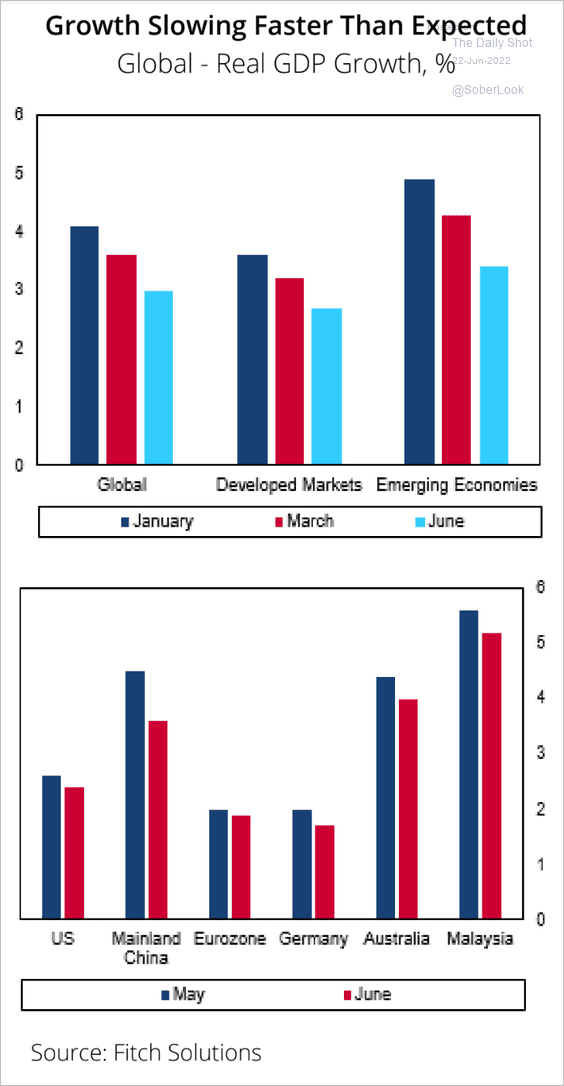 Source: Fitch Solutions Macro Research
3. Global liquidity deterioration is pressuring risk assets.
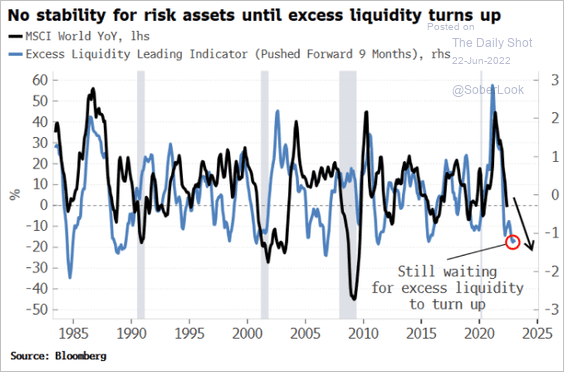 Source: Simon White, Bloomberg Markets Live Blog
4. World trade growth is slowing.
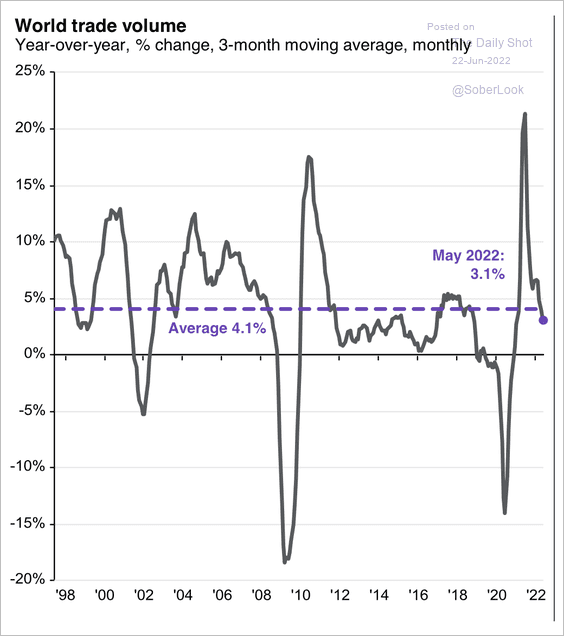 Source: J.P. Morgan Asset Management
5. This table shows property risk rankings for select economies.
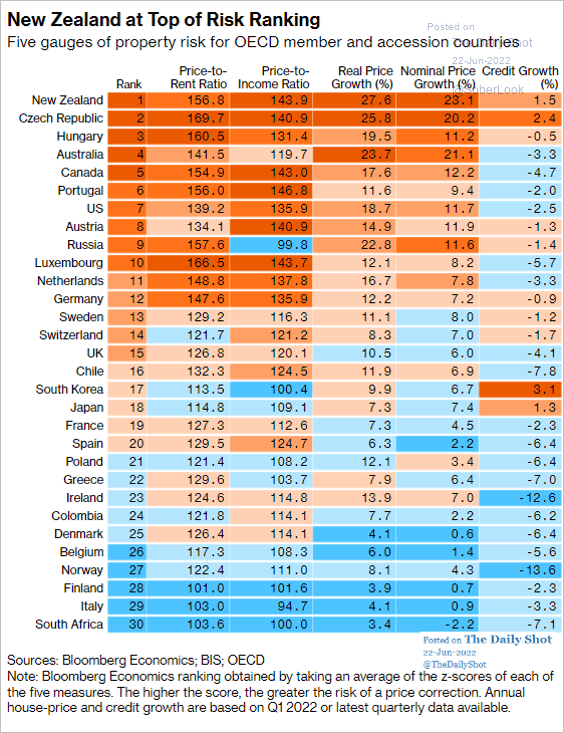 Source: @wealth Read full article
——————–
Food for Thought
1. More Americans can’t afford to see a doctor.
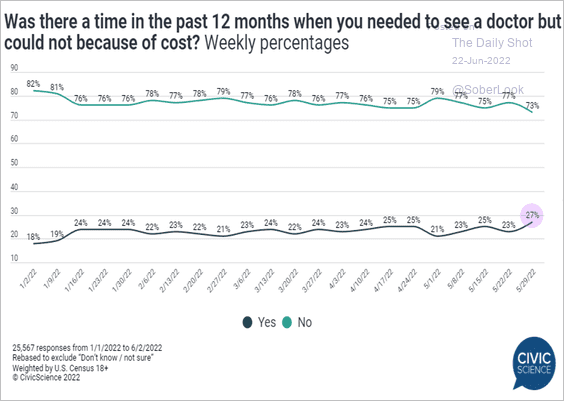 Source: @CivicScience Read full article
2. Addressing homelessness:
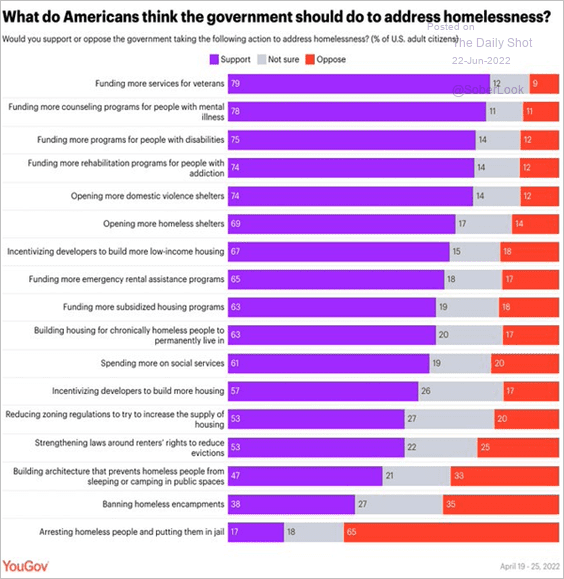 Source: @YouGovAmerica Read full article
3. Growing popularity of podcasts:
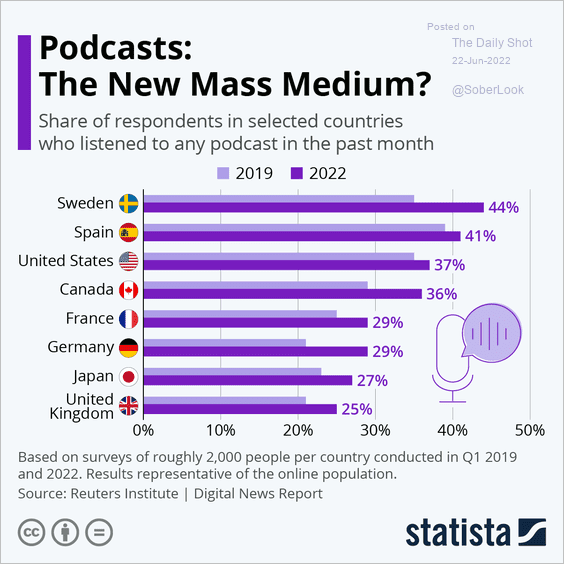 Source: Statista
4. Mass shootings:
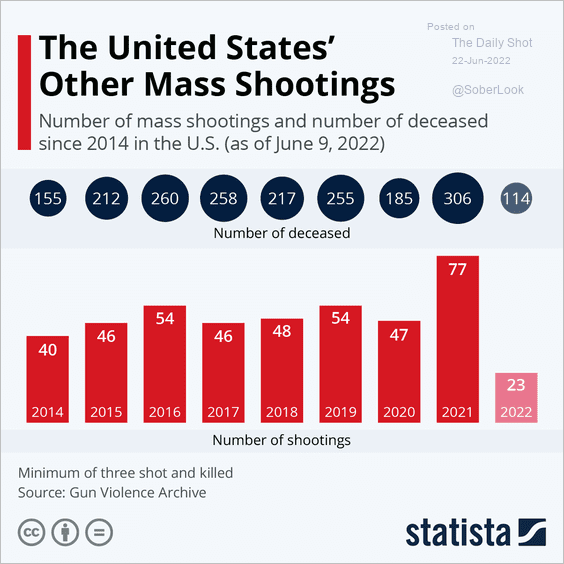 Source: Statista
5. US working-age population with and without immigration:
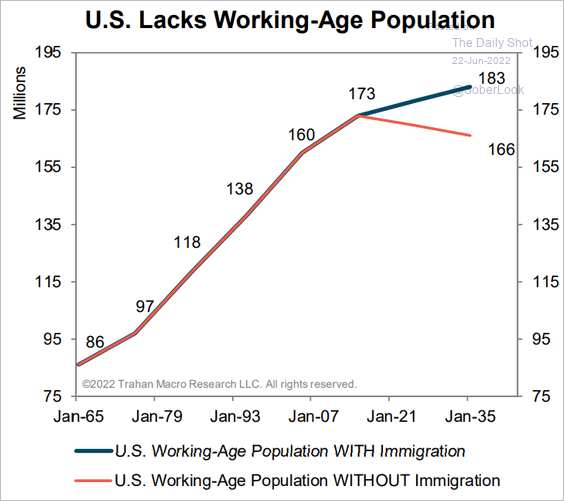 Source: Trahan Macro Research
6. Changes in the cost of hosting and attending a destination wedding:
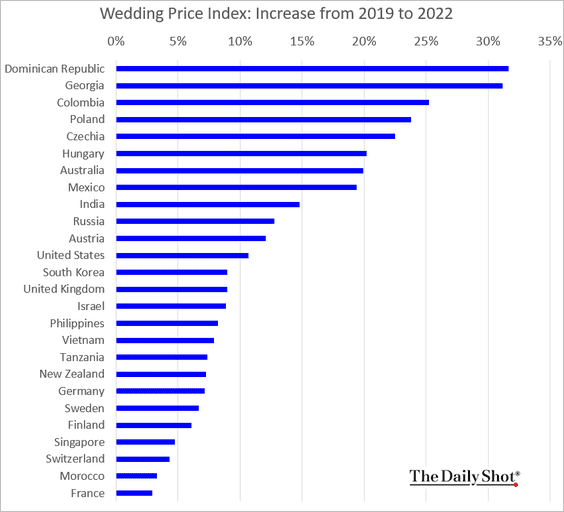 Source: Wedding Price Index Read full article
7. Google search activity for popular TV series:
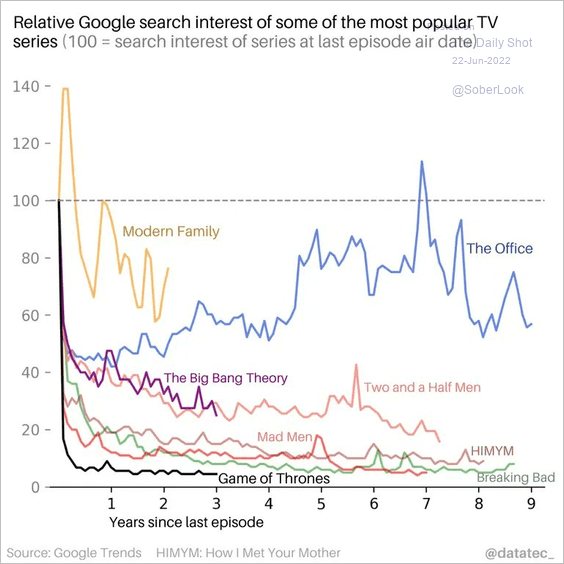 Source: @simongerman600 Read full article
——————–
Back to Index