
The Daily Shot: 27-Jun-22
• The United States
• The United Kingdom
• The Eurozone
• Japan
• China
• Emerging Markets
• Commodities
• Energy
• Equities
• Credit
• Rates
• Global Developments
• Food for Thought
The United States
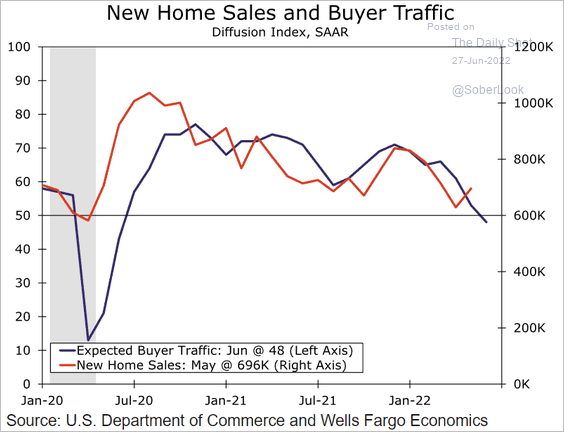
1. New home sales surprised to the upside.
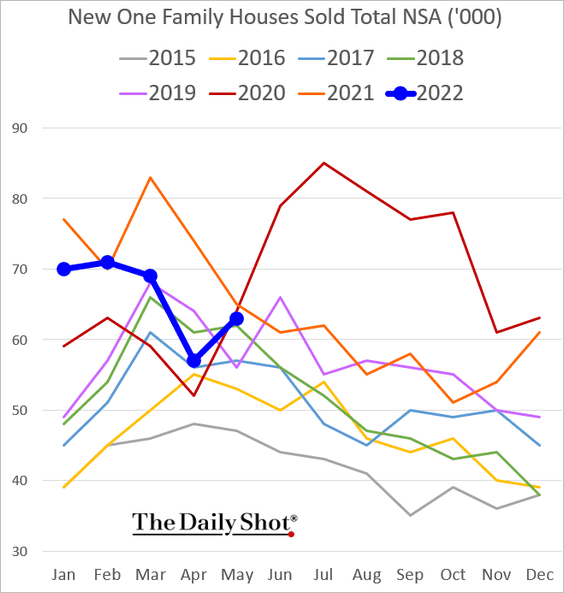
But analysts see the rebound in demand as temporary.
– New home sales and buyer traffic:
 Source: Wells Fargo Securities
– Buyer traffic and mortgage rates:
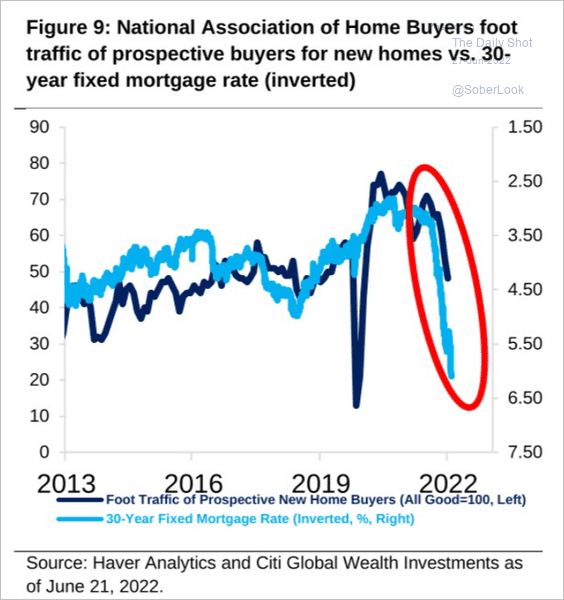 Source: Citi Private Bank
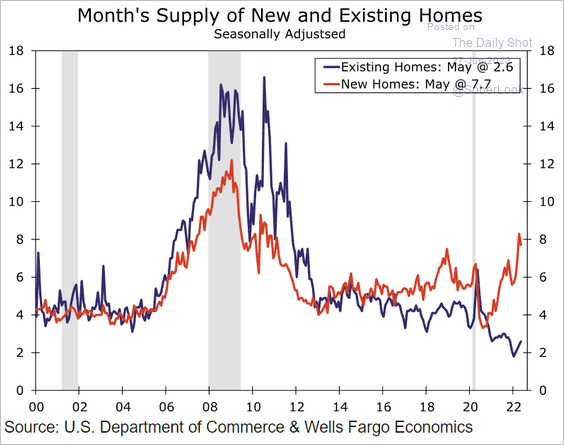
• Inventories remain elevated, …
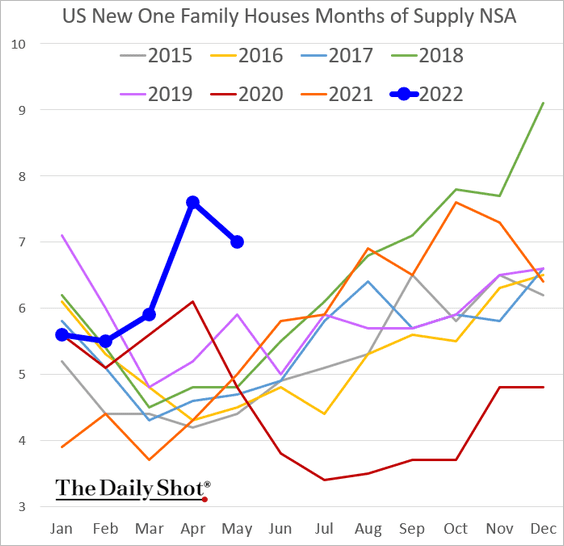
… diverging from unsold existing homes.
 Source: Wells Fargo Securities
Here is the inventory breakdown by stage.
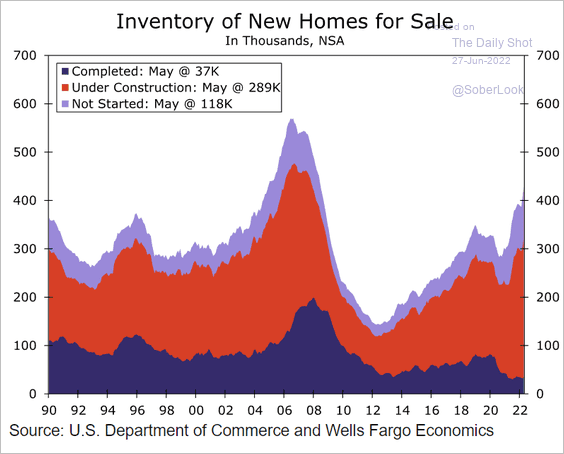 Source: Wells Fargo Securities
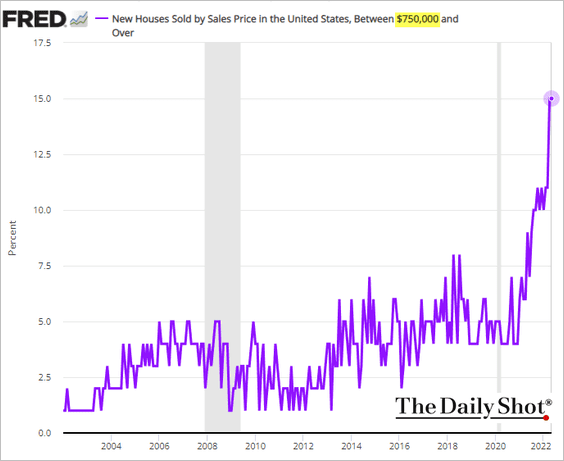
• 15% of new homes sold have been over $750k.
——————–
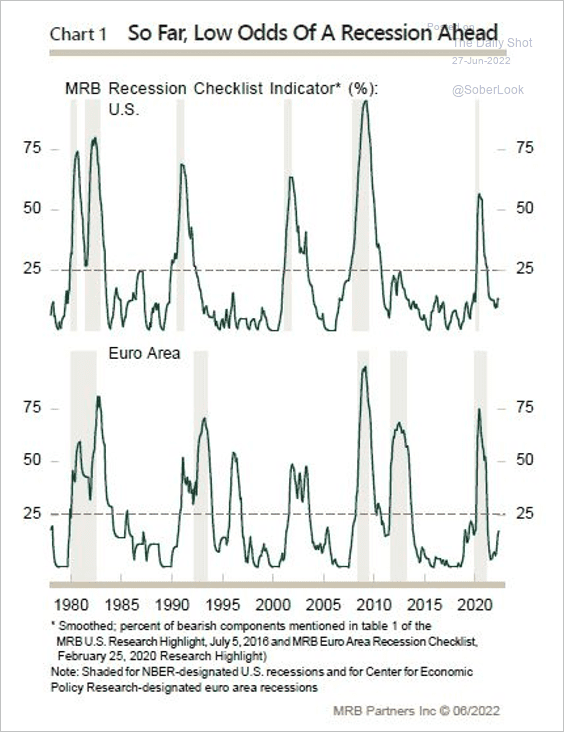
2. According to a WSJ survey, the probability of a US recession in the next twelve months is 44%.
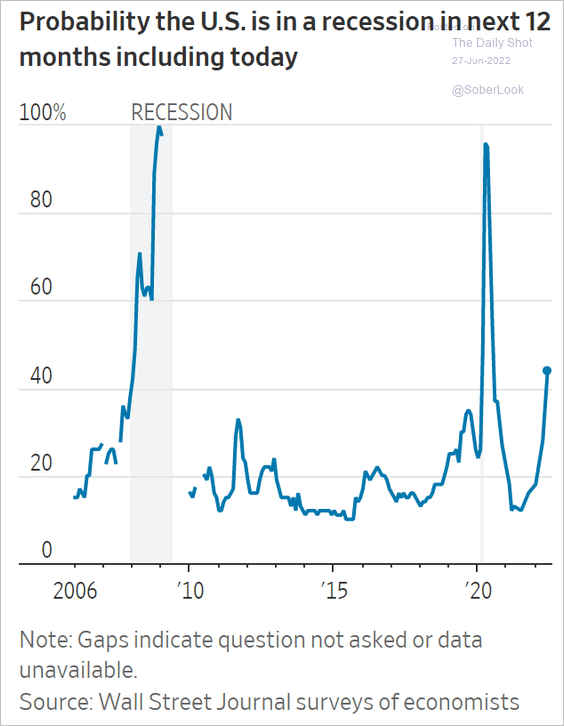 Source: @WSJ Read full article
Not everyone agrees. The odds of a recession remain relatively low, according to MRB Partners.
 Source: MRB Partners
——————–
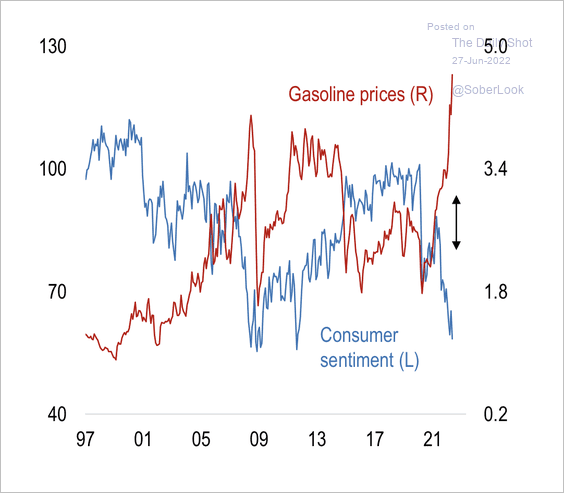
3. The U. Michigan Consumer Expectations Index hit the lowest level since 1980.

High gasoline prices have weighed on sentiment.
 Source: Numera Analytics
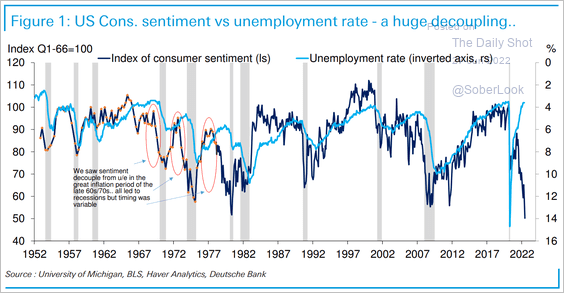
Consumer sentiment has significantly decoupled from the unemployment rate, similar to what occurred in the 1970s.
 Source: Deutsche Bank Research
——————–
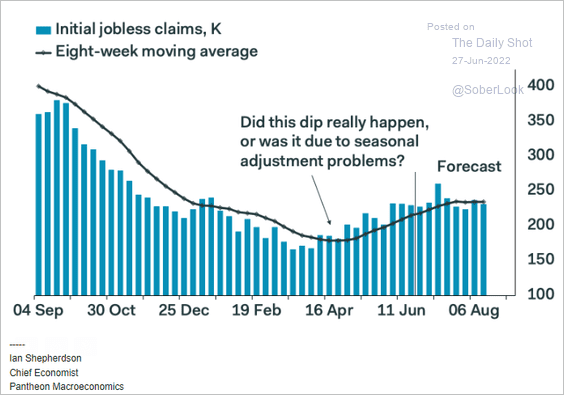
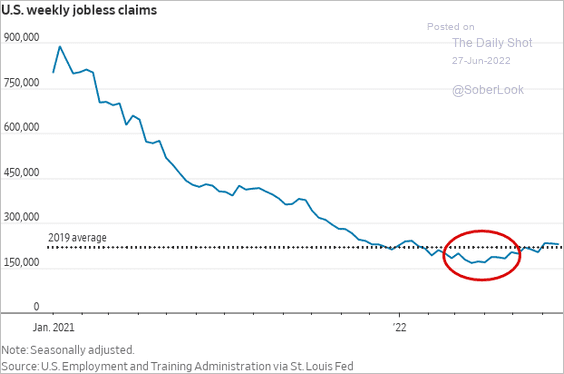
4. As discussed previously, what some have been calling an increase in unemployment claims is likely just a seasonal adjustment issue (see chart).
 Source: Pantheon Macroeconomics
 Source: @WSJ Read full article
5. Job postings on Indeed are drifting lower.

6. A survey from the Dallas Fed shows executives expecting supply chain issues to last more than 12 months.
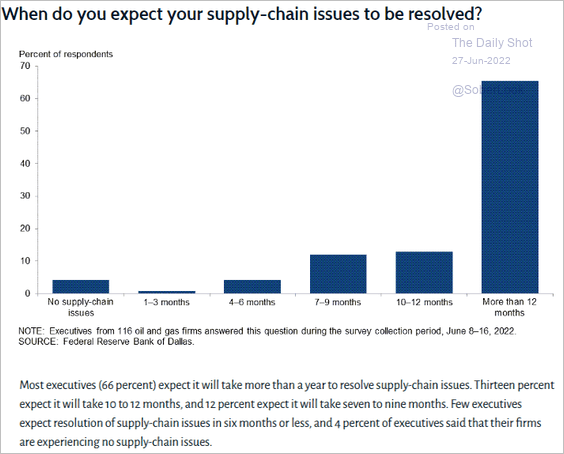 Source: Dallas Fed
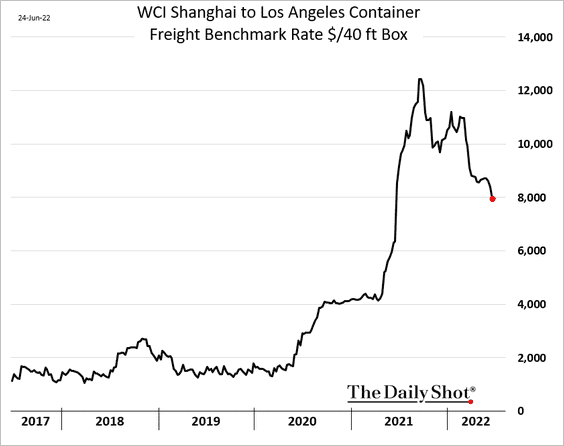
Nonetheless, container costs continue to decline.
——————–
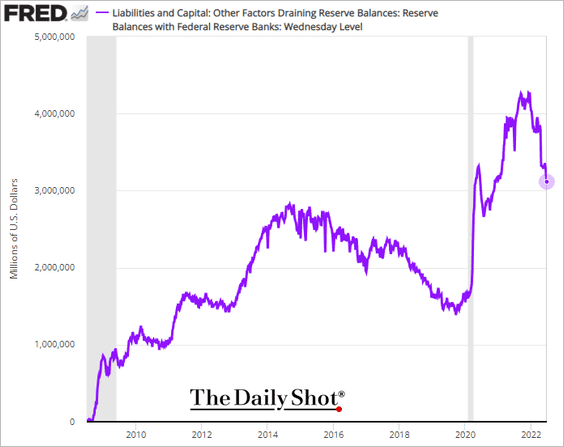
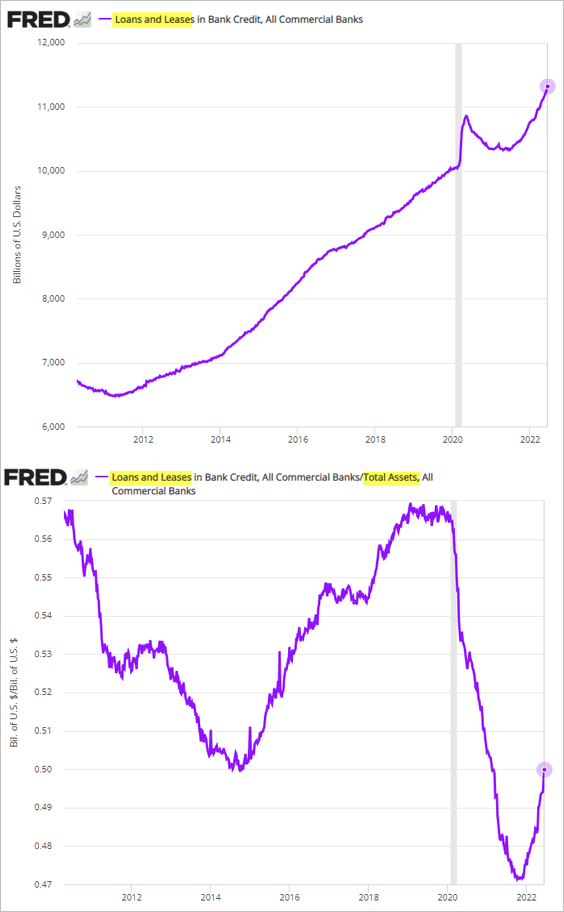
7. Reserves continue to move lower, driven mostly by the Fed’s RRP facility (as well as QT).
US bank loan growth has accelerated. The second panel shows the ratio of loans to total bank assets.
Back to Index
The United Kingdom
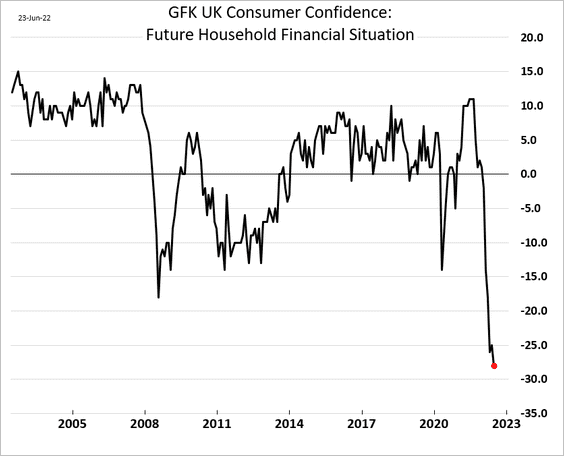
1. Britons view their financial future as hopeless.
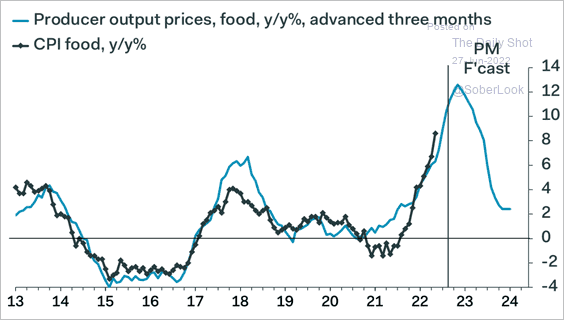
2. Food inflation could exceed 12% by the end of the year.
 Source: Pantheon Macroeconomics
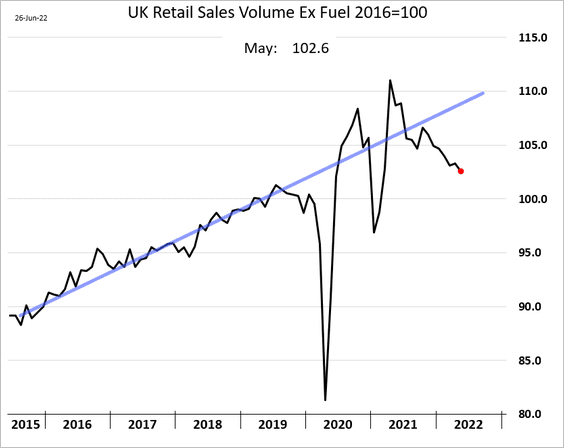
3. Real retail sales continue to fall.
4. Here is a look at the UK balance sheet (see comment below from Gavekal Research).
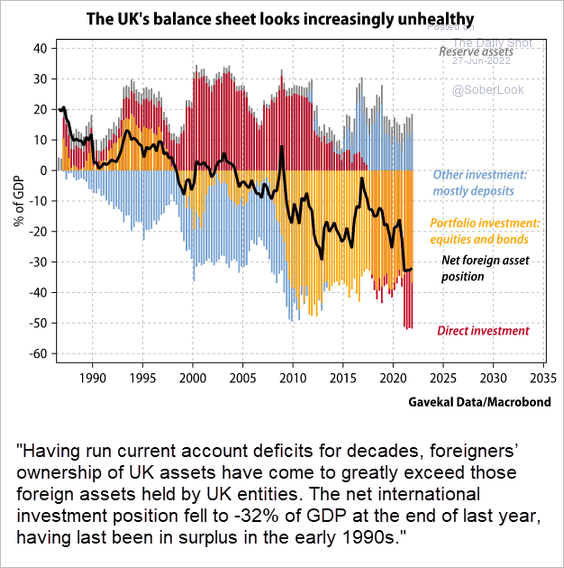 Source: Gavekal Research
Back to Index
The Eurozone
1. Germany’s Ifo expectations index declined in June.
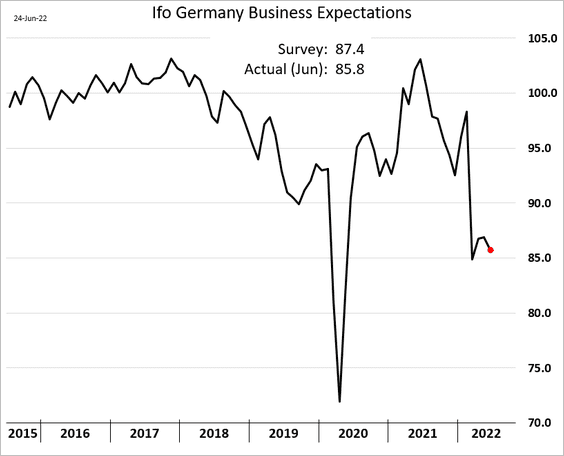
 Source: Reuters Read full article
Below are the trends by sector.
 Source: ifo Institute
——————–
2. Next, we have some CPI trends.
• Inflation breadth:
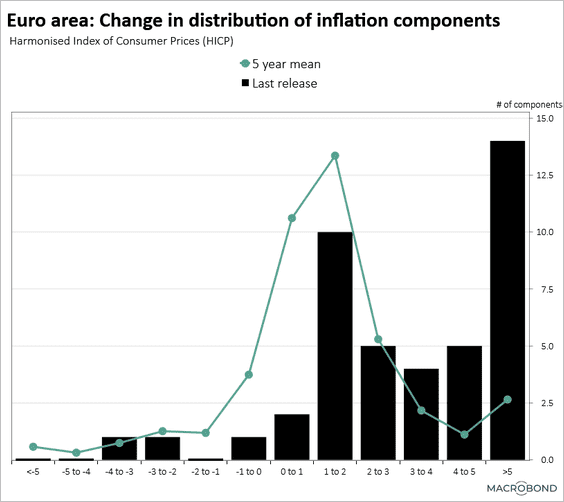 Source: Chart and data provided by Macrobond
• Dispersion:
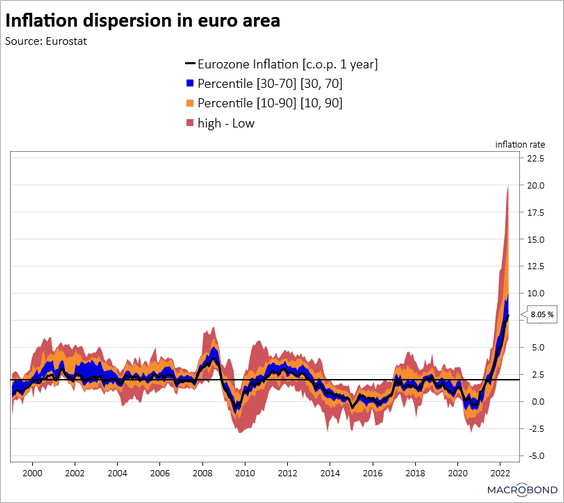 Source: Chart and data provided by Macrobond
• Measures of core inflation:
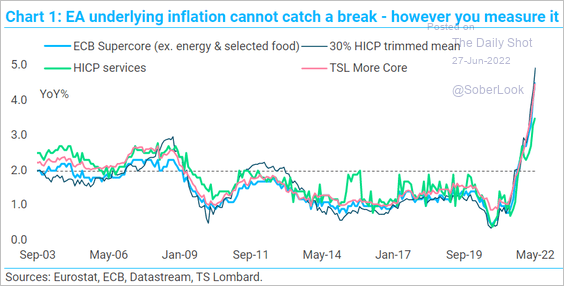 Source: TS Lombard
——————–
3. Euro-area’s real wage growth is deep in negative territory, pressuring consumer confidence.
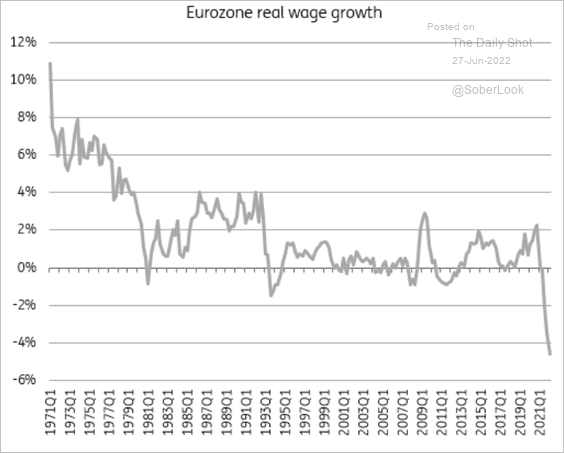 Source: ING
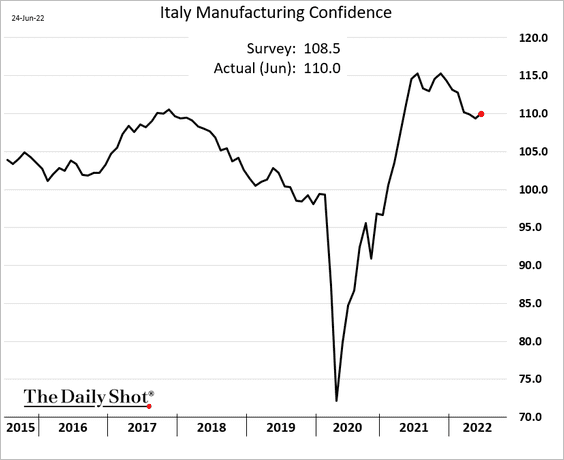
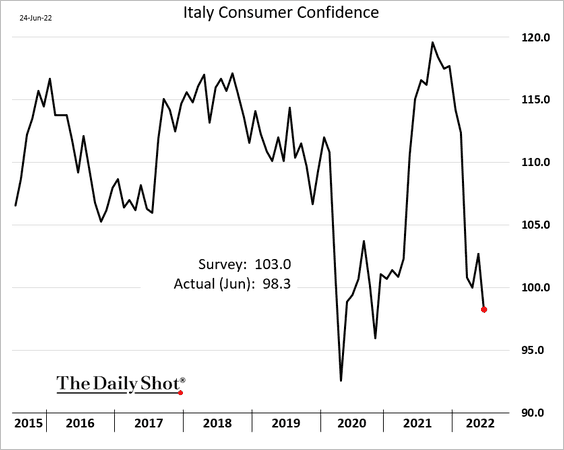
4. Italian sentiment indicators have diverged sharply.
• Manufacturing sentiment:
• Consumer sentiment:
Back to Index
Japan
1. Hedge funds have soured Japan’s equities (chart shows positioning in the Nikkei futures).

2. PMI data point to higher inflation ahead.
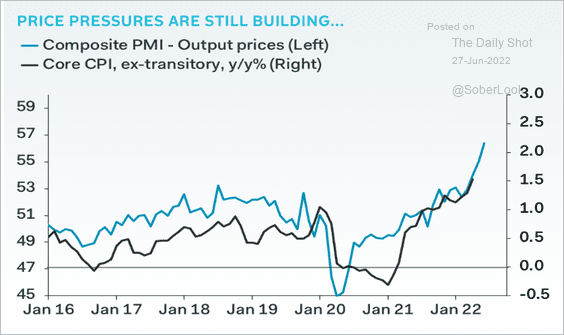 Source: Pantheon Macroeconomics
Back to Index
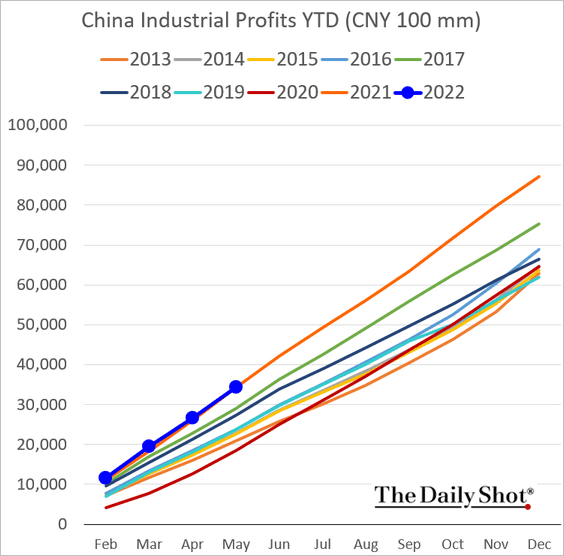
China
1. Industrial profits are following last year’s trajectory.
2. Will this year’s stimulus efforts be enough to meaningfully boost the economy?
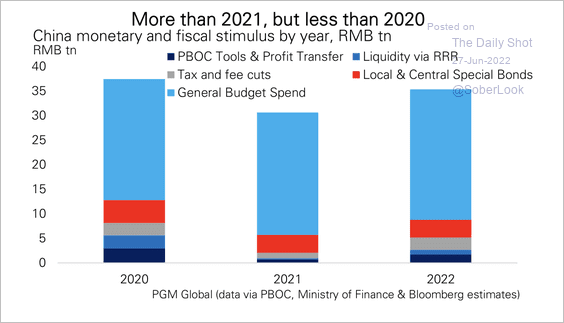 Source: PGM Global
Here is a breakdown of China’s stimulus plans.
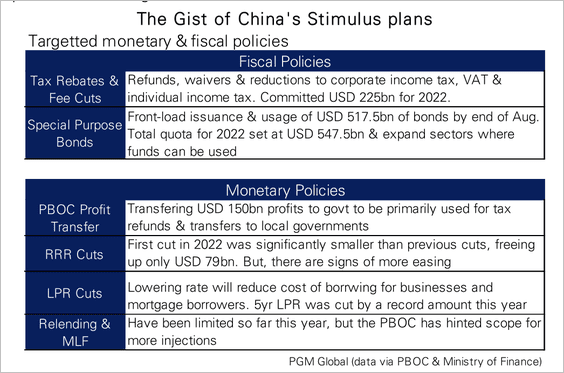 Source: PGM Global
Back to Index
Emerging Markets
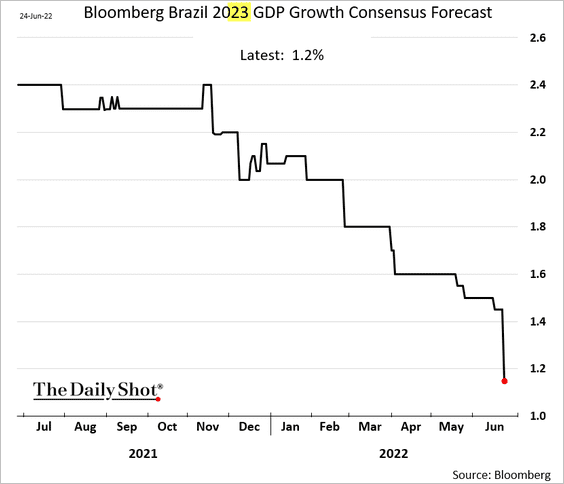
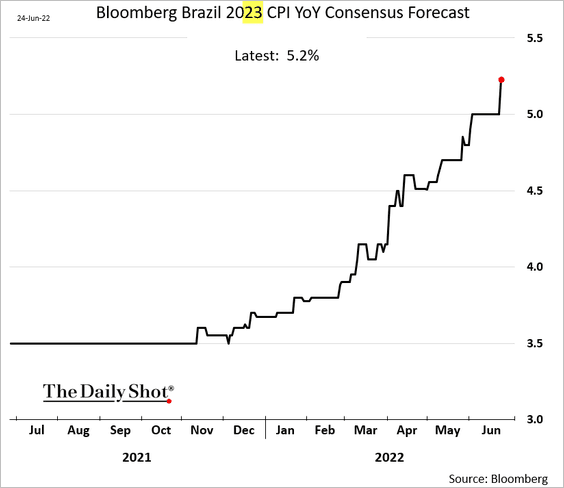
1. The risk of Brazil going into stagflation next year has risen.
• GDP forecasts for 2023:
• CPI forecast:
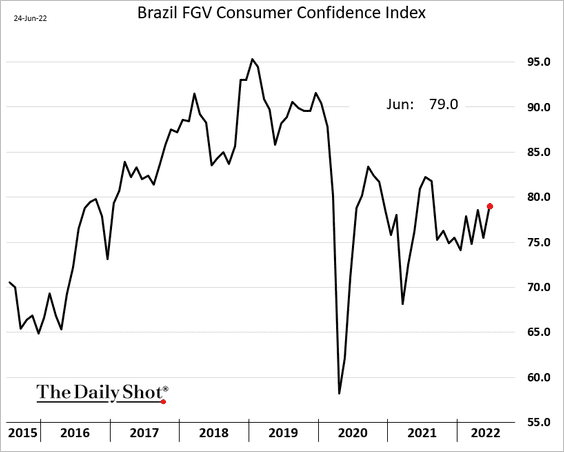
Brazil’s consumer confidence is grinding higher.
——————–
2. Mexico’s economic activity continues to recover.

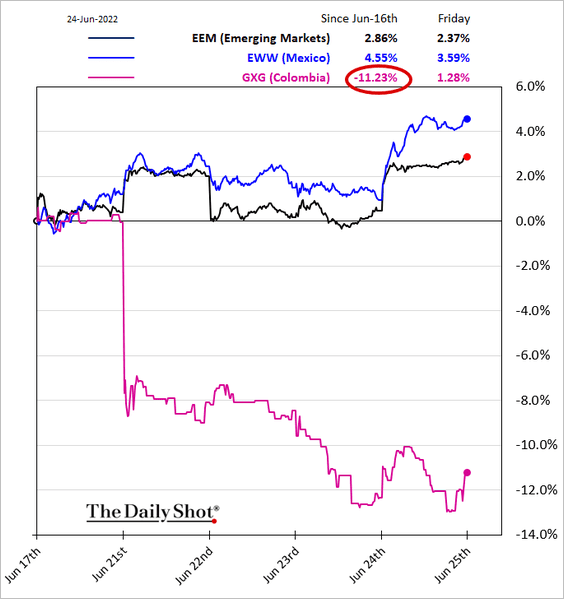
3. Colombia’s stocks, bonds, and currency took a hit last week after the election.
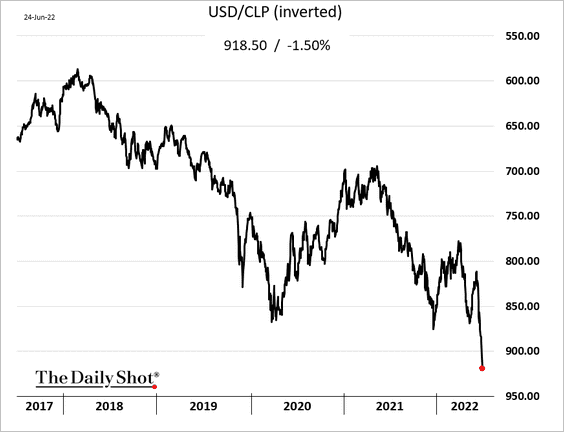
4. The Chilean peso is reaching new lows as commodities pull back. Is the peso oversold?
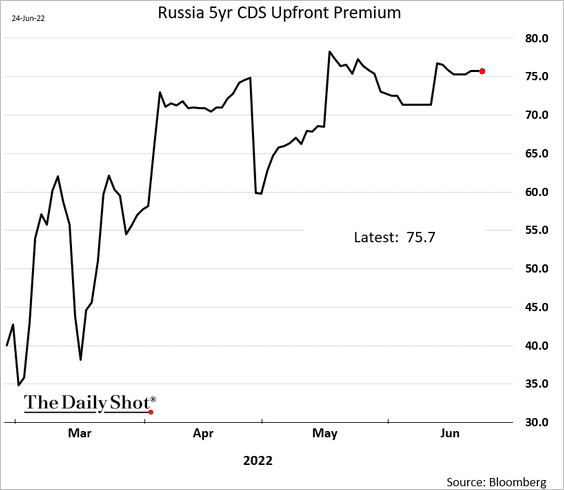
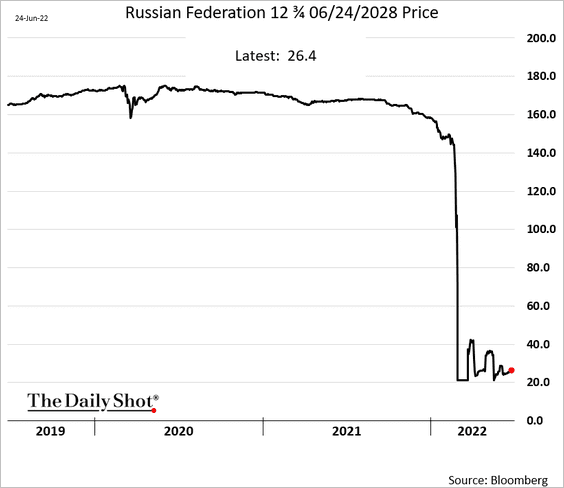
5. Russia is officially in default on external debt.
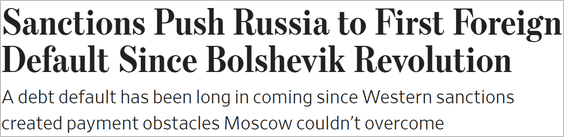 Source: @WSJ Read full article
The recovery is priced at about a quarter of par.
• CDS points:
• Bond price:
——————–
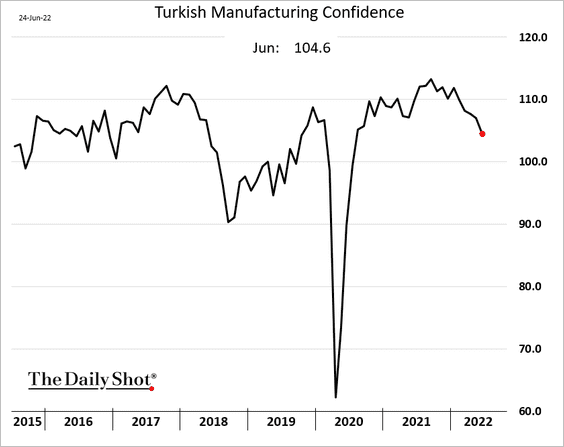
6. The Turkish lira jumped about 5% as the government took action to defend the beleaguered currency. Capital controls next?

 Source: Reuters Read full article
Separately, Turkish manufacturing confidence is rolling over.
——————–
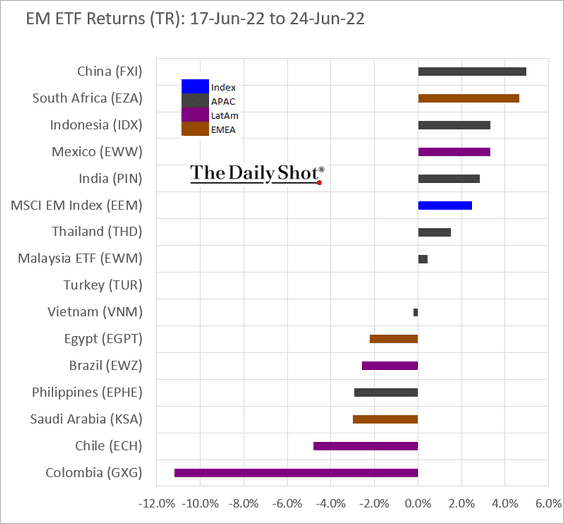
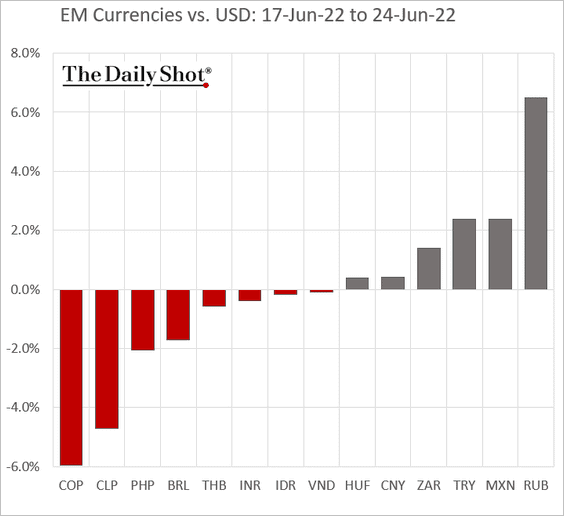
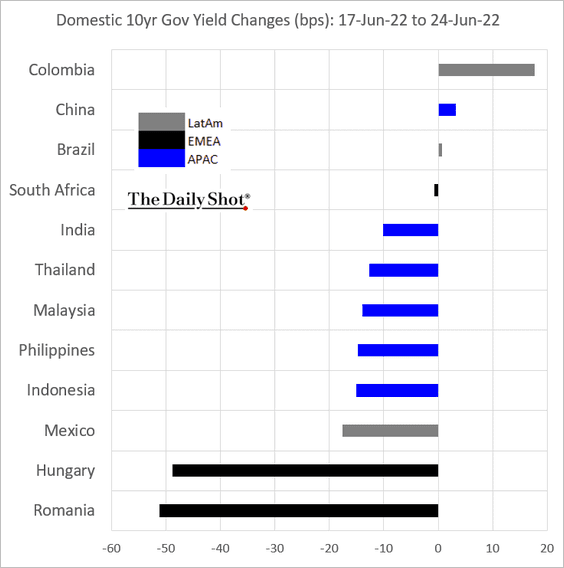
7. Next, we have some performance data from last week.
• Equity ETFs:
• Currencies:
• Local bonds:
Back to Index
Commodities
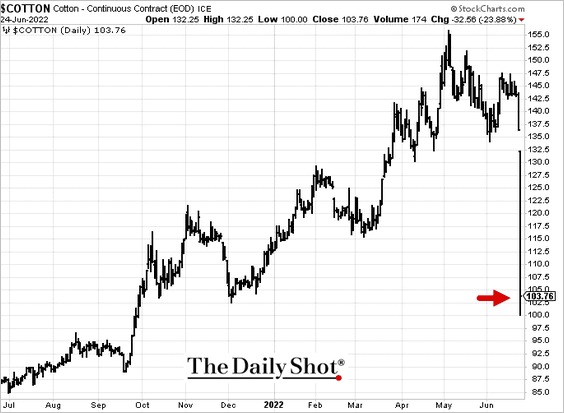
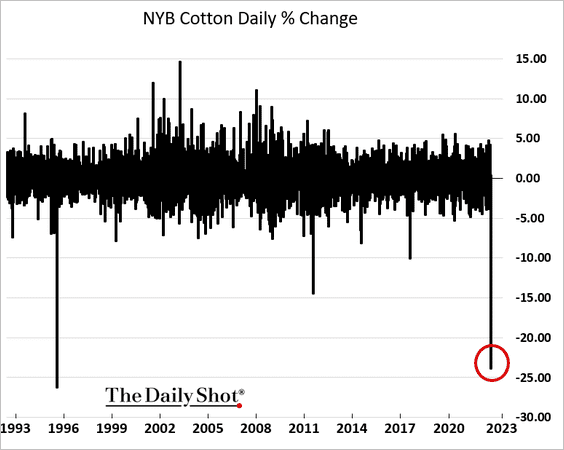
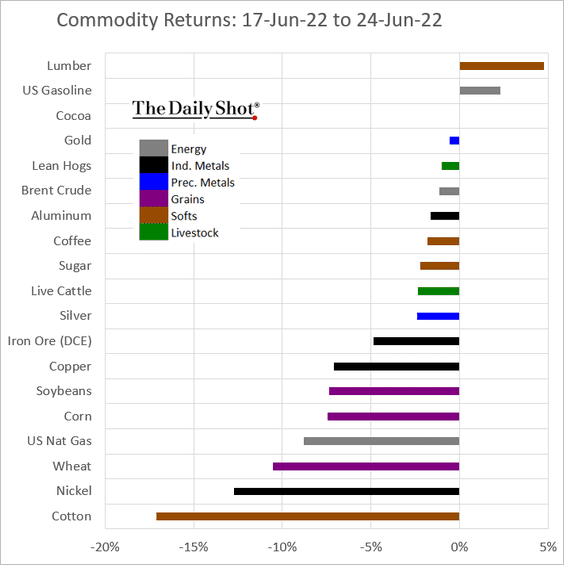
1. Cotton plummetted last week.
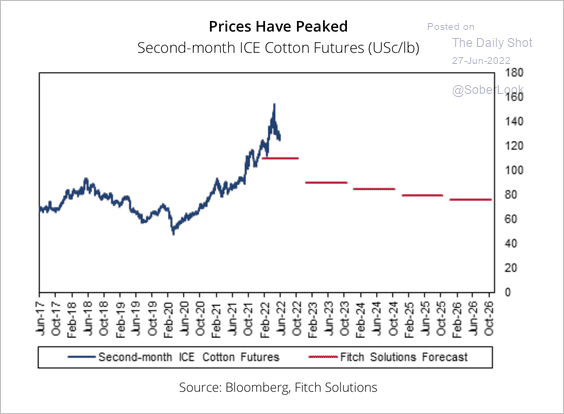
Fitch believes global cotton prices have peaked as demand weakened, while increased plantings and better weather could increase production.
 Source: Fitch Solutions Macro Research
Here is Bloomberg’s softs index.

——————–
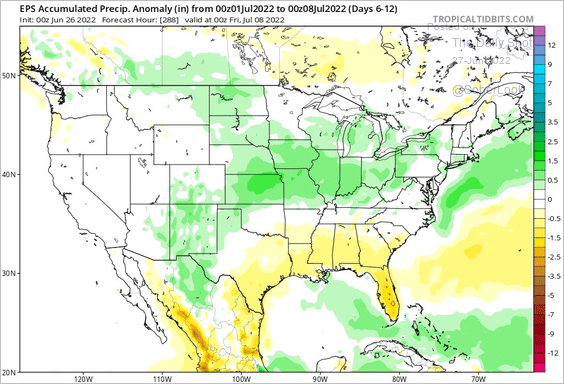
2. Weather forecasts show more rainfall across the US agriculture belt. Much different versus a week ago.
 Source: @bamwxcom
Rainfall should help lower drought intensity, although farmers have been forced to adjust to a volatile planting season.
 Source: Successful Farming Read full article
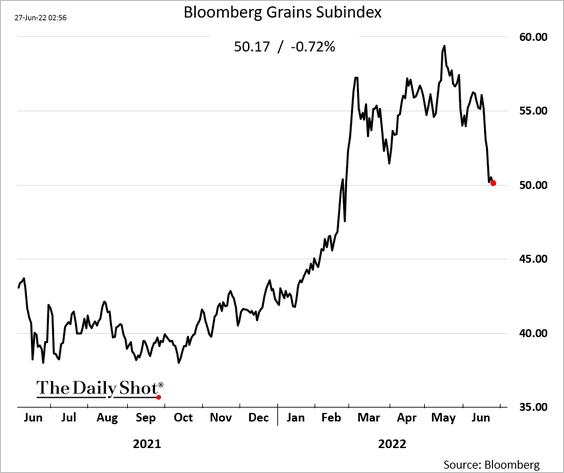
Here is Bloomberg’s grains index.
——————–
3. Finally, we have last week’s performance across key commodity markets.
Back to Index
Energy
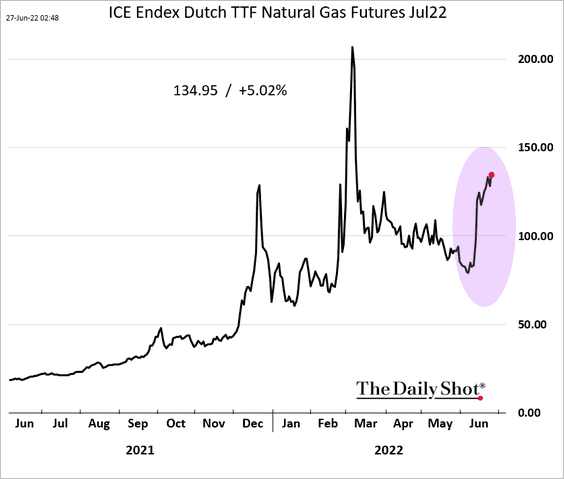
1. European natural gas futures continue to climb.
2. Crack spreads have surged across the board.
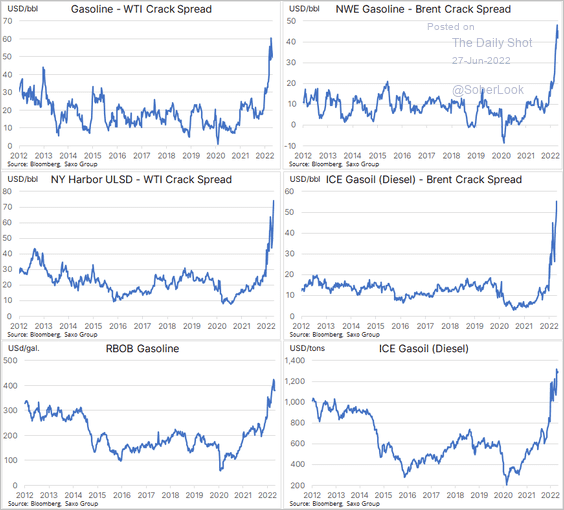 Source: @Ole_S_Hansen
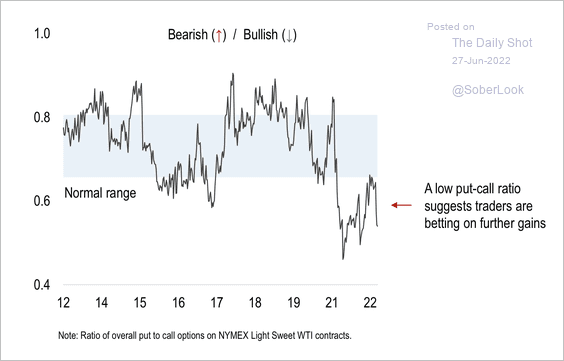
3. The put/call ratio in WTI crude oil contracts remains low.
 Source: Numera Analytics
Back to Index
Equities
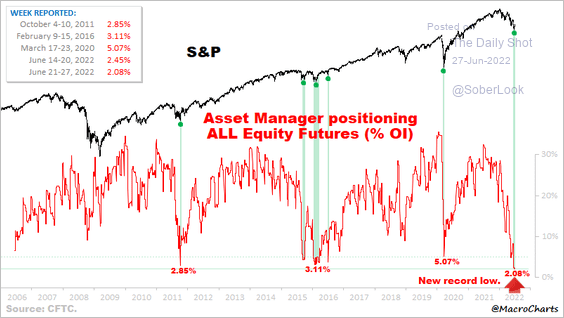
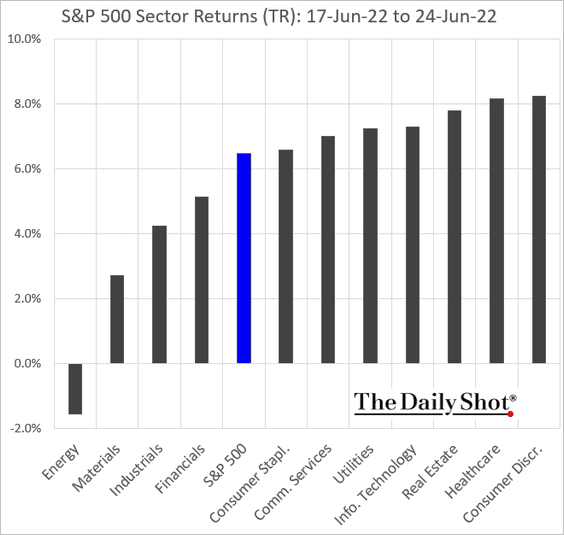
1. Stocks staged a relief rally, with the S&P 500 up 6.45% last week, …
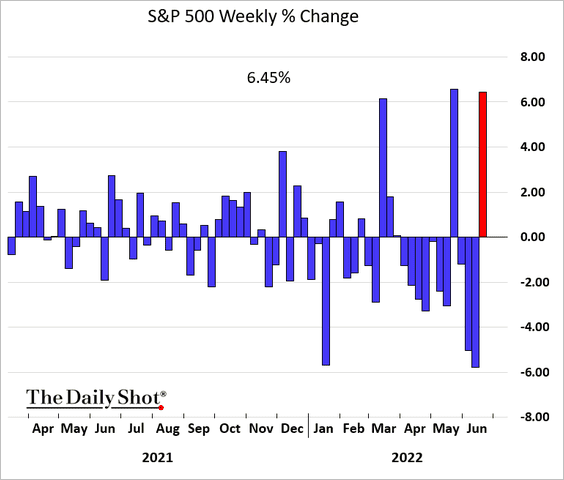
… amid extreme bearishness.
 Source: @MacroCharts
——————–
2. Retail investor positioning has not fallen with sentiment.
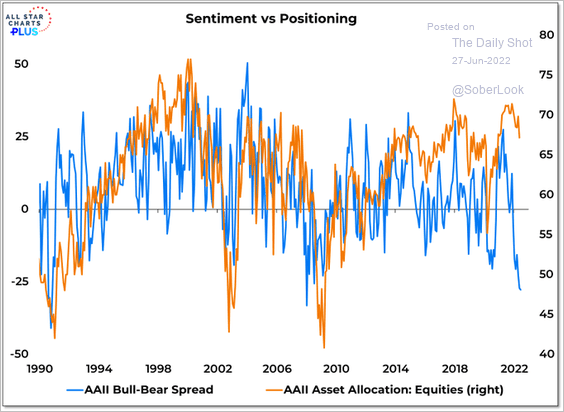 Source: @WillieDelwiche
Retail cash balances have been rising.
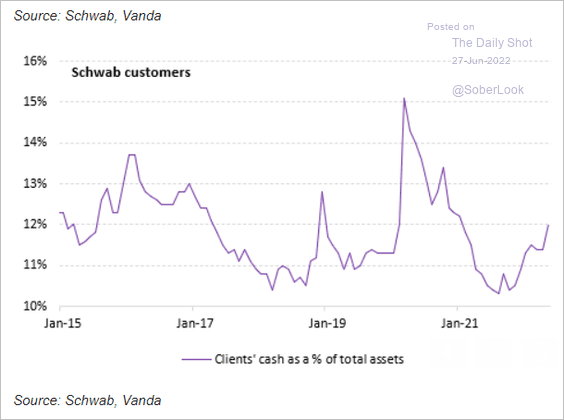 Source: Vanda Research
——————–
3. The Nasdaq 100 held support at the 200-week moving average.
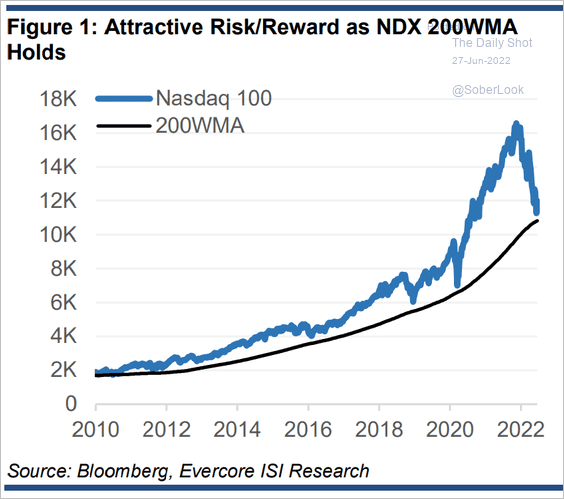 Source: Evercore ISI Research
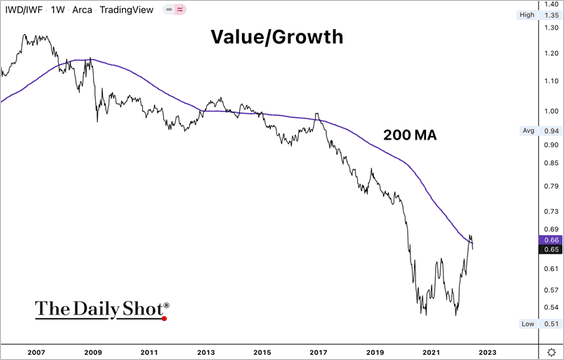
The iShares Russell 1,000 Value ETF (IWD) is testing resistance relative to the iShares Russell 1,000 Growth ETF (IWF).
——————–
4. The US equity market’s relative performance has diverged from the US dollar.
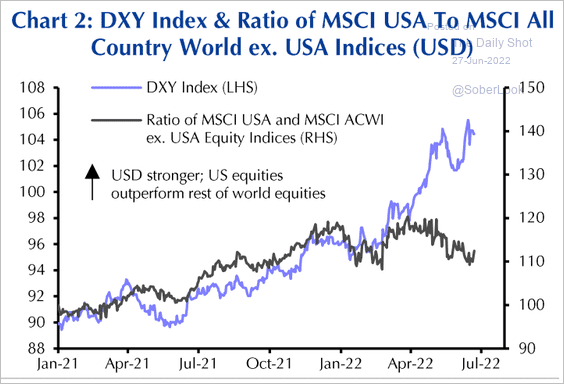 Source: Capital Economics
5. Where do US firms generate their profits?
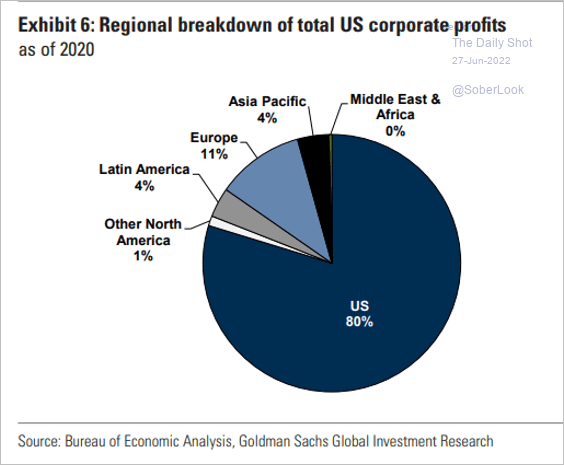 Source: Goldman Sachs; @MikeZaccardi
• The capitalization of US equities represents approximately 60% of global markets.
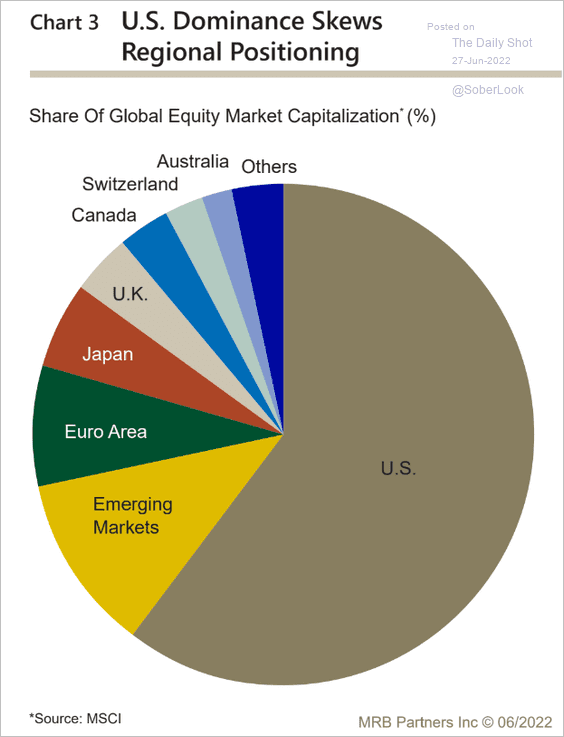 Source: MRB Partners
• This chart shows broad equity sector composition across advanced economies.
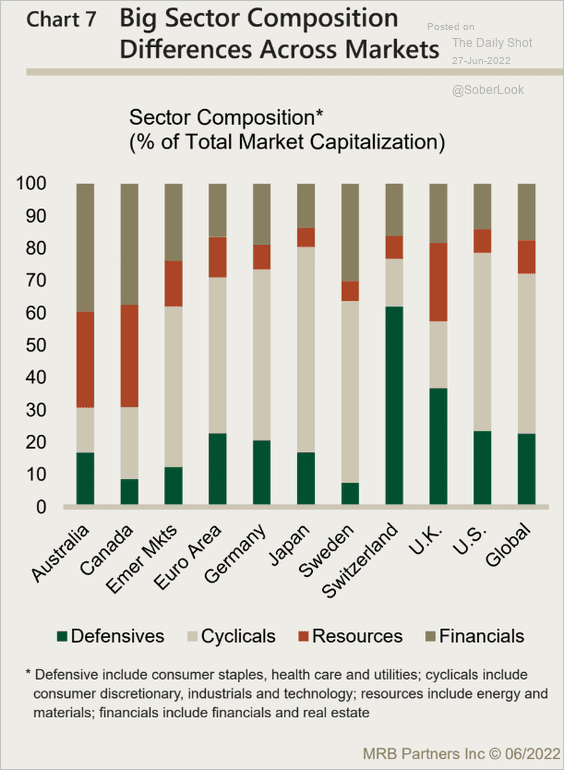 Source: MRB Partners
——————–
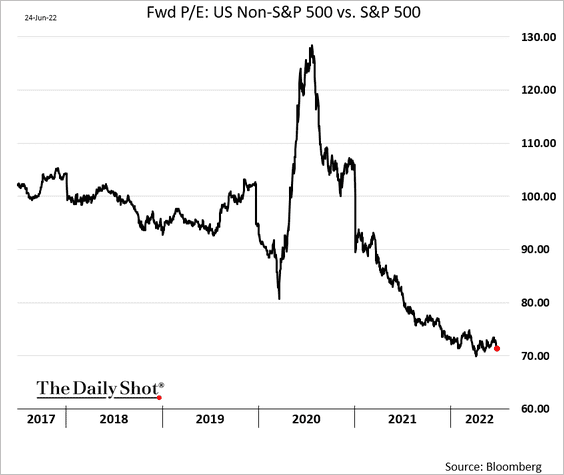
6. The S&P 500 continues to trade at a significant premium to the rest of the US market.
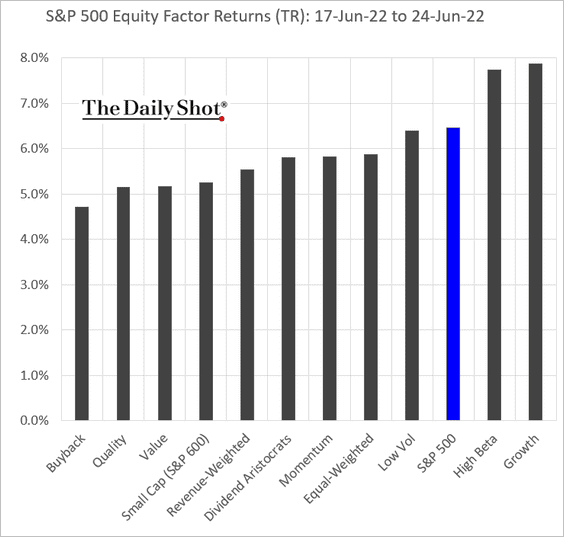
7. Next, we have some market performance data from last week.
• Sectors:
• Equity factors:
• Thematic ETFs:

• Largest tech firms:

Back to Index
Credit
1. US investment-grade bond spreads (OAS) have diverted from equity vol (VIX).
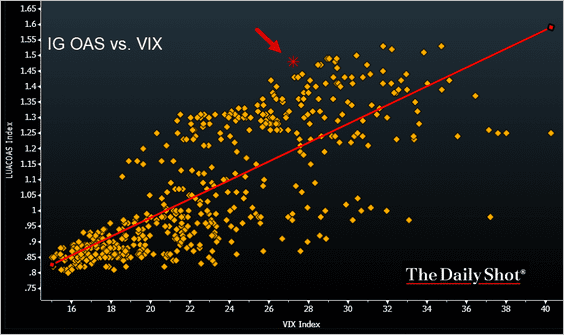 Source: @TheTerminal, Bloomberg Finance L.P.
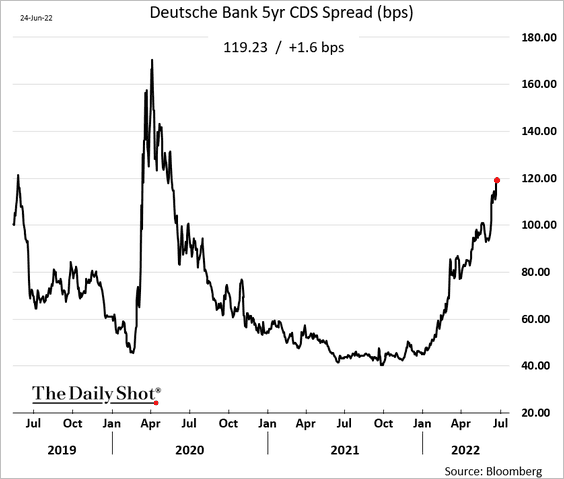
2. European investment-grade spreads are at “crisis” levels.
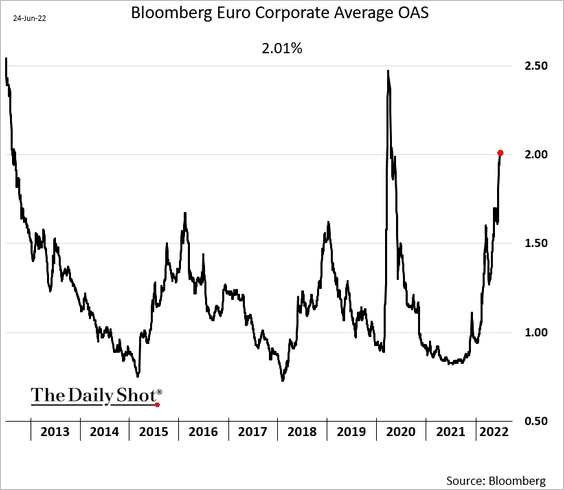
Dealer credit default swap spreads have risen sharply this year.
——————–
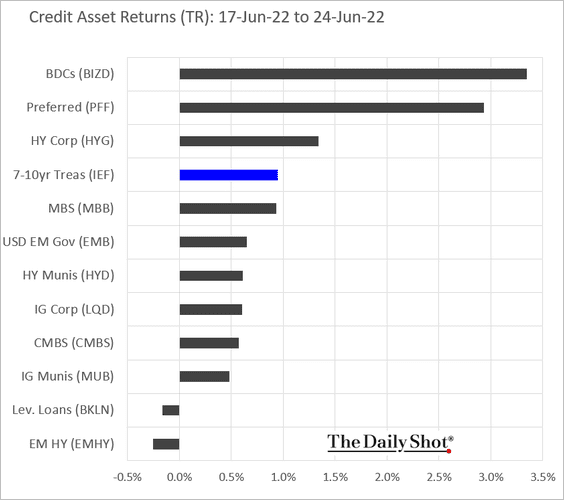
3. Next, we have last week’s performance by asset class.
Back to Index
Rates
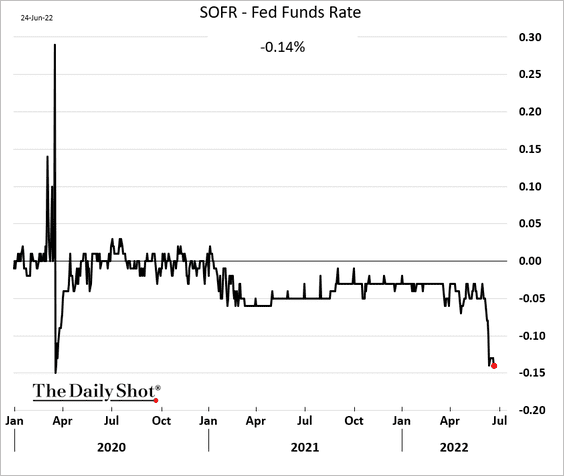
SOFR (based on overnight repo rates) is now well below the fed funds rate (due to extreme demand for cash instruments). Will the Fed get involved in the repo market?
Futures suggest that the above discrepancy should fade later this year.
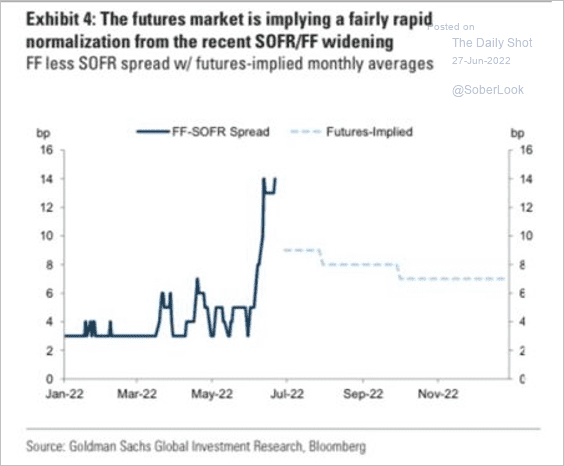 Source: Goldman Sachs
Back to Index
Global Developments
1. Inflation has decoupled from commodities as service prices surge.
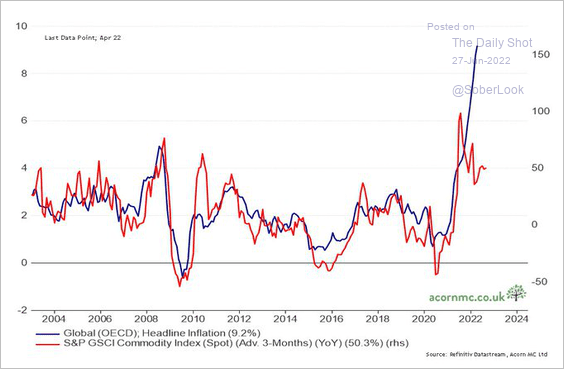 Source: @RichardDias_CFA
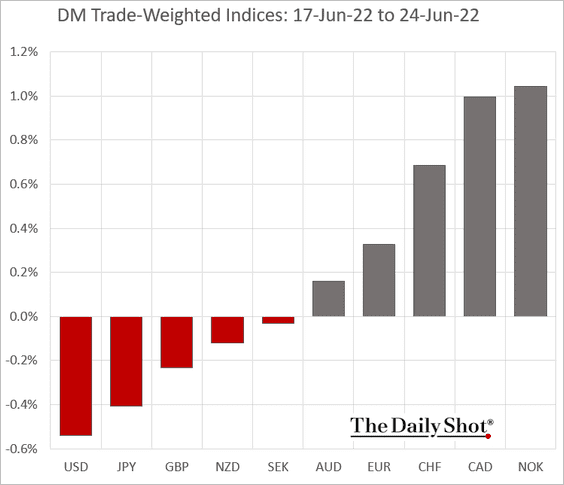
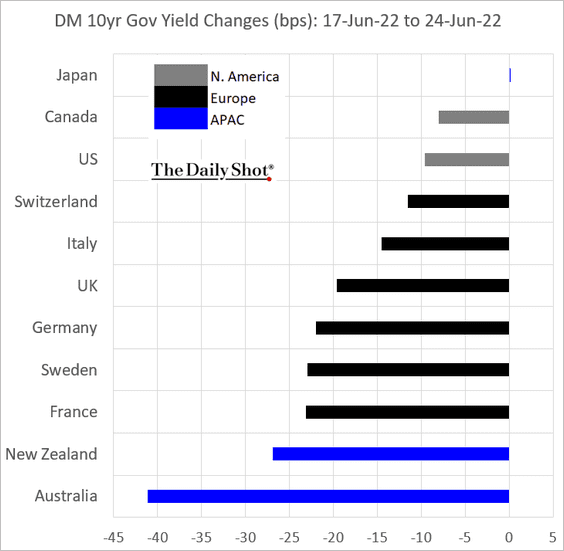
2. Next, we have some performance data from last week.
• Trade-weighted currency indices:
• DM bond yields:
——————–
Food for Thought
1. US lithium-ion battery imports:
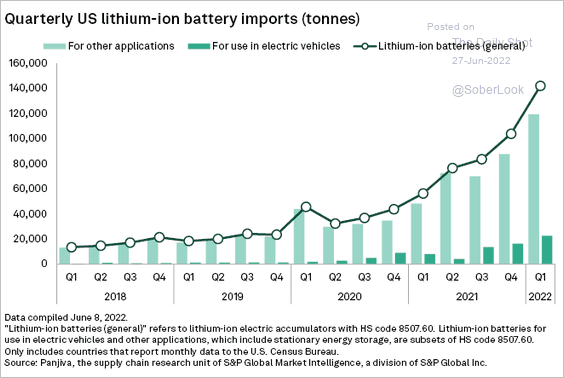 Source: S&P Global Market Intelligence
2. LEGO’s financial performance in 2021:
 Source: @chartrdaily
3. What does it mean to be wealthy?
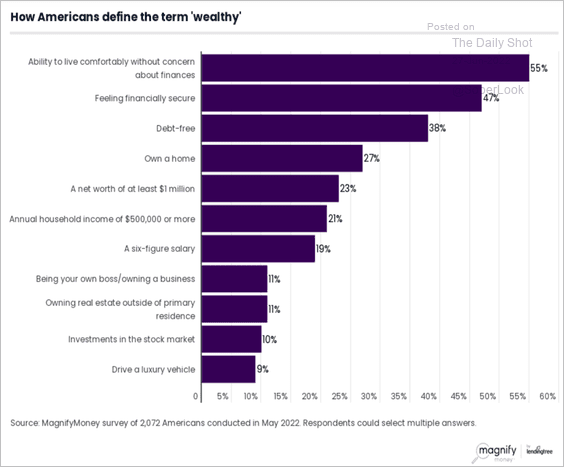 Source: MagnifyMoney Read full article
4. Population trends in select states:
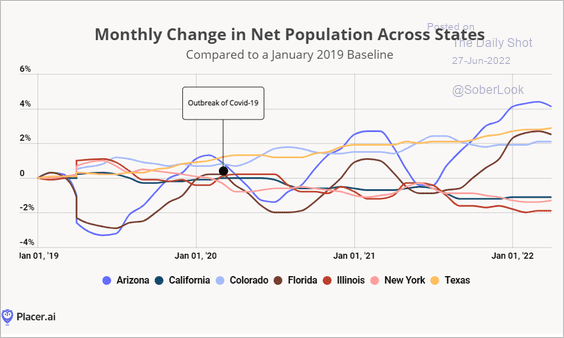 Source: Placer.ai
5. Abortion access status by state:
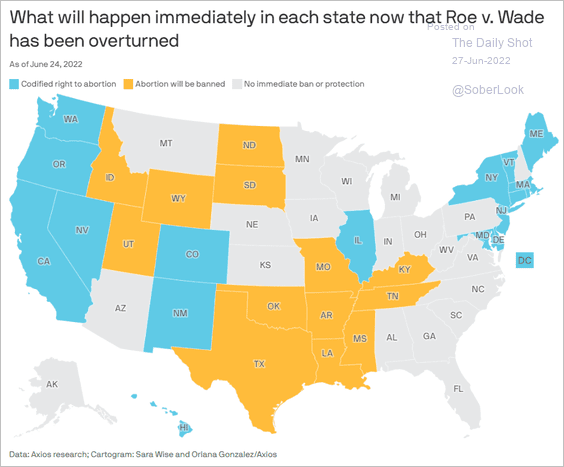 Source: @axios Read full article
Distance to the nearest abortion provider:
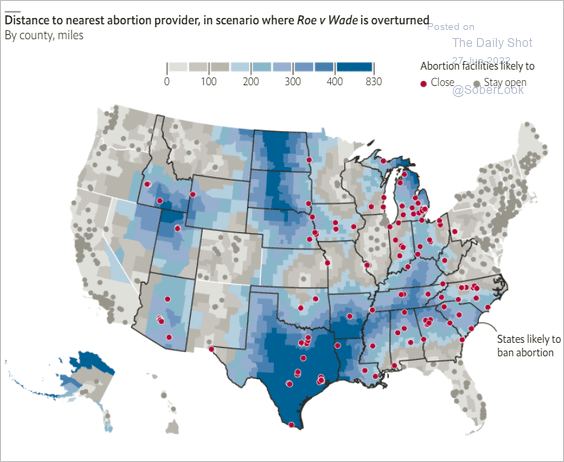 Source: The Economist Read full article
——————–
6. Annual working hours per worker:
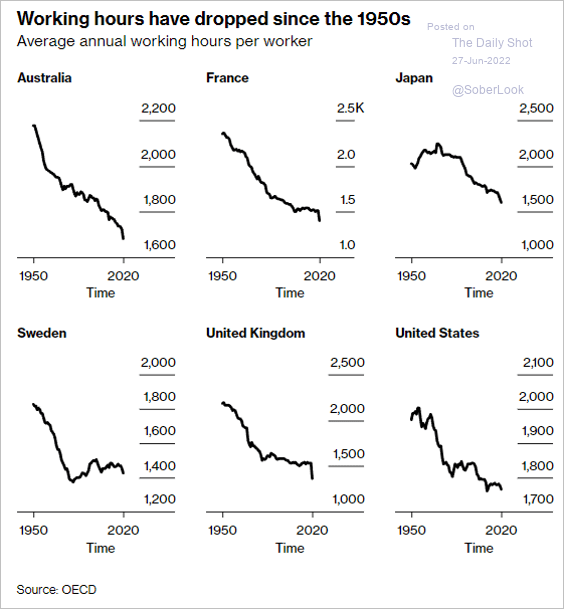 Source: @wealth Read full article
7. Maritime traffic around the world:
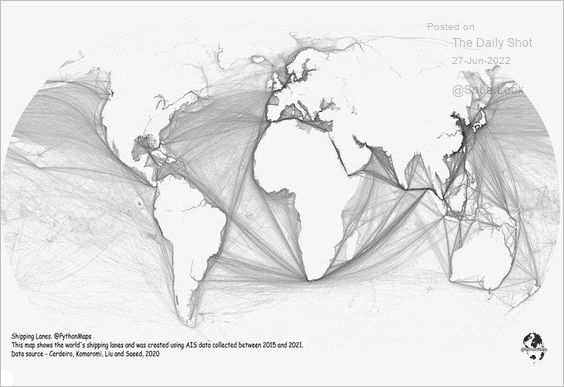 Source: @VisualCap, @PythonMaps Read full article
——————–
Back to Index