
The Daily Shot: 01-Jul-22
• Administrative Update
• The United States
• Canada
• The Eurozone
• Europe
• Japan
• Asia – Pacific
• China
• Emerging Markets
• Commodities
• Energy
• Equities
• Credit
• Rates
• Global Developments
• Food for Thought
Administrative Update
1. Please note that The Daily Shot will not be published on Monday, July 4th.
2. If you post materials from The Daily Shot on Twitter, we ask that you please credit @SoberLook or @TheDailyShot.
Back to Index
The United States
1. The May consumer spending report surprised to the downside.
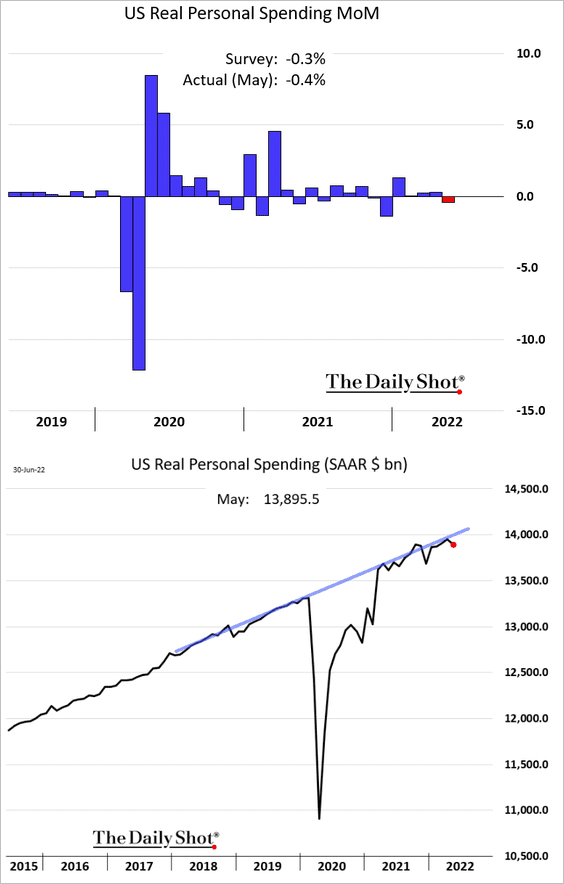
Households reduced expenditures on goods, but service spending continued to climb.
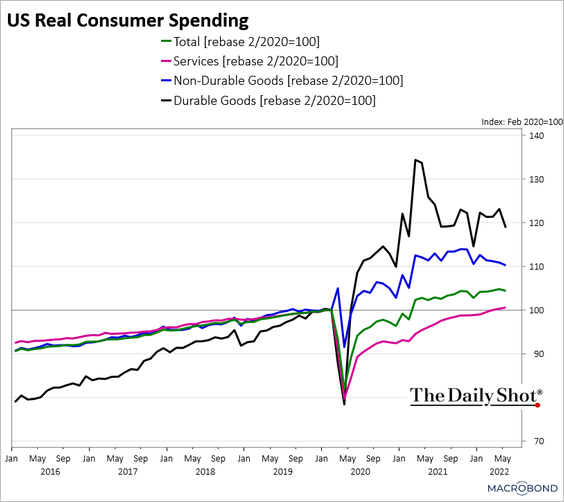 Source: Chart and data provided by Macrobond
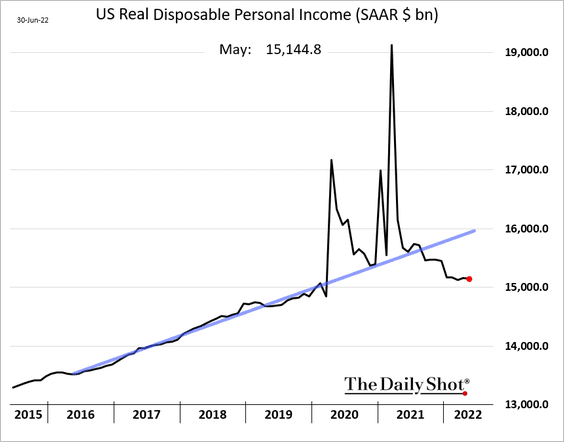
2. Real income, excluding government payments, is still grinding higher.
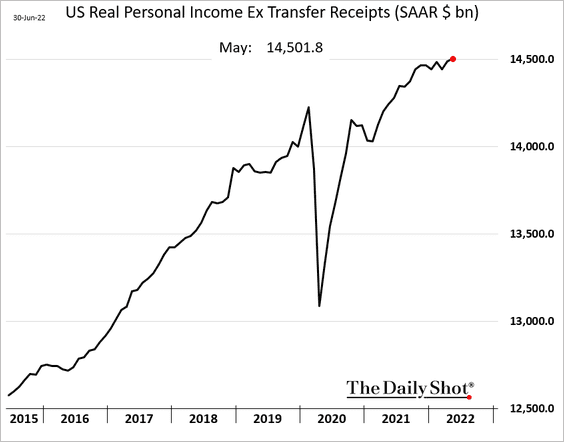
Total disposable income has been treading water in recent months.
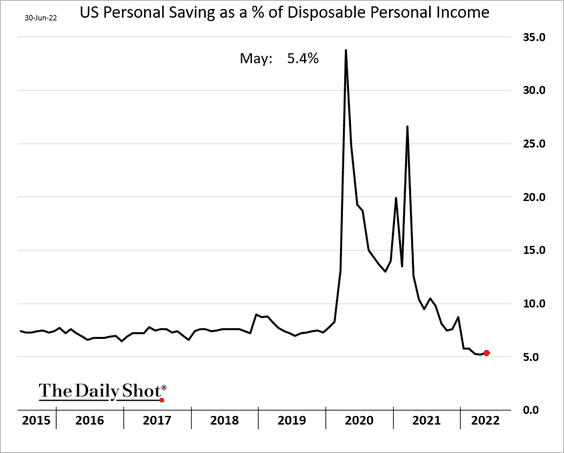
3. Savings edged higher in May.
——————–
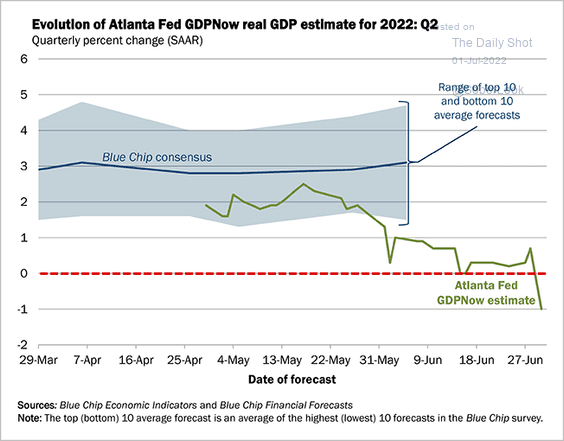
4. The Atlanta Fed GDPNow Q2 model estimate dipped into negative territory after the consumer spending report. A GDP contraction in Q2 would technically mean recession.
 Source: @AtlantaFed Read full article
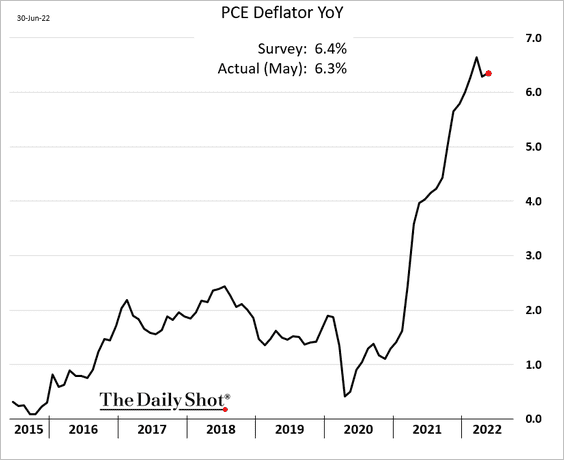
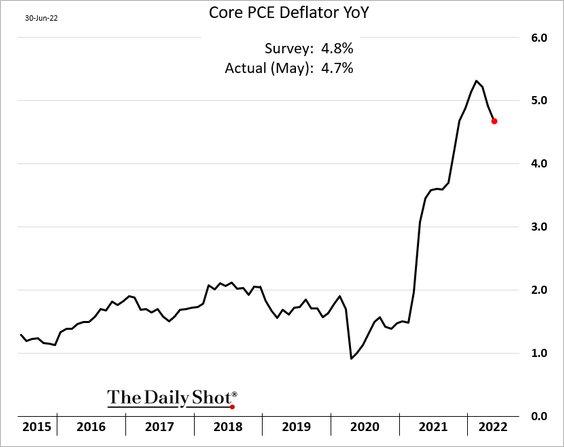
5. The PCE inflation report was a bit below forecasts.
Here is the core PCE (a hopeful sign?).
This chart shows the key contributions to PCE inflation (monthly changes).
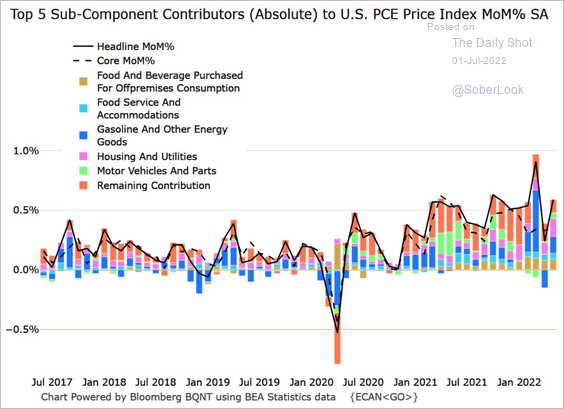 Source: @M_McDonough
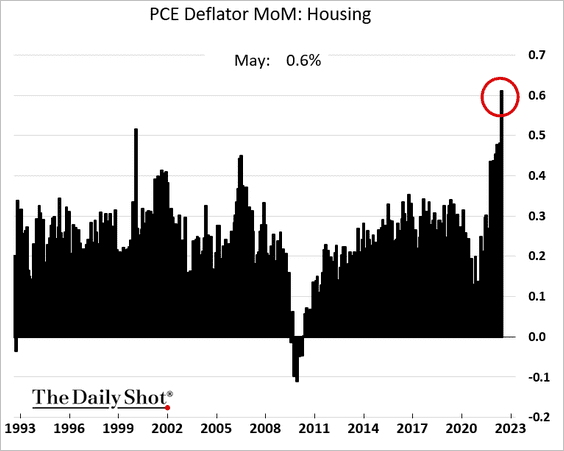
Housing continues to pose upside risks for consumer inflation.
——————–
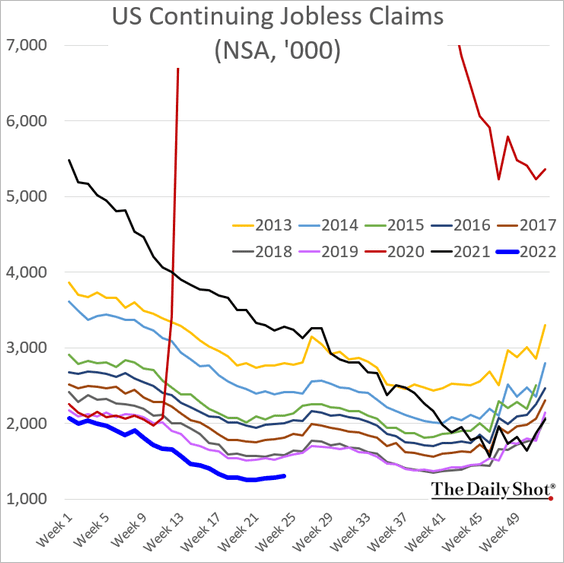
6. Initial jobless claims are at multi-year lows for this time of the year.
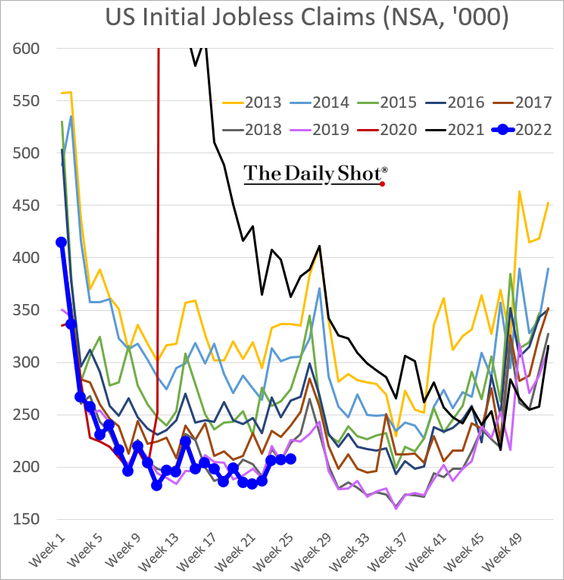
Continuing claims are also very low.
——————–
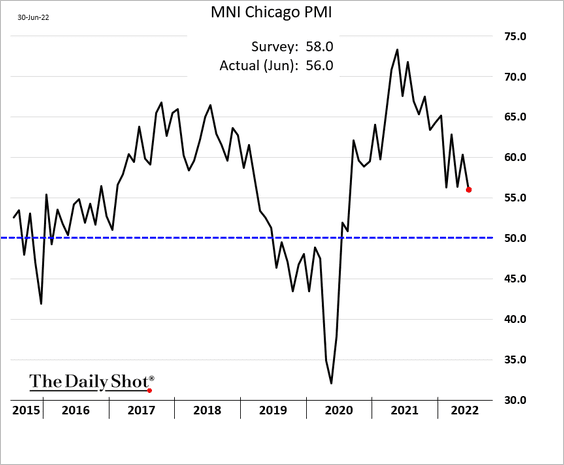
7. The MNI Chicago PMI index was lower than expected, but the region’s business activity is still in growth territory.
• Data from China points to downside risks for the Chicago PMI.
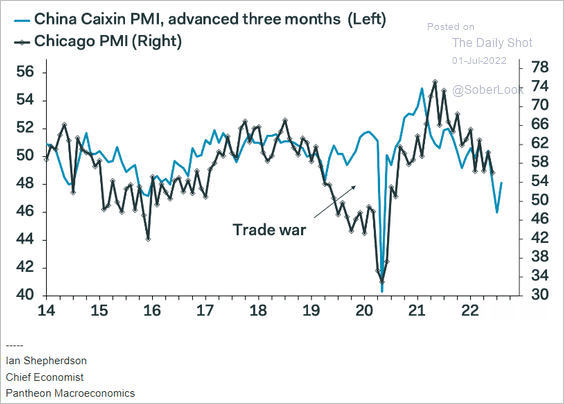 Source: Pantheon Macroeconomics
• Regional factory surveys point to a contraction in factory activity at the national level (ISM) in June.
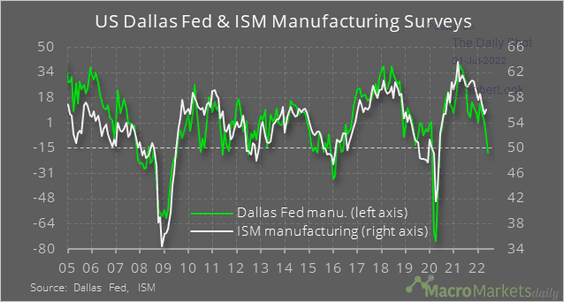 Source: @macro_daily
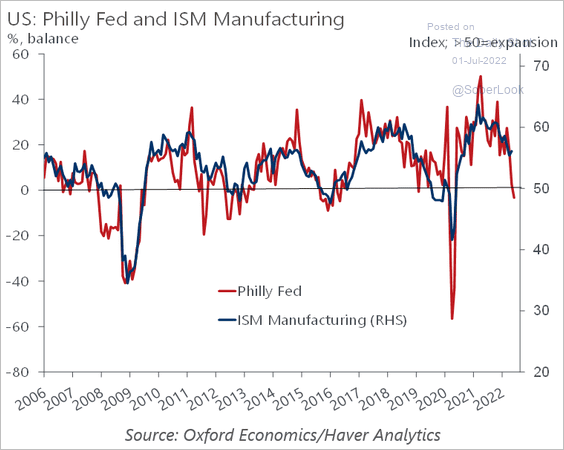 Source: Oxford Economics
Given the global policy tightening, a US manufacturing recession is very likely in the months ahead.
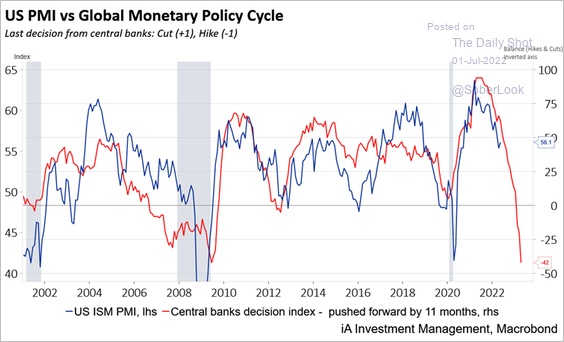 Source: Industrial Alliance Investment Management
——————–
8. Consumer confidence continues to deteriorate.
• BofA:
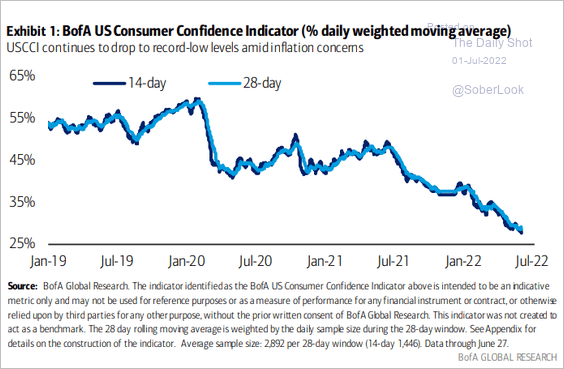 Source: BofA Global Research
• Gallup:
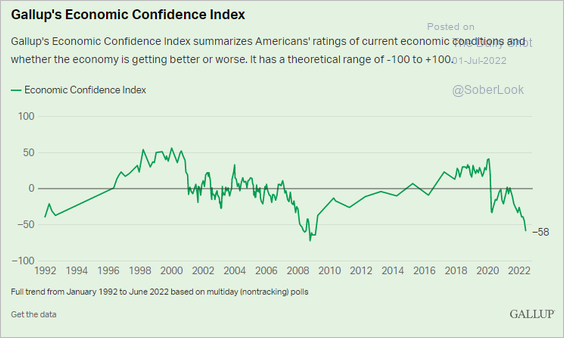 Source: Gallup Read full article
——————–
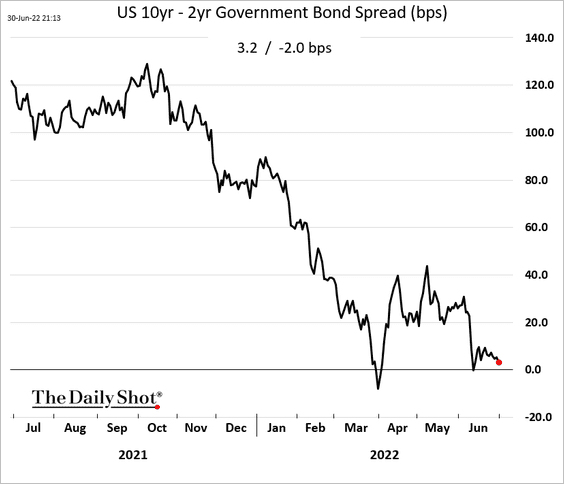
9. Recession fears sent the 10-year Treasury yield below 3%.
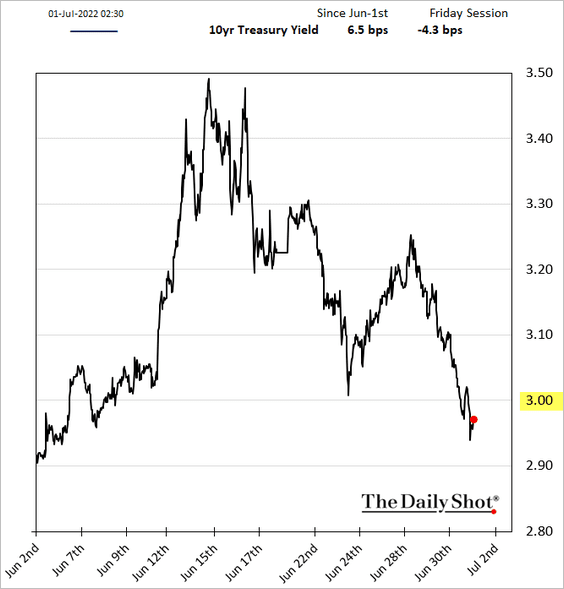
The yield curve is flirting with inversion again.
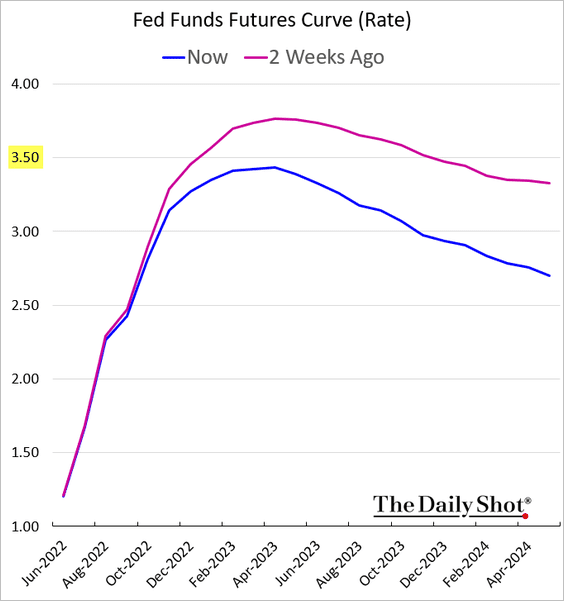
The market no longer expects the Fed to take rates above 3.5%.
Back to Index
Canada
1. Canada’s GDP continues to climb.
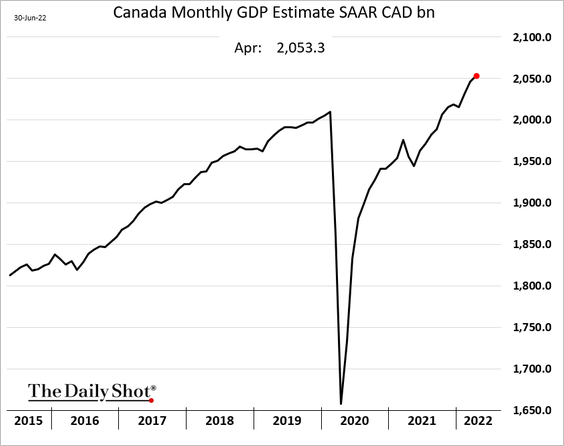
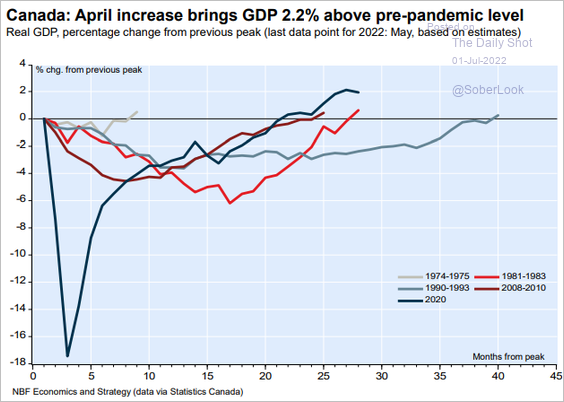 Source: Economics and Strategy Group, National Bank of Canada
——————–
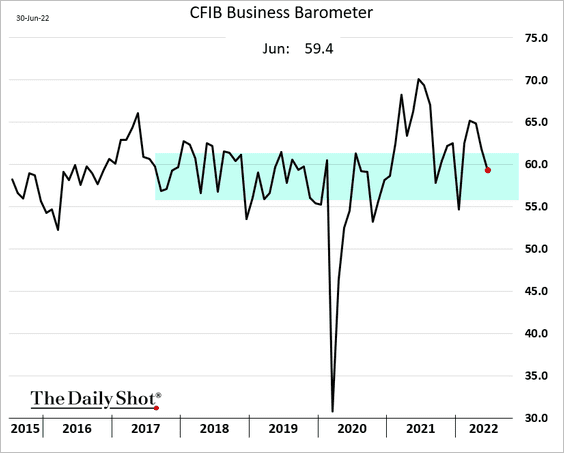
2. The CFIB small/medium-size business index is back inside the pre-COVID range.
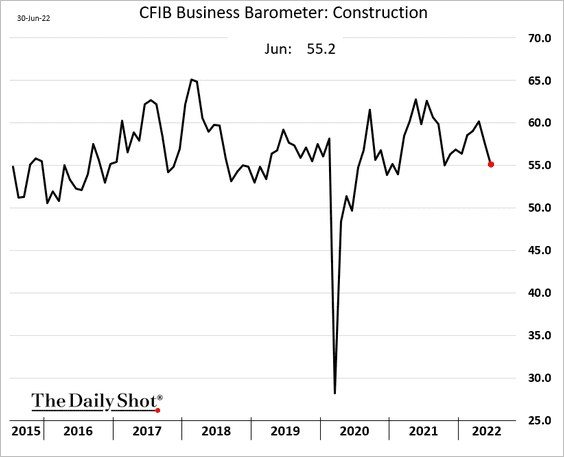
Here are some sector trends.
• Construction:
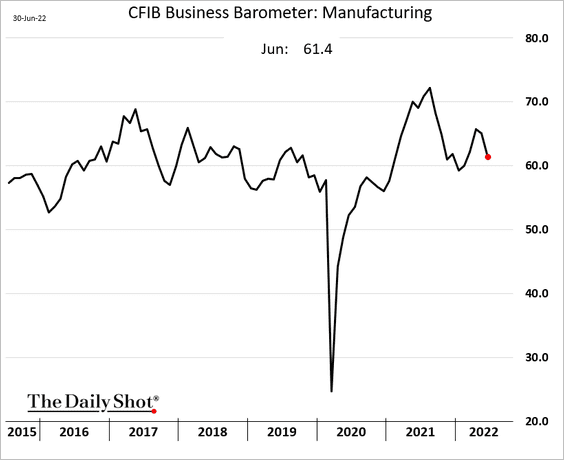
• Manufacturing:
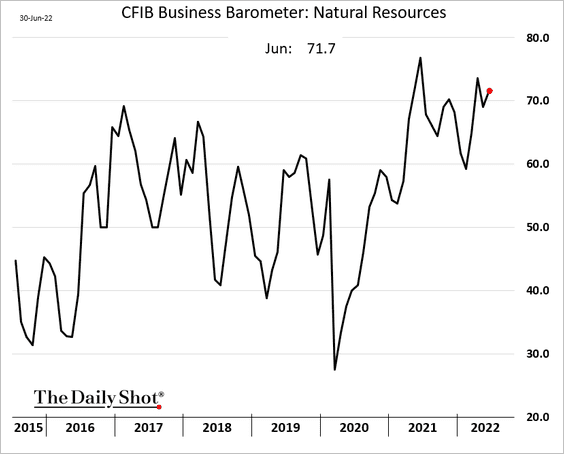
• Natural resources:
Back to Index
The Eurozone
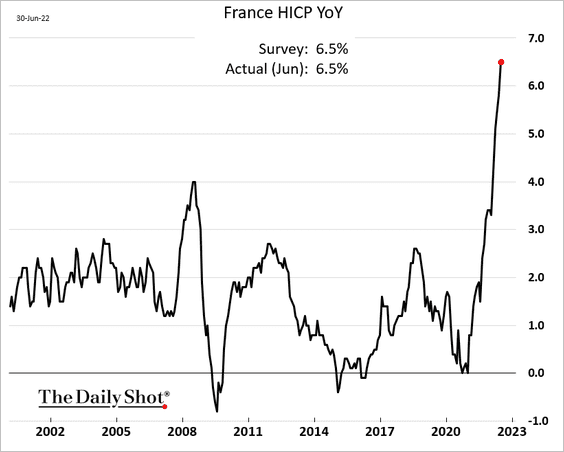
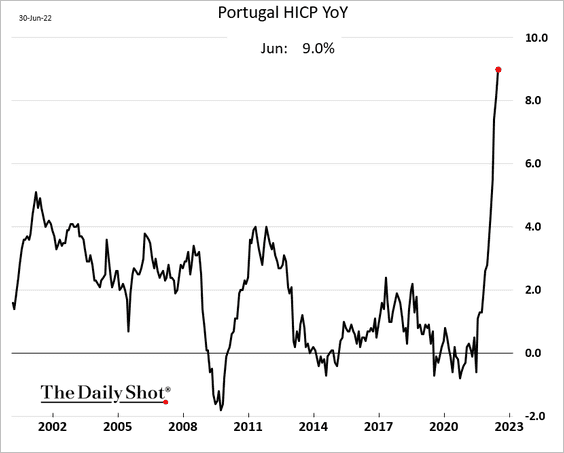
1. June inflation reports remain ugly.
• France:
• Portugal:
——————–
2. German unemployment ticked higher.
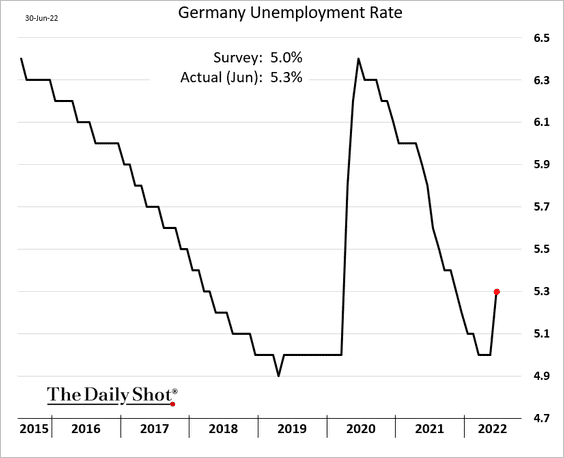
 Source: Reuters Read full article
Italy’s unemployment rate continues to fall.
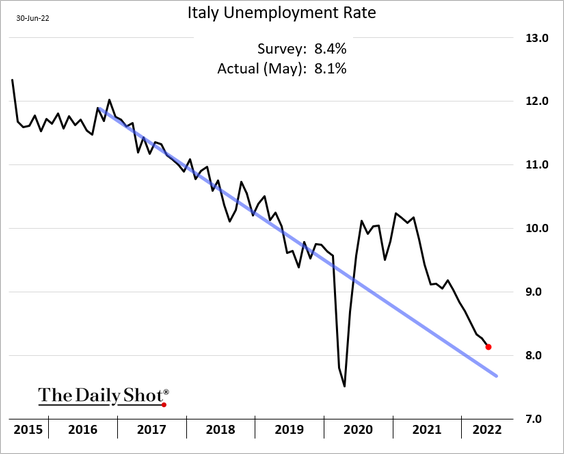
At the Eurozone level, the unemployment rate hit a new low.
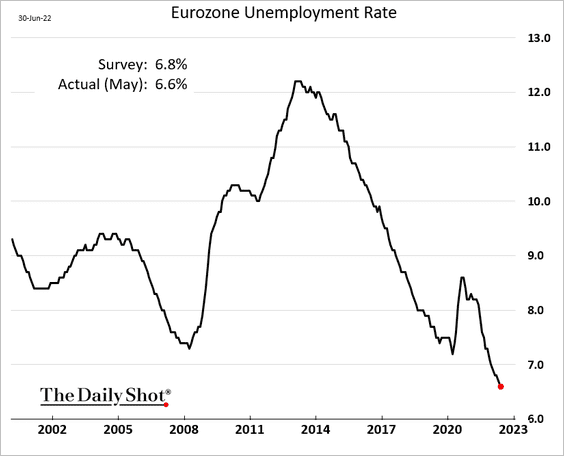
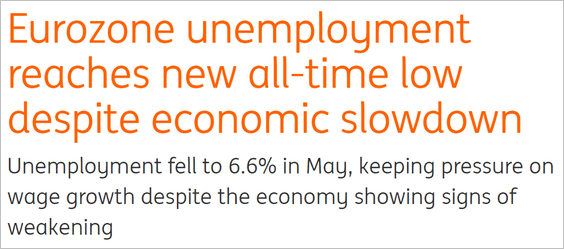 Source: ING Read full article
——————–
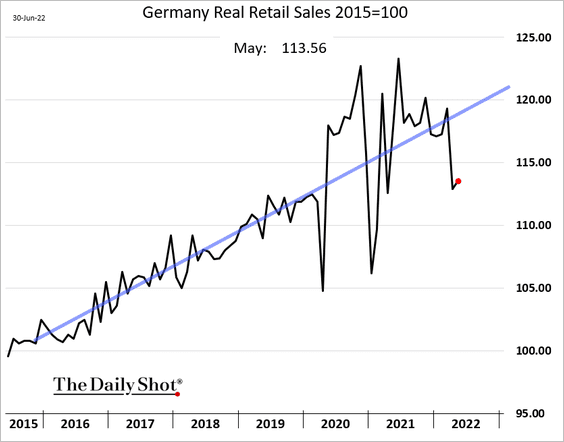
3. German retail sales didn’t recover much in May.
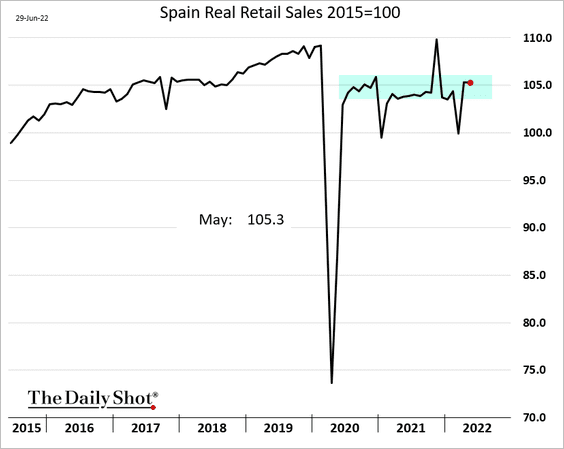
• Spain’s retail sales are in a holding pattern.
Back to Index
Europe
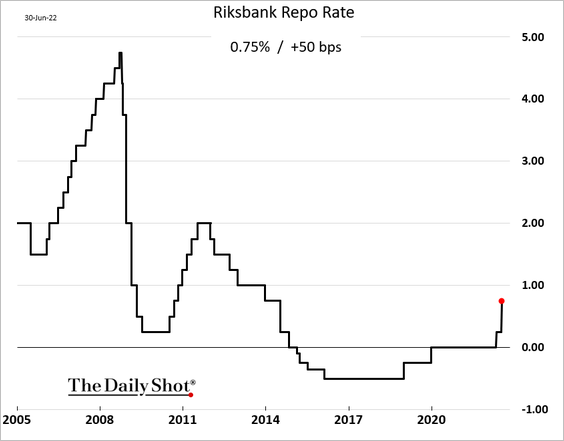
1. Sweden’s central bank hiked rates by 50 bps as inflation and inflation expectations surge.
2. What are the reasons for not seeking employment in the EU?
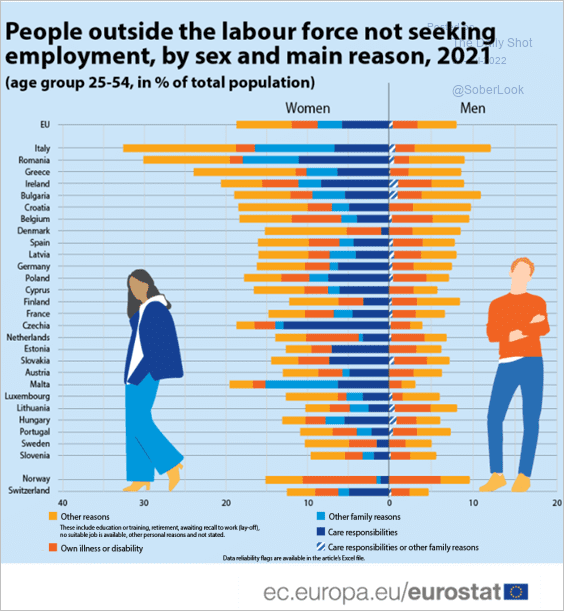 Source: Eurostat Read full article
Back to Index
Japan
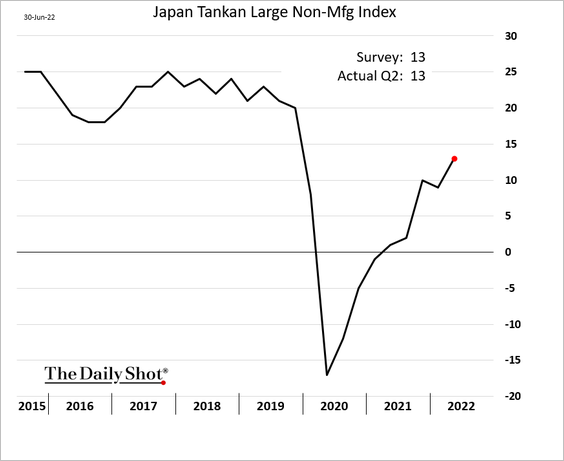
1. The Tankan manufacturing report showed a slowdown in Q2.
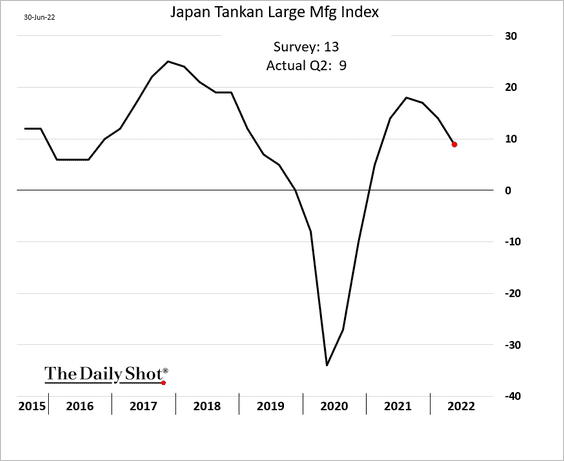
But the non-manufacturing index continues to climb.
——————–
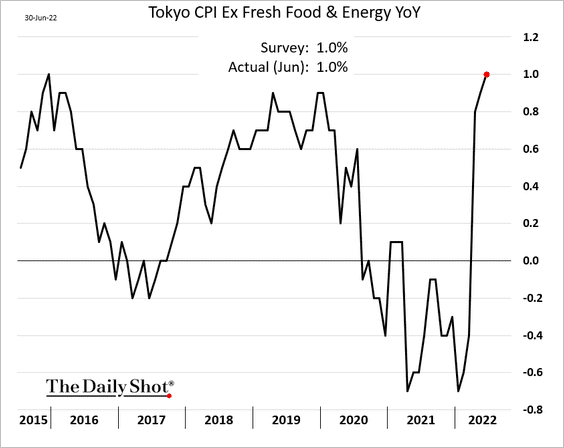
2. The June Tokyo core CPI hit 1% for the first time since 2015.
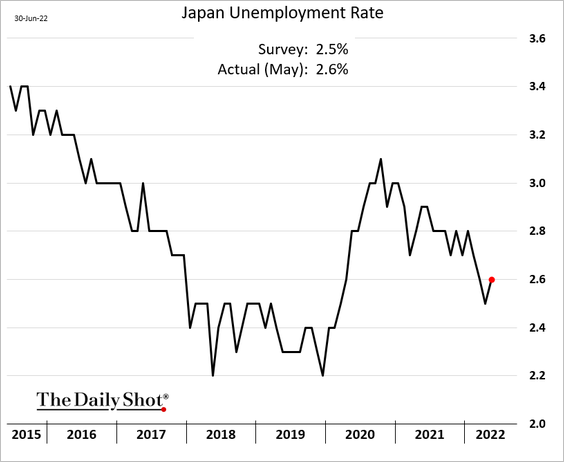
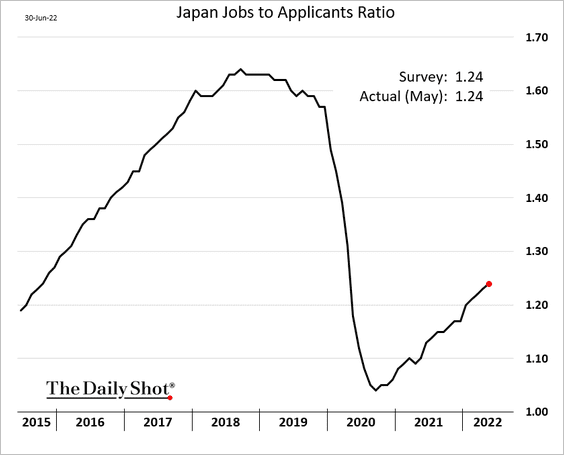
3. Labor trends remain positive.
• The unemployment rate:
• The jobs-to-applicants ratio:
Back to Index
Asia – Pacific
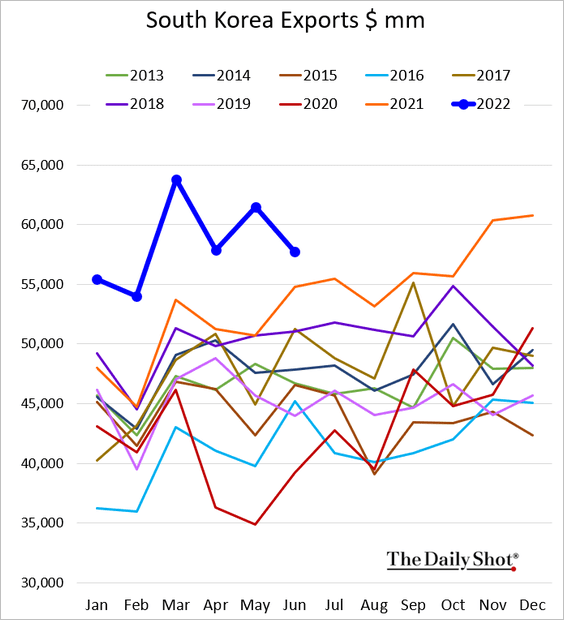
1. Let’s begin with South Korea.
• Exports were not as weak as the preliminary report indicated.
• The PMI report showed slower factory activity in June. Output is in contraction mode.
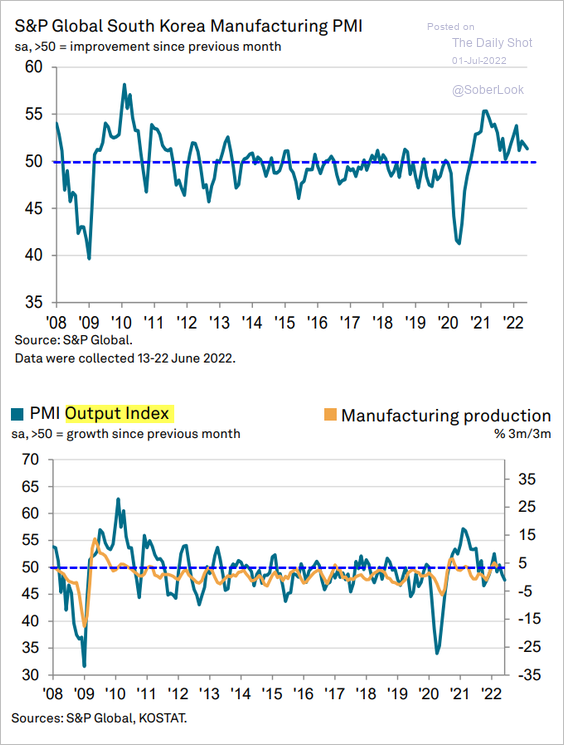 Source: S&P Global PMI
• Investment rebounded in May.
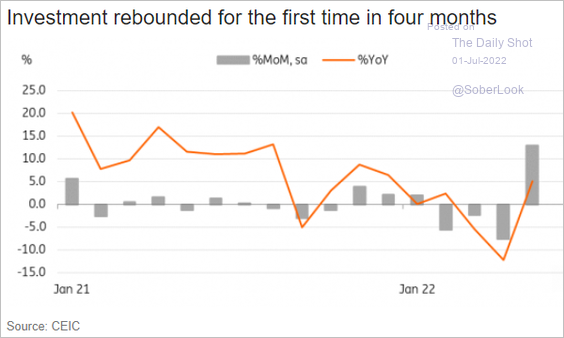 Source: ING
——————–
2. Taiwan’s factory activity entered contraction territory in June.
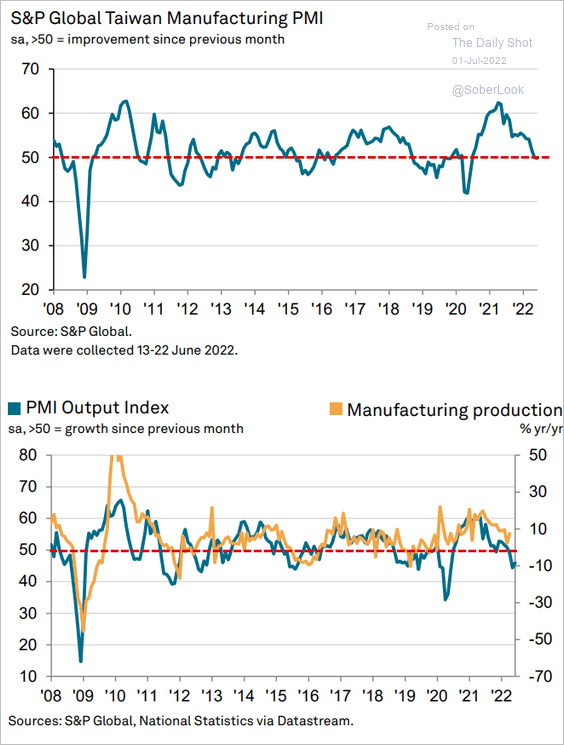 Source: S&P Global PMI
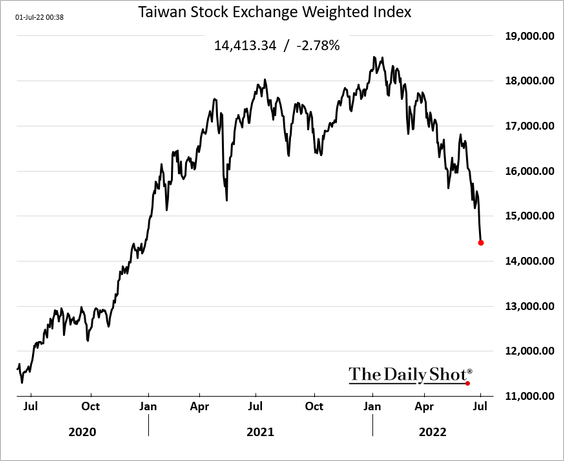
The stock market is tanking.
——————–
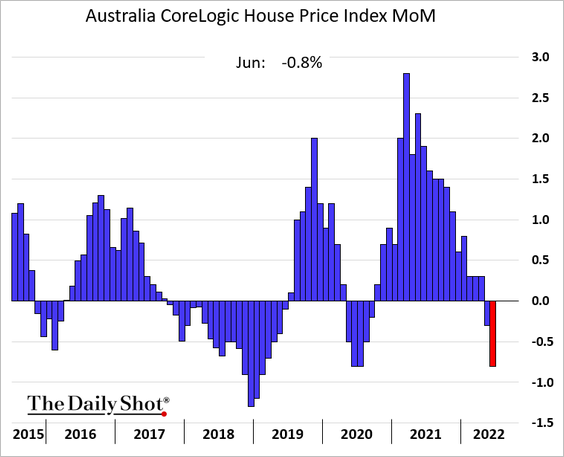
3. Australia’s home price declines accelerated in June.
Back to Index
China
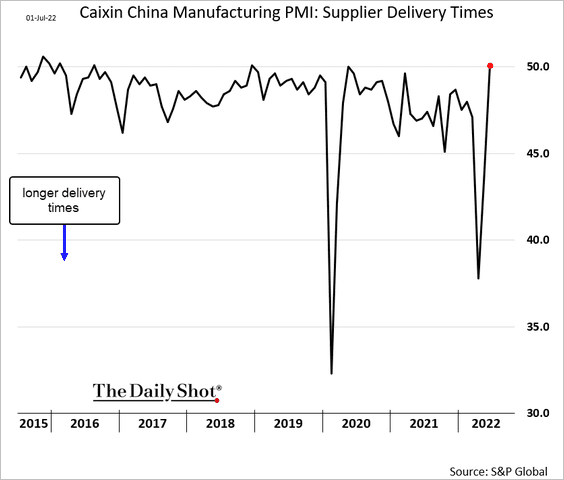
1. The S&P Global PMI report showed a rebound in factory activity in June.
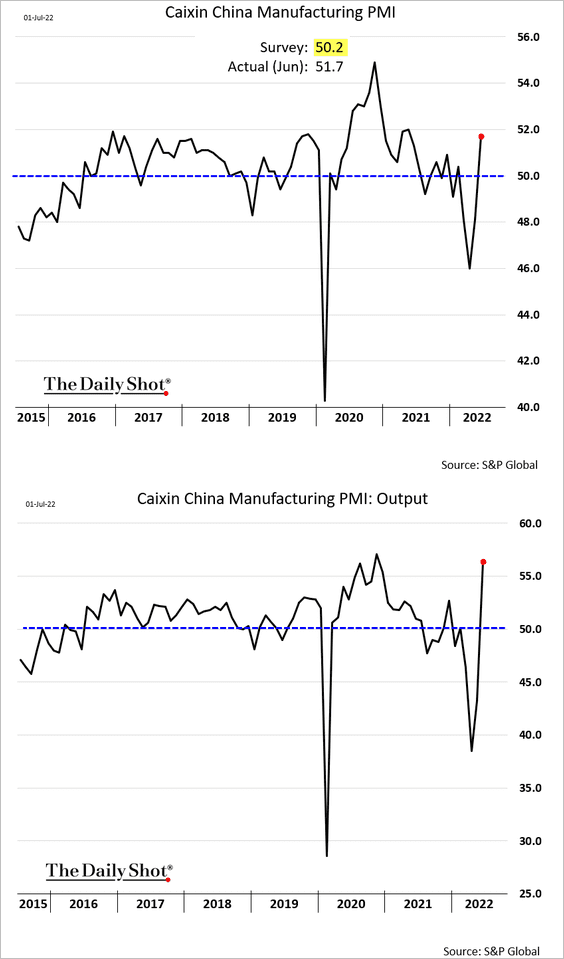
Supplier delays are over.
——————–
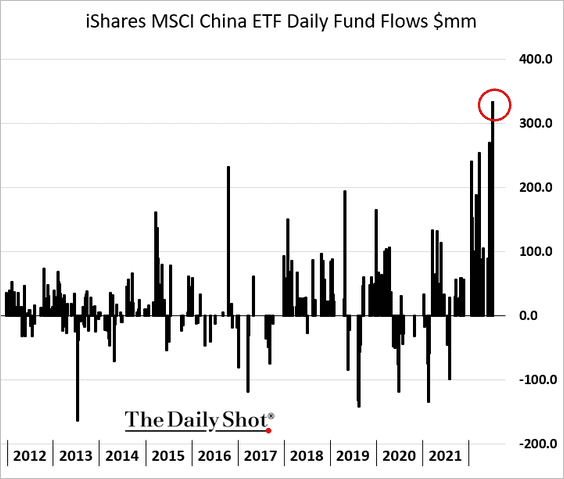
2. The iShares China ETF saw substantial inflows this week.
3. Will an improvement in forward earnings help sustain China’s outperformance?
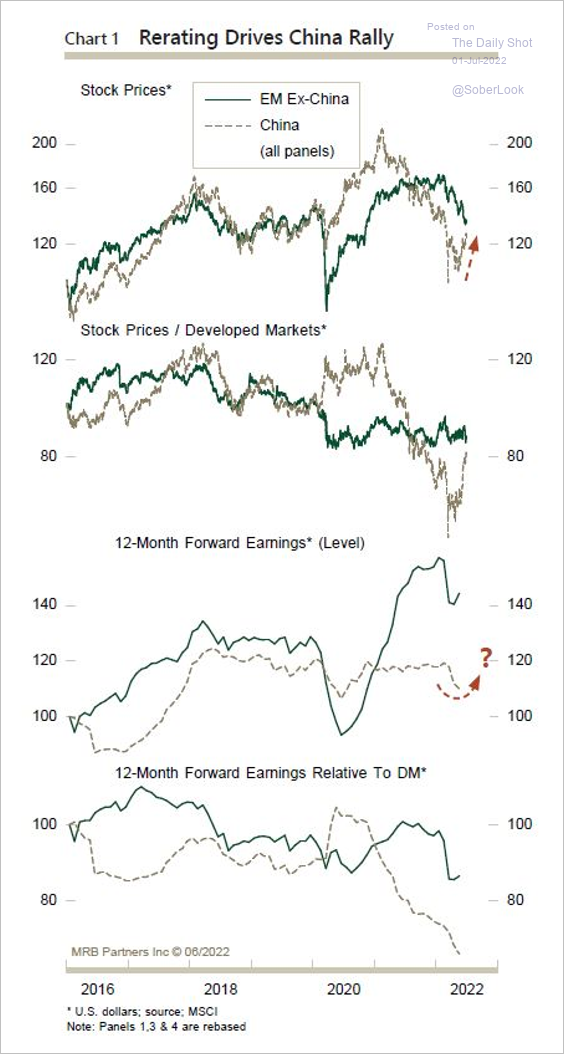 Source: MRB Partners
4. Road traffic is recovering despite COVID lockdowns.
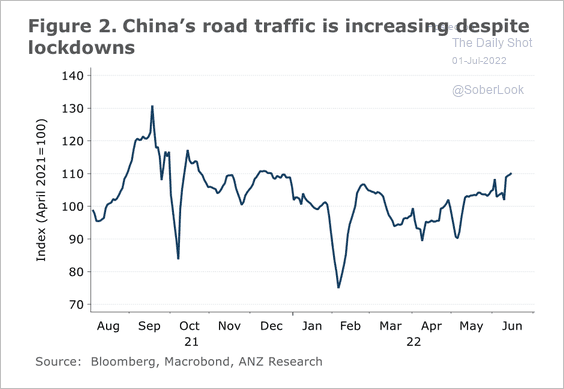 Source: @ANZ_Research
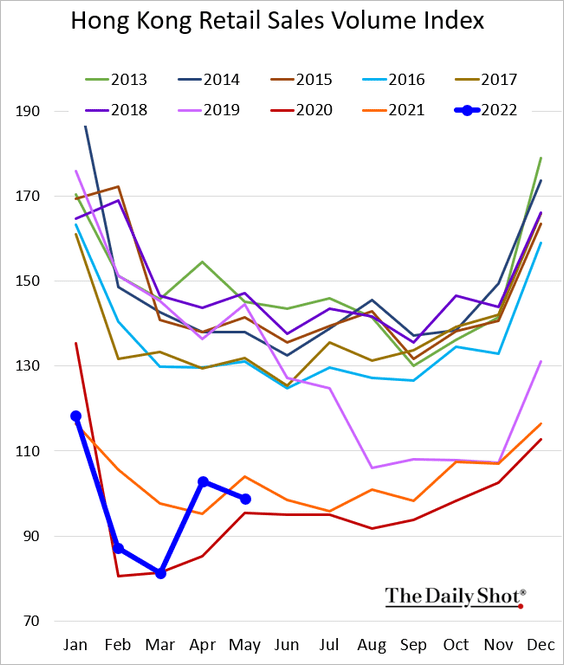
5. Hong Kong’s retail sales are back below last year’s levels.
Back to Index
Emerging Markets
1. Let’s run through the June PMI reports.
• ASEAN (still going strong):
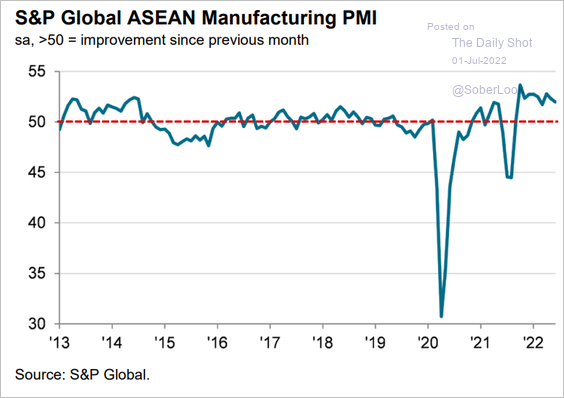 Source: S&P Global PMI
• The Philippines:
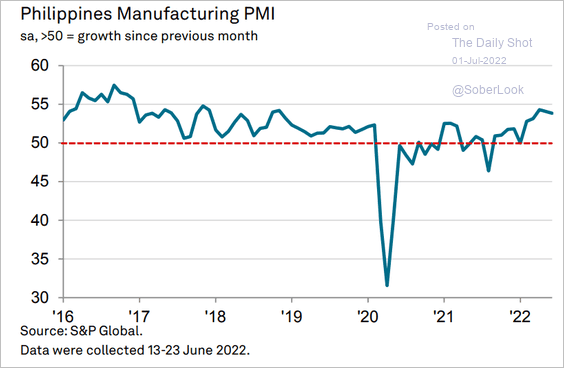 Source: S&P Global PMI
• Vietnam (expansion continues):
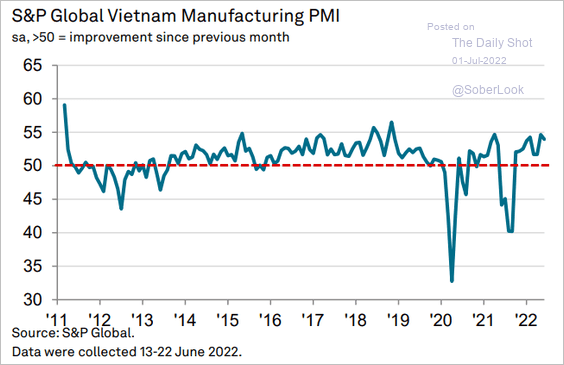 Source: S&P Global PMI
• Thailand (slower growth):
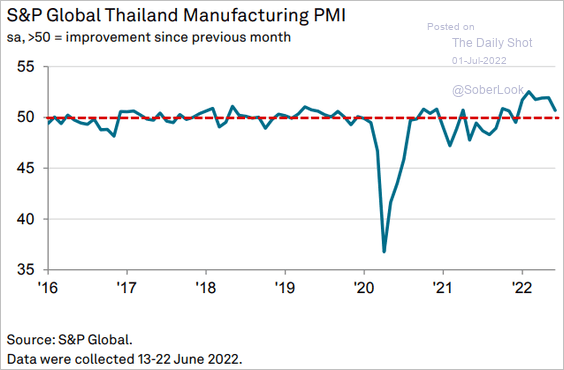 Source: S&P Global PMI
• Malaysia (treading water):
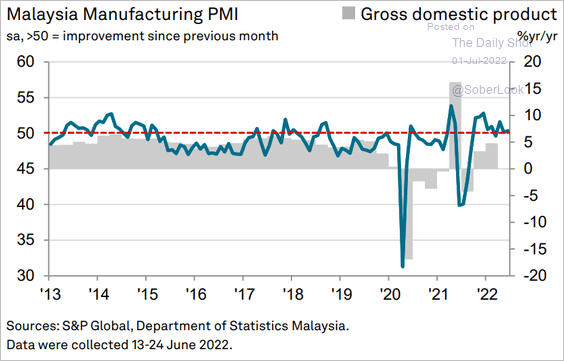 Source: S&P Global PMI
• Indonesia (growth stalls):
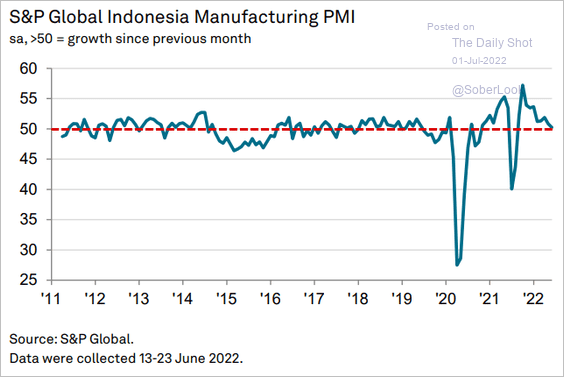 Source: S&P Global PMI
——————–
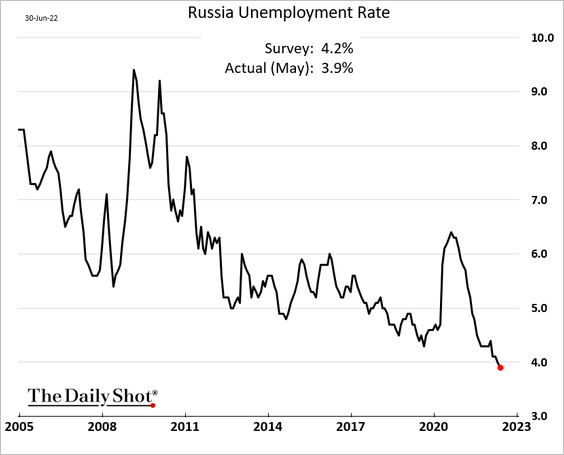
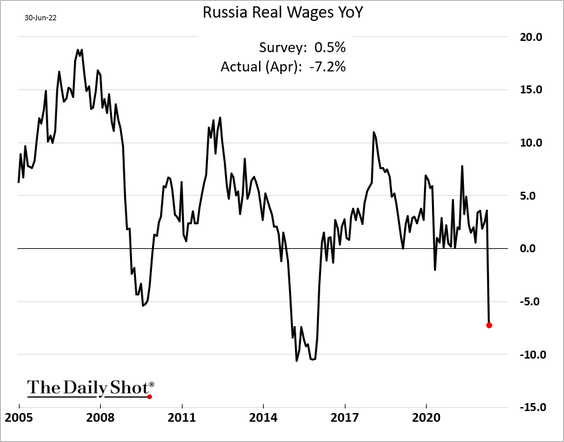
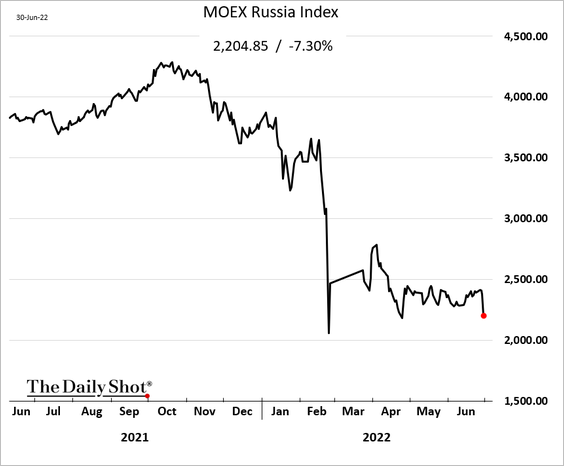
2. Here are a couple of economic updates on Russia. Note that since the start of the war, Russia’s government data should be taken with a grain of salt.
• The unemployment rate:
• Real wages:
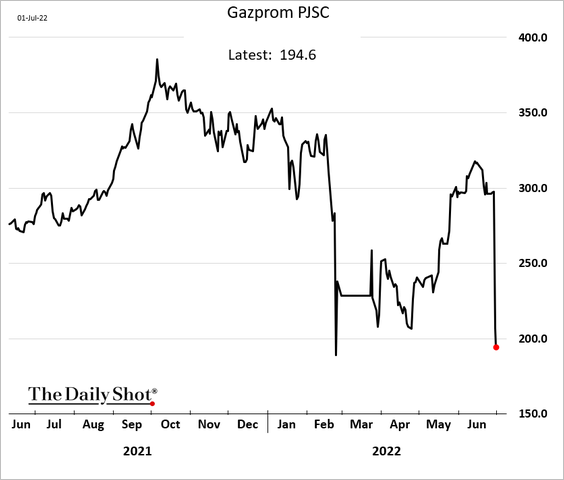
Russia’s stock index tumbled as Gazprom stopped dividend payments for the first time since 1998.
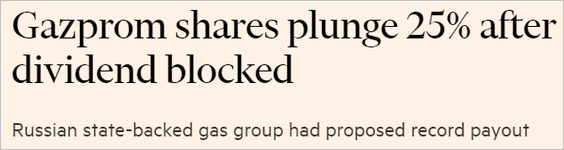 Source: @financialtimes Read full article
——————–
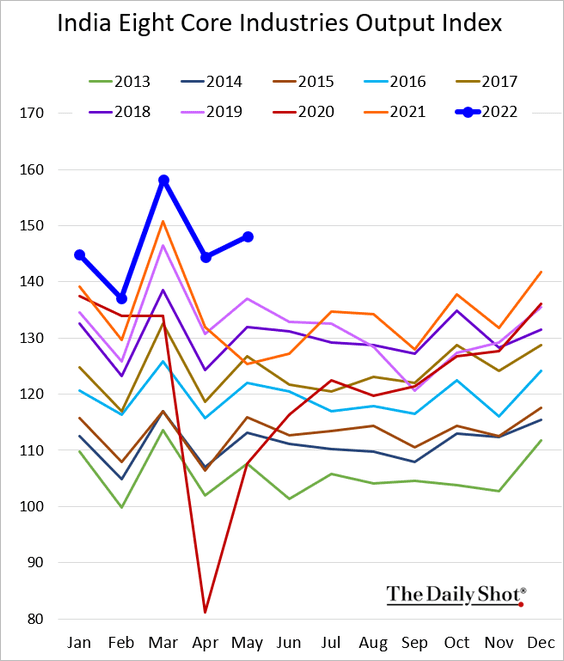
3. India’s industrial output is holding up well.
4. Weekly COVID-19 cases are starting to rise again, particularly in Brazil and Mexico (2 charts).
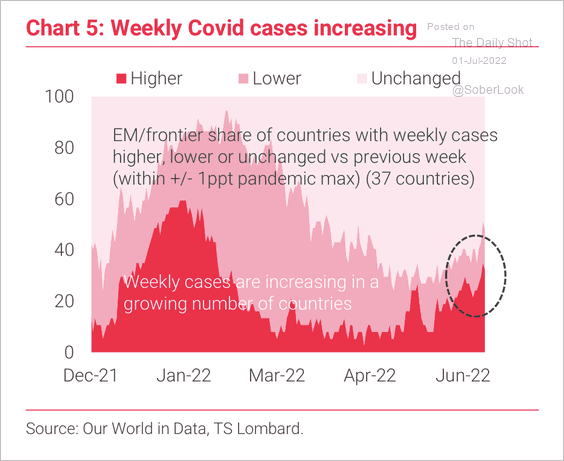 Source: TS Lombard
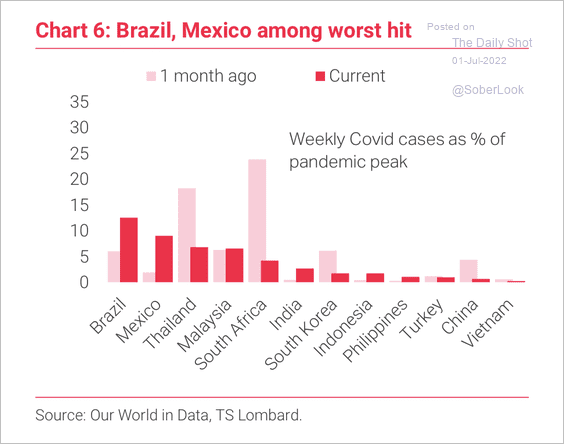 Source: TS Lombard
——————–
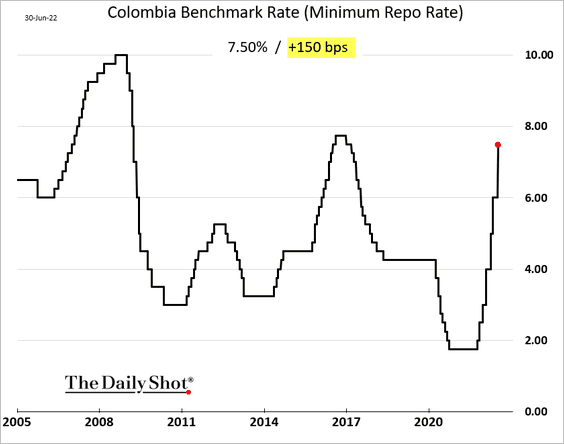
5. Colombia’s central bank hiked rates by 150 bps.
6. Correlations among EM equity markets are rising.
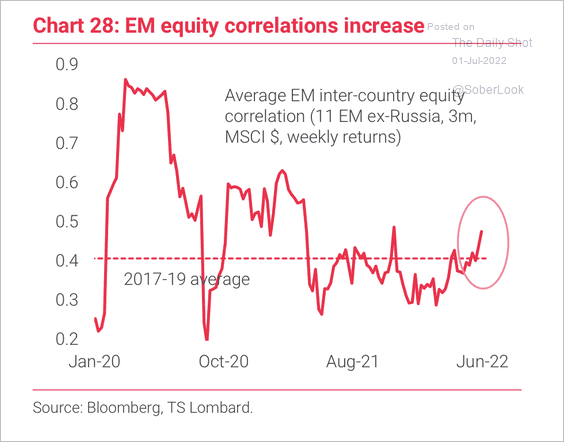 Source: TS Lombard
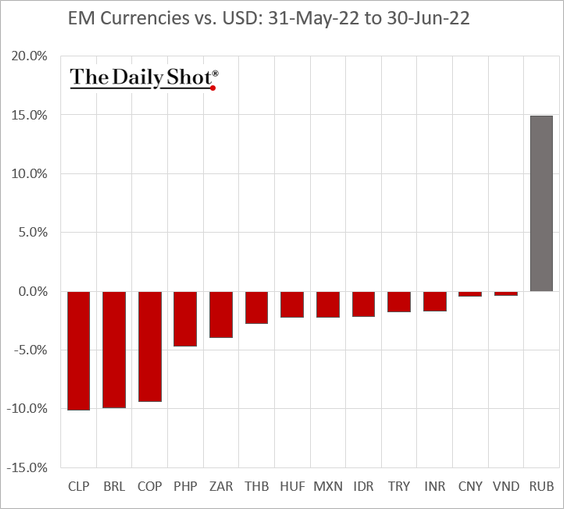
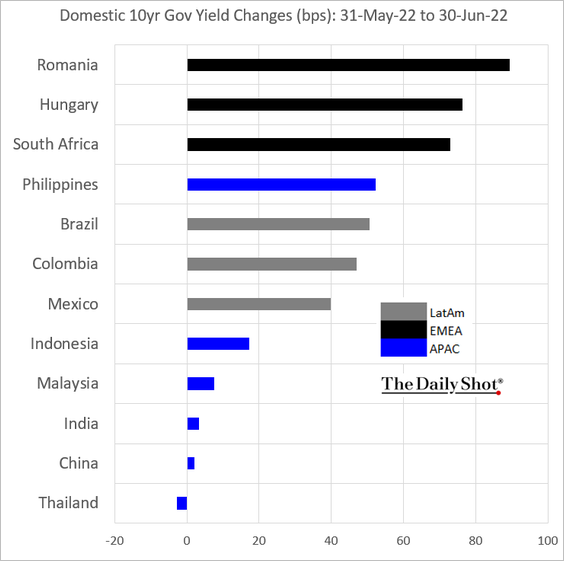
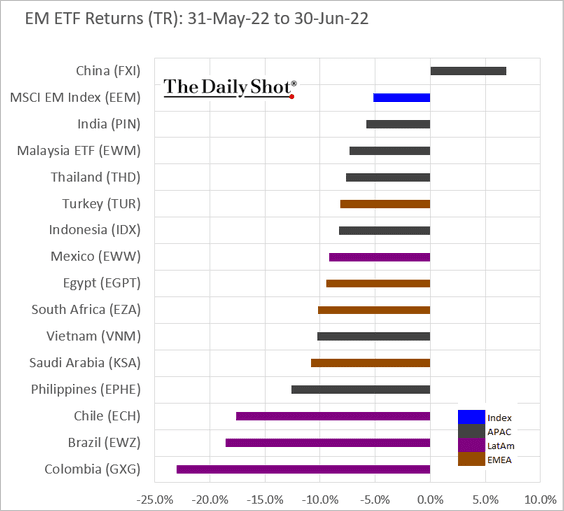
7. Next, we have some June performance charts.
• Currencies:
• Local-currency bond yields:
• Equity ETFs:
Back to Index
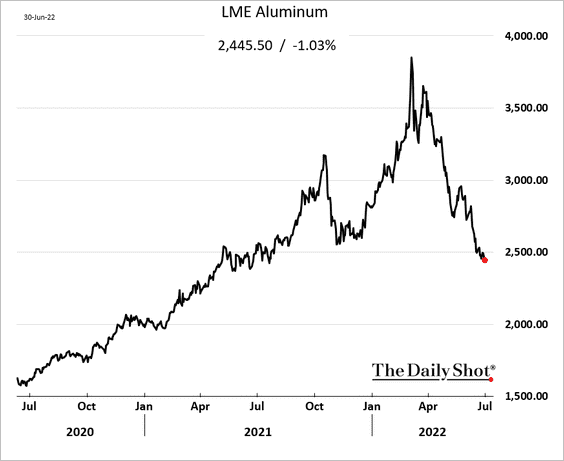
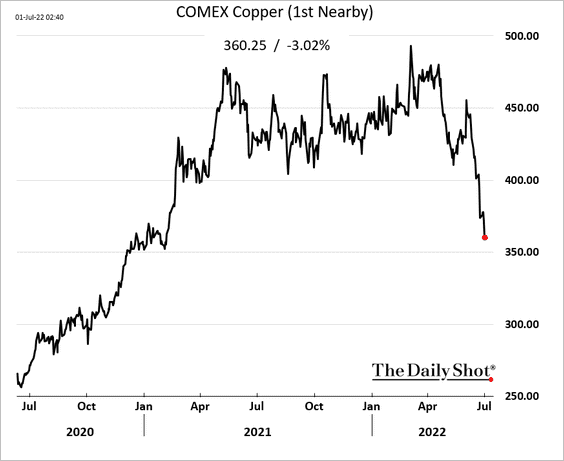
Commodities
1. Industrial metals remain under pressure amid recession fears.
– Aluminum:
– Copper:
• LME net positioning in copper and aluminum is moving lower.
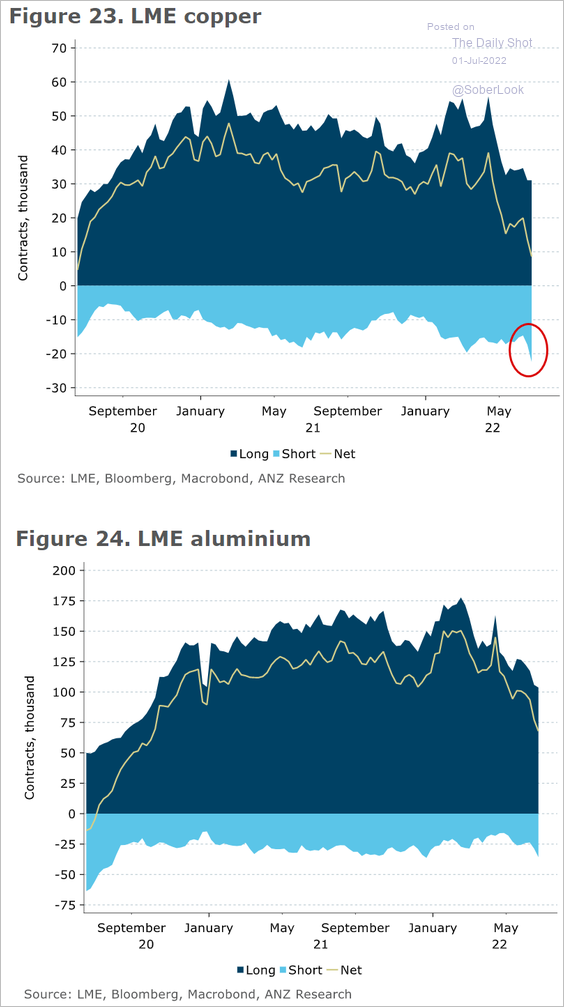 Source: @ANZ_Research
• Energy and metals have diverged.
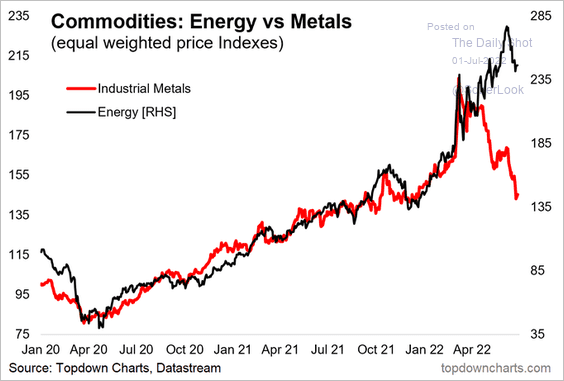 Source: @topdowncharts
According to Numera Analytics, oil is trading above fair value while copper is trading below.
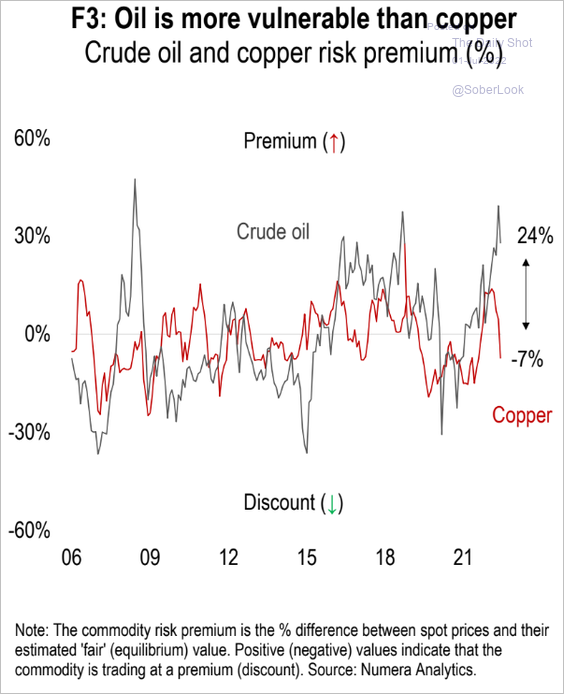 Source: Numera Analytics
——————–
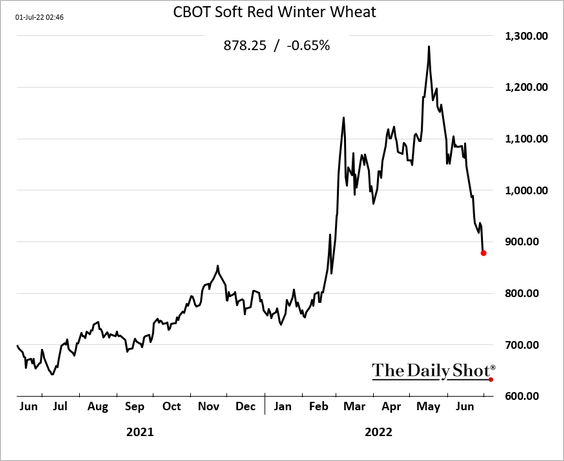
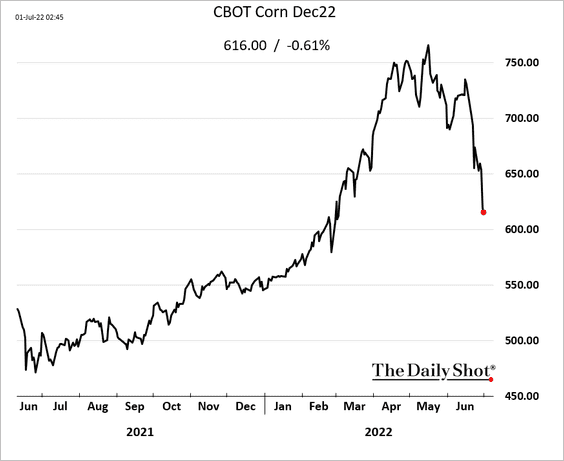
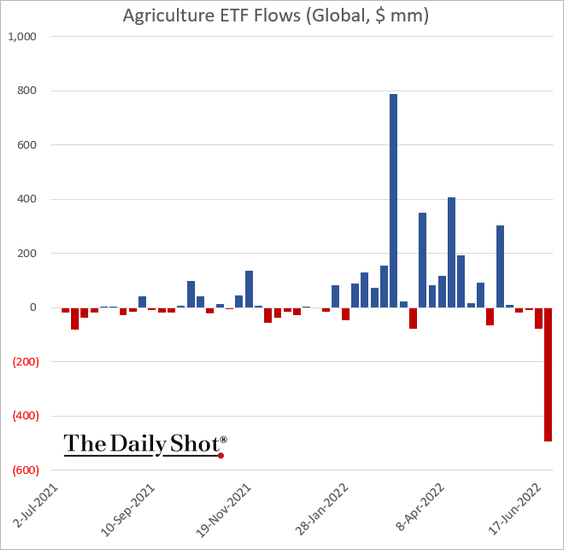
2. Grain futures are also sagging.
• Wheat:
• Corn:
Agriculture ETFs saw significant outflows in recent days (chart shows weekly flows).
——————–
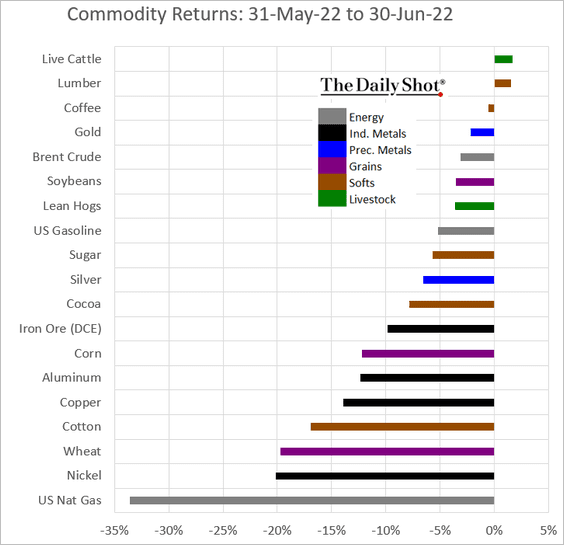
3. It’s been a challenging month for commodities.
Back to Index
Energy
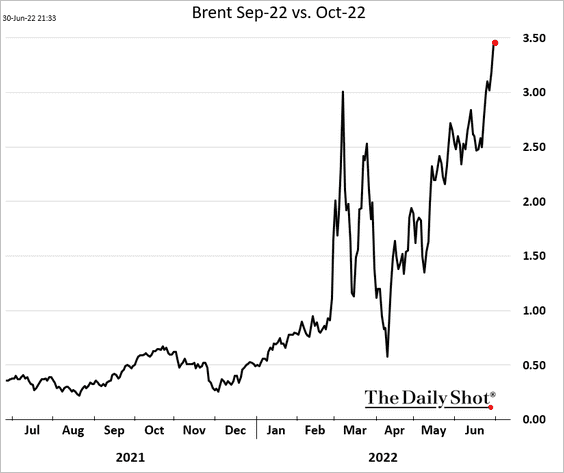
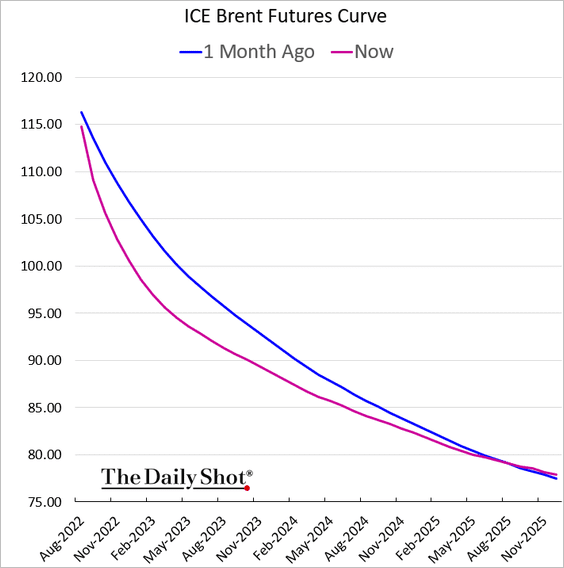
1. The front end of the Brent curve continues to steepen (an indication of tight supplies).
——————–
2. US natural gas futures plummetted as Freeport remains shut, significantly curtailing US LNG exports.
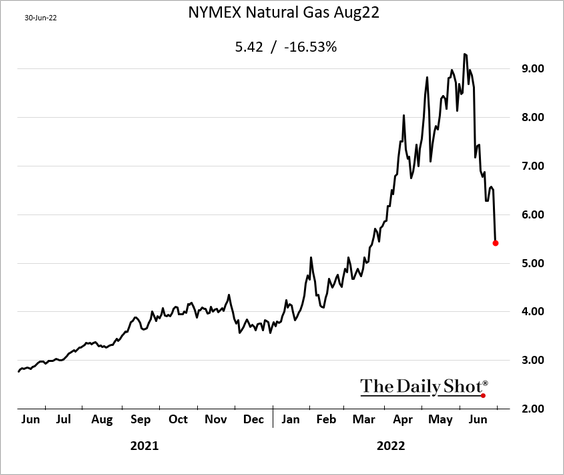
 Source: Reuters Read full article
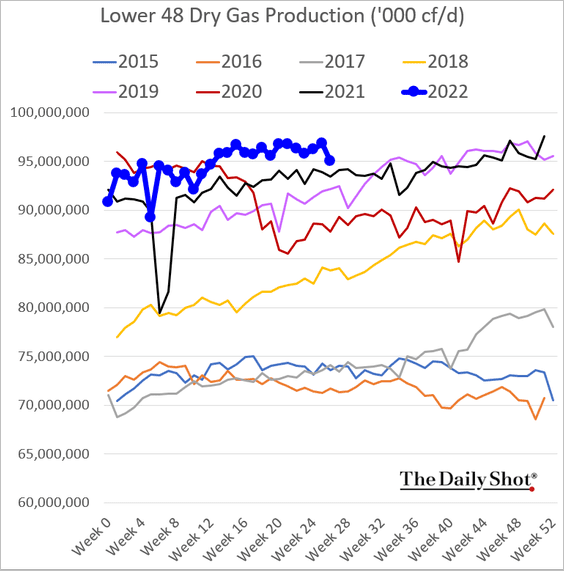
By the way, US natural gas production remains near peak levels.
——————–
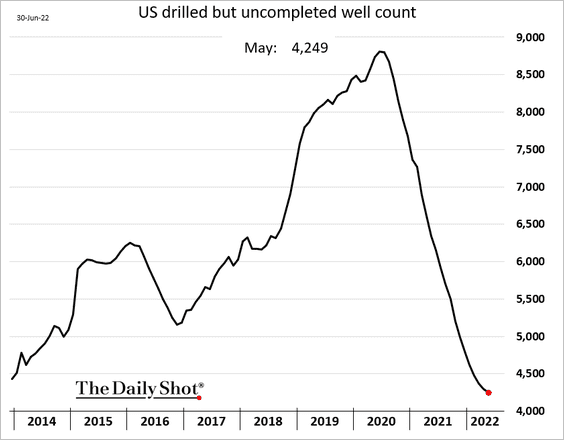
3. US oil output keeps climbing, breaking above twelve million barrels per day.
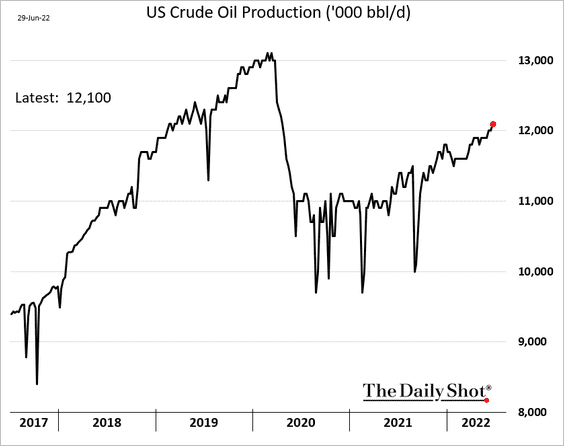
Further gains will require more investment.
——————–
4. Crack spreads are off the highs.
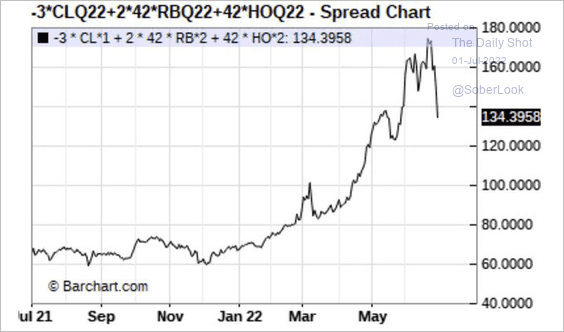 Source: @HFI_Research
5. This scatterplot shows OECD oil inventories vs. price.
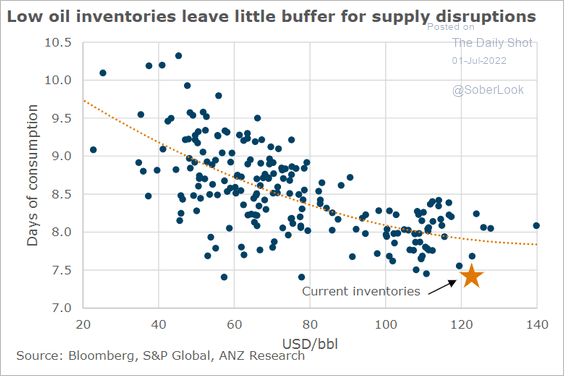 Source: @ANZ_Research
6. Jet fuel demand is rebounding, albeit still below pre-pandemic levels.
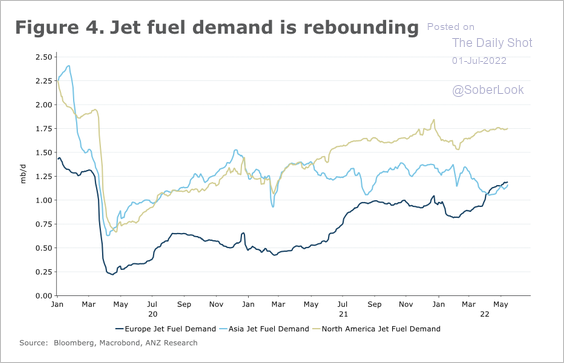 Source: @ANZ_Research
Back to Index
Equities
1. How long do bear markets last?
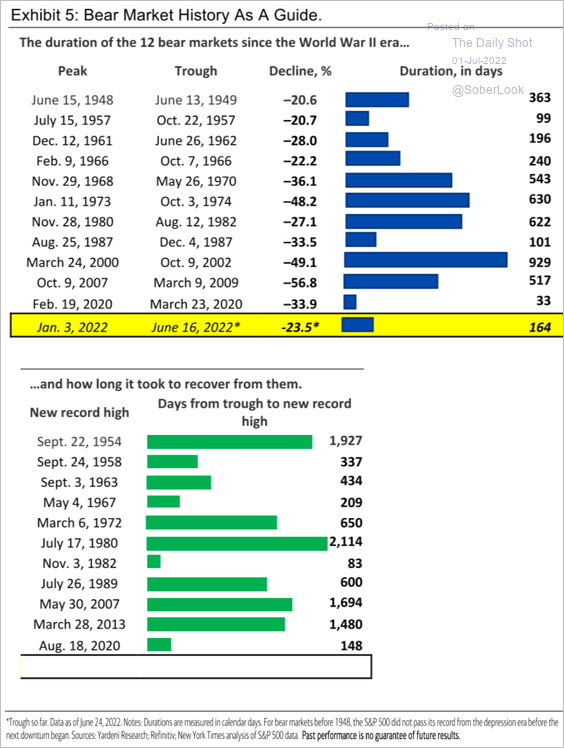 Source: Merrill Lynch
2. Next, we have some data on post-war market corrections.
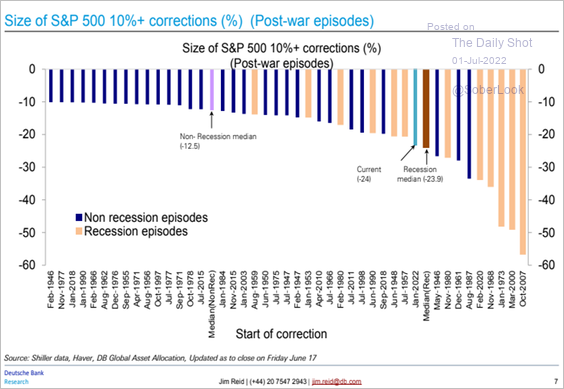 Source: Deutsche Bank Research
3. A repeat of 1973?
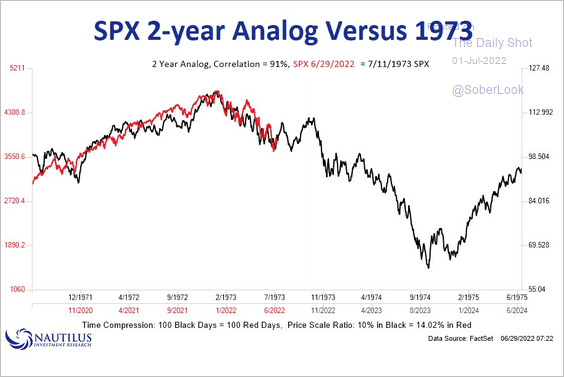 Source: @NautilusCap
4. Previously, major downswings in consumer confidence eventually preceded rate cuts and bear market bottoms.
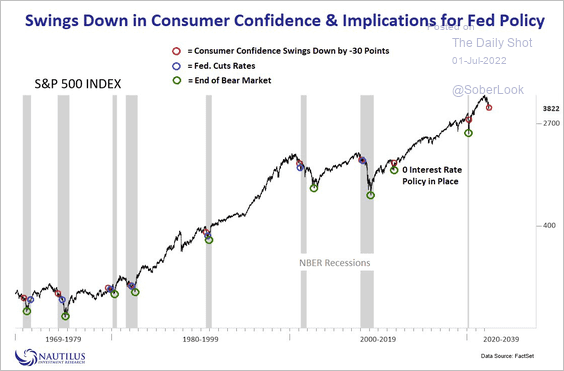 Source: @NautilusCap
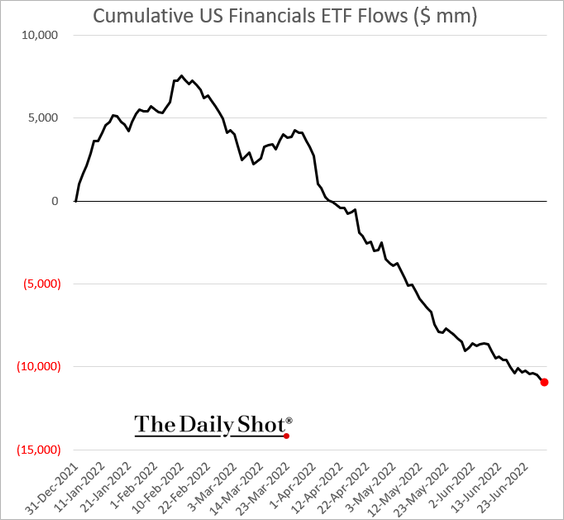
5. Outflows from financials and consumer discretionary ETFs continue.
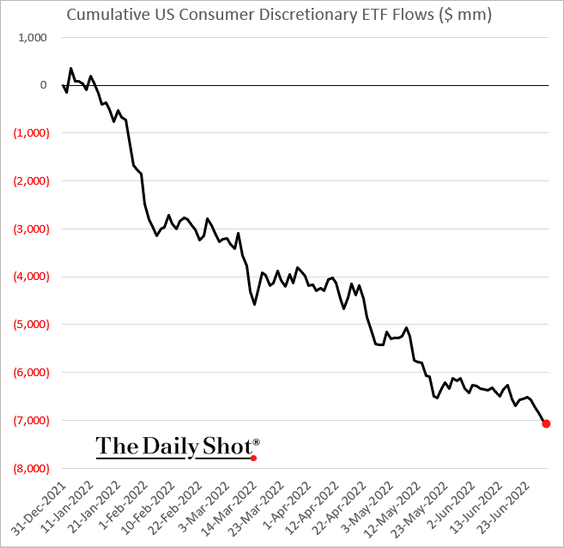
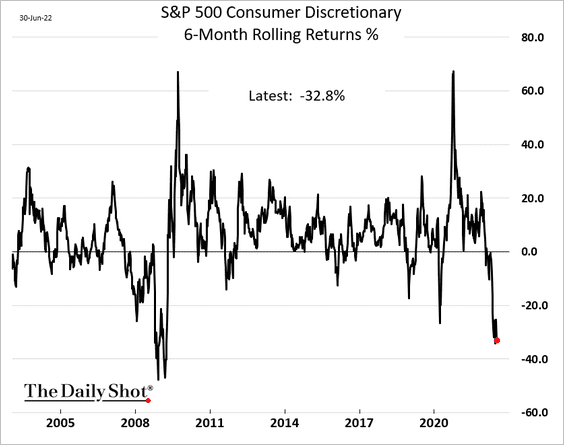
Consumer discretionary stocks lost almost a third of their value over the past six months.
——————–
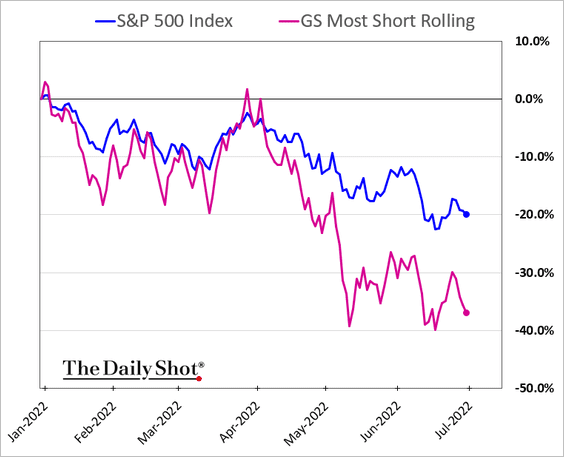
6. Shorting weak companies finally worked in Q2 as the Reddit crowd pulls back.
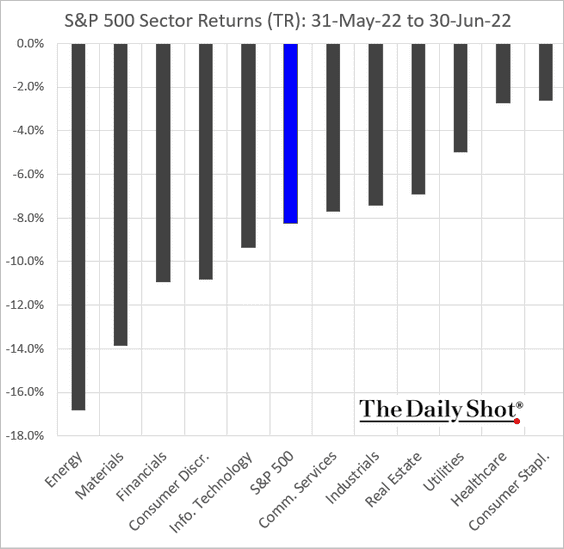
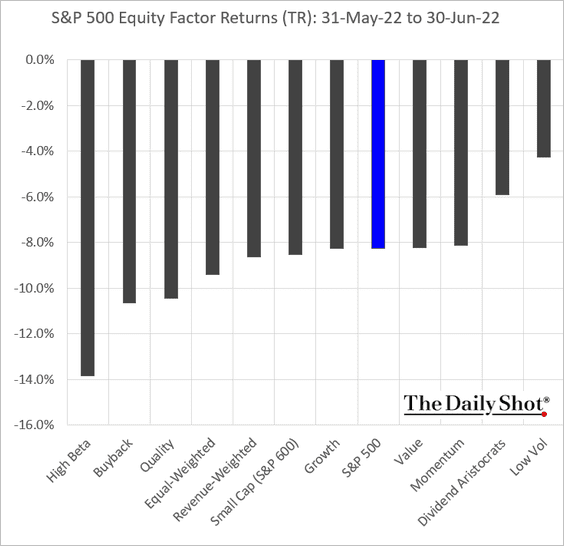
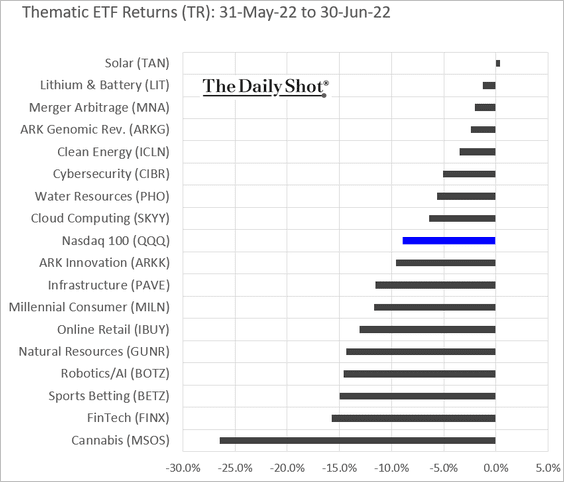
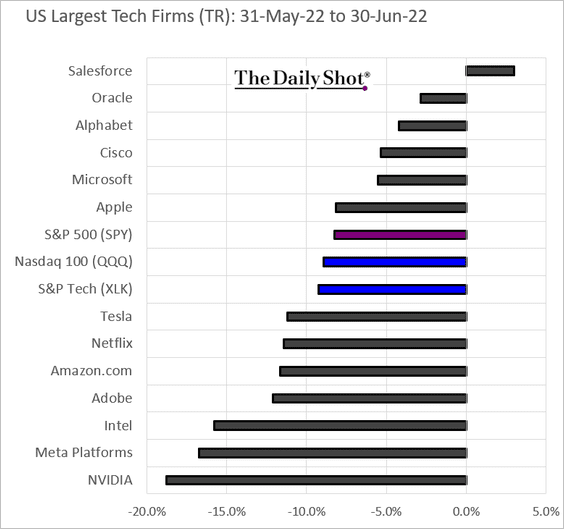
7. Here is a look at some (very ugly) performance data for June.
• Sectors:
• Equity factors:
• Thematic ETFs:
• Largest tech firms:
——————–
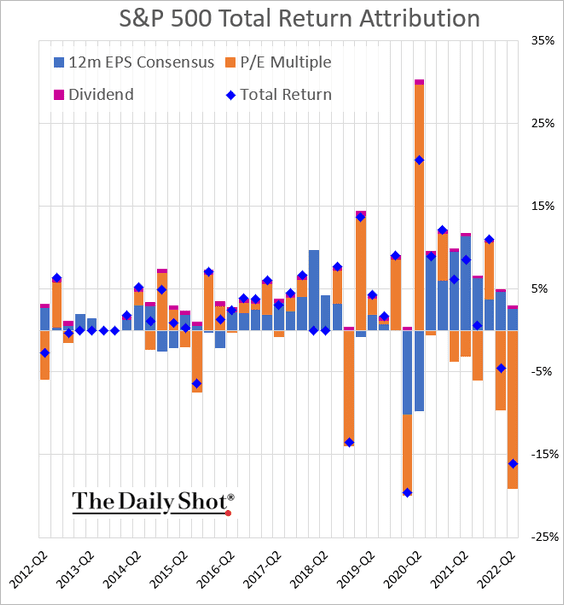
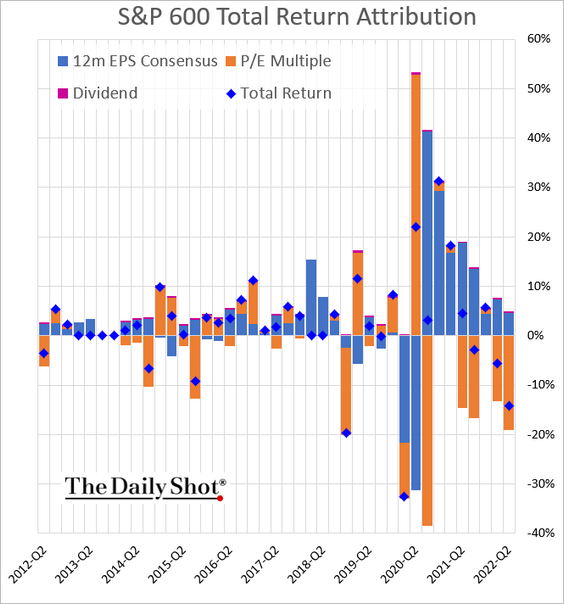
8. Next, we have the quarterly performance attribution for large and small-cap stocks. Earnings expectations remained a positive contribution to returns and are probably the next shoe to drop.
• S&P 500:
• S&P 600:
——————–
9. Who are the largest shareholders in the S&P500?
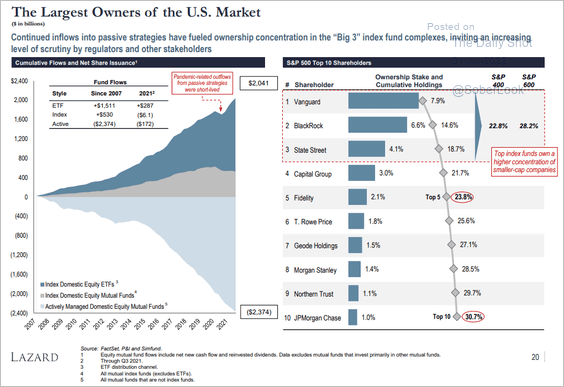 Source: Lazard
Back to Index
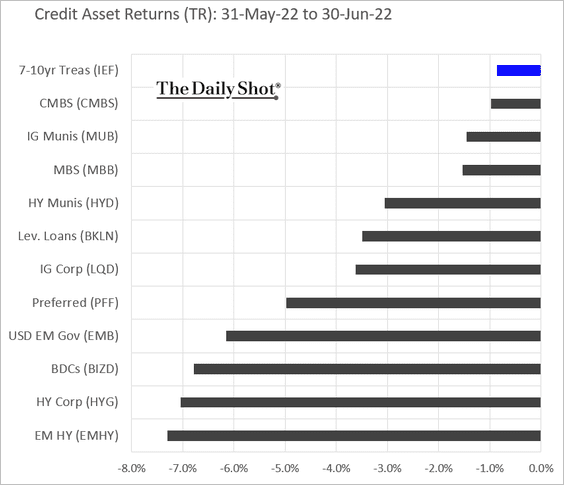
Credit
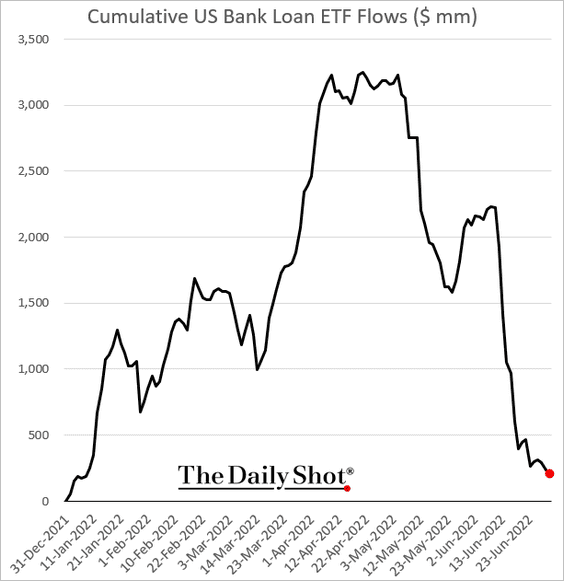
1. Leveraged loan ETFs continue to see outflows.
2. June was a tough month for credit.
Back to Index
Rates
1. This chart shows the futures market’s expectations for the fed funds rate trajectories over time.
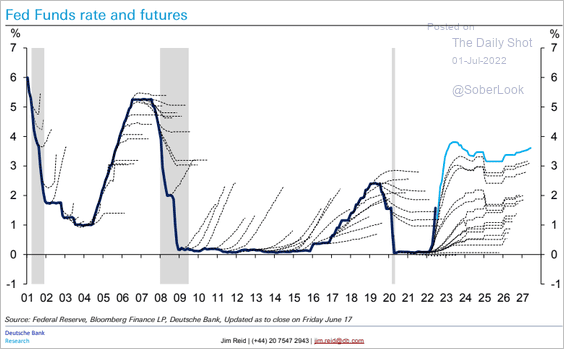 Source: Deutsche Bank Research
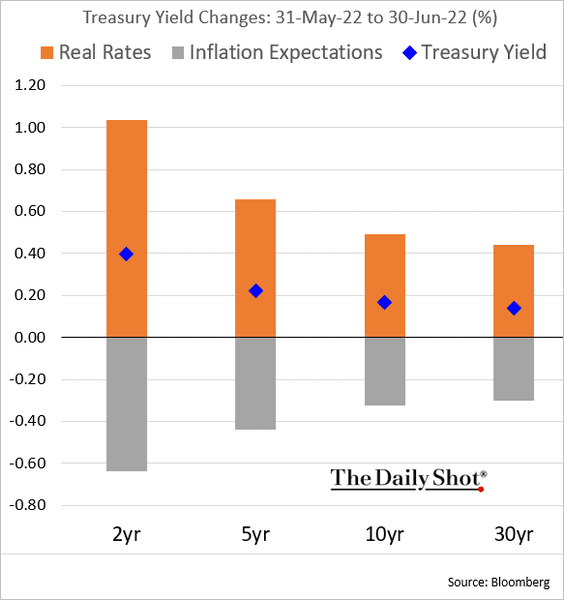
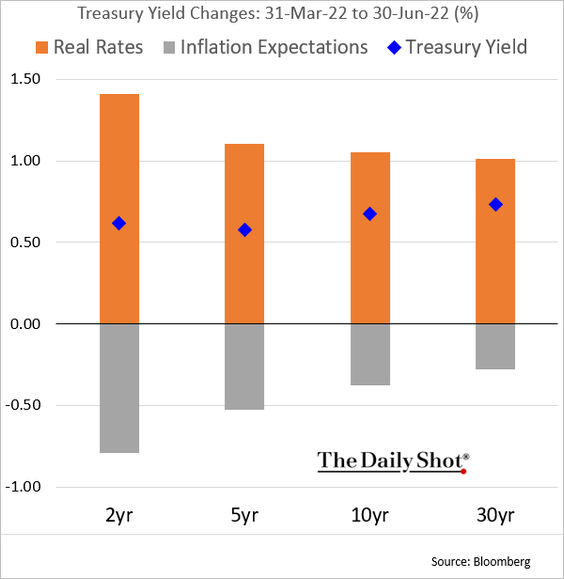
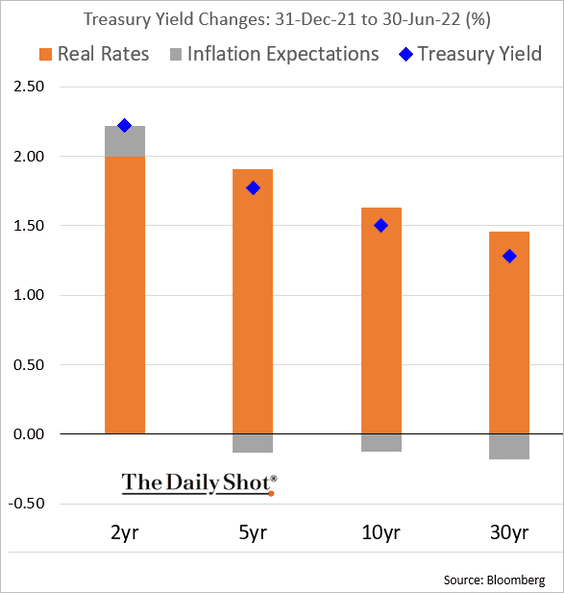
2. Next, we have some Treasury yield attribution data.
• June:
• Q2:
• Year-to-date:
Back to Index
Global Developments
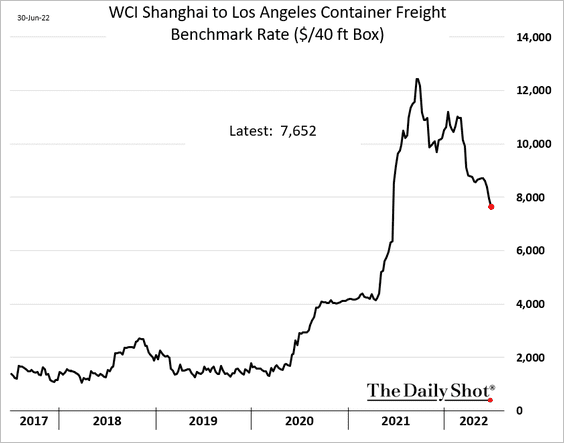
1. Container freight rates continue to fall.
2. Easing shortages should reduce upstream price pressures.
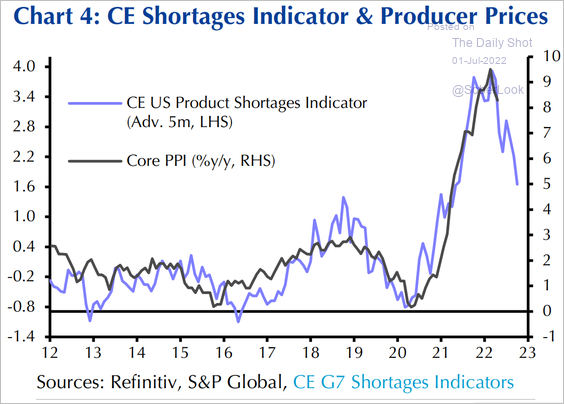 Source: Capital Economics
3. Global currency reserves have been less dollar-focused over the past decade, and less gold-focused over the past 50 years.
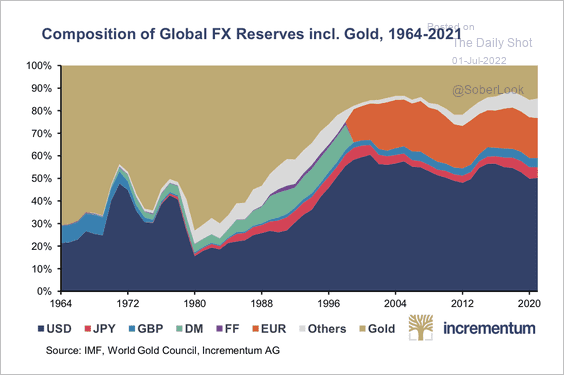 Source: Incrementum
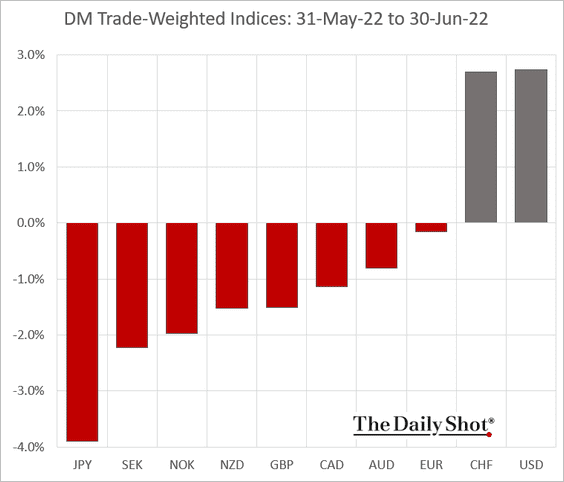
4. Finally, we have some DM performance data for June.
• Trade-weighted currency indices:
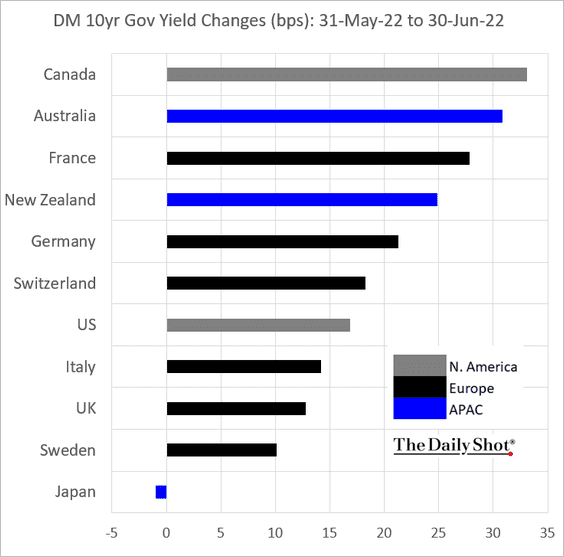
• Bond yields:
——————–
Food for Thought
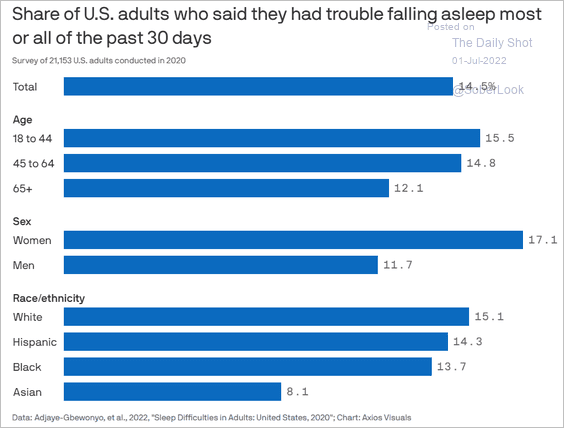
1. Trouble falling asleep:
 Source: @axios Read full article
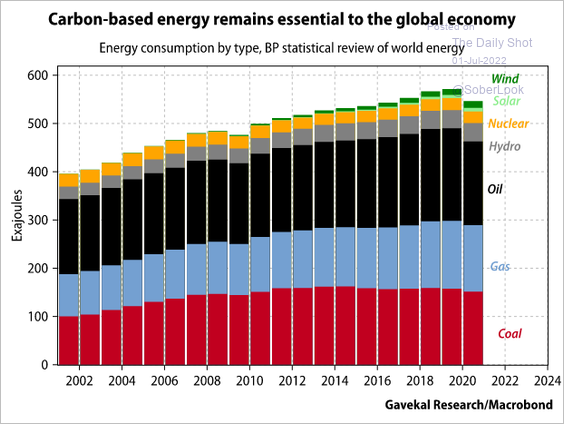
2. Global energy consumption by type:
 Source: Gavekal Research
3. Plastic waste management:
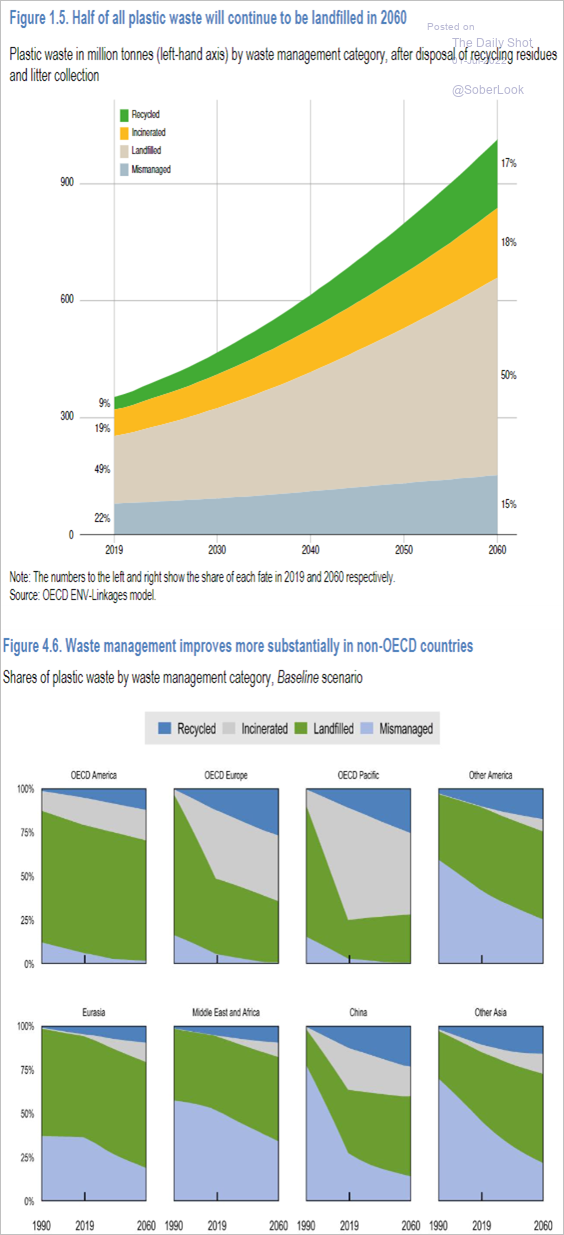 Source: OECD Read full article
4. Confidence in the US Supreme Court:
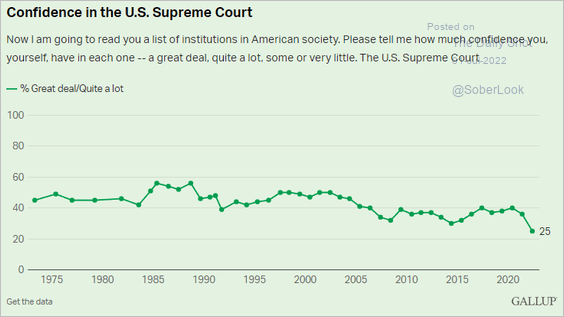 Source: Gallup Read full article
5. Estate and inheritance taxes:
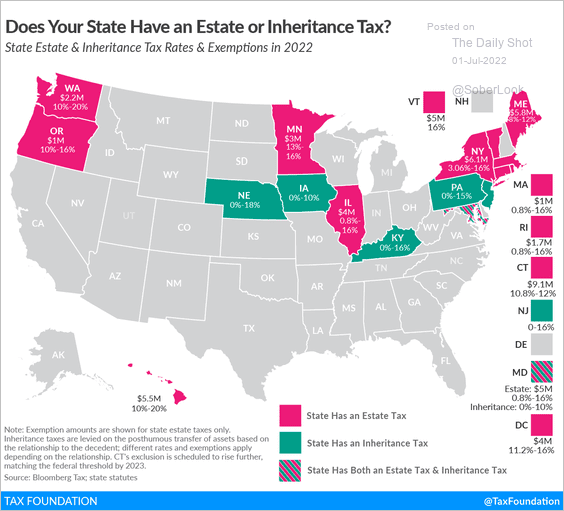 Source: @TaxFoundation, @janellefritts Read full article
6. Counties with more livestock than people:
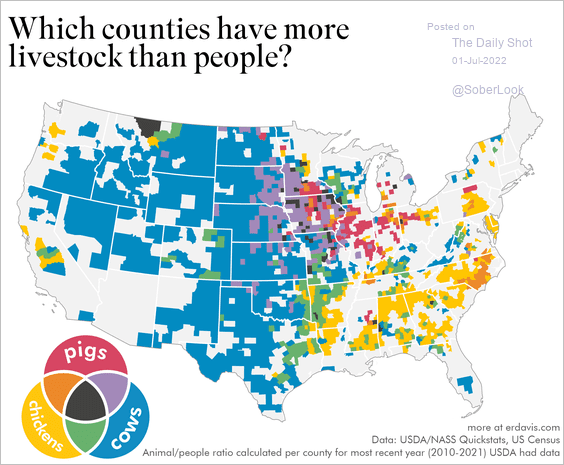 Source: @erindataviz
——————–
Have a great holiday weekend.
Back to Index