
The Daily Shot: 08-Aug-22
• The United States
• Canada
• The United Kingdom
• The Eurozone
• Europe
• Japan
• Asia – Pacific
• China
• Emerging Markets
• Commodities
• Equities
• Alternatives
• Credit
• Rates
• Global Developments
• Food for Thought
The United States
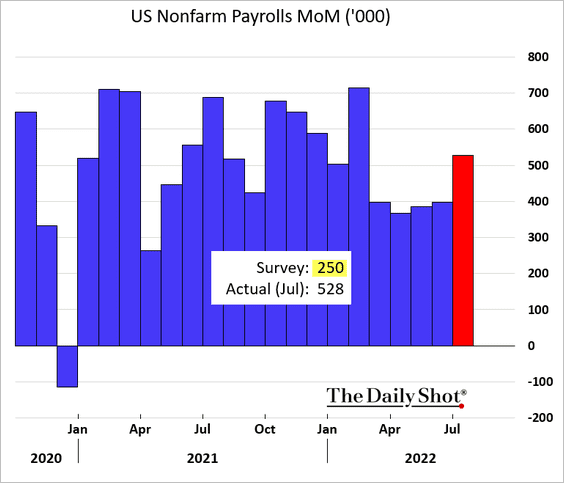
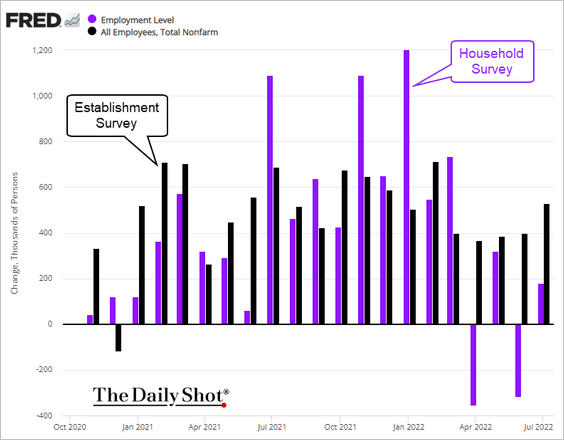
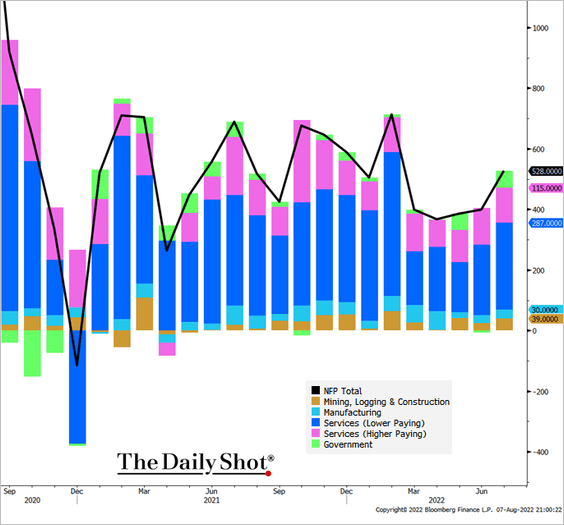
1. The employment report topped expectations, with over half a million new payrolls created in July. This does not look like a recession.
• However, the Establishment Survey job gains (above) continue to outpace the Household Survey (which includes self-employed workers).
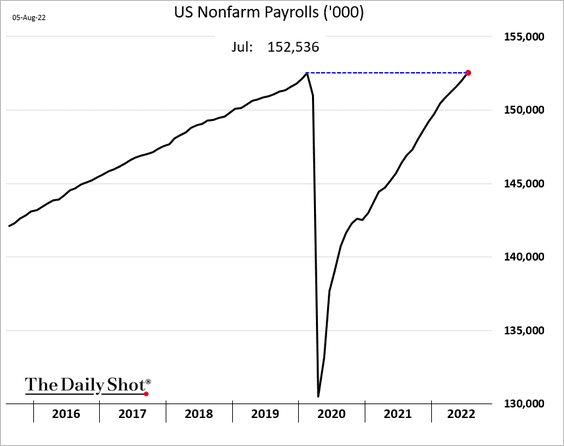
• The labor market has now fully recovered all the pandemic-related losses.
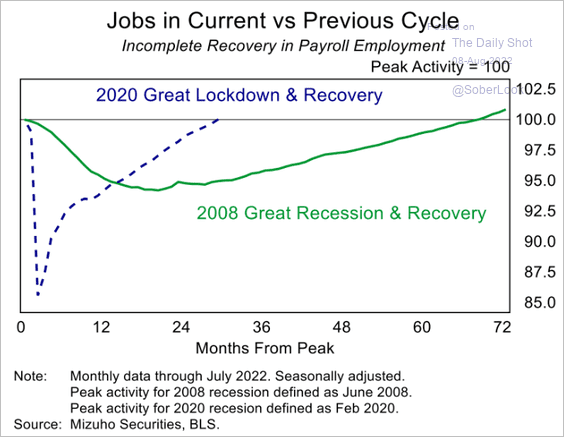
– Here is a comparison to the post-2008 recovery.
 Source: Mizuho Securities USA
– The recovery has been uneven.
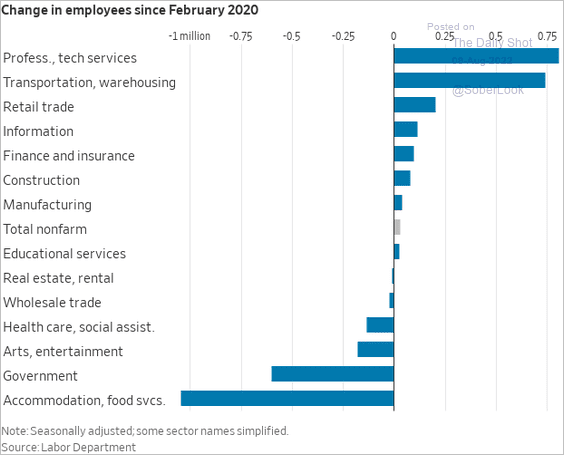 Source: @WSJ Read full article
• The next two charts show the contributions to payroll gains.
 Source: @TheTerminal, Bloomberg Finance L.P.
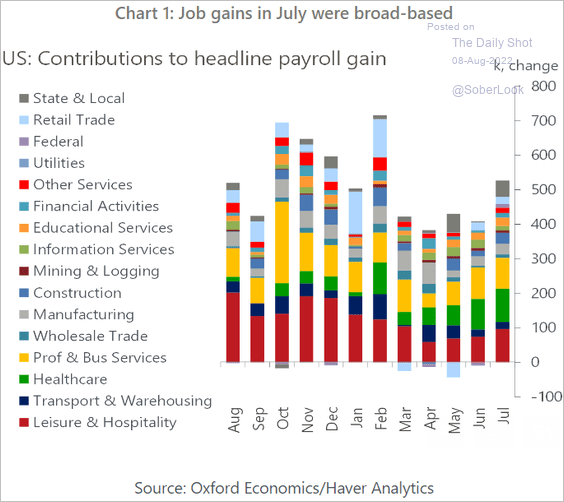 Source: Oxford Economics
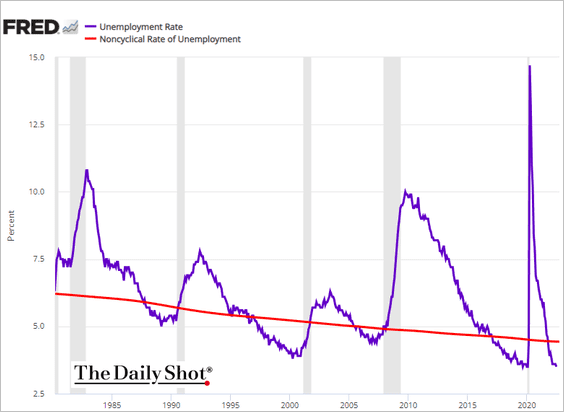
• The unemployment rate is now at pre-COVID lows …
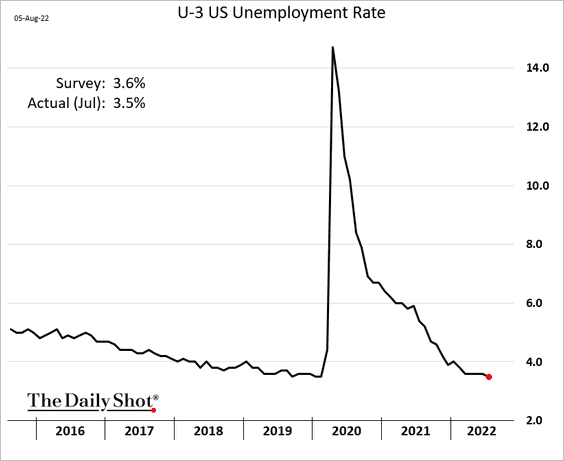
… and is running well below NAIRU. It’s an indication of tightness in the labor market. Has the unemployment rate bottomed?
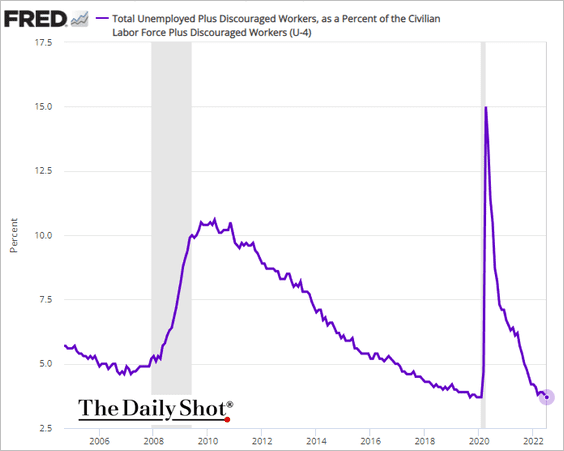
– The U-4 unemployment rate (below) includes discouraged workers (in addition to the unemployed).
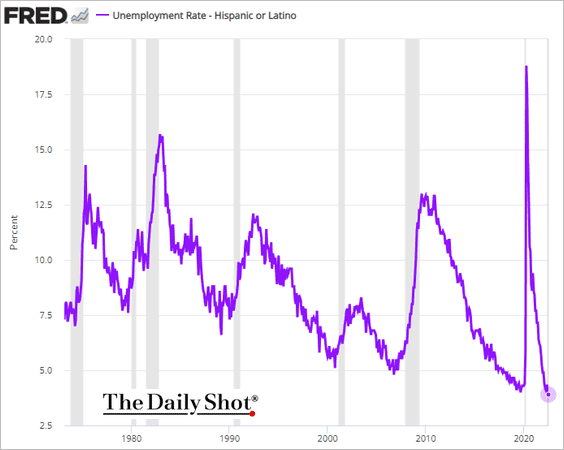
– The Latino American unemployment rate hit a record low.
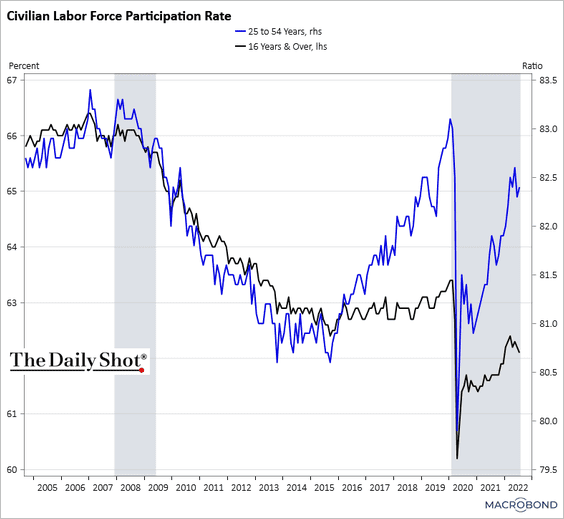
• The labor force participation rate edged lower again, but the prime-age participation improved slightly.
 Source: Chart and data provided by Macrobond
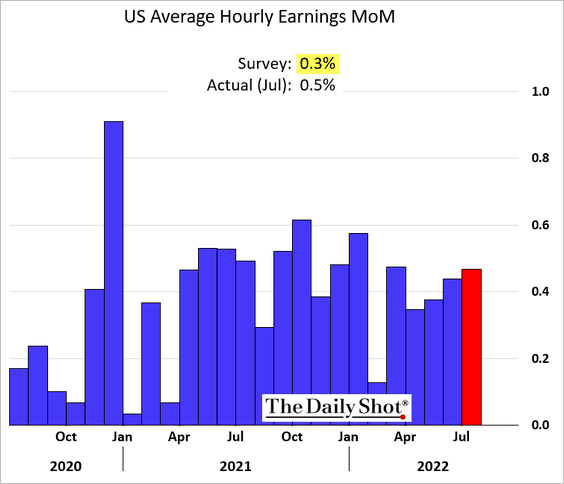
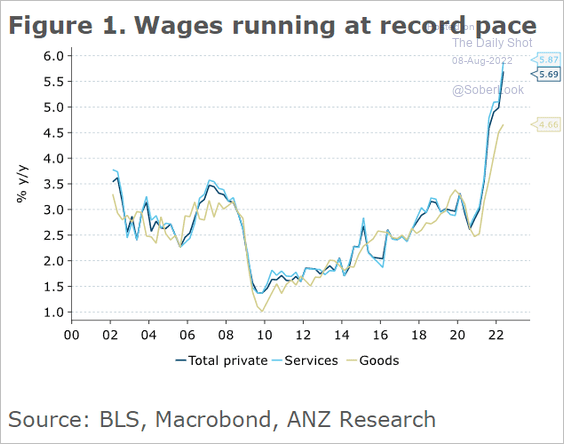
• Wage growth surprised to the upside, adding fuel to the FOMC’s hawkish sentiment.
 Source: @ANZ_Research
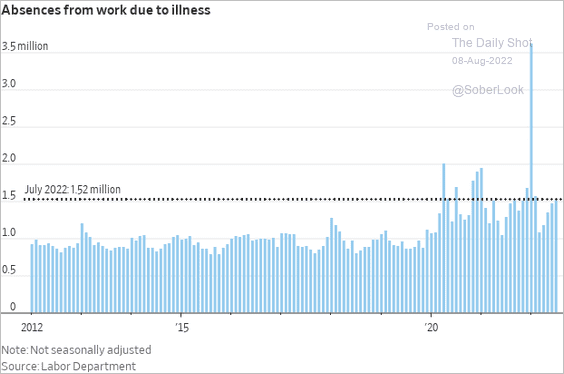
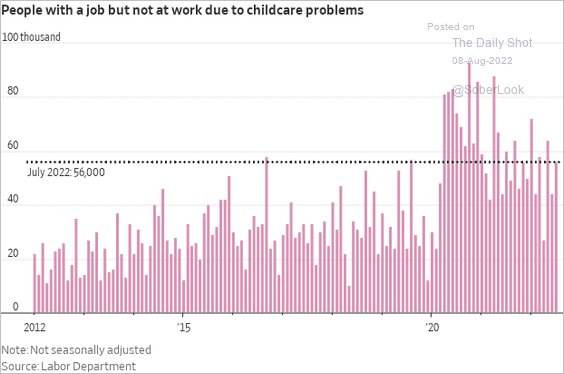
• COVID and childcare challenges remain a drag on the labor market.
 Source: @WSJ Read full article
 Source: @WSJ Read full article
——————–
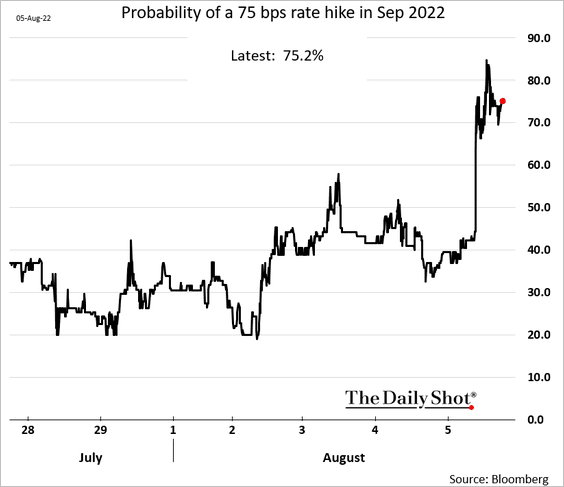
2. Rate hike expectations surged in response to the employment report. Here is the probability of a 75 bps hike in September.
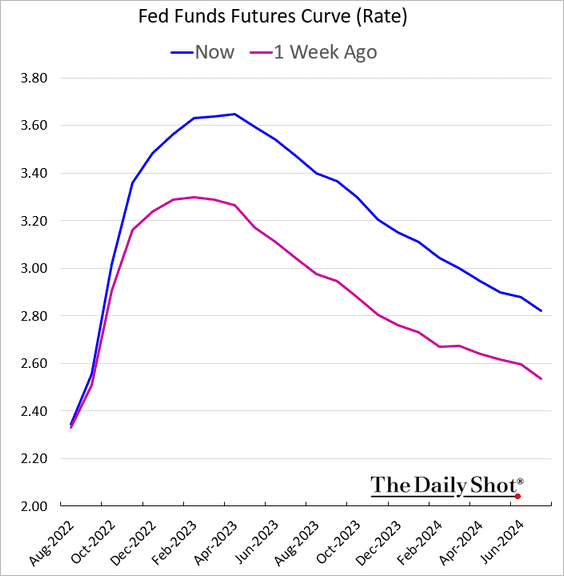
• The market sent the maximum expected fed funds rate above 3.6%.
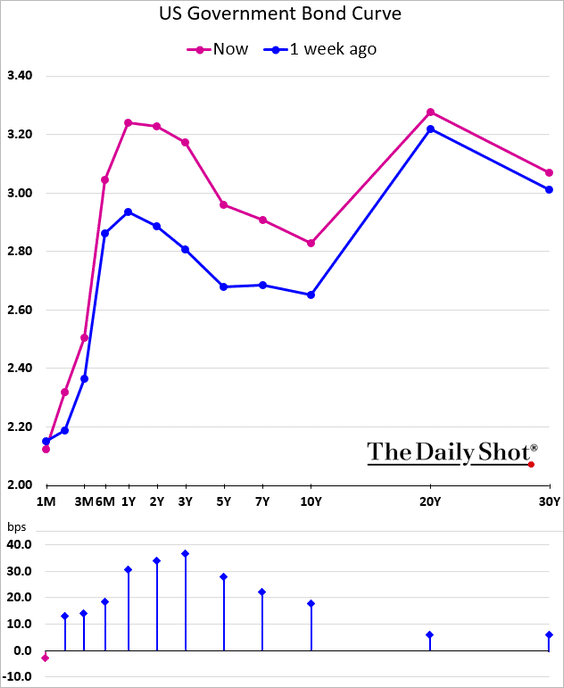
• Short-term Treasury yields rose sharply, …
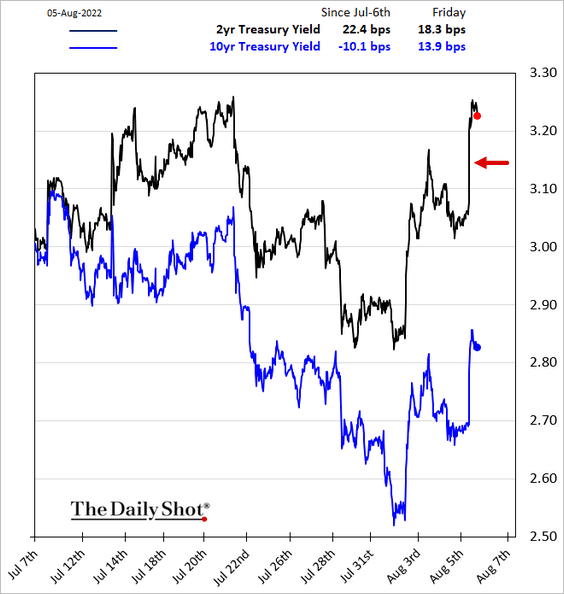
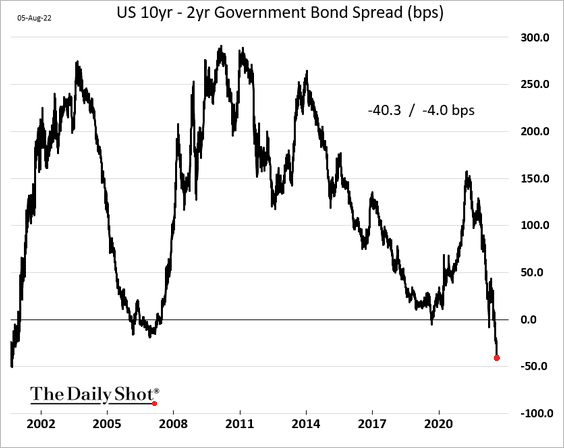
… resulting in deeper curve inversion.
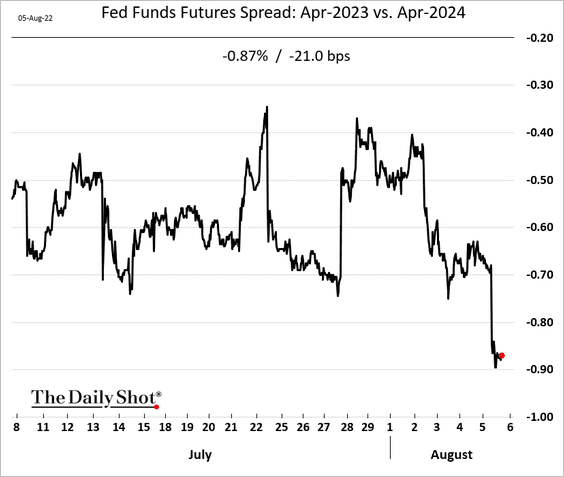
• The market expects nearly 90 bps of rate hikes between next April and April of 2024.
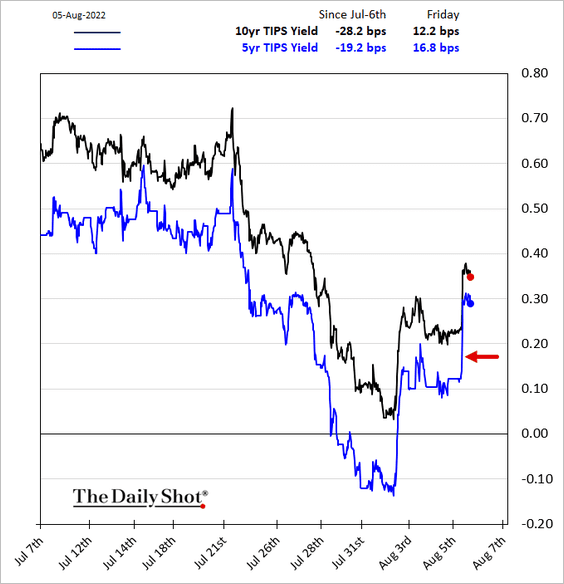
• Real yields climbed.
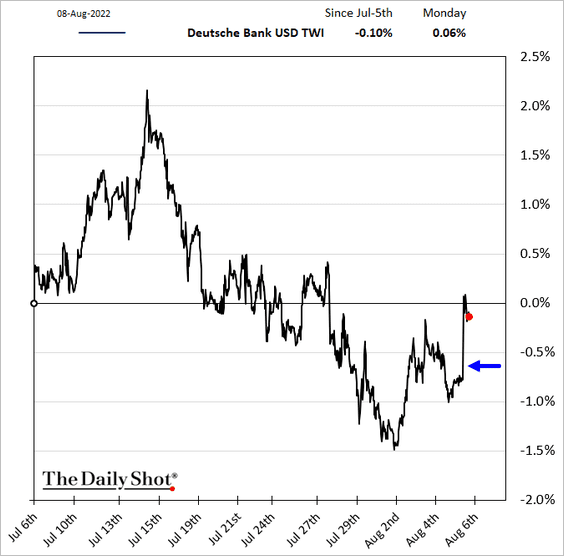
• The dollar jumped.
——————–
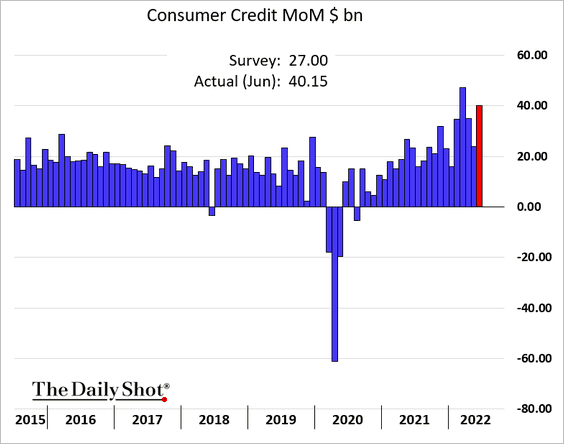
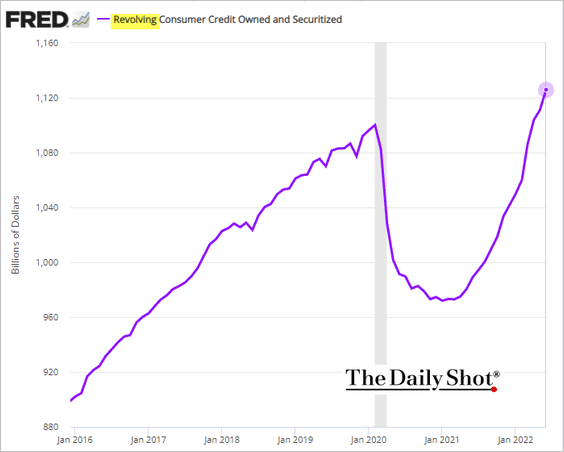
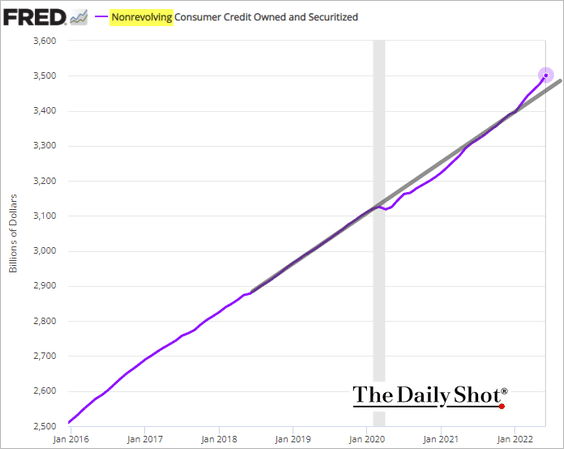
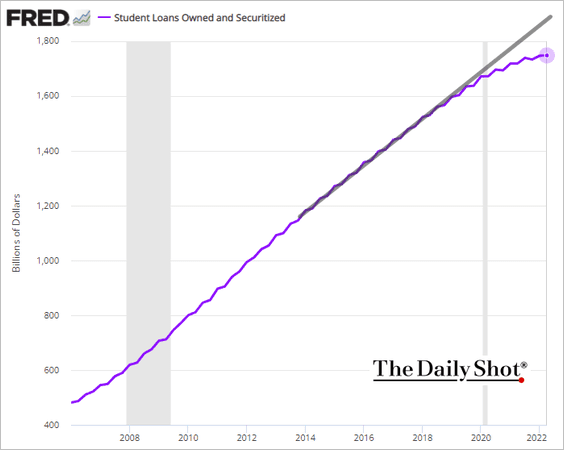
3. Next, we have some updates on household credit.
• Consumer credit balances increased more than expected in June.
• Credit card balances continue to move higher.
• Non-revolving credit is outpacing the pre-COVID trend, driven by auto loans.
• Student debt growth continues to slow.
• Consumer credit delinquency rates have bottomed.
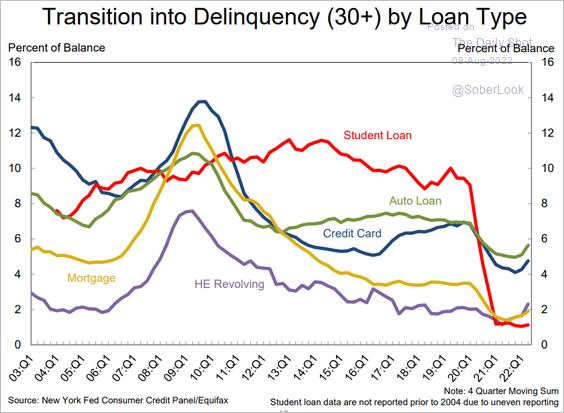 Source: Federal Reserve Bank of New York
Delinquencies among low-income groups in the US are starting to rise, particularly in the South (2 charts).
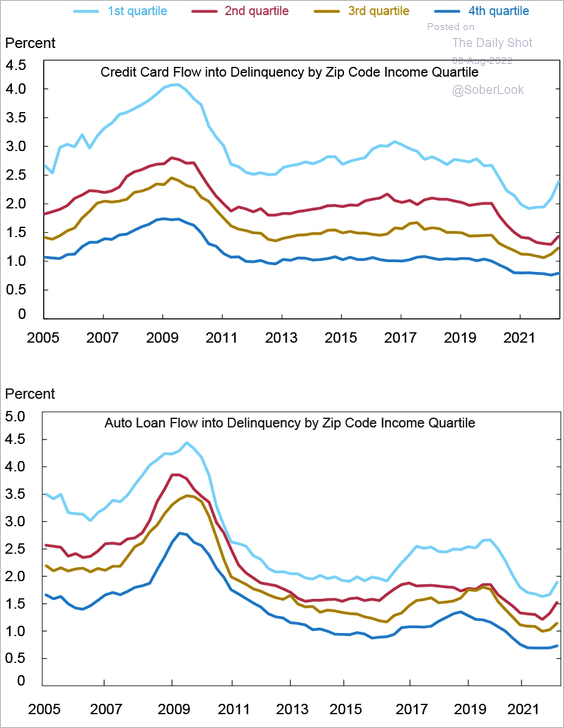 Source: Liberty Street Economics Read full article
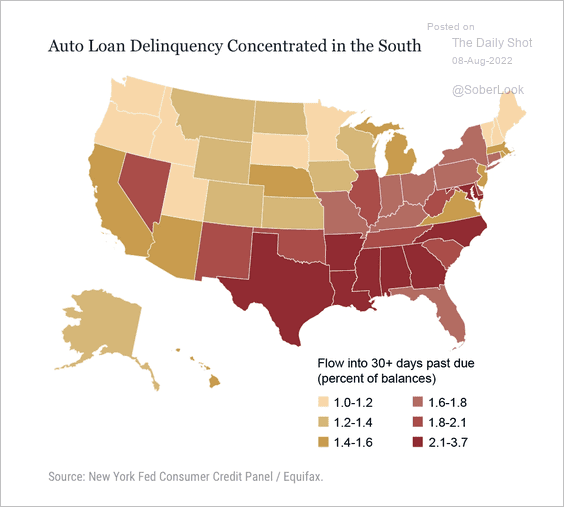 Source: Liberty Street Economics Read full article
• Banks are tightening credit on auto loans but are still easing lending standards on credit cards.
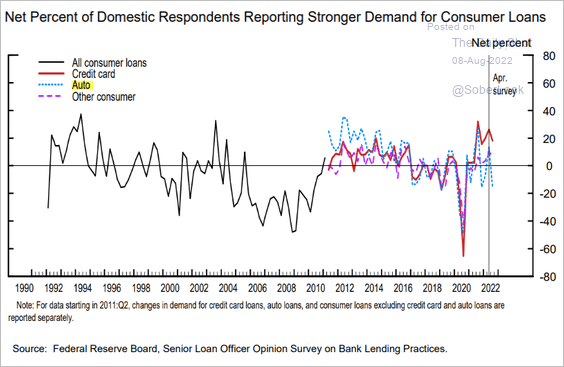 Source: Board of Governors of The Federal Reserve System
• This chart shows mortgage foreclosures by age.
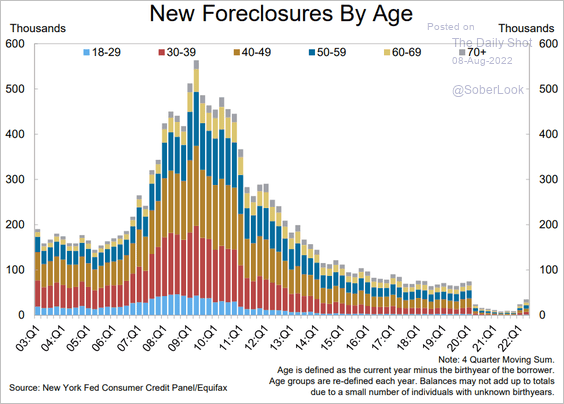 Source: Federal Reserve Bank of New York
• Household debt has been holding steady over the past decade as a share of GDP.
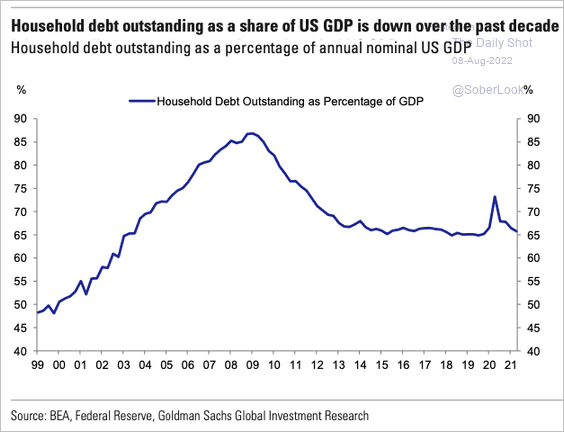 Source: Goldman Sachs; @SamRo
——————–
4. What do asset prices tell us about recession probability?
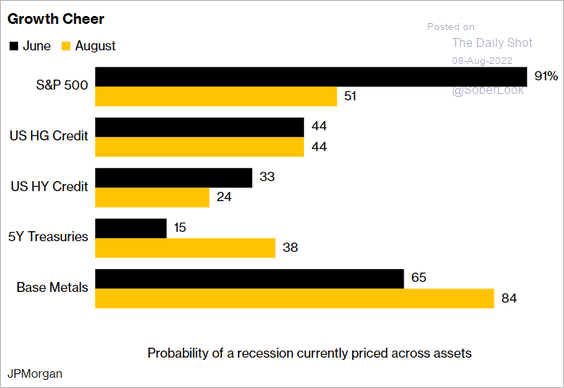 Source: @markets Read full article
Leading indicators continue to signal a substantial slowdown ahead.
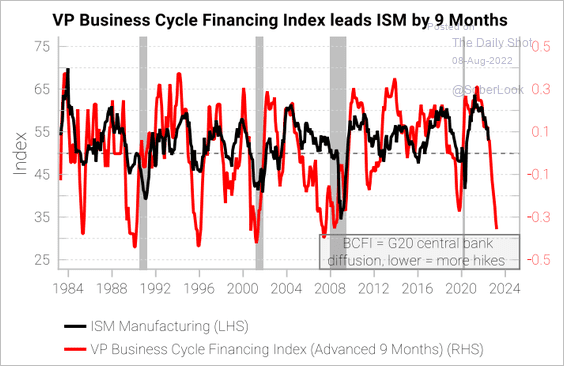 Source: Variant Perception
Back to Index
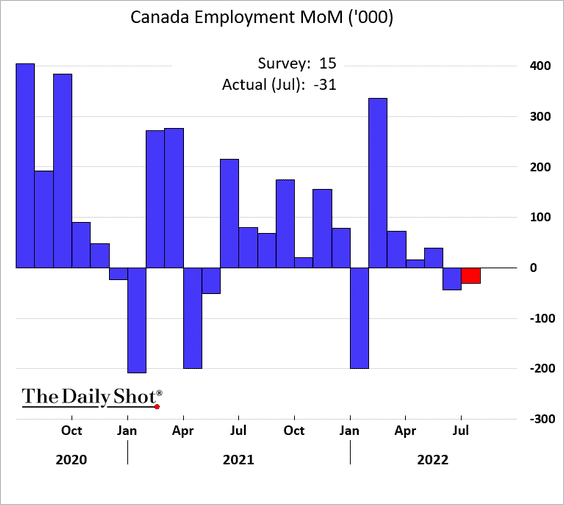
Canada
1. The employment report was disappointing, with job losses for the second month in a row.
• Losses were in service sectors.
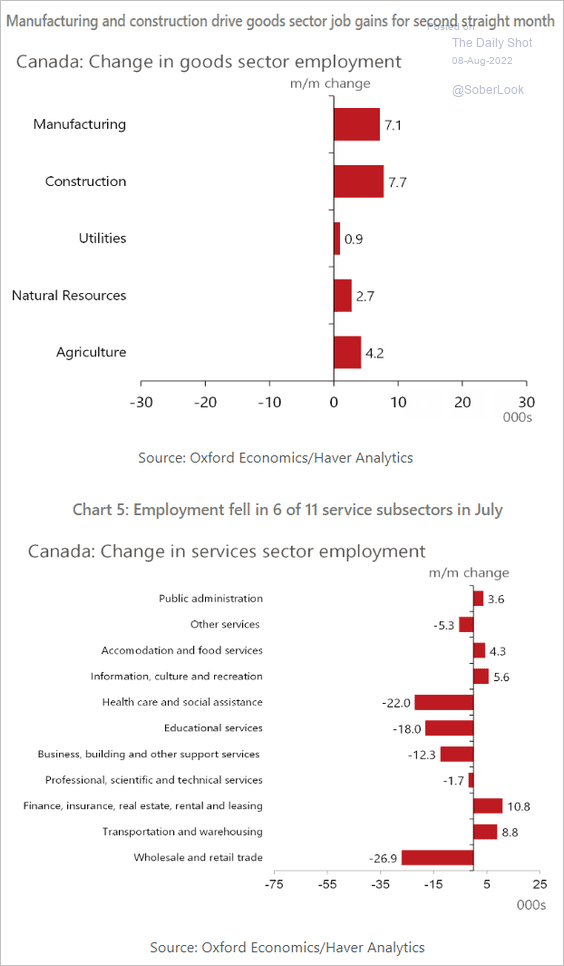 Source: Oxford Economics
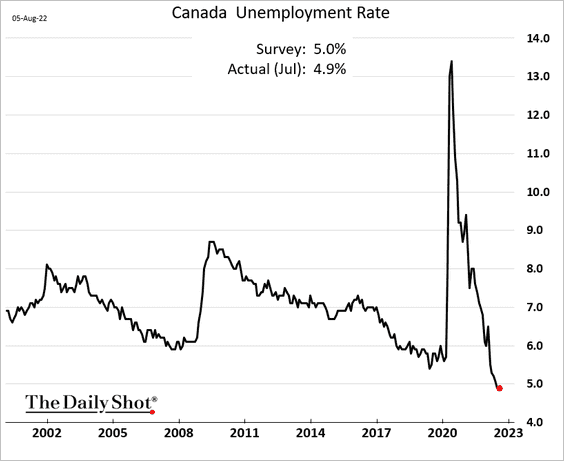
• But the labor market remains tight, with the unemployment rate holding near multi-decade lows.
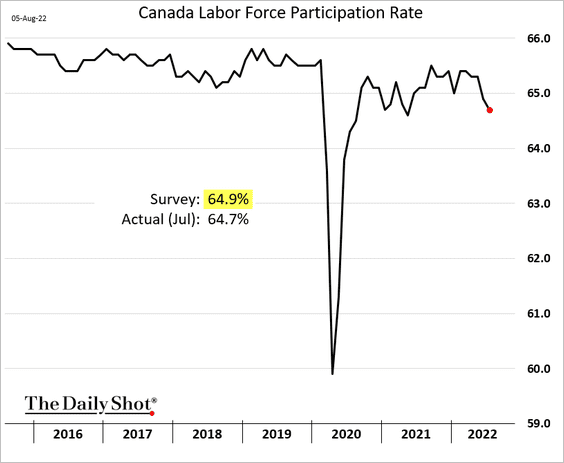
• Canada’s labor force participation keeps moving lower.
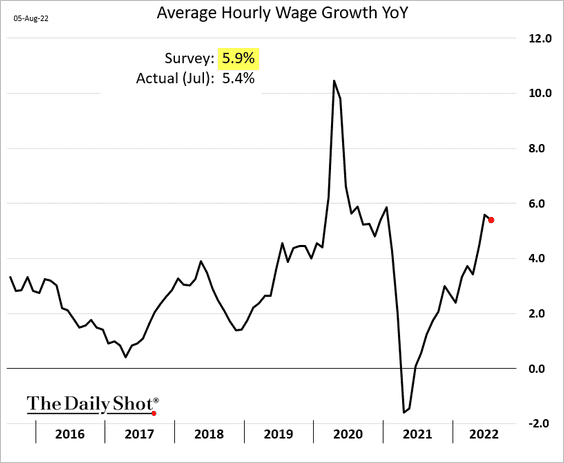
• Wage growth was softer than expected.
——————–
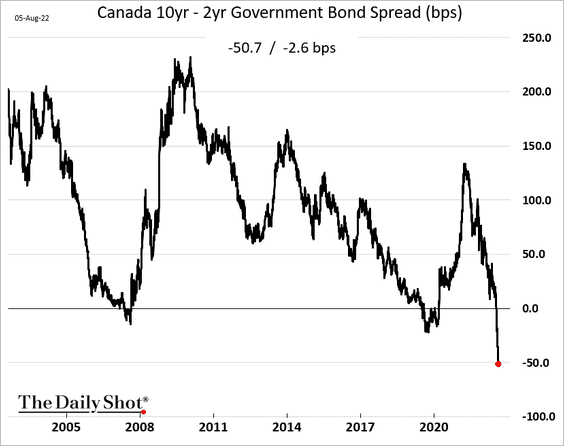
2. The yield curve inversion deepened further.
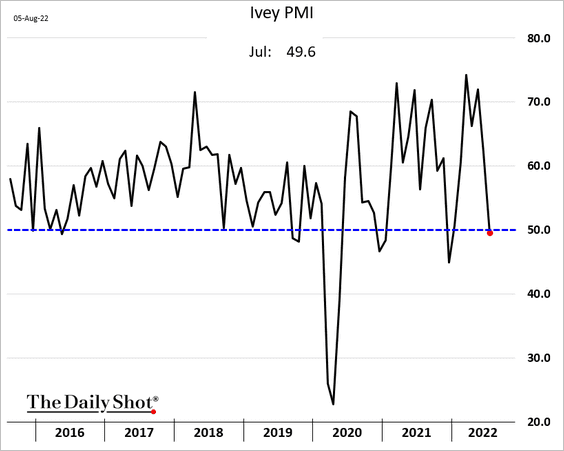
3. Business activity growth stalled last month, according to Ivey PMI.
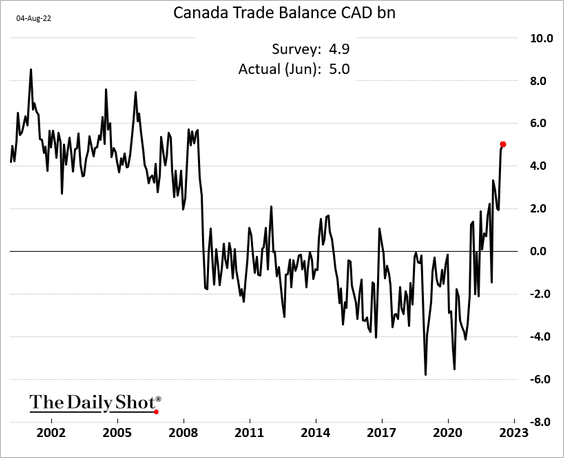
4. The trade surplus hit a multi-year high, boosted by energy.
Back to Index
The United Kingdom
1. Barclays expects the BoE to stop at 2%.
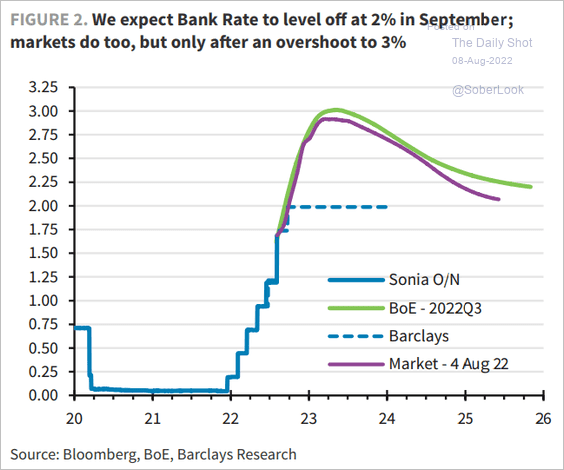 Source: Barclays Research
2. Energy subsidies could have a substantial impact on the CPI.
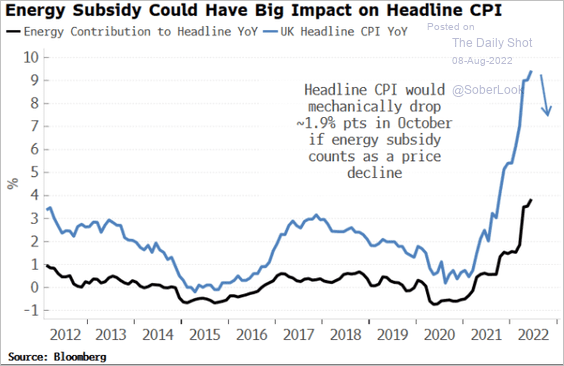 Source: Simon White, Bloomberg Markets Live Blog
Back to Index
The Eurozone
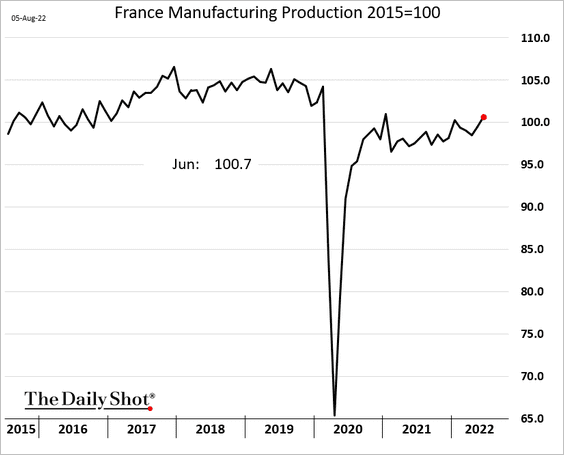
1. Industrial production reports have been mixed. As we saw last week, Germany showed a small uptick (a decline was expected).
• French factory output was higher but below forecasts.
Here are the components of industrial production.
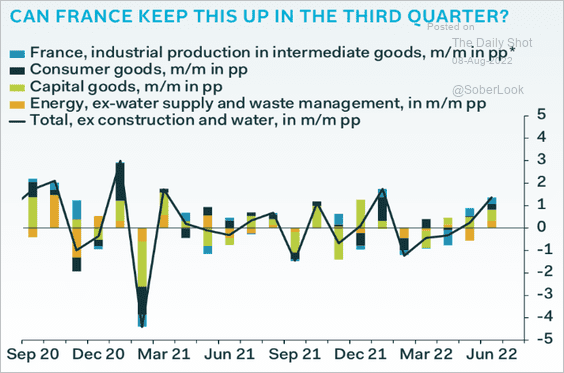 Source: Pantheon Macroeconomics
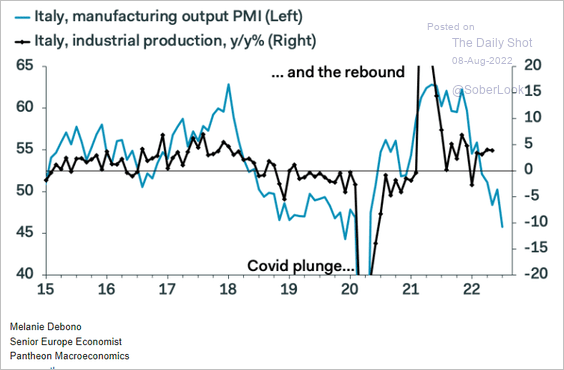
• Italy’s industrial output is declining, …
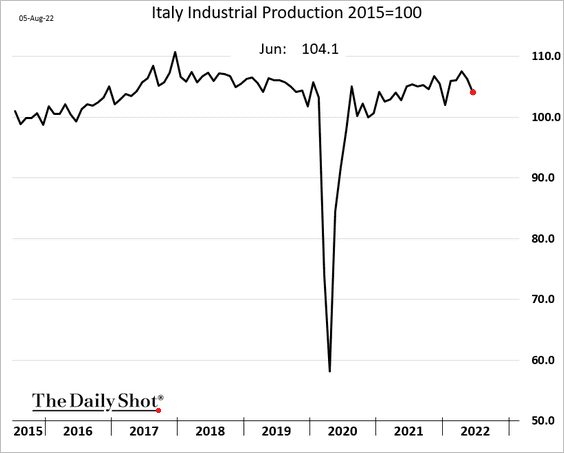
… and there is more pain ahead.
 Source: Pantheon Macroeconomics
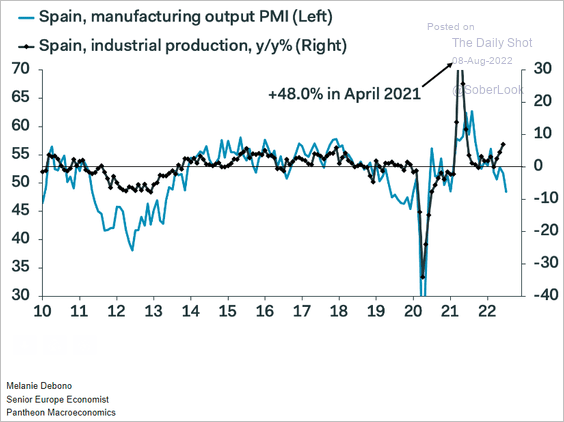
• Spain’s industrial production has been surging.
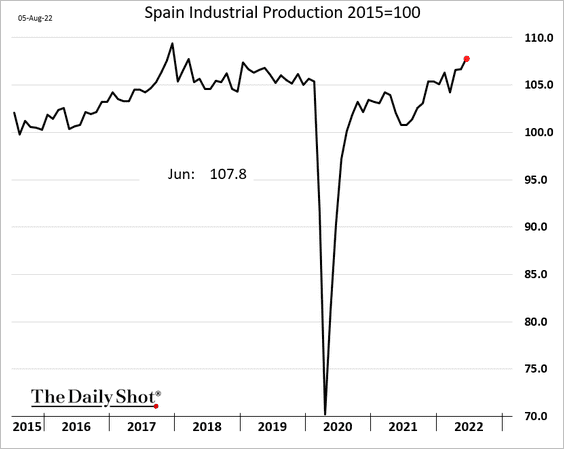
But these gains are not expected to last.
 Source: Pantheon Macroeconomics
——————–
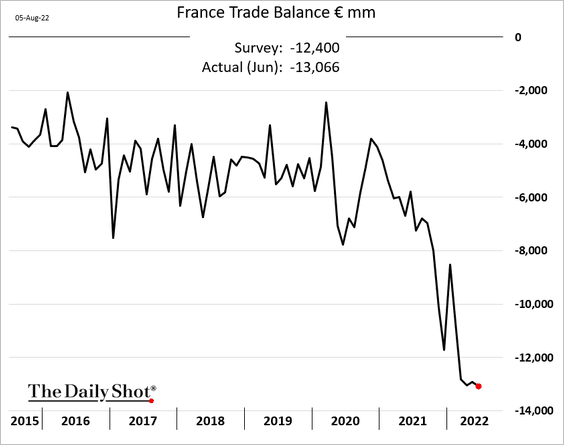
2. The trade deficit in France hit a new record, driven by energy costs.
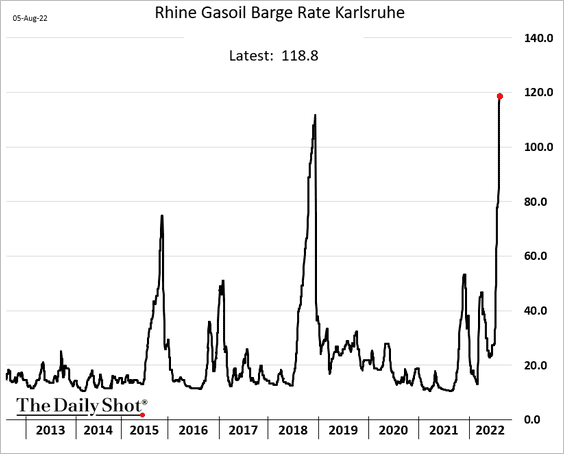
3. Fuel shipping on the Rhine is becoming extremely expensive.
 Source: @RefinedRachel, @markets Read full article
——————–
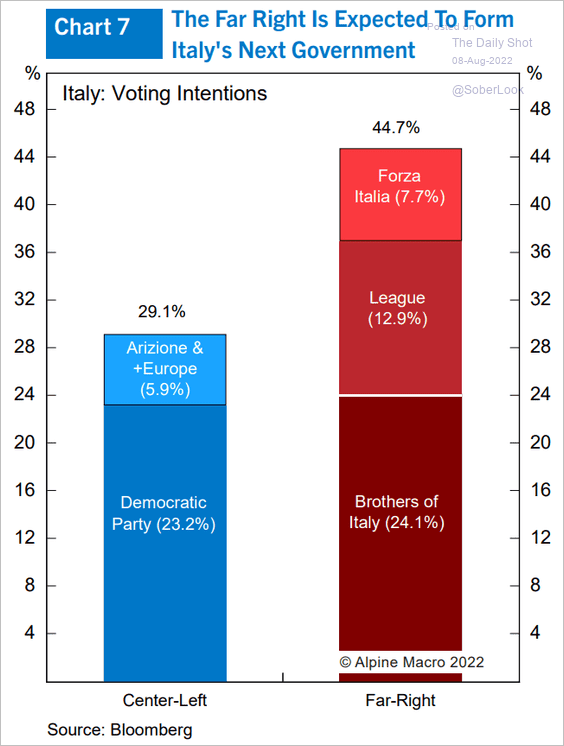
4. Italy’s next government will probably be formed by the far-right parties.
 Source: Alpine Macro
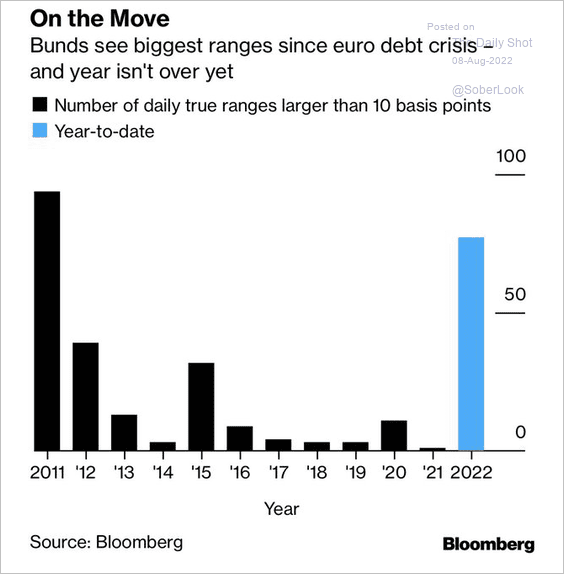
5. Bunds have been very volatile this year.
 Source: @GregDaco, @greg_ritchie Read full article
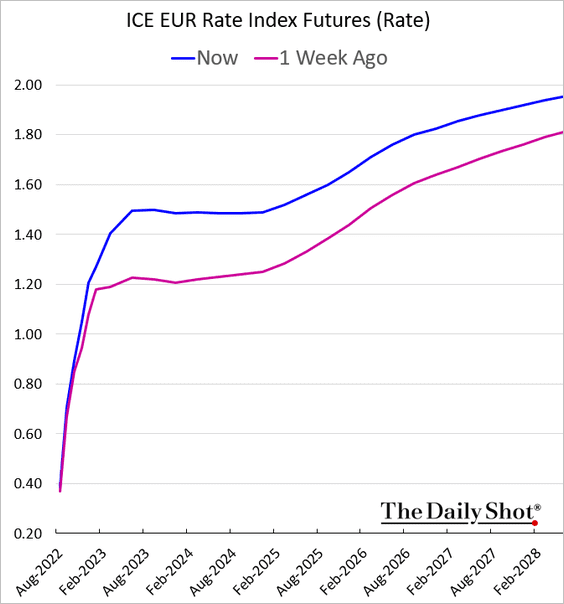
6. The expected ECB rate hike trajectory climbed last week.
7. More households are planning a vacation.
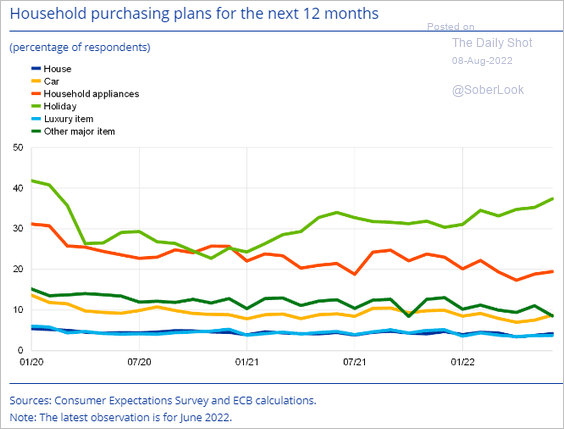 Source: ECB Read full article
Back to Index
Europe
1. The Czech central bank expects inflation to peak at 20%.
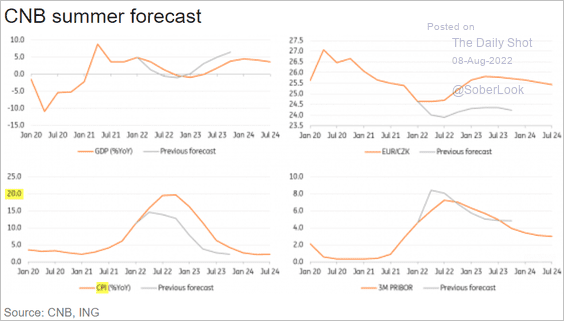 Source: ING
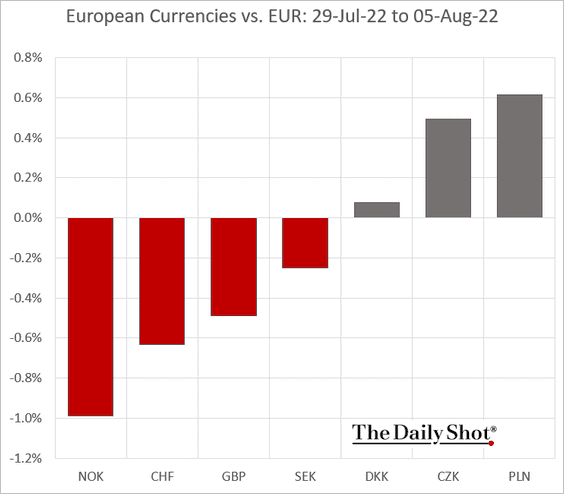
2. Central/Eastern European currencies outperformed last week.
3. Norway’s economic activity is outperforming the Eurozone.
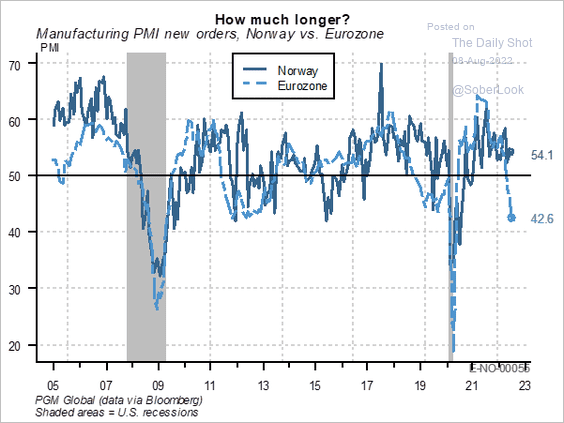 Source: PGM Global
4. Could gas rationing be avoided this winter?
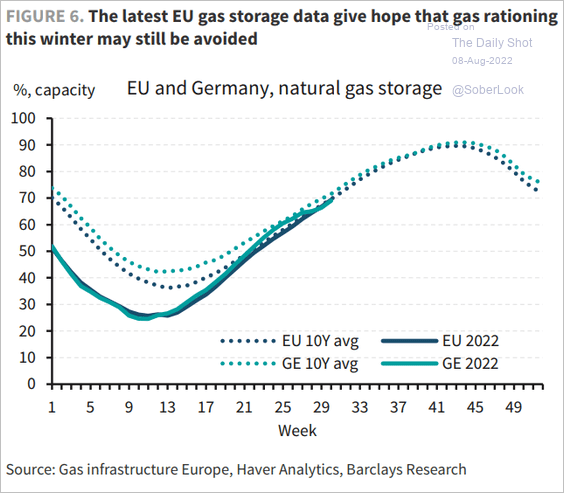 Source: Barclays Research
5. The EU is increasingly dependent on China for its export markets.
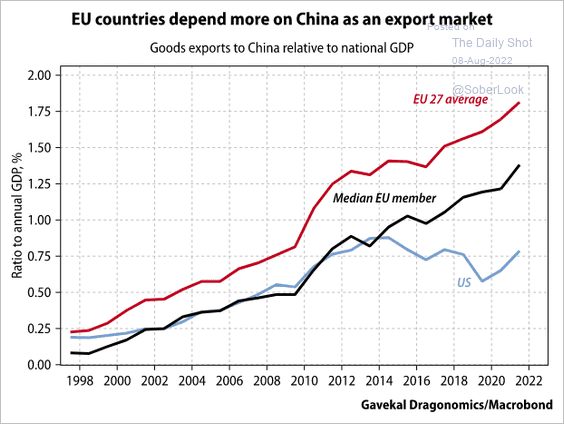 Source: Gavekal Research
6. This chart shows the cost-of-living increases for higher- and lower-income households.
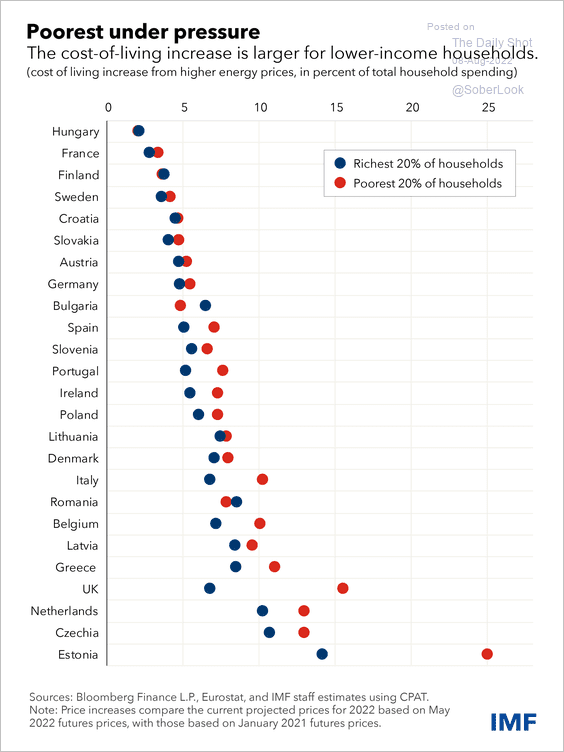 Source: IMF Read full article
Back to Index
Japan
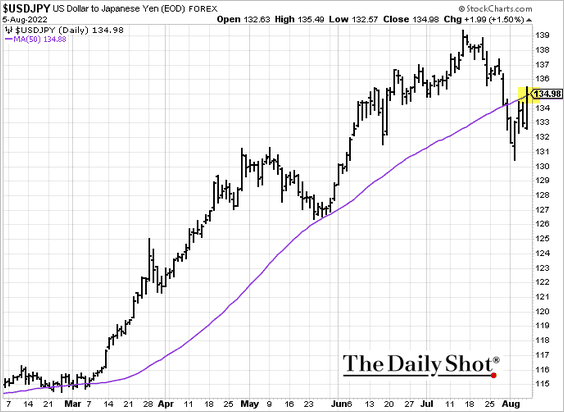
1. Dollar-yen is at resistance (at the 50-day moving average).
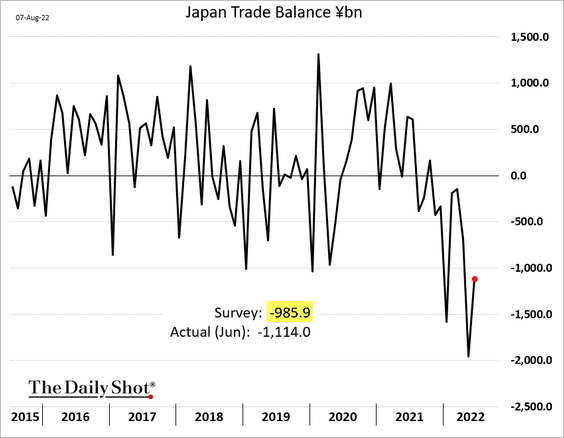
2. The trade deficit was wider than expected in June.
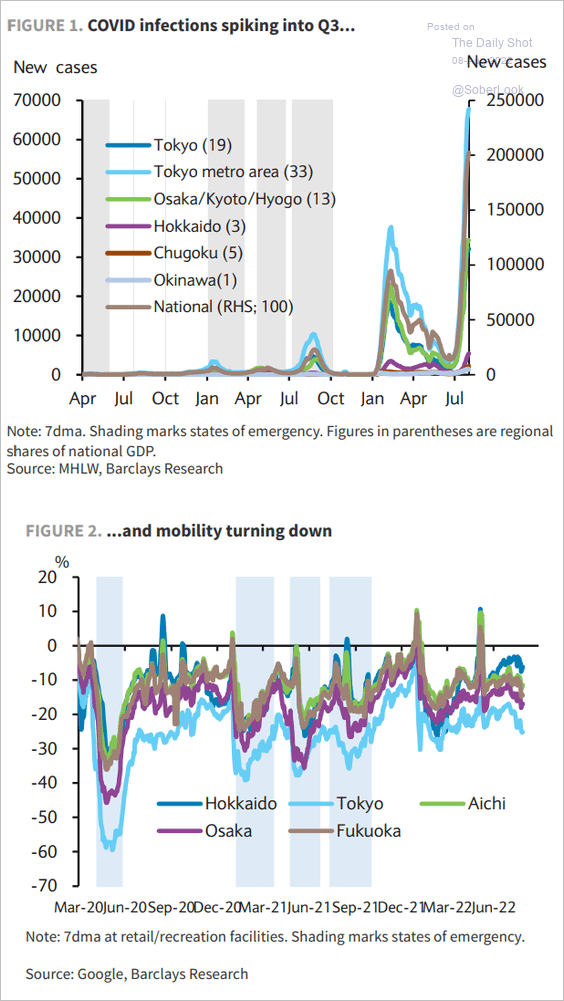
3. Mobility has been turning lower due to COVID.
 Source: Barclays Research
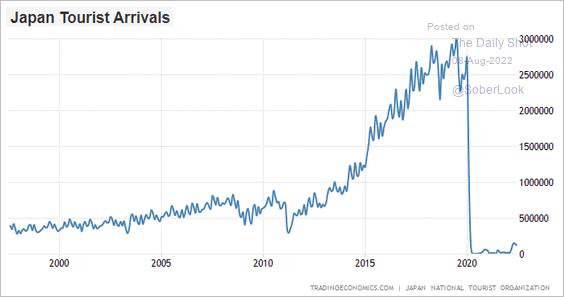
This chart shows Japan’s tourist arrivals.
 Source: @LynAldenContact
——————–
4. Japanese equity valuations are the most attractive among major developed market regions, and its weak currency could be an advantage, according to Wellington.
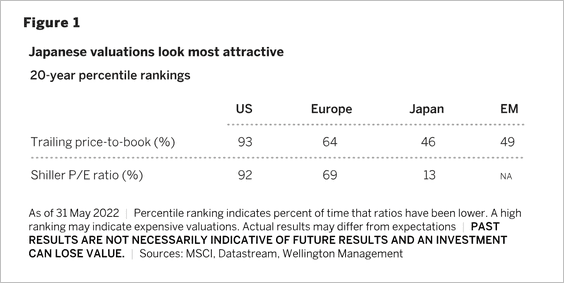 Source: Wellington Management Read full article
Back to Index
Asia – Pacific
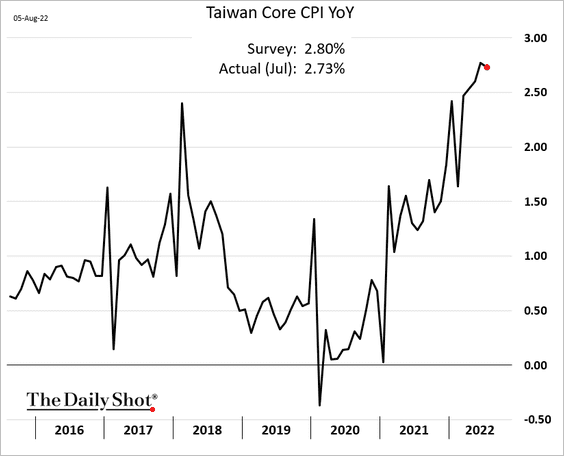
1. Taiwan’s core CPI was a bit below estimates.
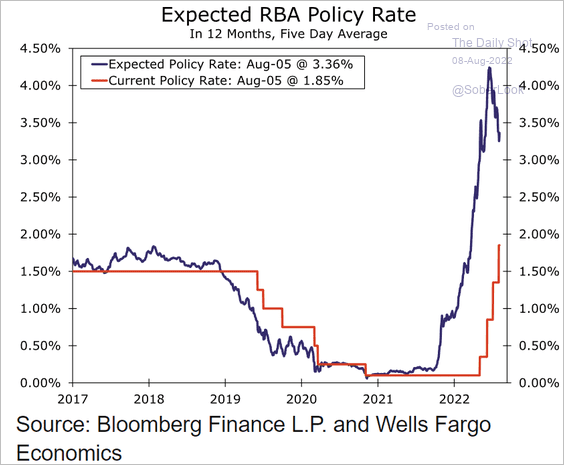
2. RBA rate hike expectations have been moving lower.
 Source: Wells Fargo Securities
Back to Index
China
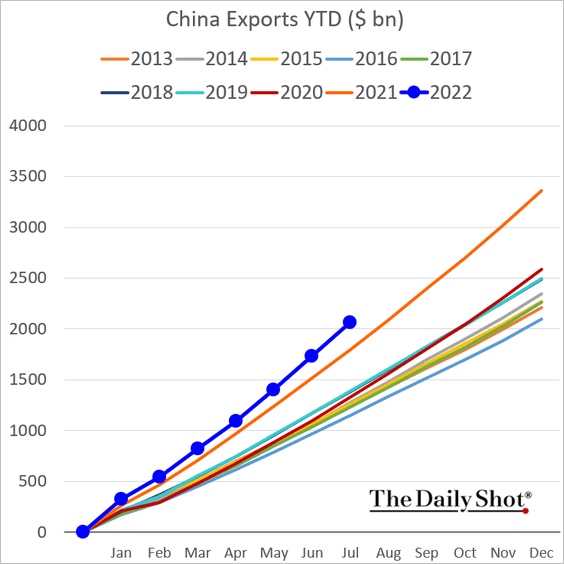
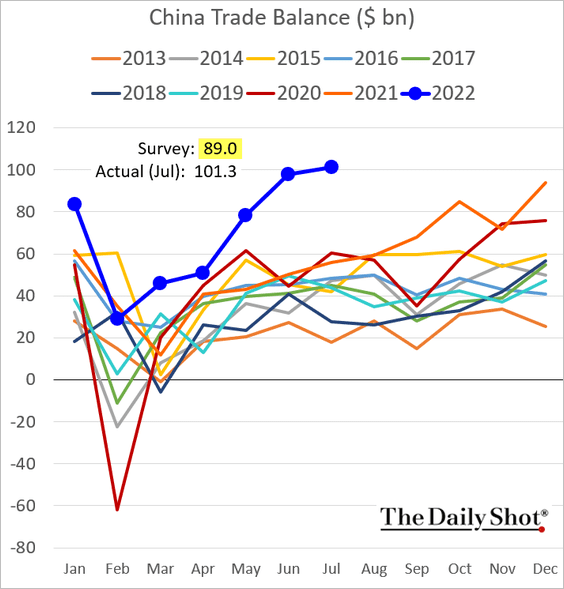
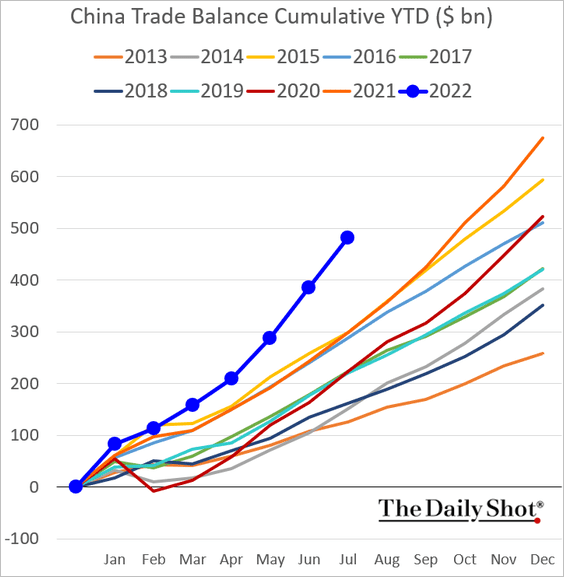
1. The trade surplus topped forecasts, driven by strong exports.
 Source: AP Read full article
• Exports:
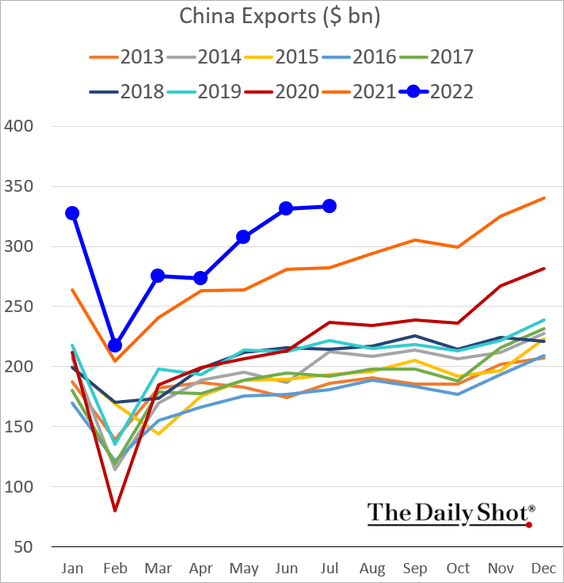
• Cumulative year-to-date exports:
• Trade balance:
• Cumulative:
——————–
2. Economic activity remains weak, partly driven by recent lockdowns.
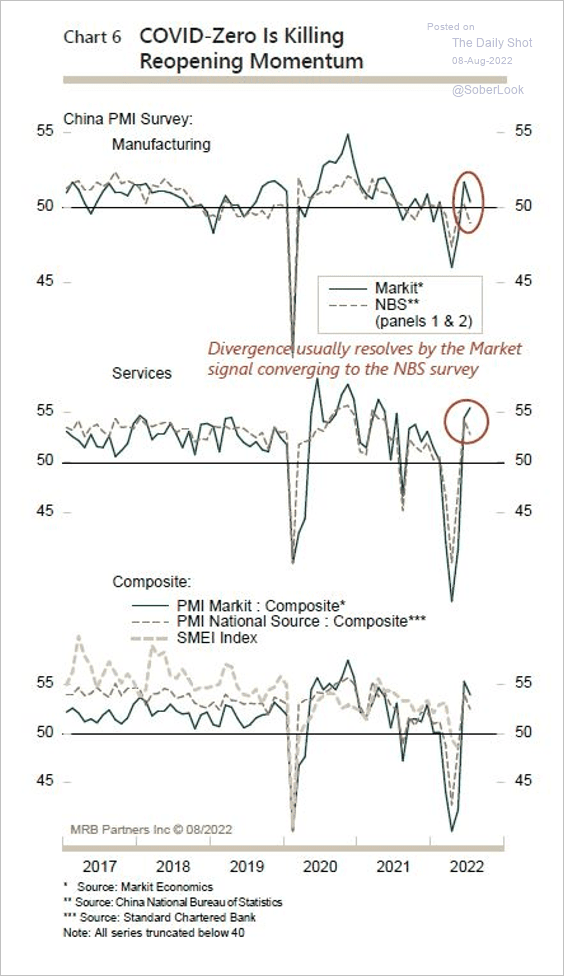 Source: MRB Partners
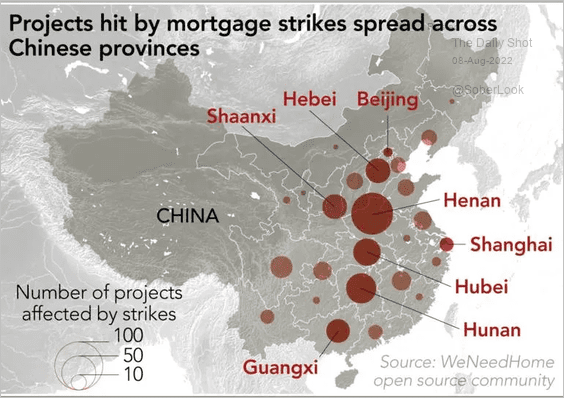
3. Mortgage strikes have been spreading across provinces as a majority of pre-sold homes remain unfinished (2 charts).
 Source: Nikkei Asia Read full article
 Source: Nikkei Asia Read full article
——————–
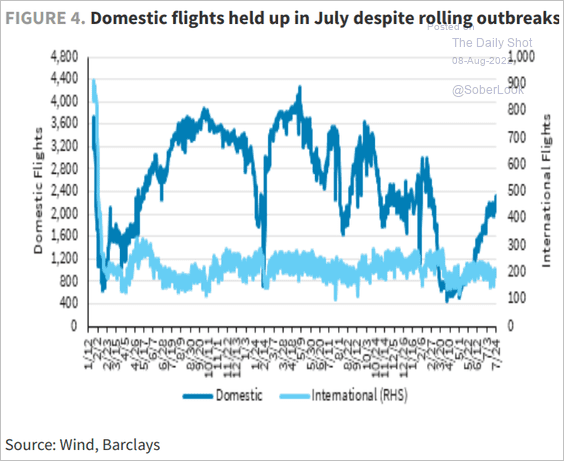
4. Domestic flights have been rebounding.
 Source: Barclays Research
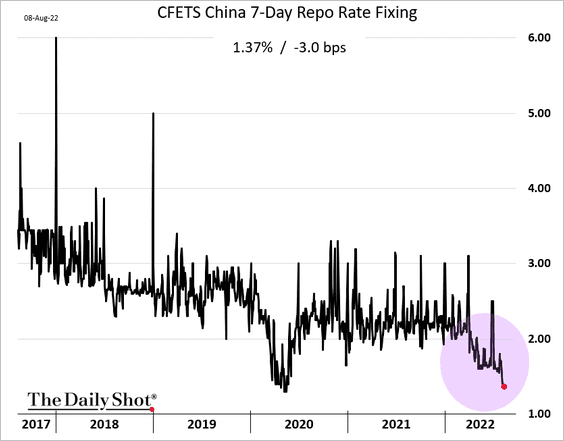
5. The PBoC’s “stealth” easing continues.
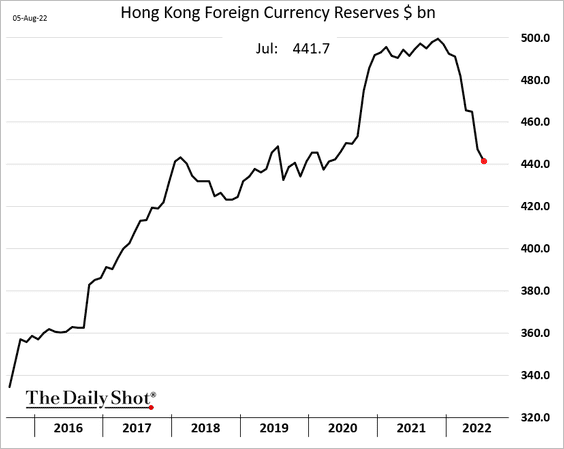
6. Hong Kong’s FX reserves are back at pre-COVID levels.
Back to Index
Emerging Markets
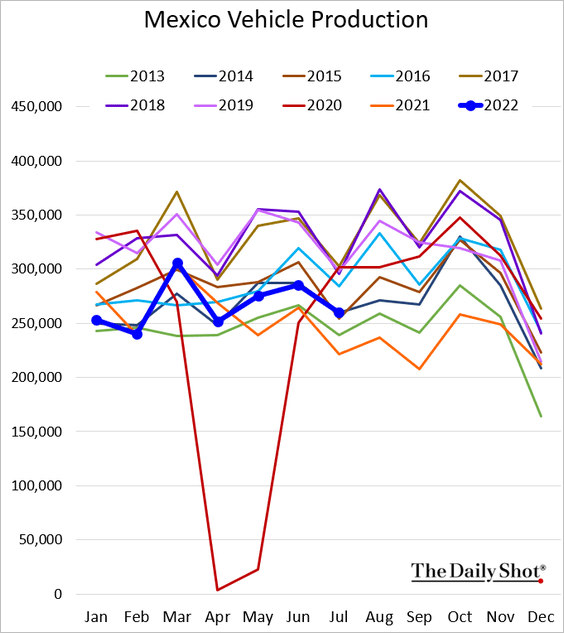
1. Mexico’s automobile production is running at 2015 levels.
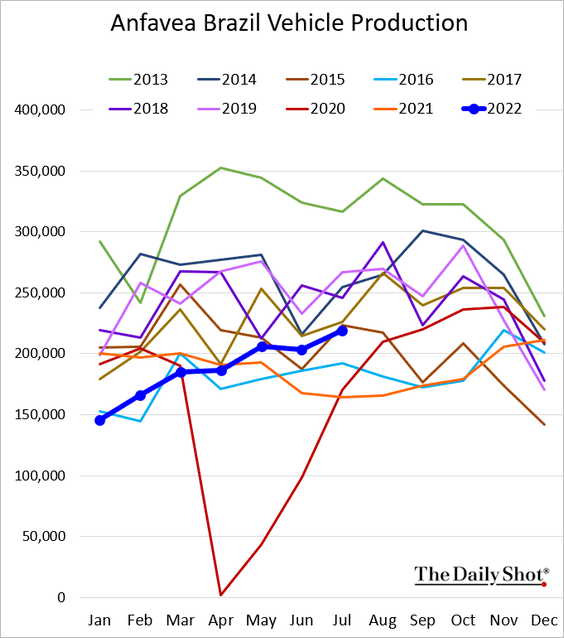
Brazil’s vehicle production is also depressed but has been showing improvement.
——————–
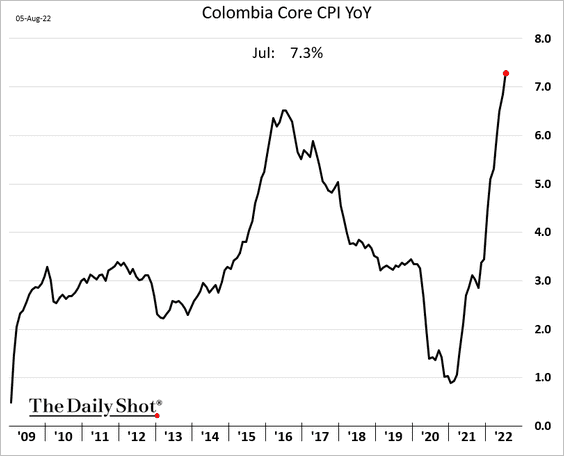
2. Colombia’s inflation continues to surge.
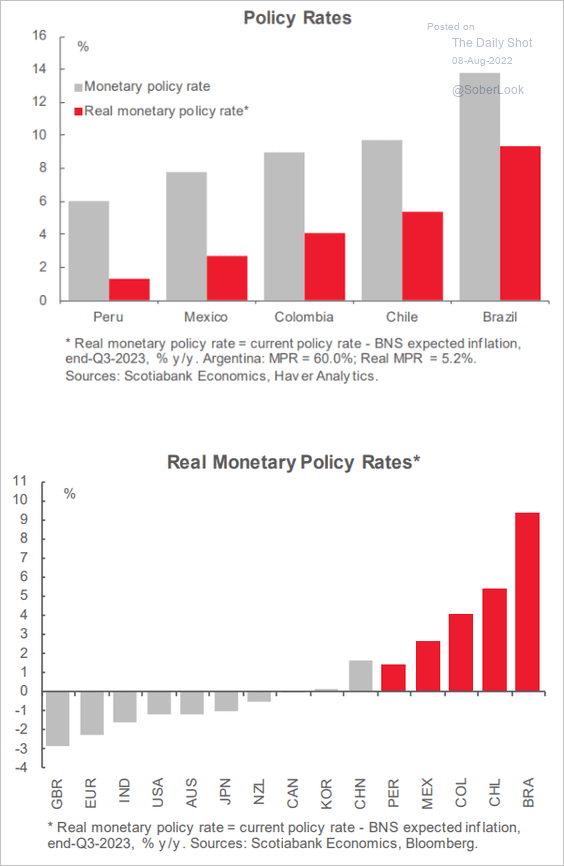
3. LatAm real policy rates are positive.
 Source: Scotiabank Economics
4. The RBI’s growth and inflation forecasts were roughly unchanged.
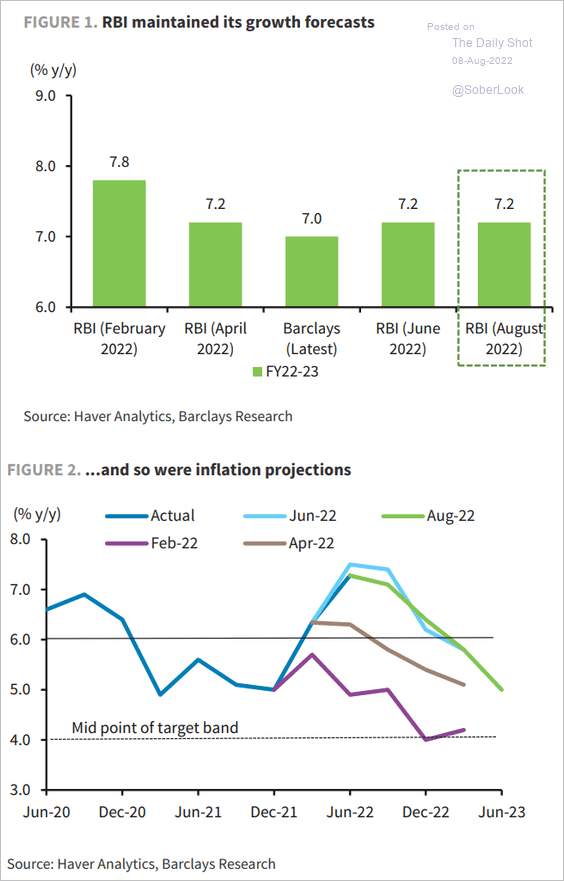 Source: Barclays Research
5. EM Asia aggregate manufacturing PMI showed slowing growth last month.
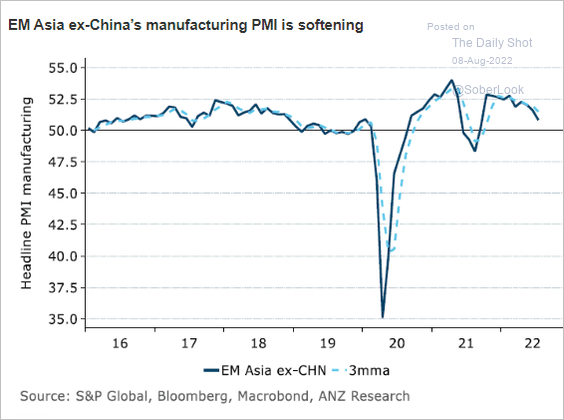 Source: @ANZ_Research
6. EM debt flows are turning positive.
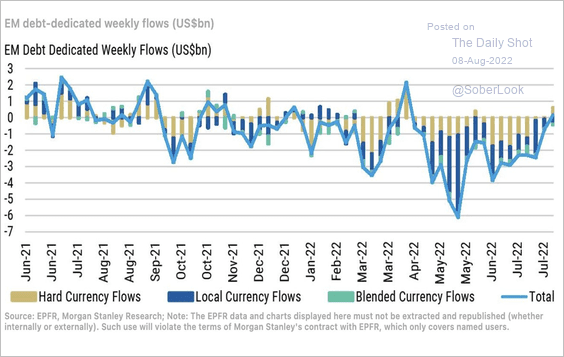 Source: Morgan Stanley Research
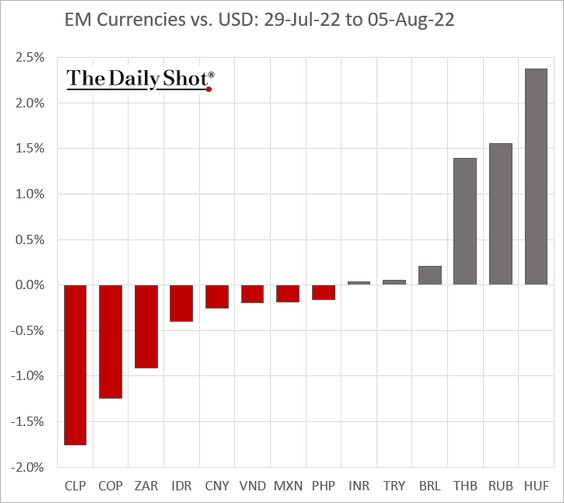
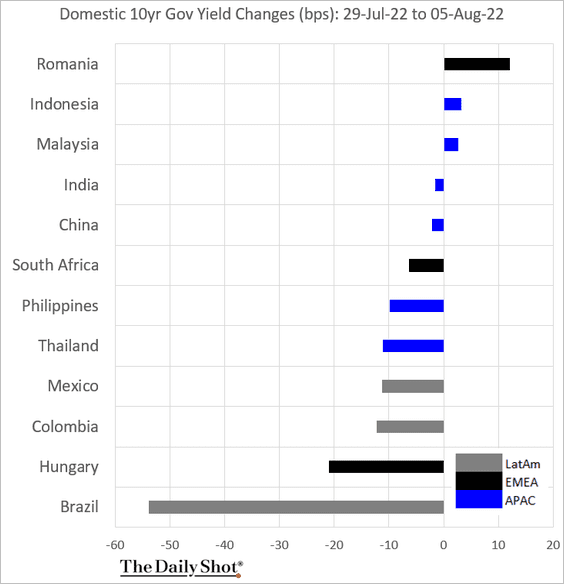
7. Next, we have some performance data from last week.
• Currencies:
• Equity ETFs:
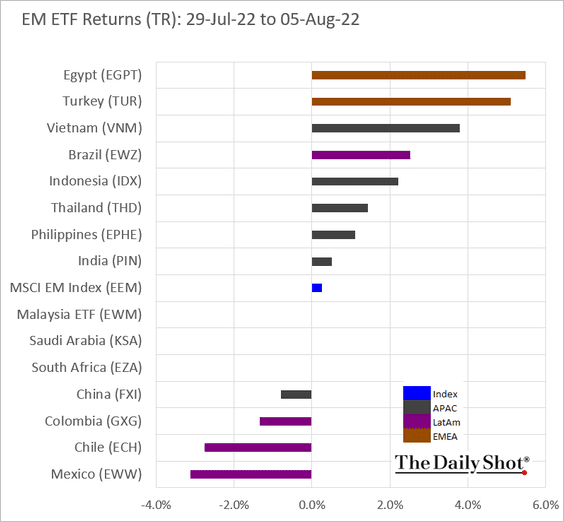
• Local-currency bonds:
Back to Index
Commodities
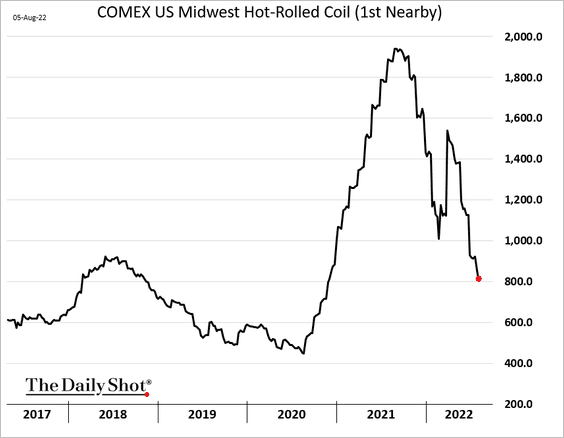
1. US steel prices have been moving lower.
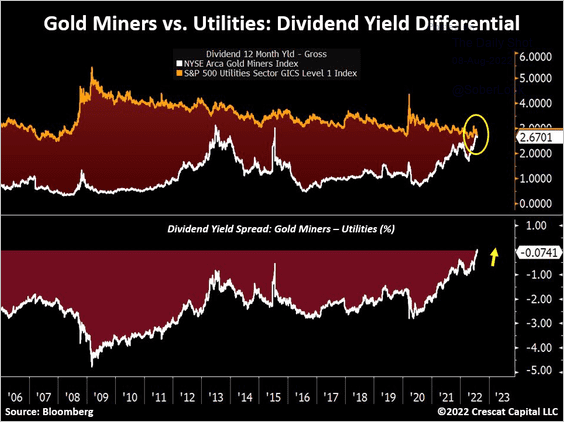
2. Gold miners are almost paying more dividends than utility stocks.
 Source: @TaviCosta
3. Hedge funds have been cutting their bets on agricultural commodities.
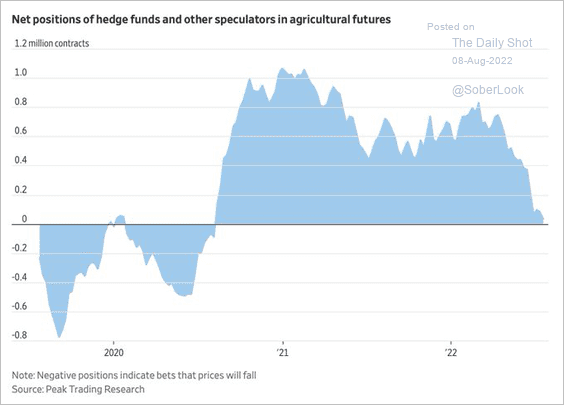 Source: @jessefelder, @WSJ Read full article
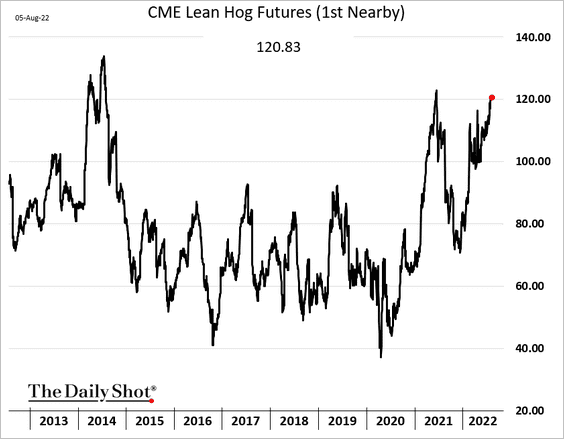
4. Chicago hog futures are nearing a multi-year high.
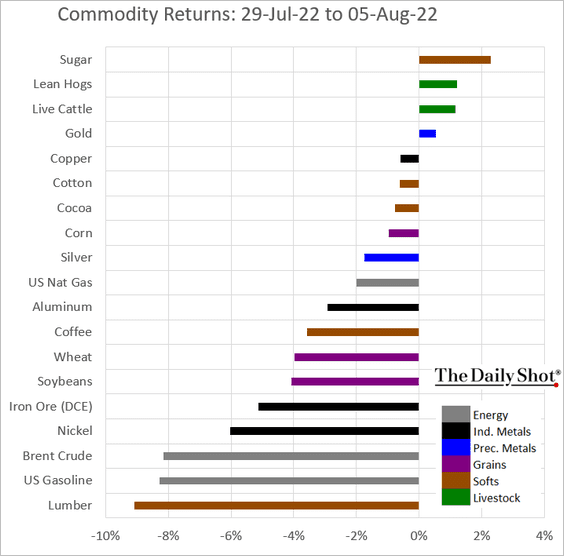
5. Finally, we have last week’s performance across key commodity markets.
Back to Index
Equities
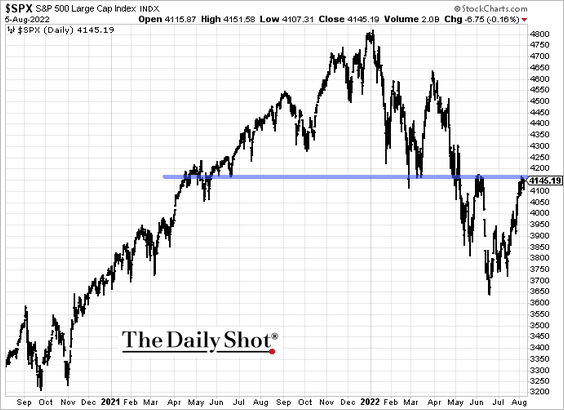
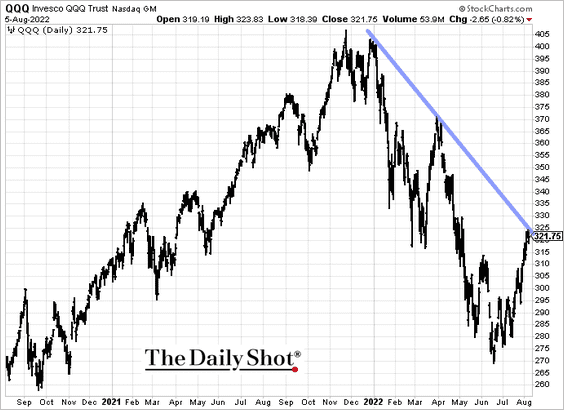
1. Key indices are at resistance.
• The S&P 500:
• The Nasdaq 100:
——————–
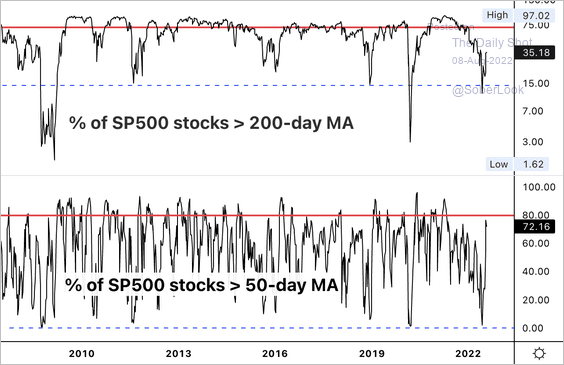
2. S&P 500 breadth indicators are improving, similar to the lows in 2011 and 2018. However, short-term measures appear stretched, with 72% of stocks trading above their 50-day moving average.
 Source: Aazan Habib, Paradigm Capital
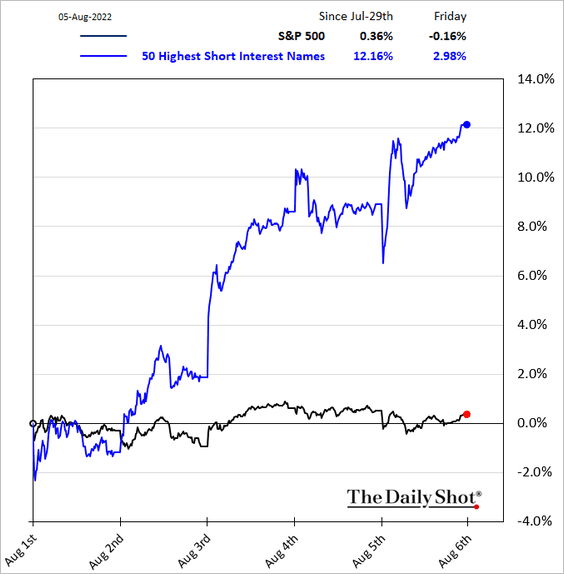
3. A short squeeze supported last week’s gains.
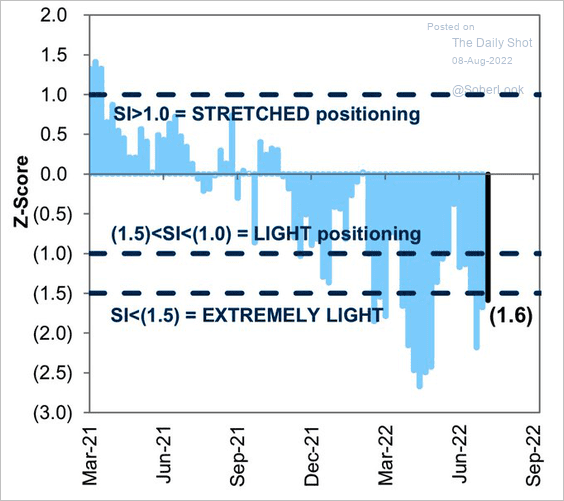
4. Hedge funds do not have much conviction in the current market rebound. The chart shows hedge fund positioning in the S&P 500 futures.
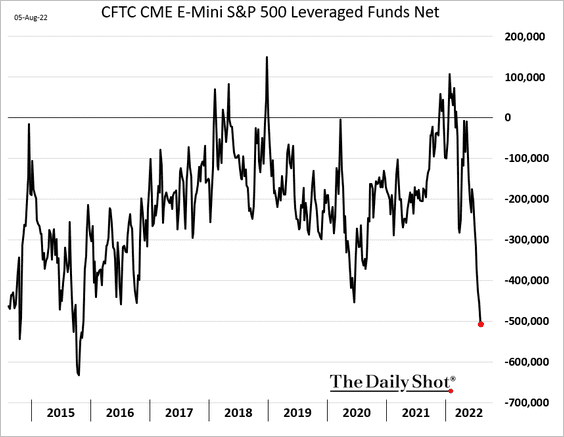
Sentiment remains negative.
 Source: Goldman Sachs; @WallStJesus
——————–
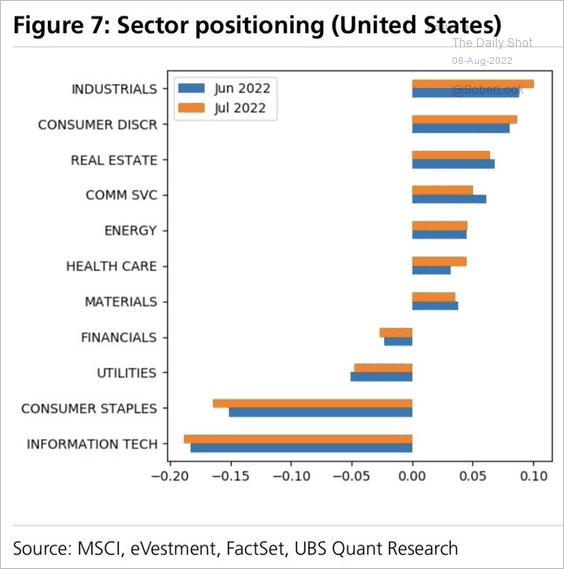
5. How has sector positioning changed between June and July?
 Source: UBS Research; @WallStJesus
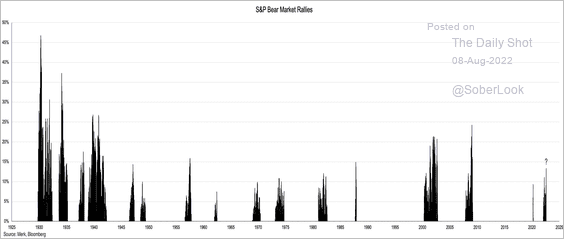
6. Here is a look at past S&P 500 bear market rallies.
 Source: @nicholastreece
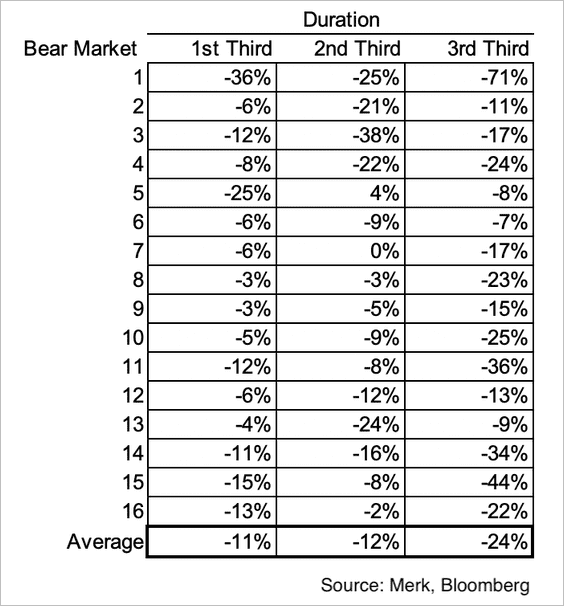
Bear market declines tend to be backloaded, with the largest declines coming in the final third portion.
 Source: @nicholastreece
——————–
7. Equities have been the worst-performing assets during periods of high inflation and slowing economic growth (2 charts).
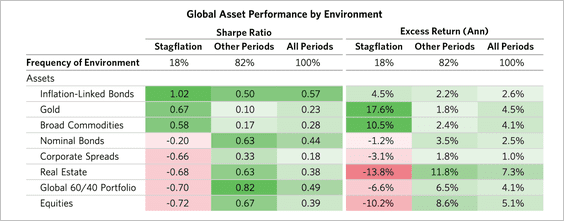 Source: Bridgewater Associates Read full article
 Source: Fidelity Investments Read full article
——————–
8. Tightening liquidity conditions pose a downside risk for global stocks.
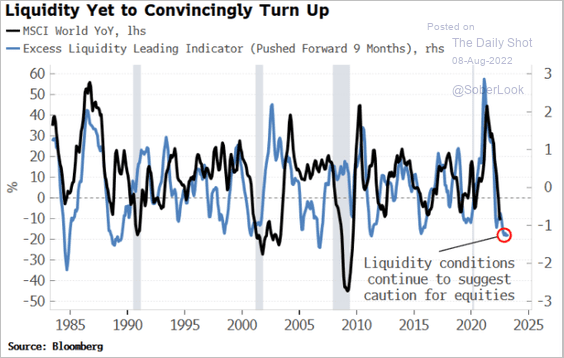 Source: Simon White, Bloomberg Markets Live Blog
9. More tech stocks are trading above their 200-day moving average, which could support breakouts relative to the overall market.
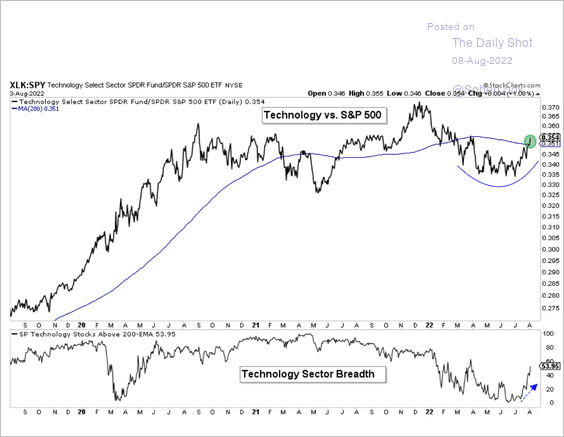 Source: Aazan Habib, Paradigm Capital
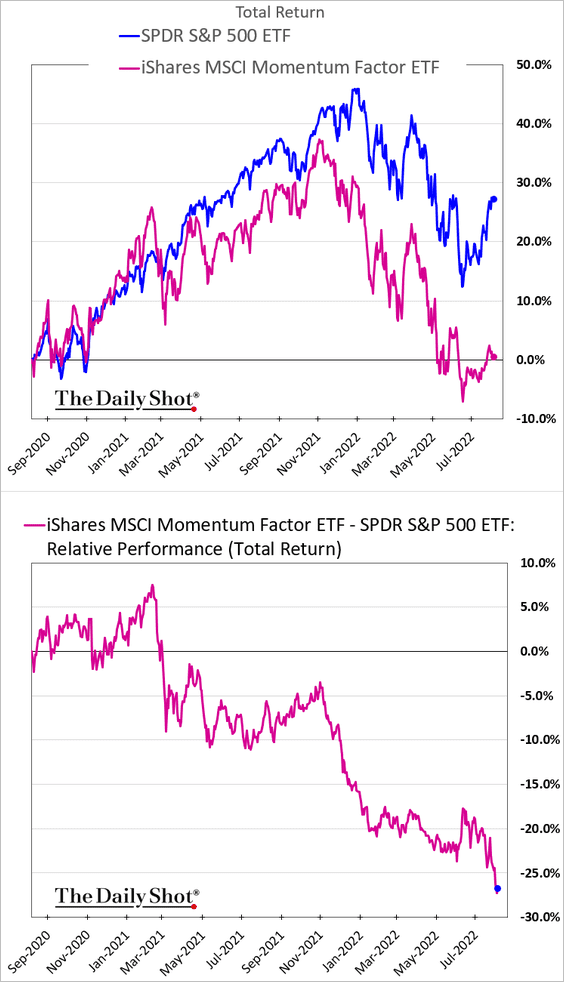
10. It’s been a rough couple of years for momenum investors.
11. These charts show the Q3-22 and 2023 earnings consensus evolution for the US, Europe, Japan, and Emerging Markets.
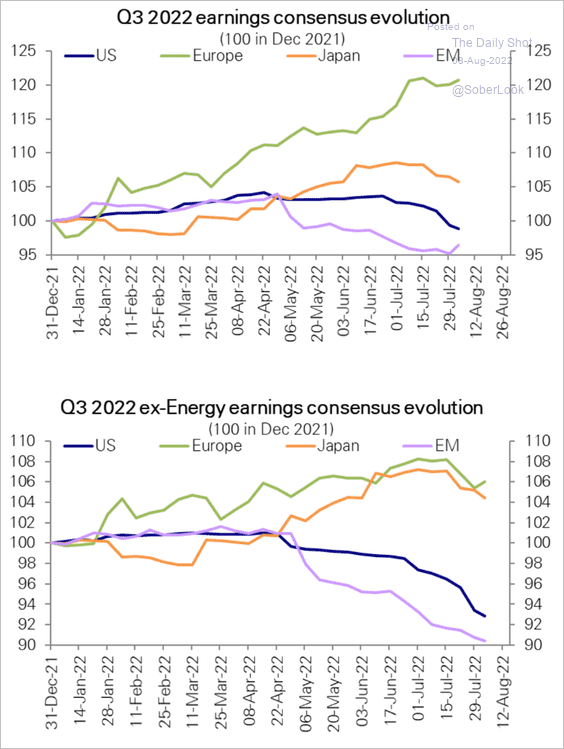 Source: Deutsche Bank Research
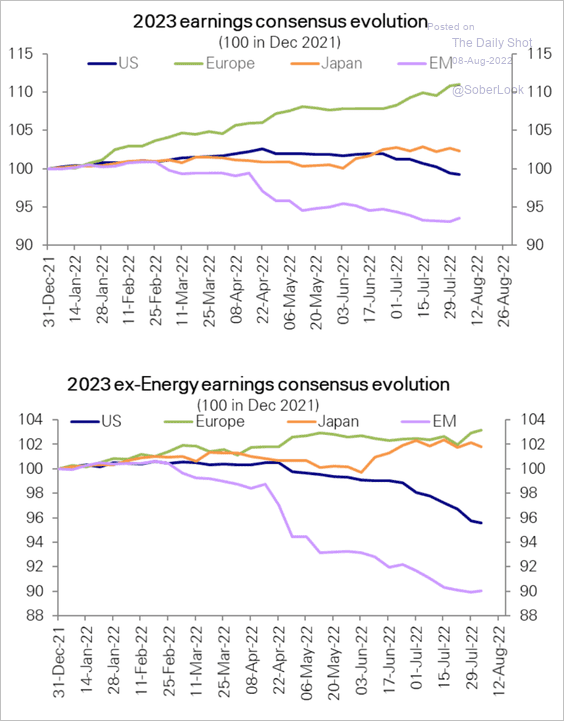 Source: Deutsche Bank Research
——————–
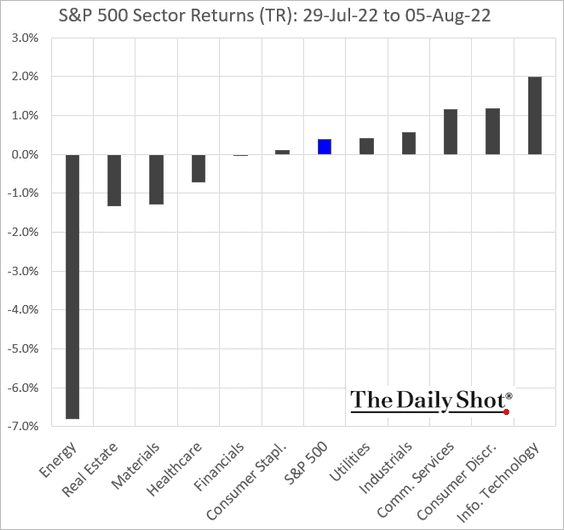
12. Finally, we have some performance data for the first week of the month.
• Sectors:
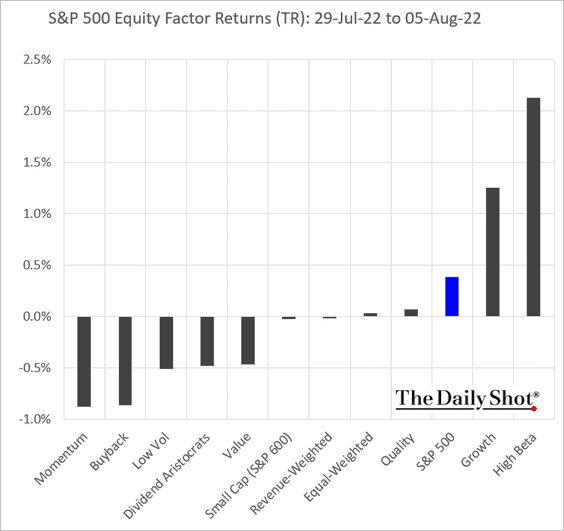
• Equity factors:
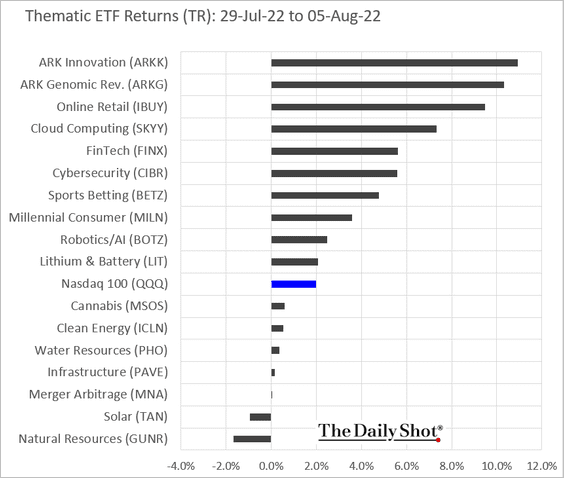
• Thematic ETFs:
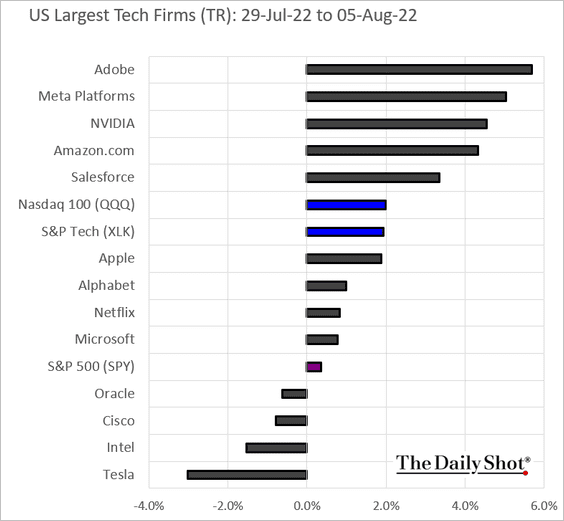
• Largest tech firms:
Back to Index
Alternatives
1. First-time private equity funds have seen a decline in fundraising activity this year following a lucrative run in 2021.
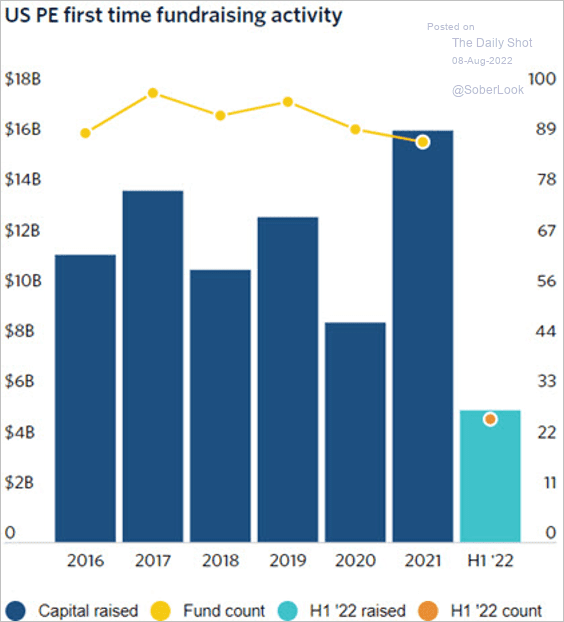 Source: PitchBook Read full article
2. While private equity deal activity is down, mega-deals maintain a large share of deal value.
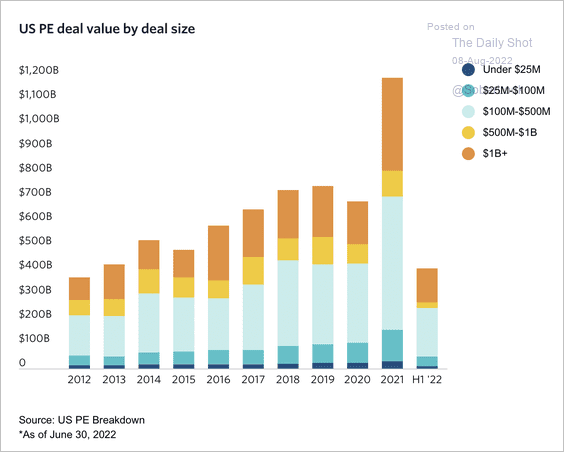 Source: PitchBook Read full article
3. There is a large overhang of dry powder for US venture capital-backed businesses, driving historically high dealmaking.
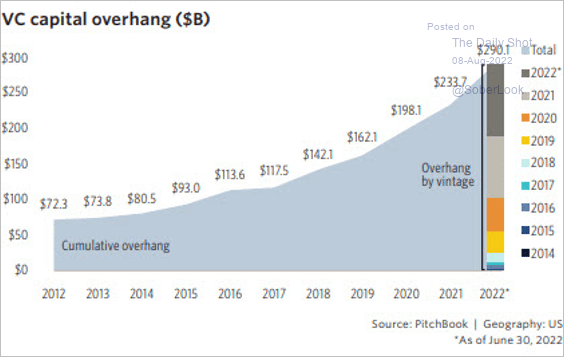 Source: PitchBook
4. Fundraising for Asia-focused private equity strategies has slowed this year.
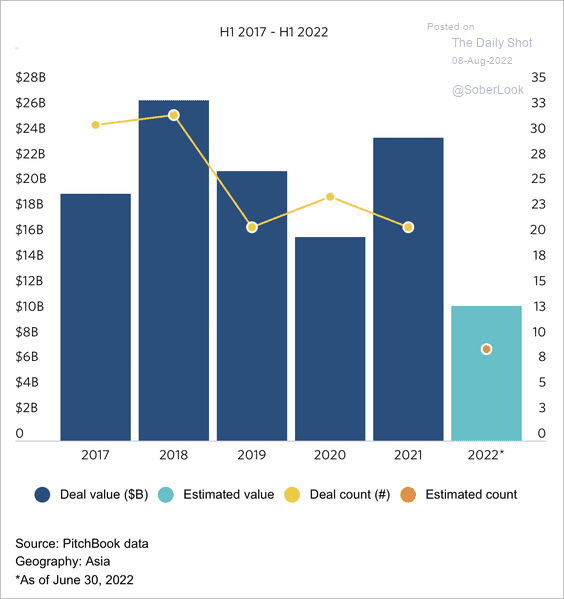 Source: PitchBook Read full article
Back to Index
Credit
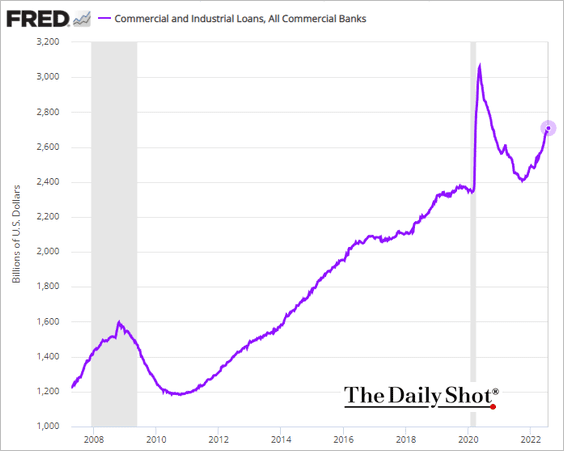
1. US bank-held business loan balances continue to climb.
2. New-issue (all-in) leveraged loan spreads have blown out.
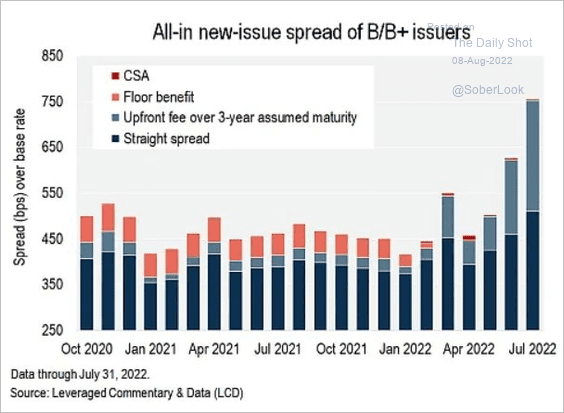 Source: @lcdnews
3. Direct loans outstanding tend to have shorter maturities than broadly-syndicated loans.
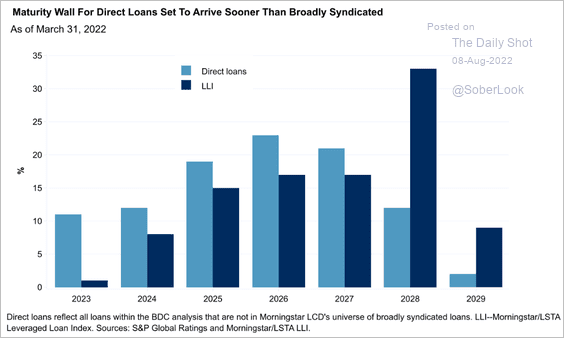 Source: S&P Global Ratings
4. High-yield bond issuance slowed sharply this year.
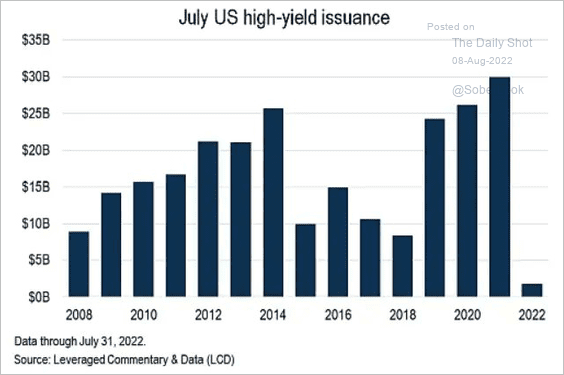 Source: @lcdnews Read full article
5. Credit funds are finally seeing some inflows.
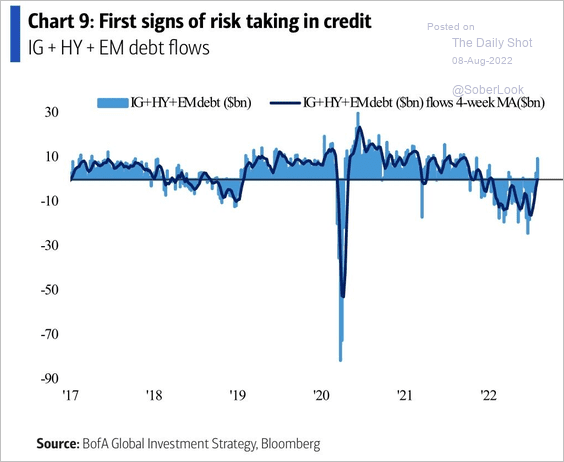 Source: BofA Global Research
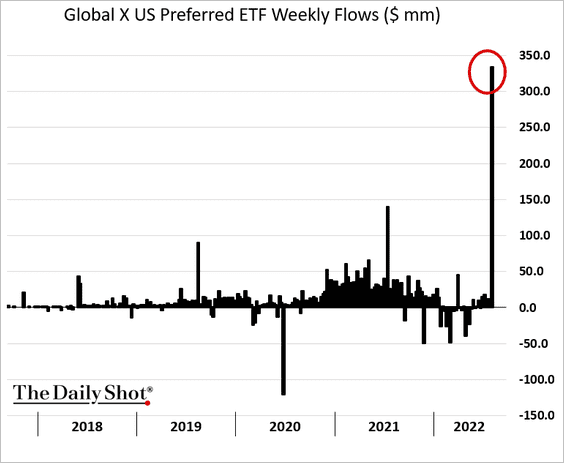
6. A large preferred equity ETF saw significant inflows last week.
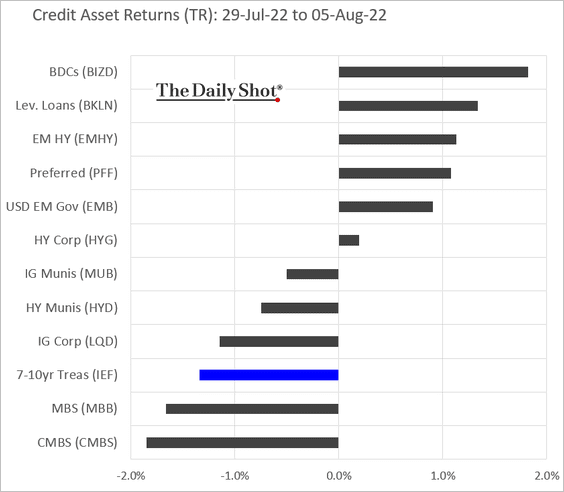
7. This chart shows last week’s performance by asset class.
Back to Index
Rates
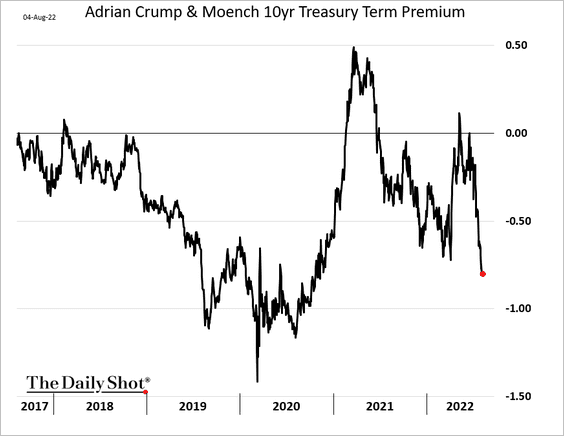
Treasury term premium has been moving lower in recent weeks.
Back to Index
Global Developments
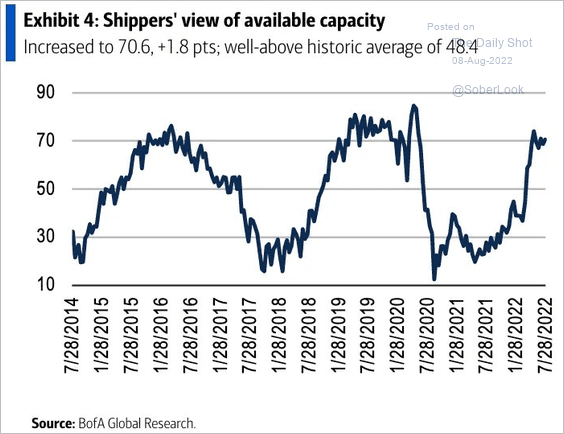
1. Container freight rates continue to move lower.
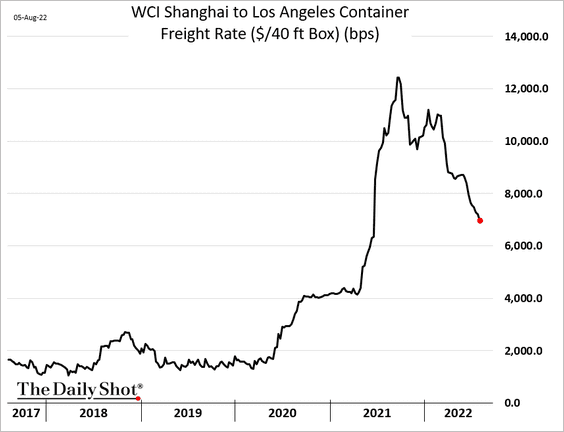
Shipping capacity is back at pre-COVID levels.
 Source: BofA Global Research; @SamRo
——————–
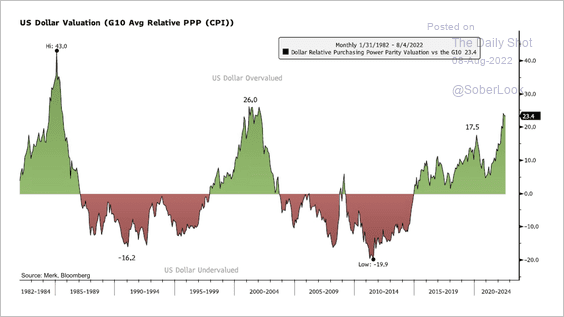
2. The dollar appears overvalued, although not as extreme compared to prior peaks.
 Source: @nicholastreece
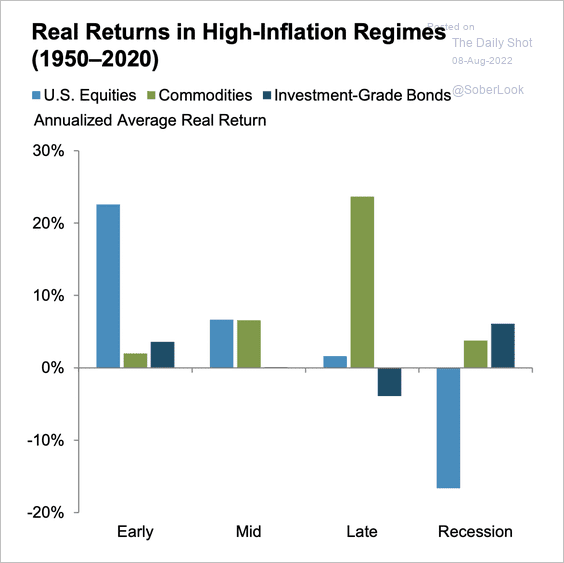
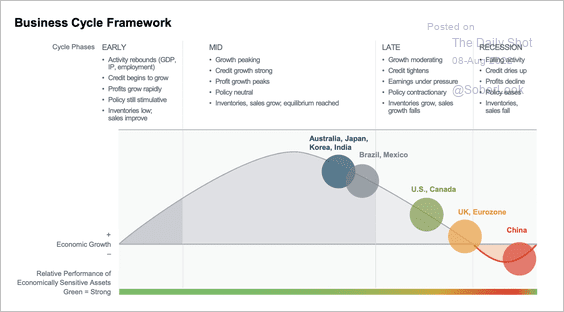
3. Most major economies experienced maturing trends in their business cycle over the past quarter due to high commodity prices and tightening financial conditions.
 Source: Fidelity Investments Read full article
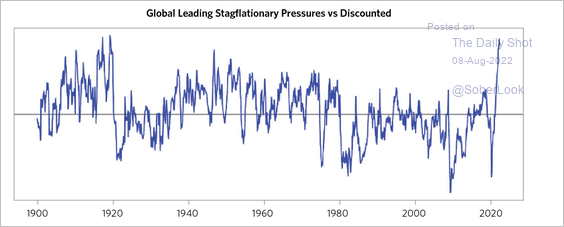
4. Stagflationary pressures have been rising.
 Source: Bridgewater Associates Read full article
5. Global semiconductor demand has slowed substantially.
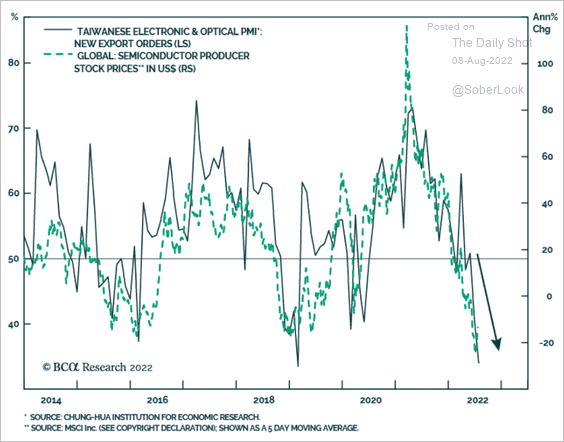 Source: BCA Research
6. Finally, we have some performance data from last week.
• Trade-weighted currency indices:
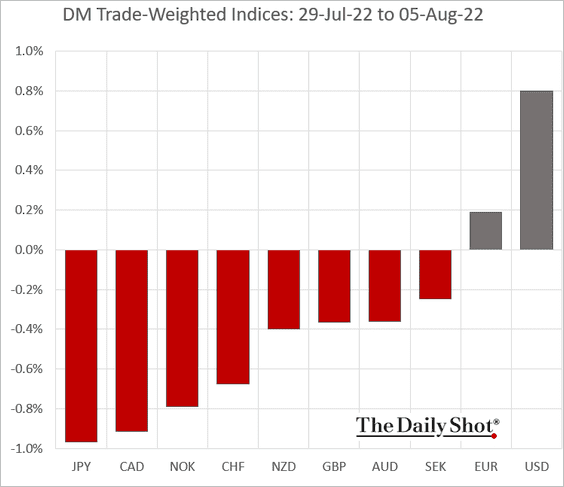
• Sovereign yields:
——————–
Food for Thought
1. US grocery shopping trends:
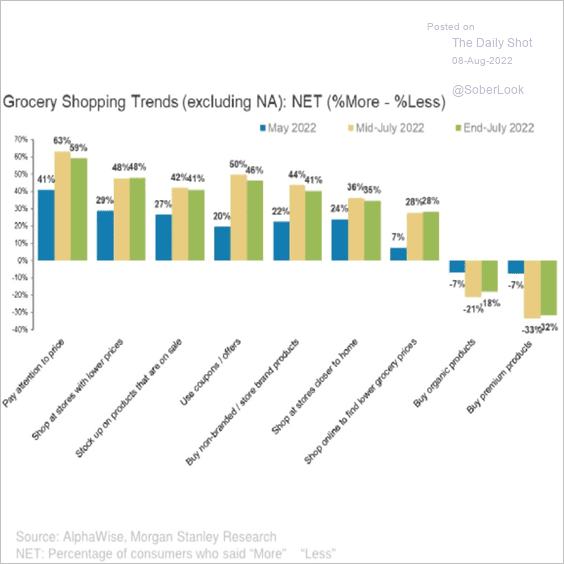 Source: Morgan Stanley Research; @SamRo
2. Spending patterns by age:
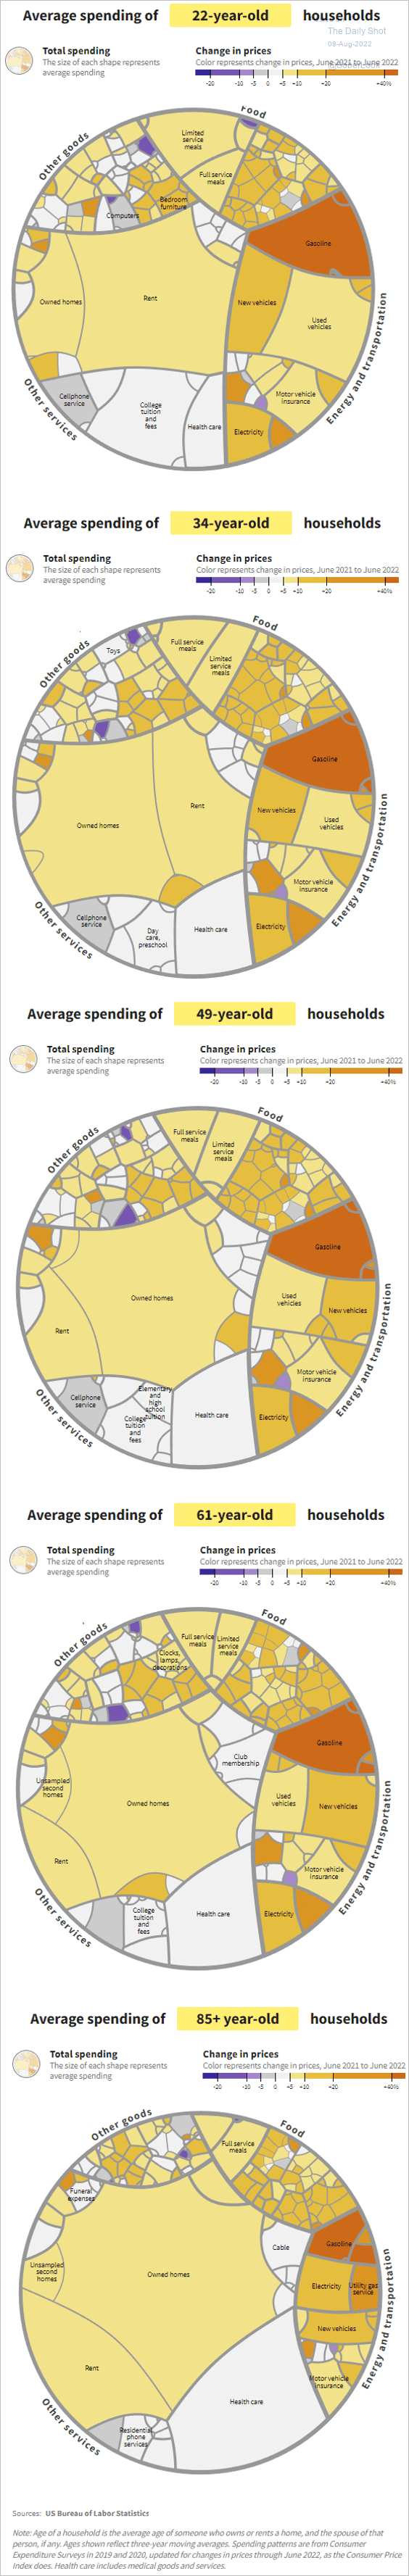 Source: USA Facts Read full article
3. Alphabet’s quarterly revenue:
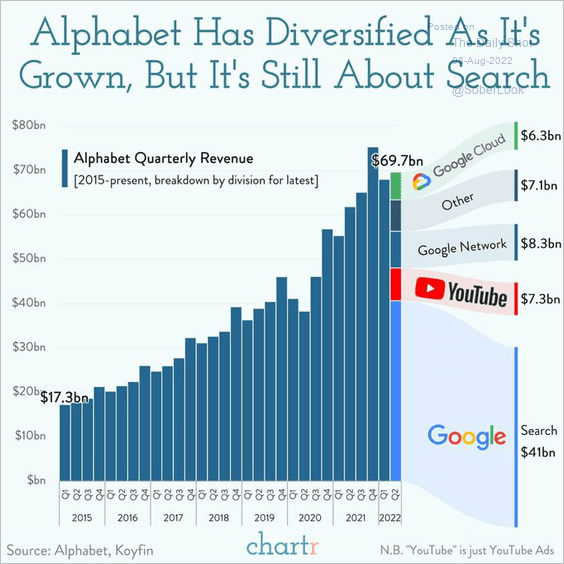 Source: @chartrdaily
4. Views on legalizing psychedelics:
 Source: @YouGovAmerica Read full article
5. The relevance of the US Constitution:
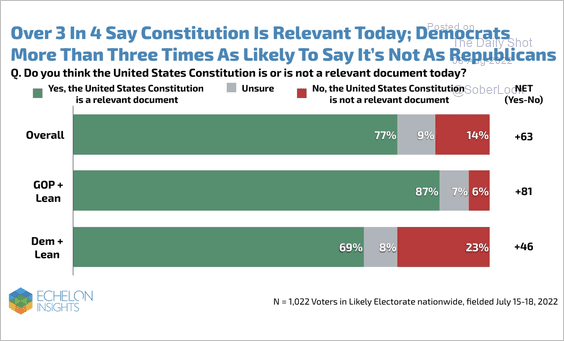 Source: @EchelonInsights
6. Taking up arms against the government:
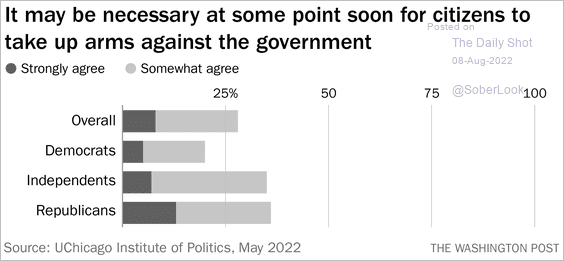 Source: The Washington Post Read full article
7. The Mediterranean sea temperature:
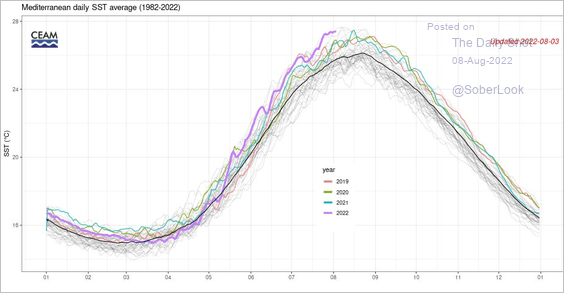 Source: @CEAM_Meteo
8. The growing popularity of women’s soccer championships:
 Source: @financialtimes Read full article
——————–
Back to Index