
The Daily Shot: 24-Aug-22
• The United States.
• The United Kingdom
• The Eurozone
• Europe
• Asia – Pacific
• China
• Emerging Markets
• Cryptocurrency
• Commodities
• Energy
• Equities
• Alternatives
• Rates
• Global Developments
• Food for Thought
The United States.
1. US business activity is in recession mode, according to the S&P Global PMI.
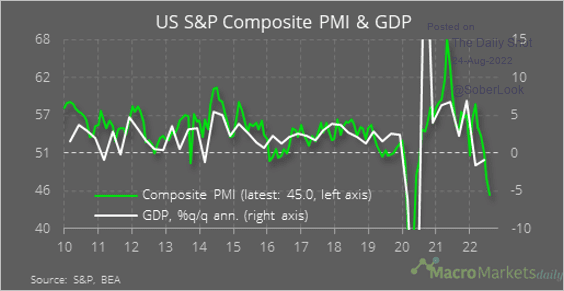 Source: @macro_daily
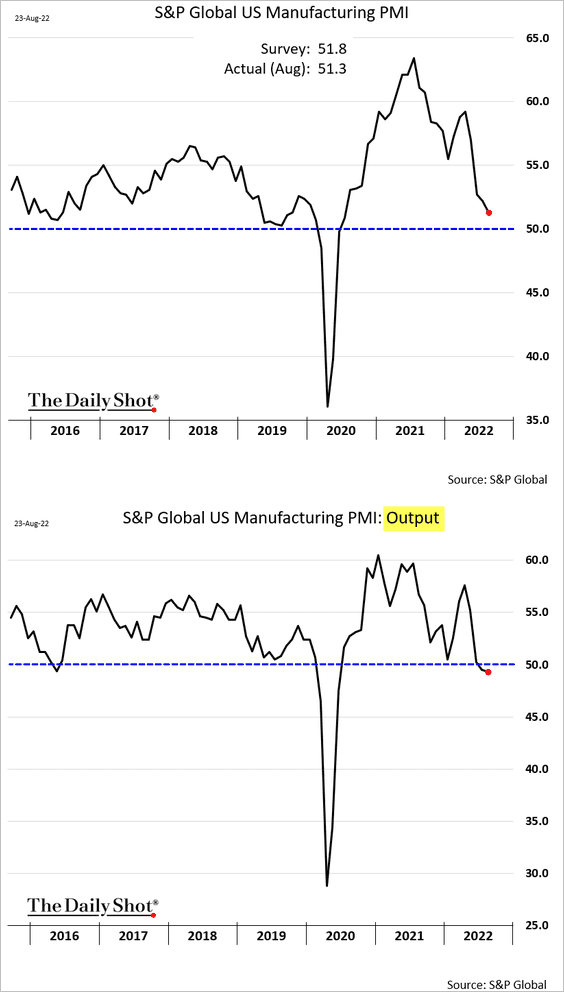
• Growth in factory activity is slowing rapidly as output contracts.
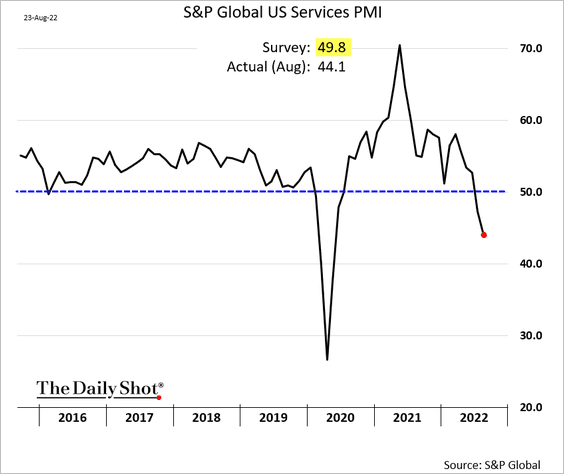
• The services PMI came in well below forecasts, with activity deteriorating quickly. Some of this weakness is driven by the housing market.
——————–
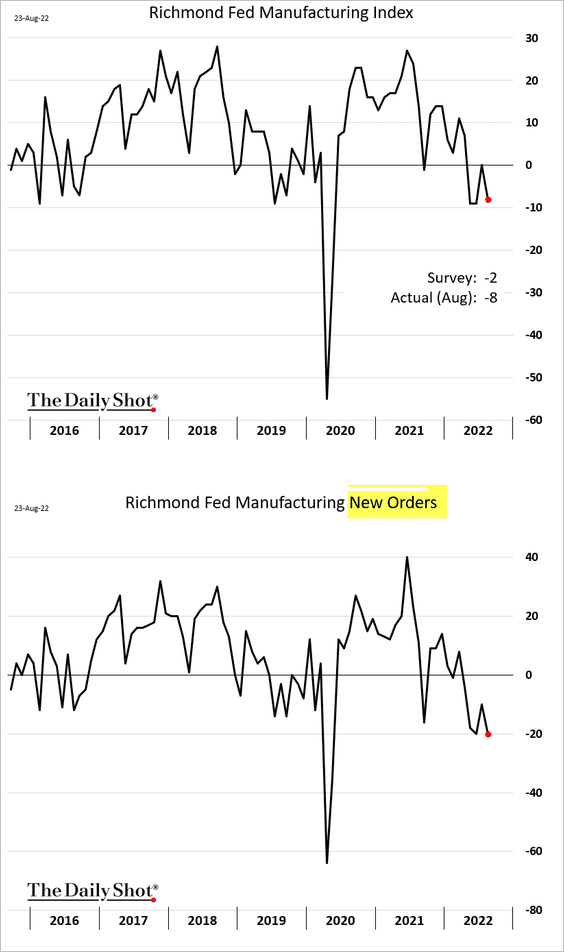
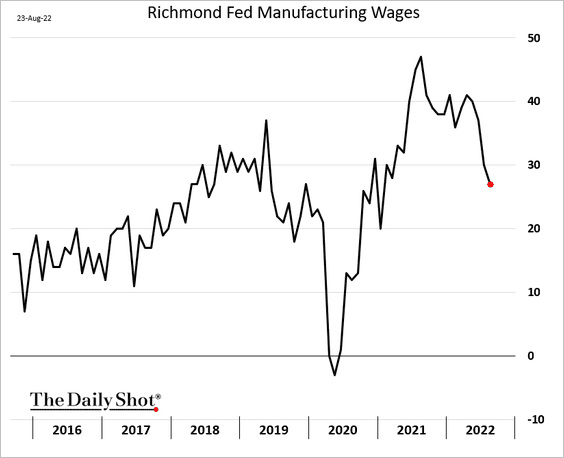
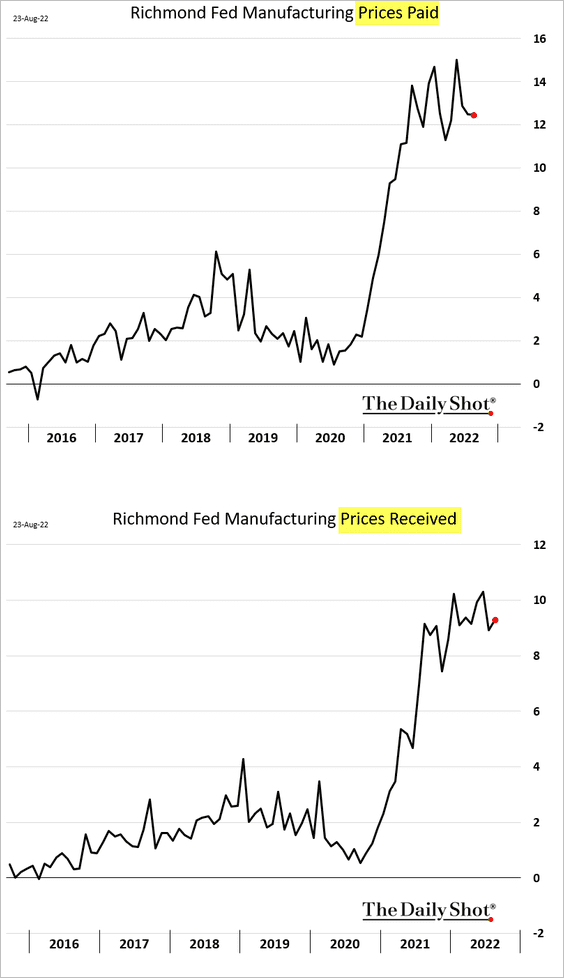
2. The Richmond Fed’s regional manufacturing report also shows deteriorating conditions.
• Fewer companies are boosting wages.
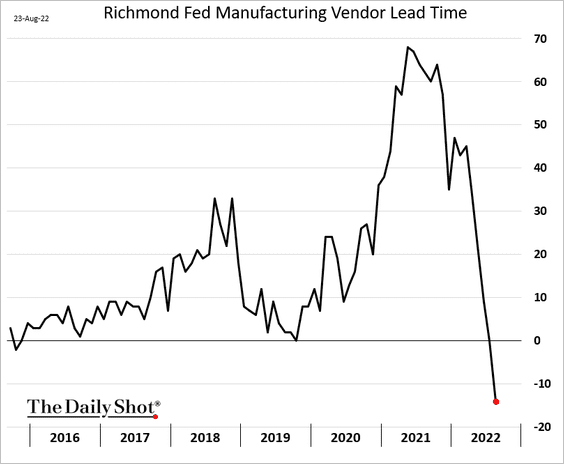
• Supplier bottlenecks are gone in the region as demand slumps.
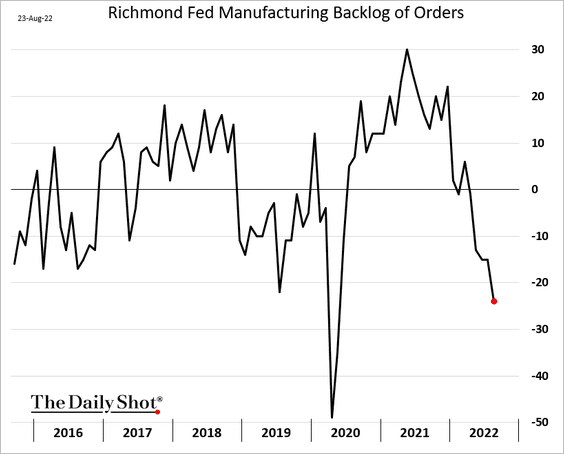
Here is the backlog of orders.
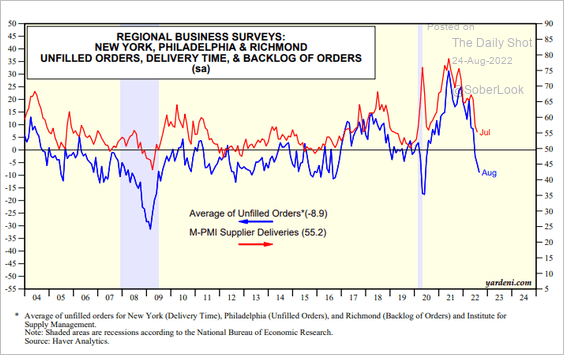
The combination of data from the NY Fed, the Philly Fed, and the Richmond Fed points to rapidly easing supply chain stress at the national level.
 Source: Yardeni Research
• The Richmond Fed’s report shows persistent price pressures.
– Here is what happens when the three Fed price indices are combined.
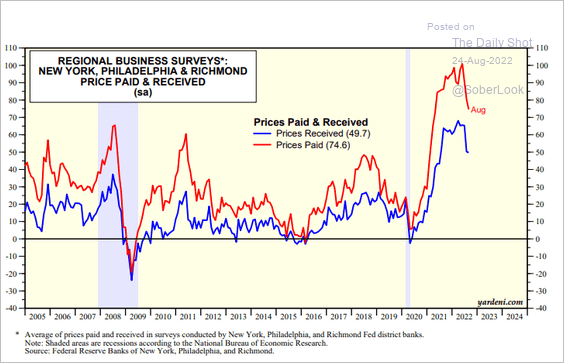 Source: Yardeni Research
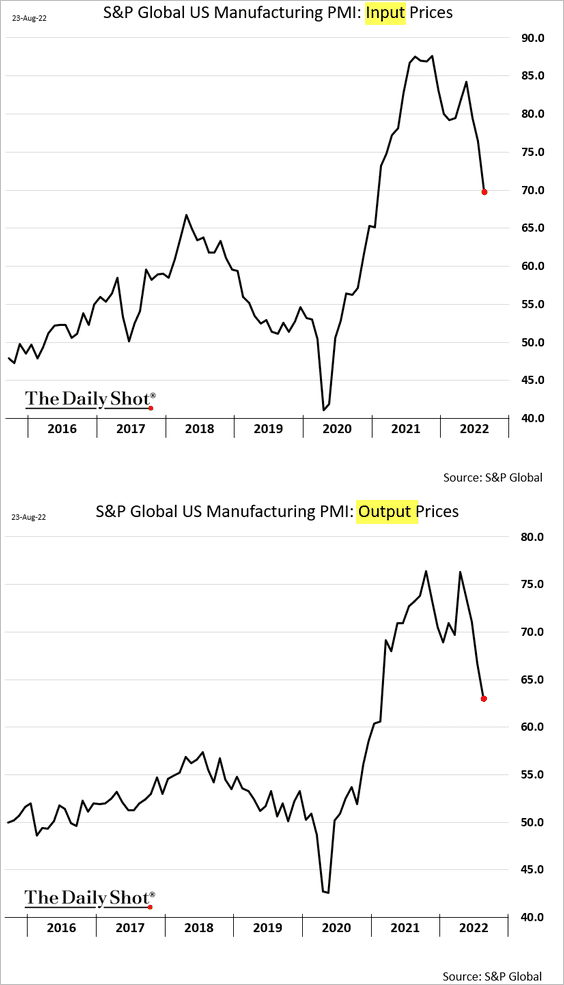
– And these are the manufacturing price indices at the national level from the S&P Global PMI report.
——————–
3. New home sales slumped last month, dipping below 2015 levels (down more than 30% vs. last year).
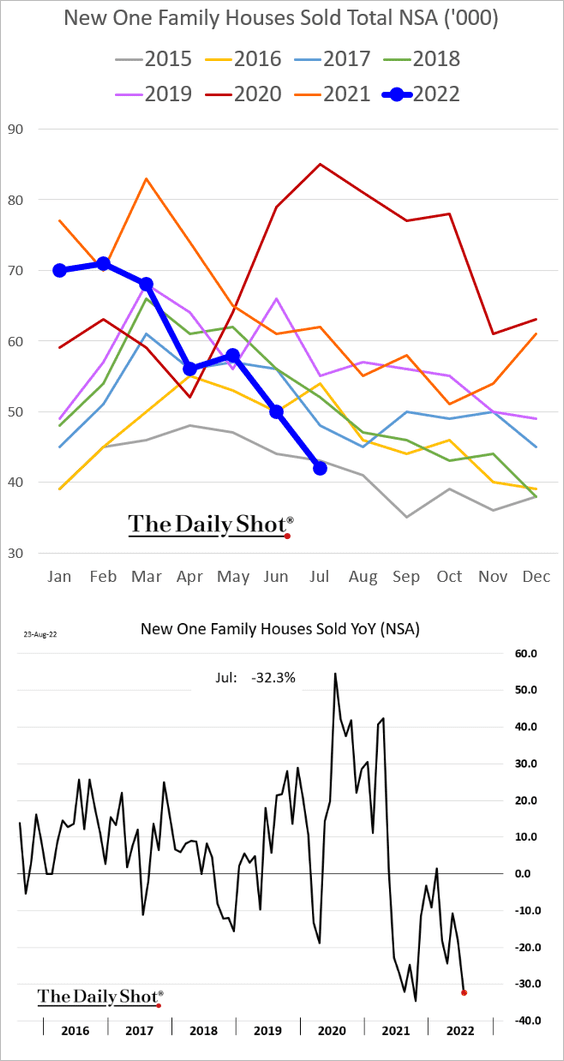
And we could see more pain ahead.
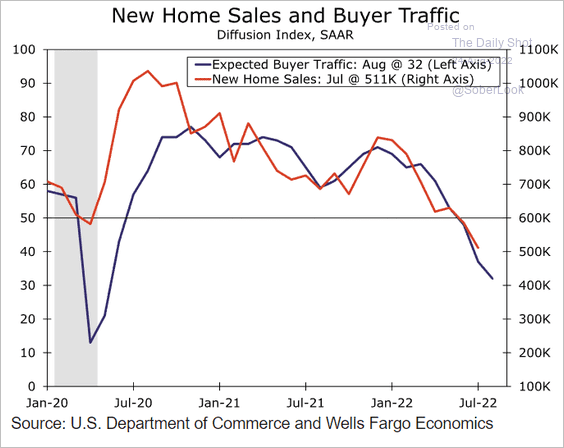 Source: Wells Fargo Securities
• Measured in months of supply, new home inventories hit the highest level since the financial crisis.
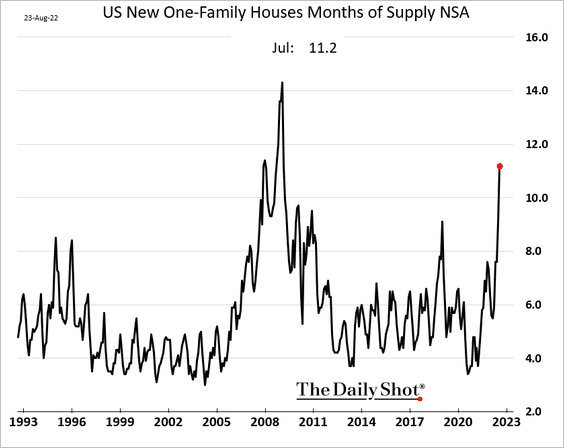
– What do these bloated supplies mean for existing home inventories?
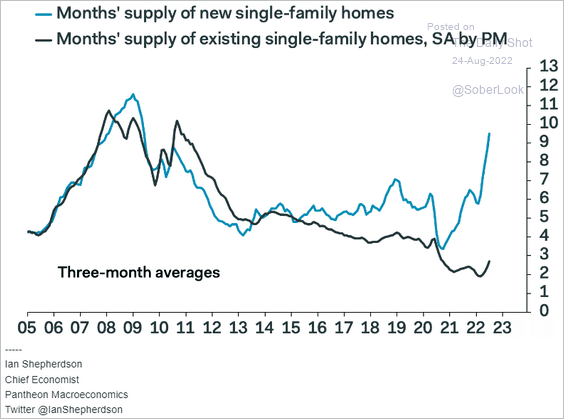 Source: Pantheon Macroeconomics
… and home prices (2 charts)?
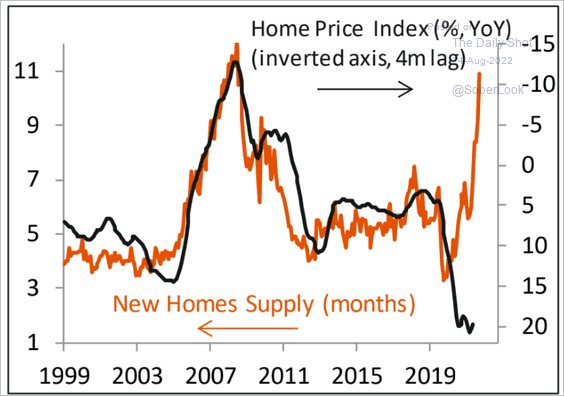 Source: Piper Sandler
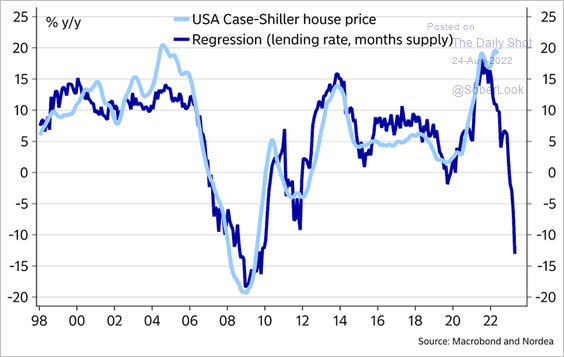 Source: @MikaelSarwe
– Here are the inventories by stage of construction.
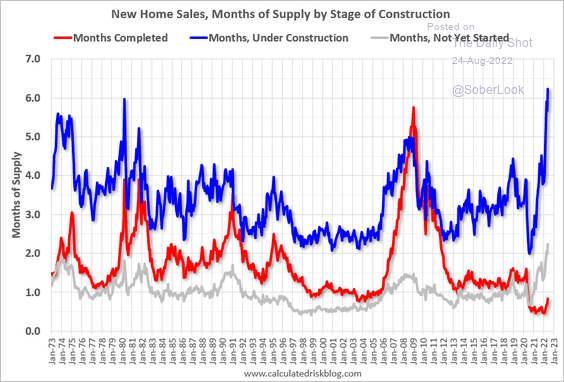 Source: @calculatedrisk
– This chart shows new home price distribution over time.
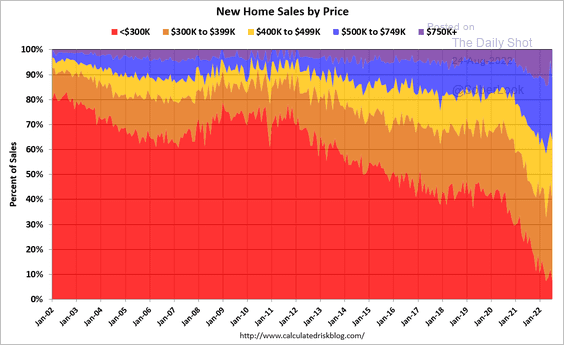 Source: @calculatedrisk
——————–
4. Next, we have some additional data on the housing market.
• Drivers of housing affordability:
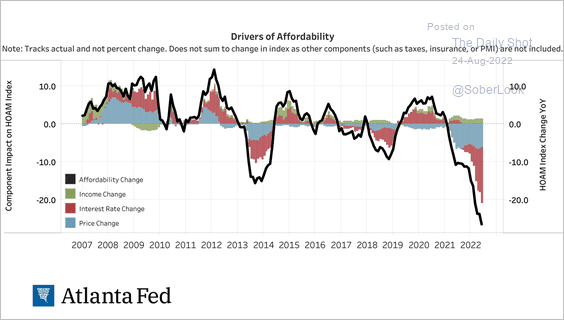 Source: @AtlantaFed Read full article
• Housing equity withdrawals (mostly through cash-out refi):
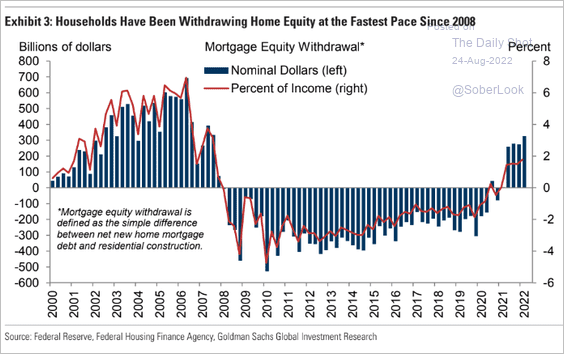 Source: Goldman Sachs; @MikeZaccardi
• Tightening rental markets:
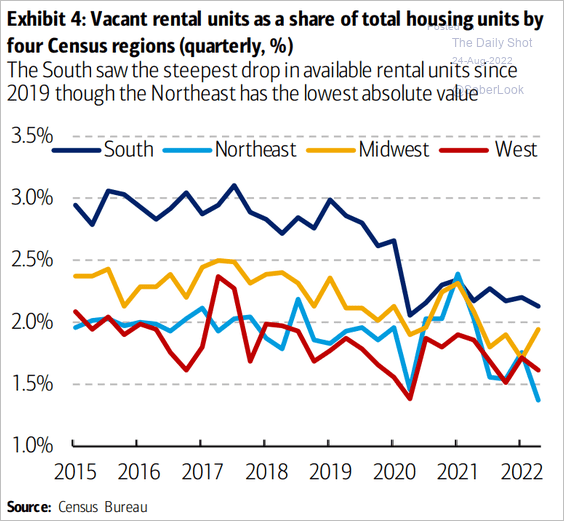 Source: Bank of America Institute
——————–
5. Real business investment has been slowing.
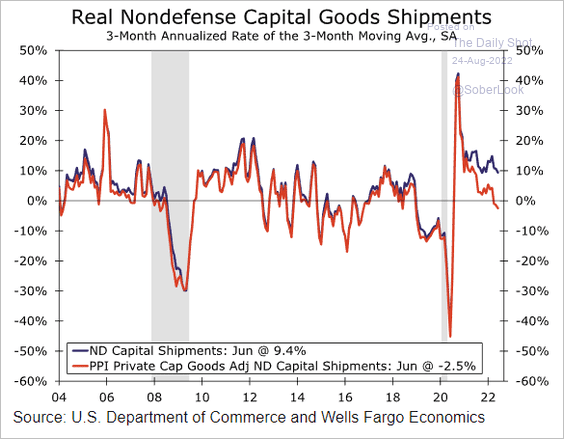 Source: Wells Fargo Securities
Slumping semiconductor demand points to further weakness in business investment.
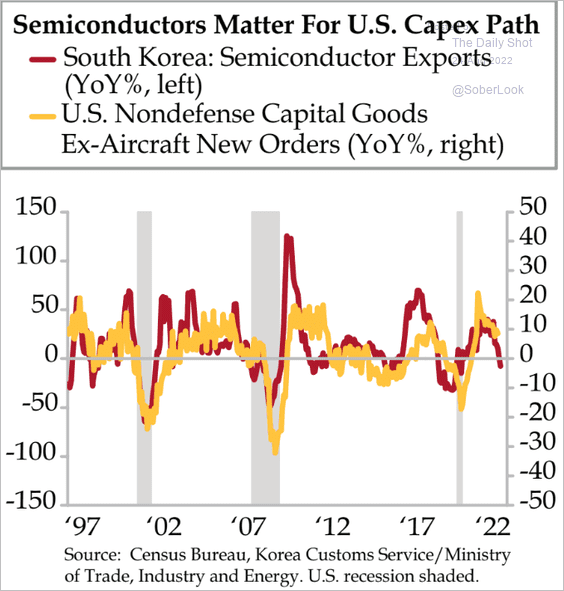 Source: Quill Intelligence
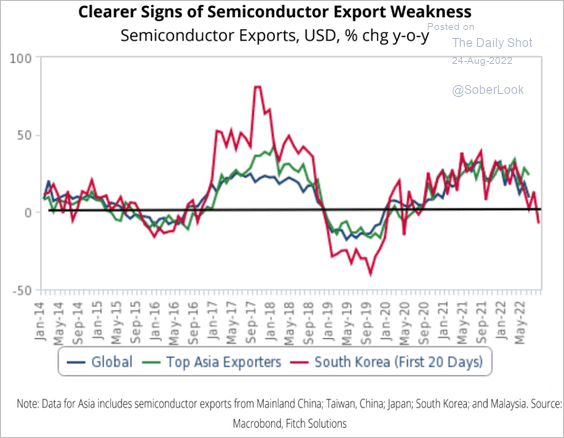 Source: Fitch Solutions Macro Research
Back to Index
The United Kingdom
1. UK service sector activity remains in growth territory, according to the S&P Global PMI.
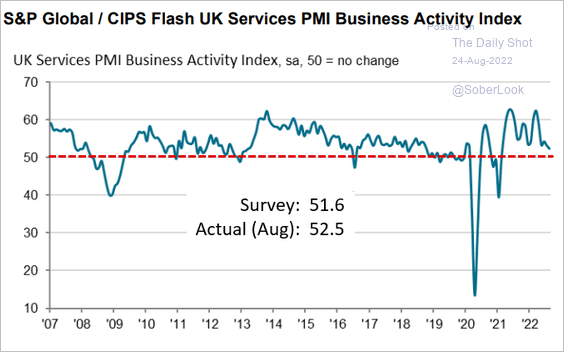 Source: S&P Global PMI
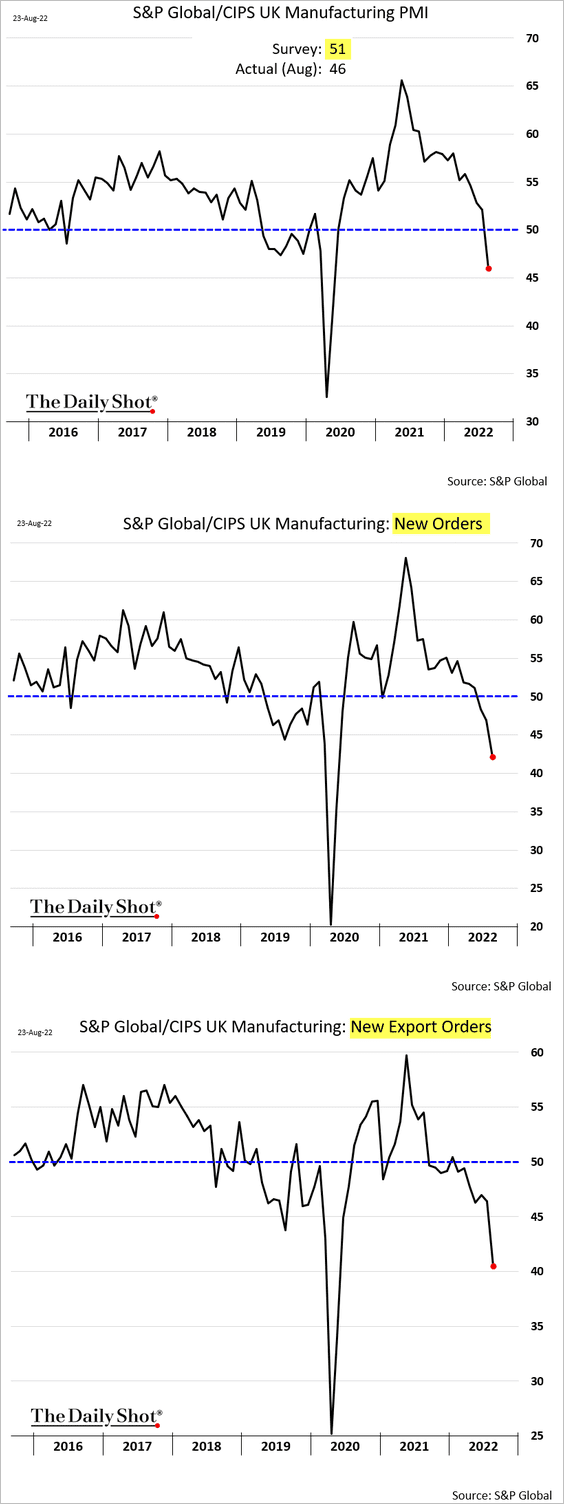
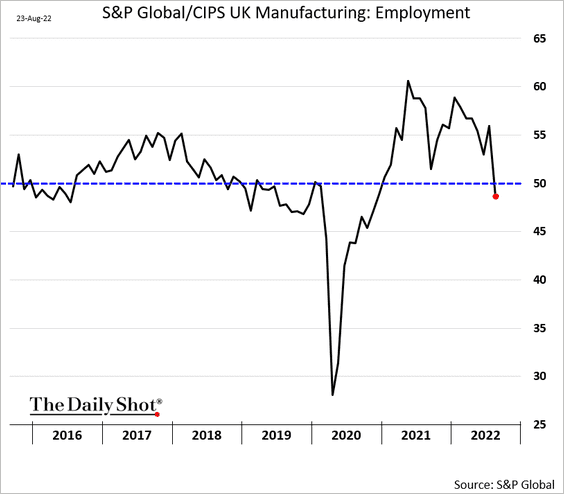
But manufacturing is in recession as demand crashes.
• Industrial production is expected to deteriorate sharply.
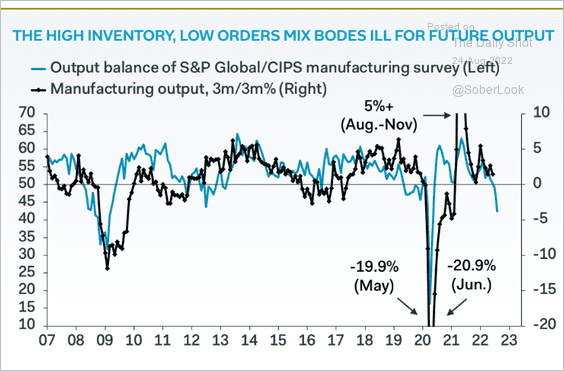 Source: Pantheon Macroeconomics
.• Factories are starting to shed workers.
• Growth in composite output (manufacturing and services) has stalled.
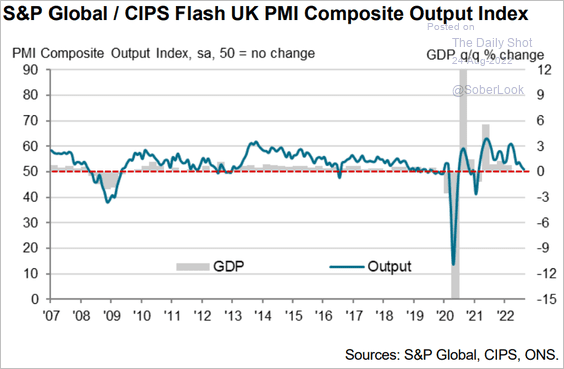 Source: S&P Global PMI Read full article
• What does the PMI report mean for GDP growth?
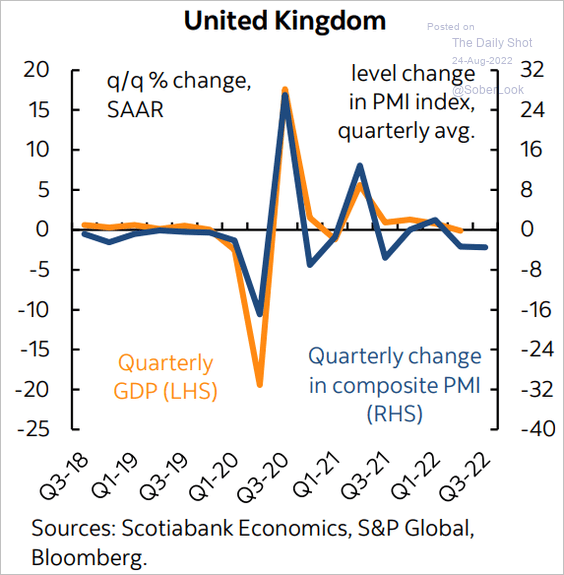 Source: Scotiabank Economics
• Manufacturing prices are moderating, …
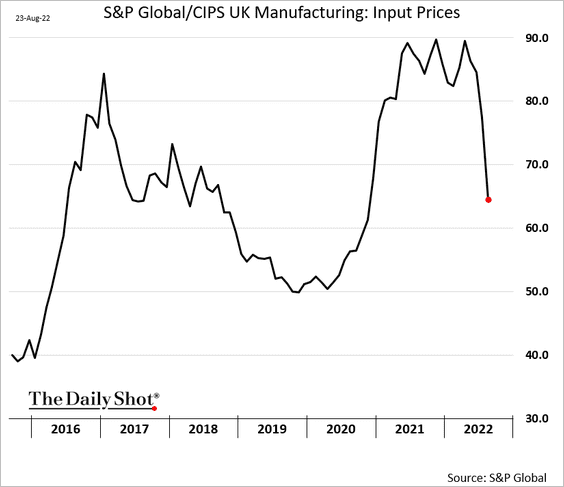
… which is good news for the PPI.
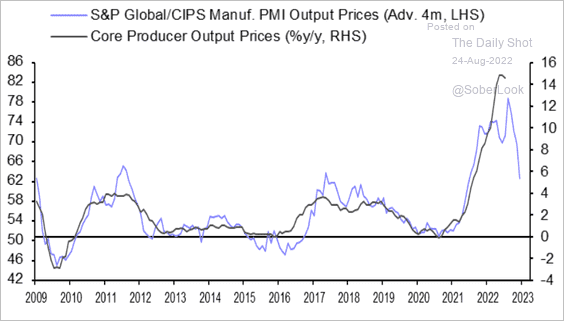 Source: Capital Economics
——————–
2. The CBI report unexpectedly showed a contraction in industrial orders.
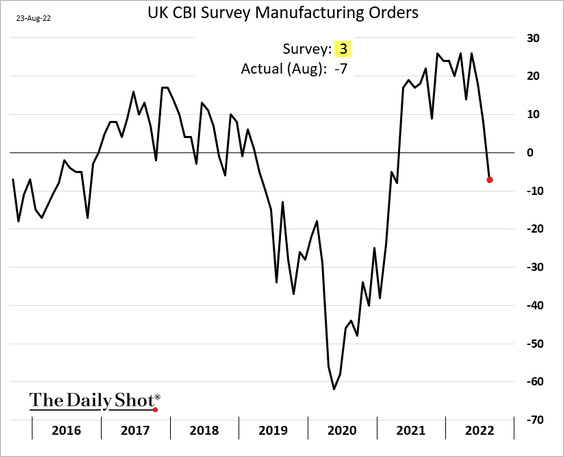
 Source: Reuters Read full article
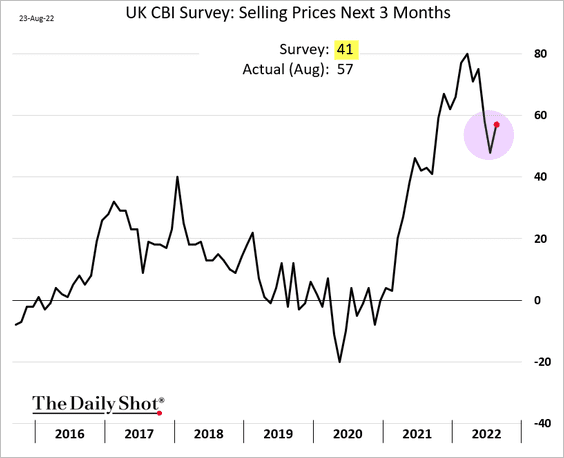
Price pressures persist, according to the CBI.
——————–
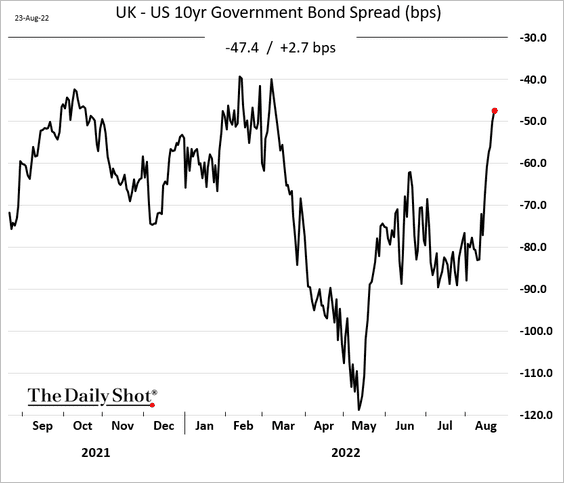
3. The UK – US bond spreads are tightening.
4. Heathrow travel volume has recovered.
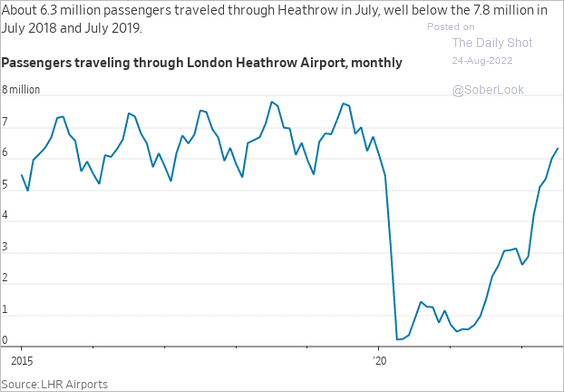 Source: @WSJ Read full article
5. England and Wales death rates remain above the 5-year average.
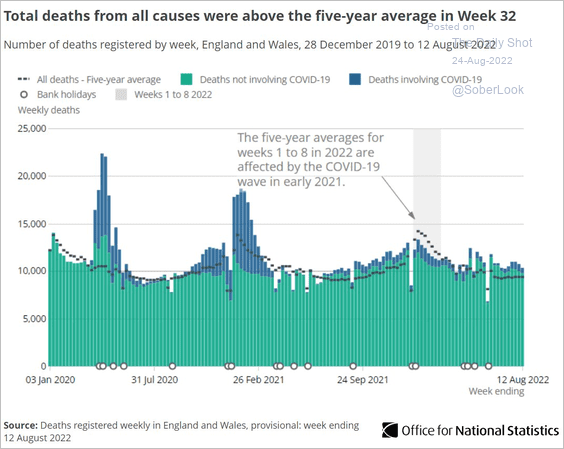 Source: @ONS Read full article
Back to Index
The Eurozone
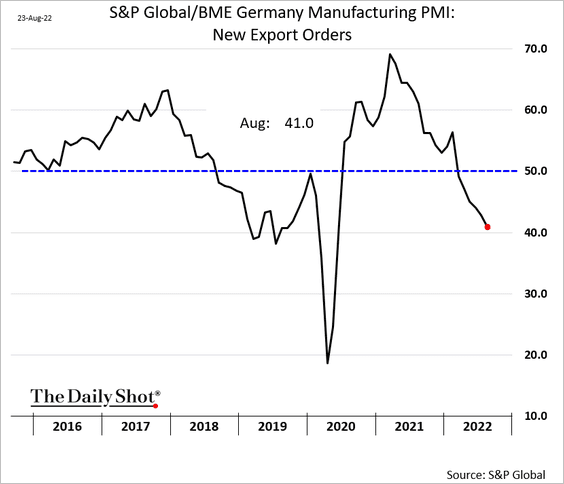
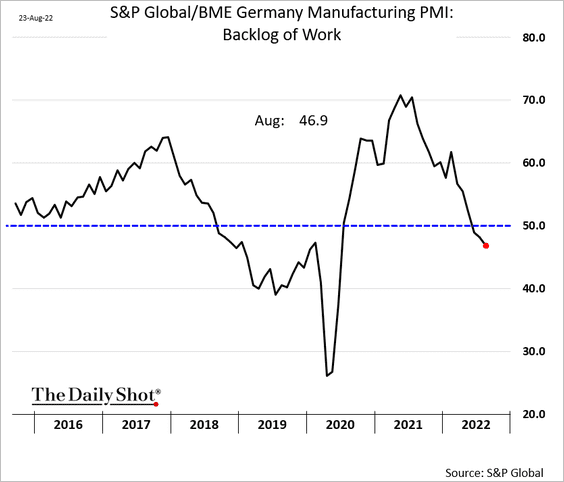
1. As we saw yesterday (chart), Germany’s manufacturing PMI surprised to the upside. However, new orders continue to shrink (PMI < 50).
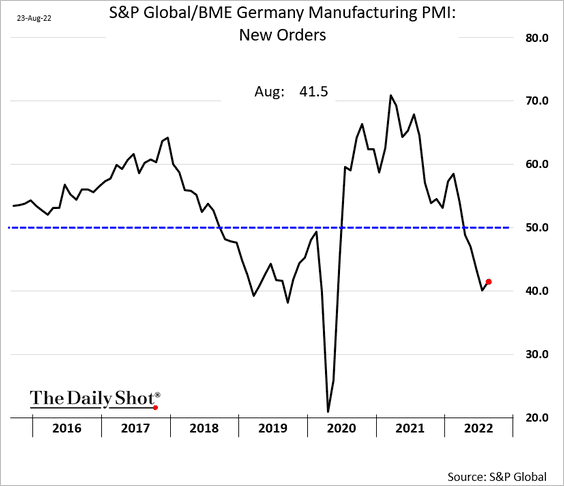
Order backlog is easing.
Germany’s service activity moved deeper into contraction this month (chart). Here is the composite PMI.
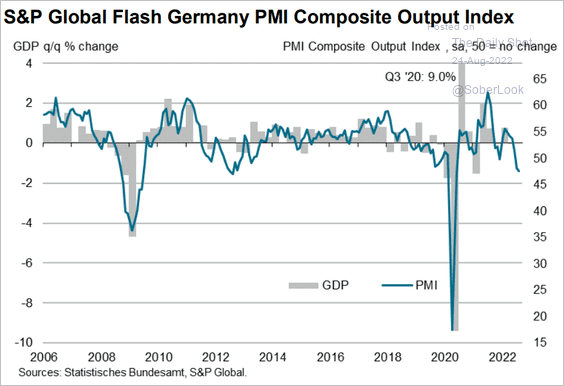 Source: S&P Global PMI
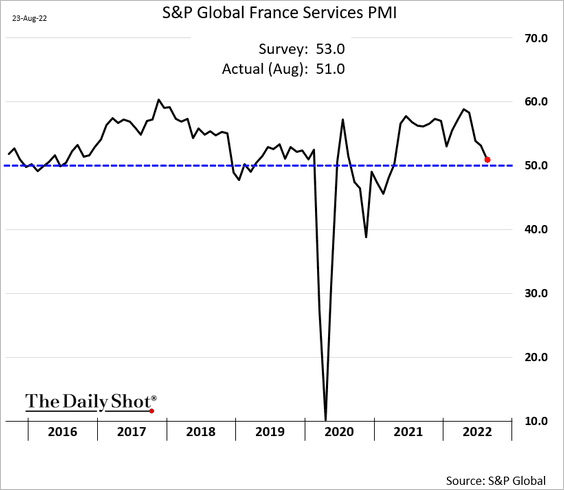
• French manufacturing is retreating, …
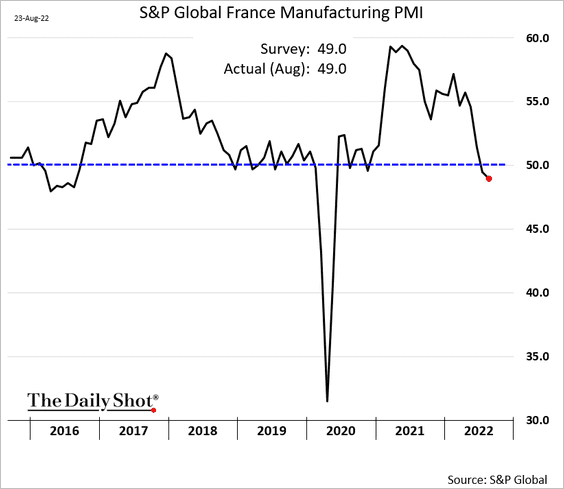
… and service-sector growth is about to stall.
• At the Eurozone level, the PMI data looks recessionary.
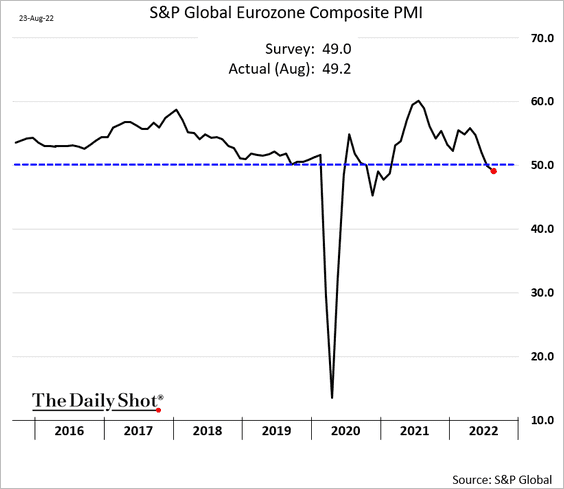
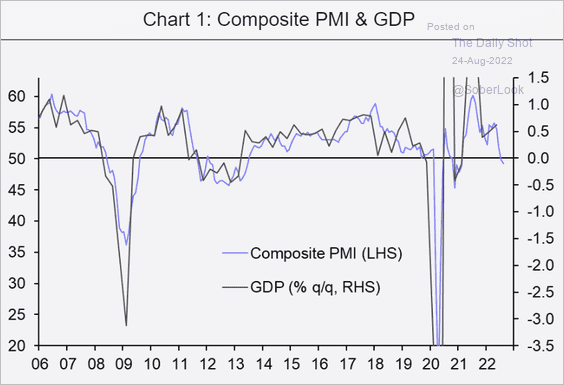 Source: Capital Economics
Here is the service sector PMI compared to previous recessions.
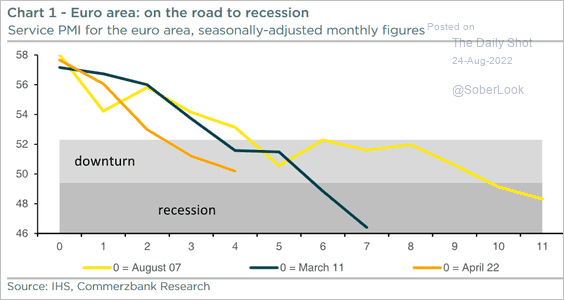 Source: Commerzbank Research
• Price pressures are starting to moderate, …
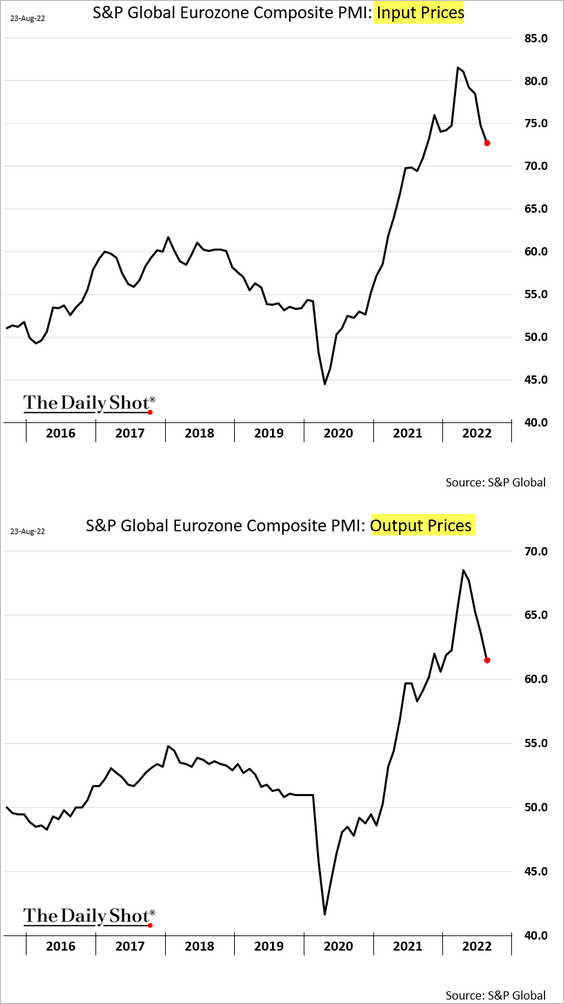
… which should slow consumer inflation.
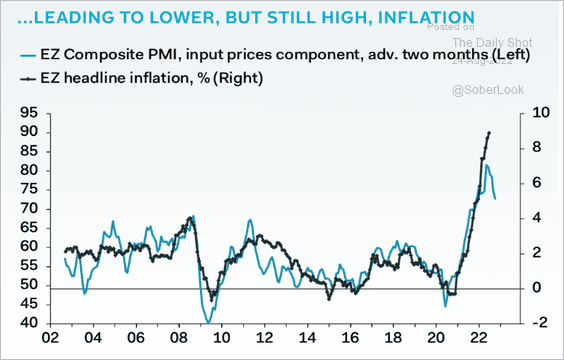 Source: Pantheon Macroeconomics
——————–
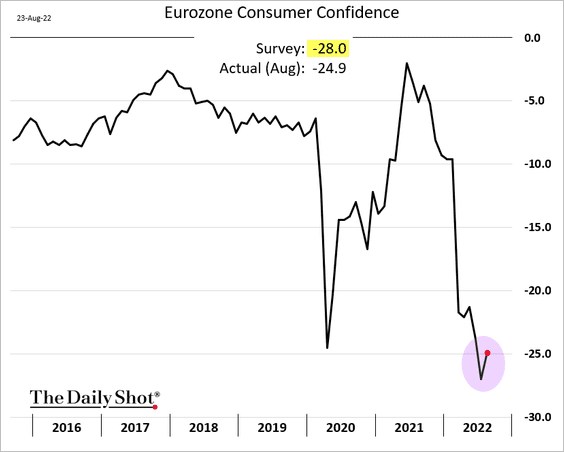
2. Consumer confidence appears to have bottomed.
3. The era of cheap Russian energy is over for now.
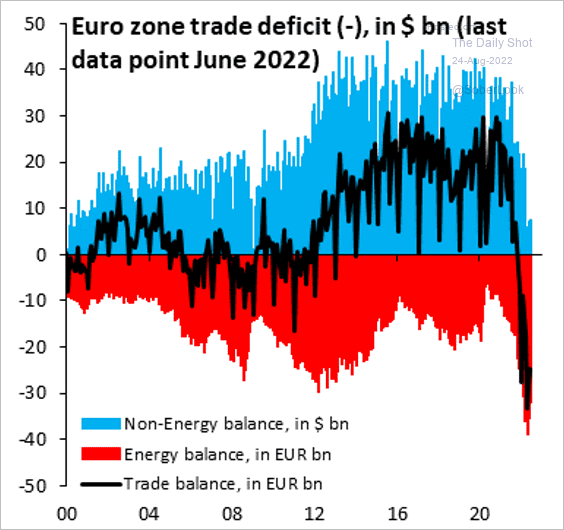 Source: @RobinBrooksIIF
4. Here is Germany’s stock market capitalization as a share of the global market cap.
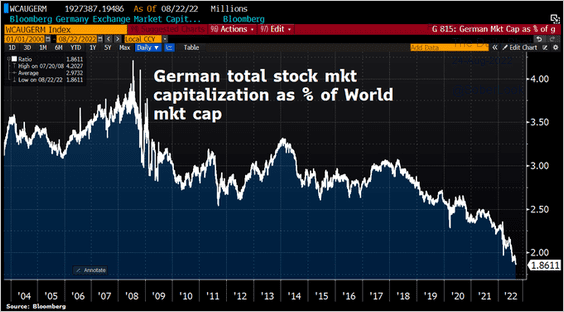 Source: @Schuldensuehner
5. Bund volatility surged this year.
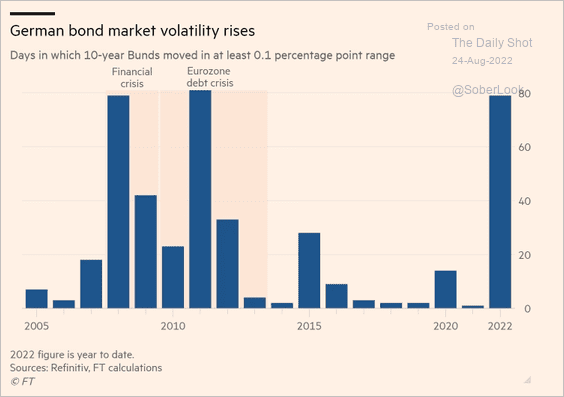 Source: @financialtimes Read full article
6. Italian and Spanish yields are likely to widen further without the ECB’s support.
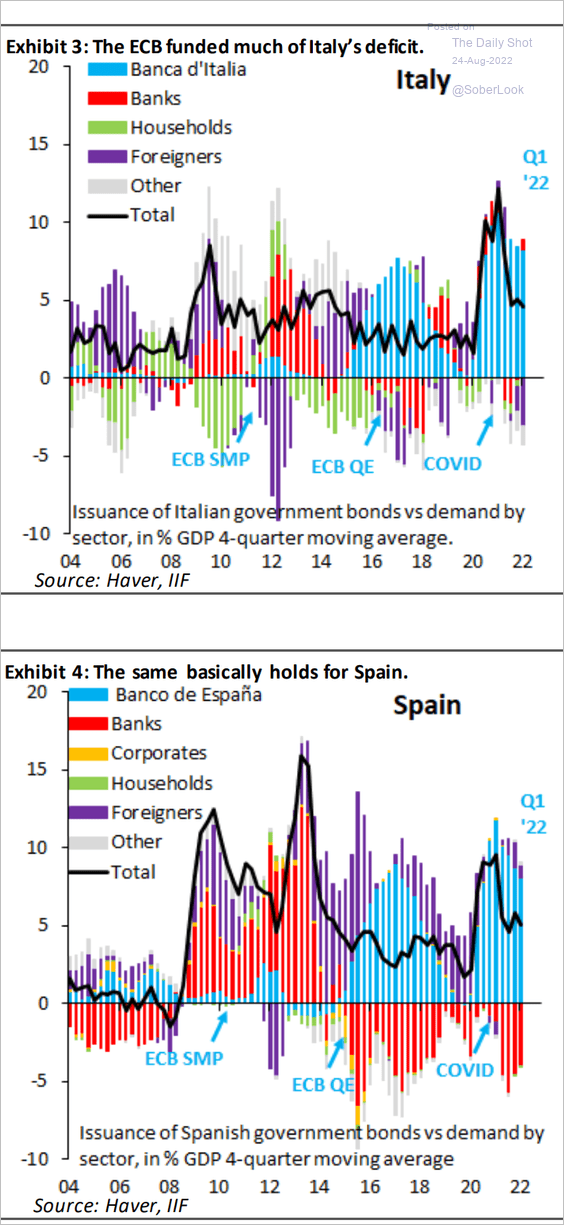 Source: IIF
Back to Index
Europe
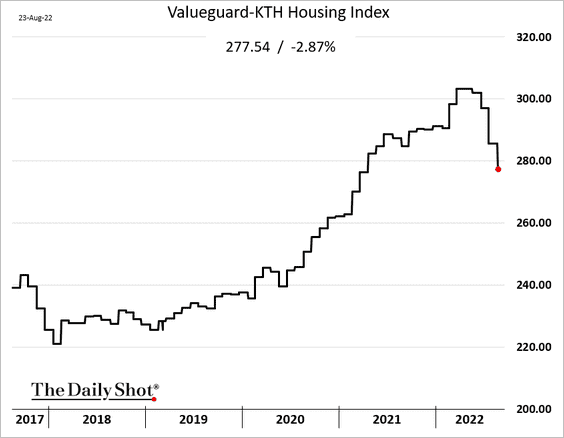
1. Sweden’s housing market is rolling over.
2. Norway’s hiking cycle is outpacing expectations.
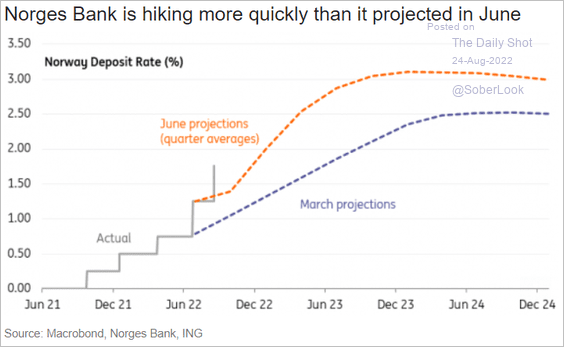 Source: ING
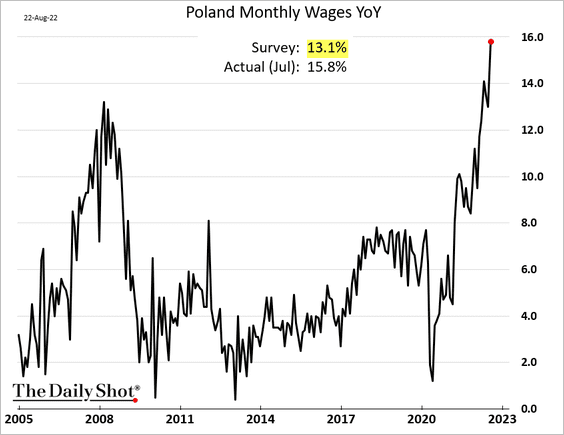
3. Wage growth is surging in Poland.
4. European electricity prices are out of control.
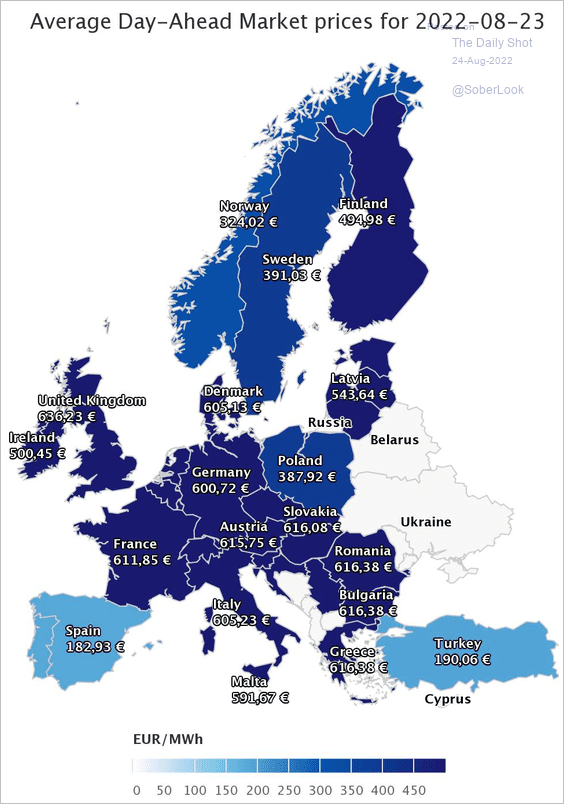 Source: @JavierBlas
5. This chart shows the EU’s investment in China.
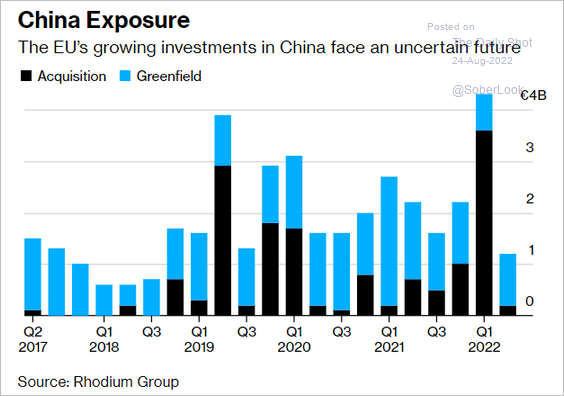 Source: Bloomberg Read full article
Back to Index
Asia – Pacific
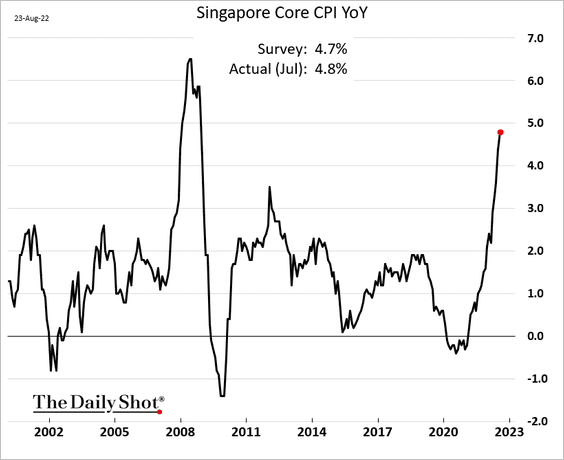
1. Singapore’s inflation has accelerated.
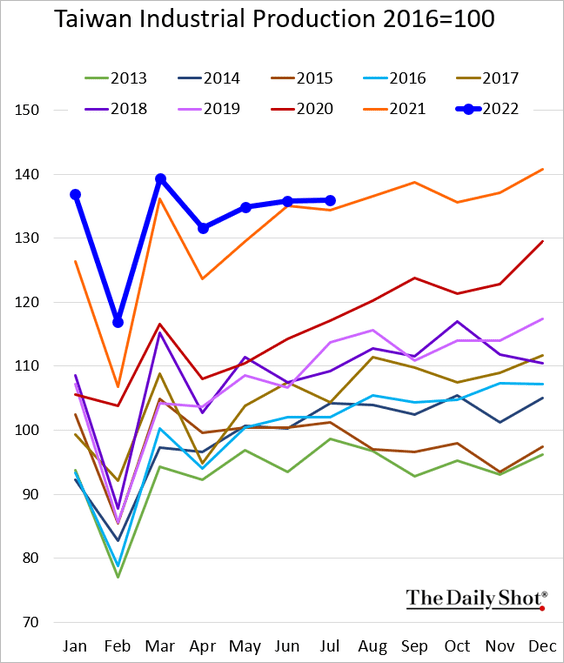
2. Taiwan’s industrial production (volume) is still holding above 2021 levels.
Back to Index
China
1. Beijing continues to let the renminbi weaken (a form of stimulus).
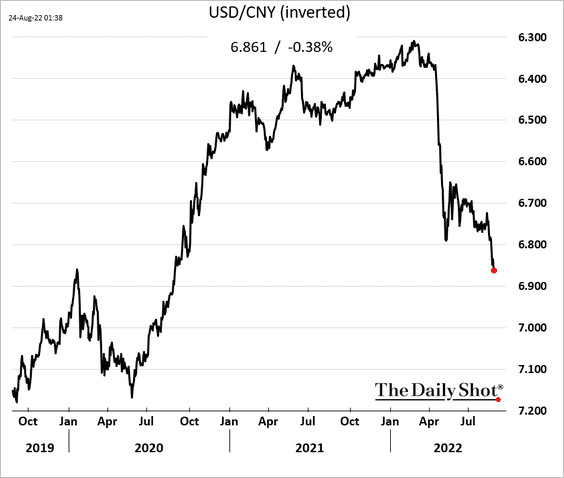
Diverging US/China monetary policies support further RMB declines.
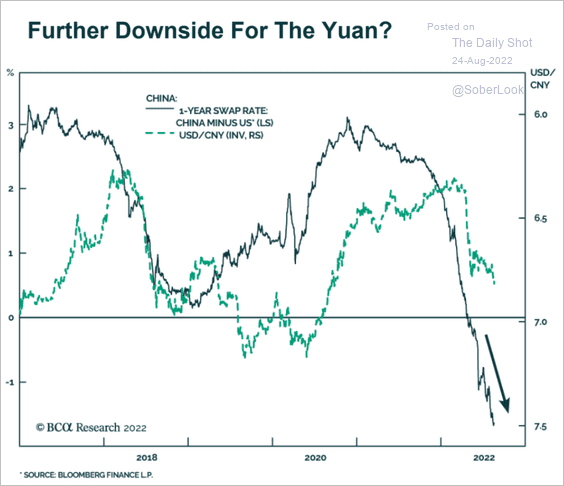 Source: BCA Research
——————–
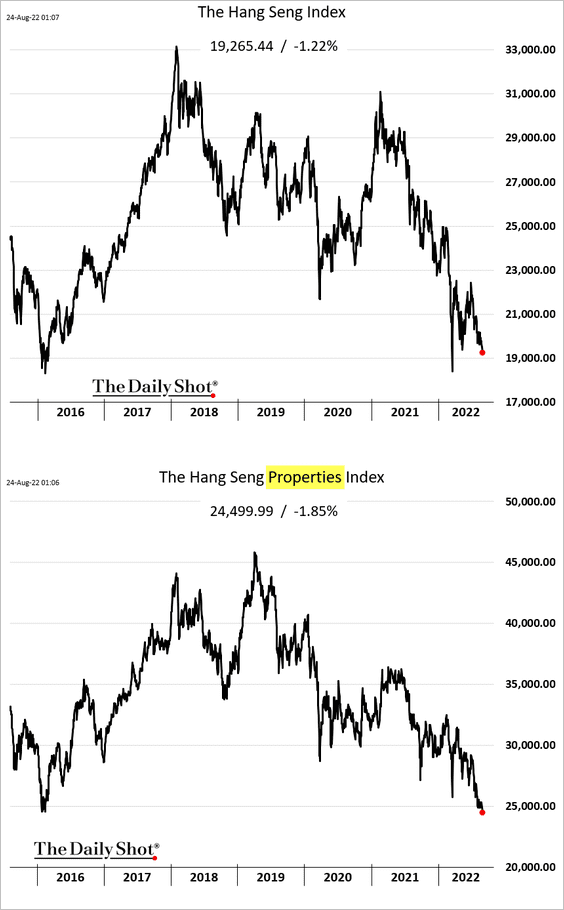
2. Stocks are under pressure in Hong Kong, with the properties index about to take out the 2016 low.
3. Banks are struggling to grow assets.
 Source: @markets Read full article
Bloomberg: … some state-owned banks are extending loans to companies and then allowing them to deposit funds at the same interest rate, according to executives at six banks who spoke to Bloomberg News on condition of anonymity. Others are borrowing from each other through short-term financing arrangements that can be dressed up as new loans to boost volumes …
——————–
4. Will capital outflows end this quarter?
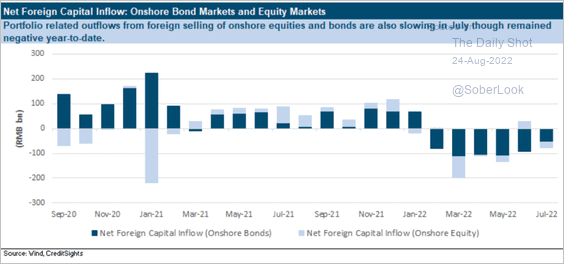 Source: CreditSights
5. Smartphone demand has slowed.
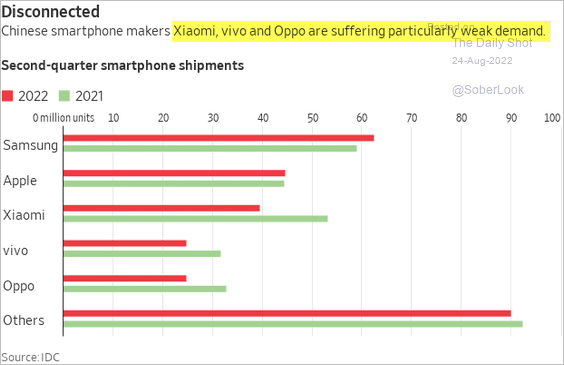 Source: @WSJ Read full article
Back to Index
Emerging Markets
1. Indonesia’s central bank finally raised rates as inflation strengthens.
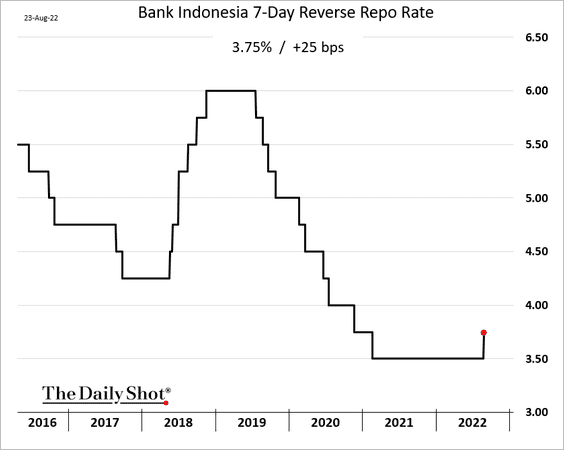
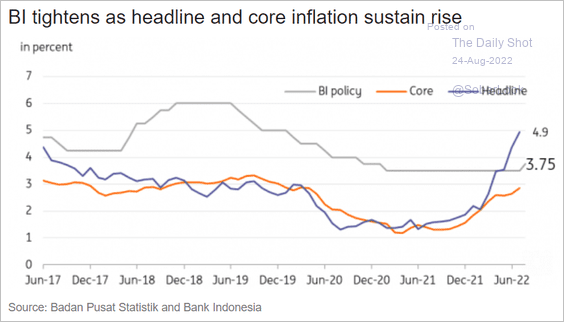 Source: ING
——————–
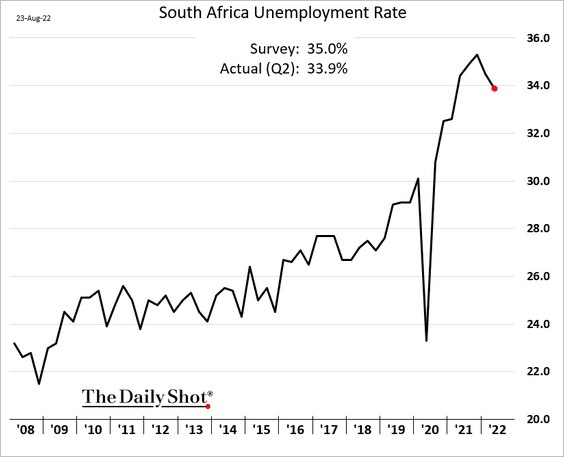
2. South Africa’s unemployment rate appears to have peaked.
3. This chart shows internet usage in India and Pakistan.
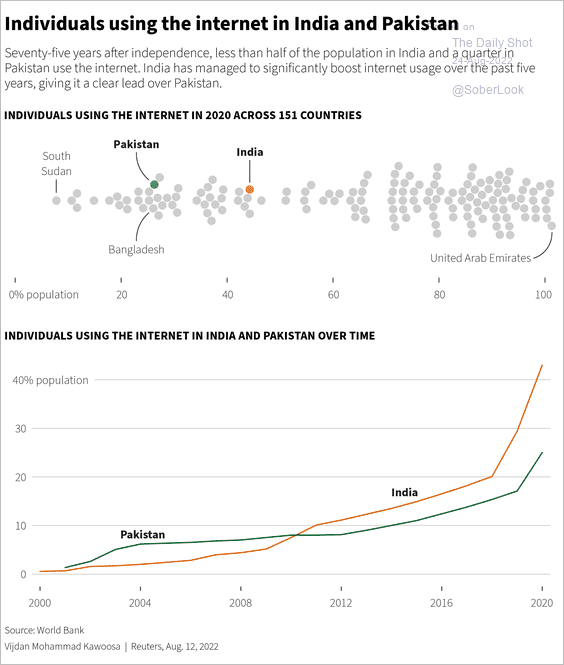 Source: @ReutersGraphics
Back to Index
Cryptocurrency
1. The number of ETH deposits into the Beacon chain contract has stabilized at relatively low levels as investors await The Merge.
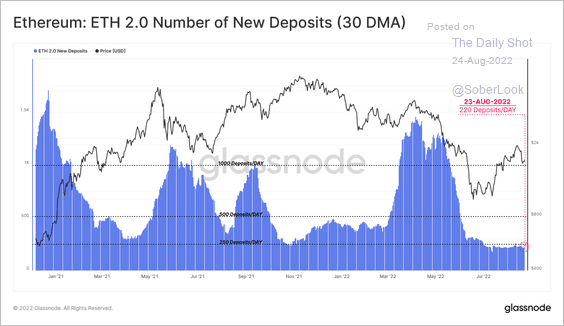 Source: @glassnode
2. Bitcoin holders have been moving their tokens outside of exchanges over the past few months.
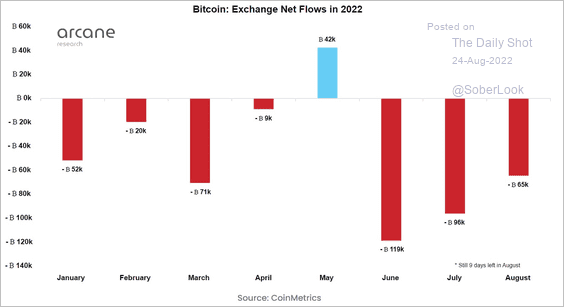 Source: @ArcaneResearch
3. Bitcoin’s recent sell-off triggered the largest amount of long liquidations since June.
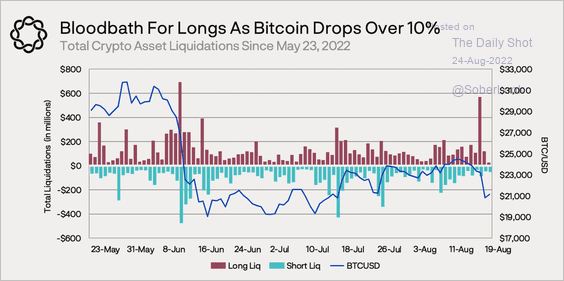 Source: @Delphi_Digital
4. Crypto fraud revenue declined substantially after the market meltdown.
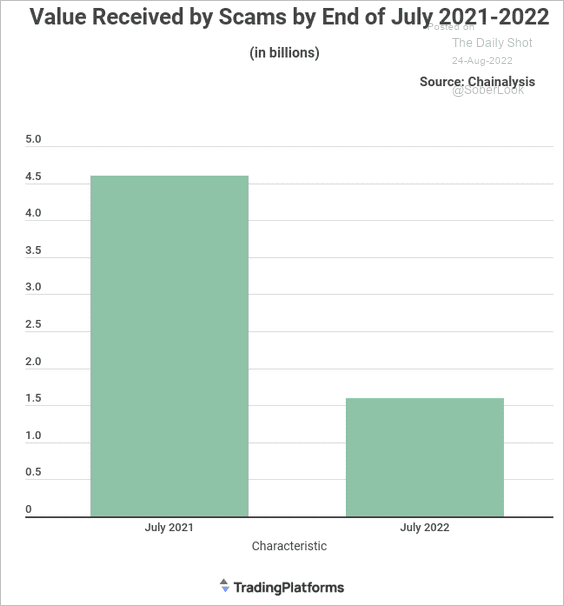 Source: Tradingplatforms.com Read full article
Back to Index
Commodities
1. US corn futures are rebounding amid poor crop conditions (see chart).
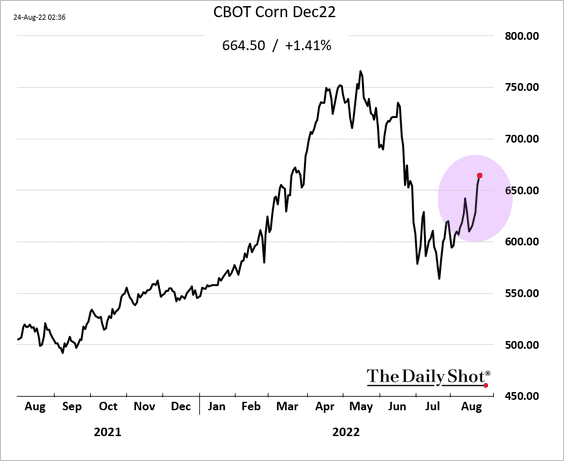
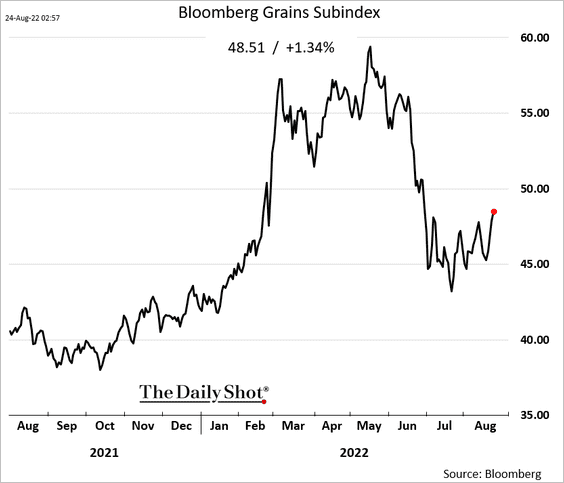
Here is Bloomberg’s grains index.
——————–
2. LME copper prices have returned to pre-vaccine levels.
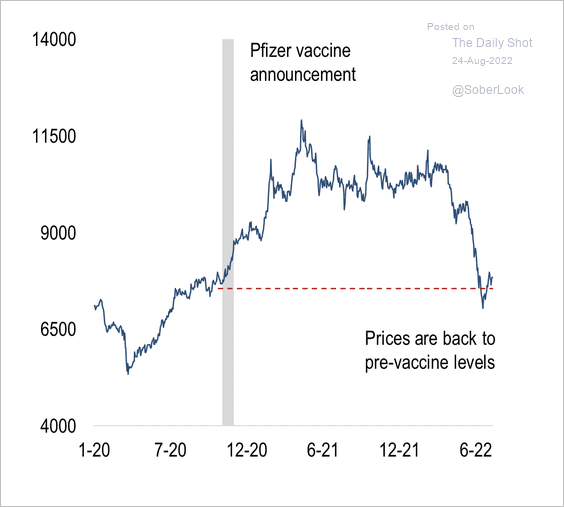 Source: Numera Analytics
3. LME aluminum inventories are at historic lows.
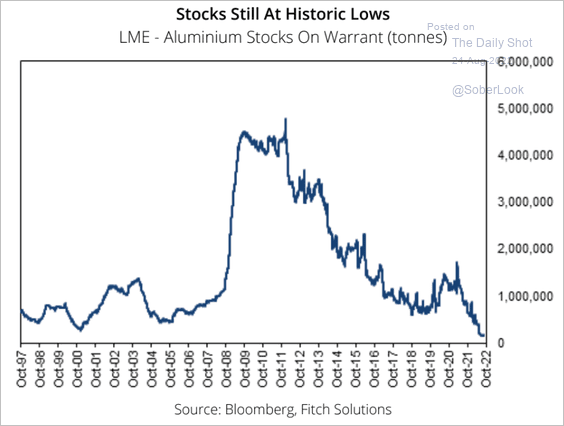 Source: Fitch Solutions Macro Research
Back to Index
Energy
1. We have liftoff on crude oil.
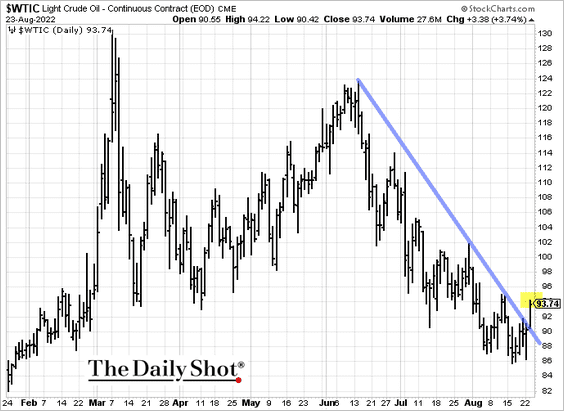
 Source: @WSJ Read full article
——————–
2. US natural gas demand has been strong this month.
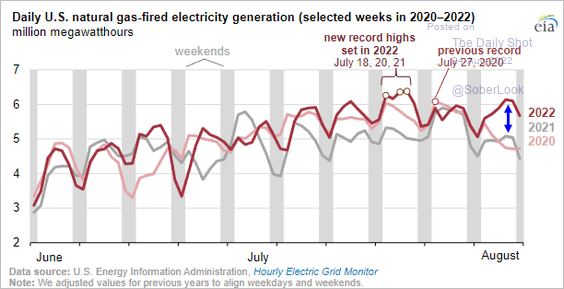 Source: @EIAgov Read full article
3. The US oil and gas sector experienced a productivity boom over the past decade.
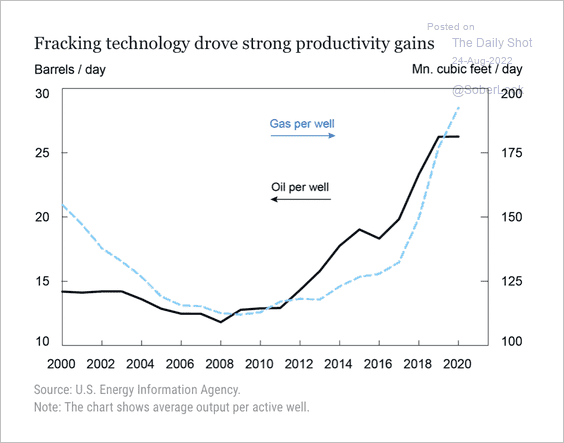 Source: Liberty Street Economics Read full article
However, the mismatch between productivity and financial performance was partly driven by weaker oil prices.
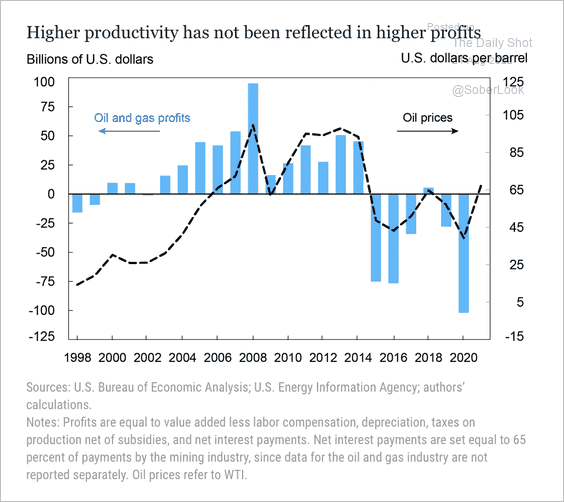 Source: Liberty Street Economics Read full article
——————–
4. So far, energy stocks are holding support relative to the S&P 500.
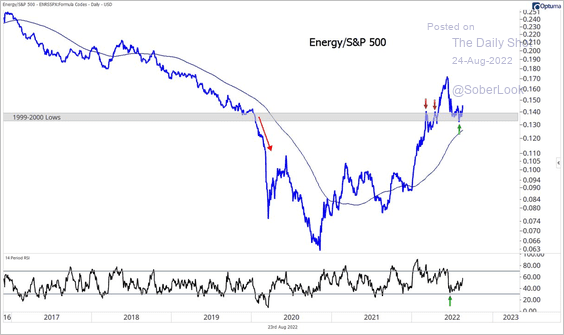 Source: @meanstoatrend
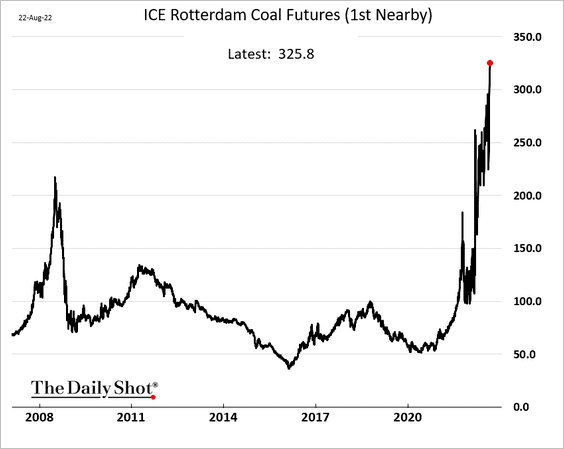
5. European coal prices have been surging with natural gas.
Back to Index
Equities
1. This charts shows the S&P 500 average forward P/E ratio under different inflation regimes (we are currently at 17.4x).
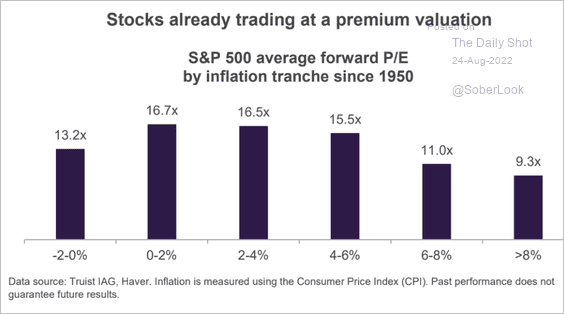 Source: Truist Advisory Services
Here is a similar comparison showing the trailing P/E.
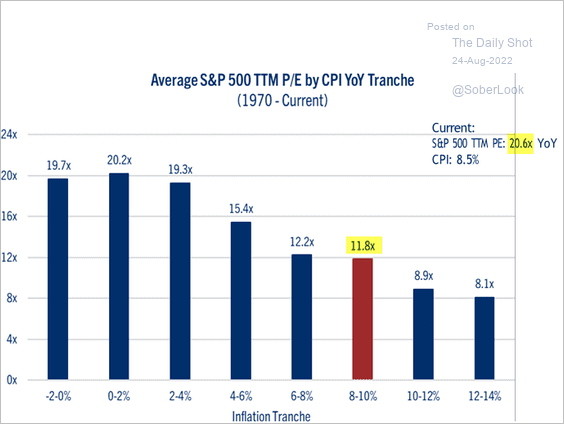 Source: John Lynch, Comerica Wealth Management
——————–
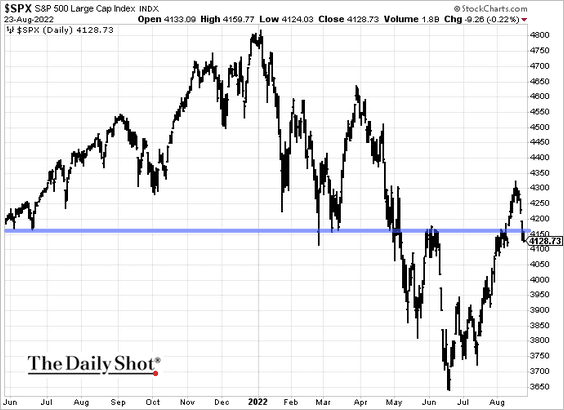
2. Is 4160 the new resistance level for the S&P 500?
3. The 2022 Q3 and Q4 earnings downgrades continue, albeit at a slower pace.
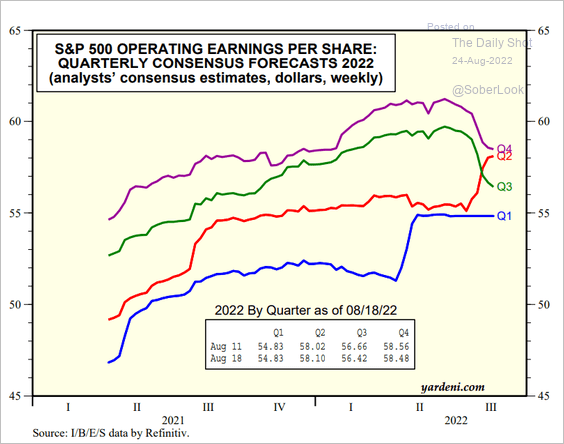 Source: Yardeni Research
4. The S&P 500’s CAPE ratio remains elevated relative to history, which implies a period of lower market returns.
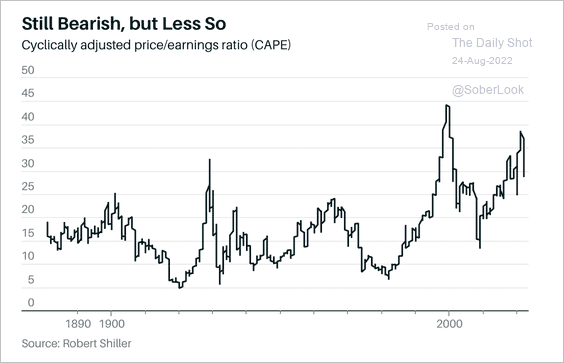 Source: Barron’s Read full article
5. Here are the drivers of S&P 500 real returns (rolling year-over-year).
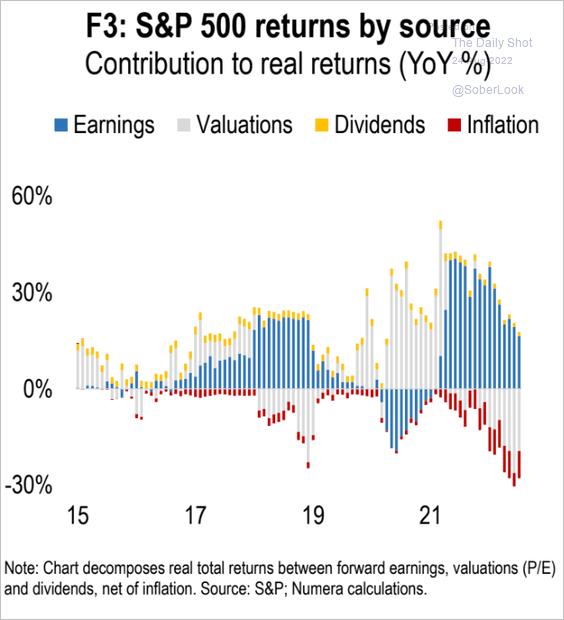 Source: Numera Analytics
6. The S&P 500 tends to bottom and trade higher shortly after the start of a mild recession, while sell-offs extend for about six months during deep recessions.
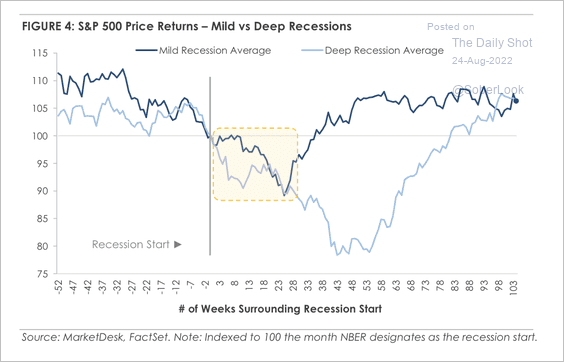 Source: MarketDesk Research
7. Finally, we have some return data around Expiration Fridays (from Chris Murphy).
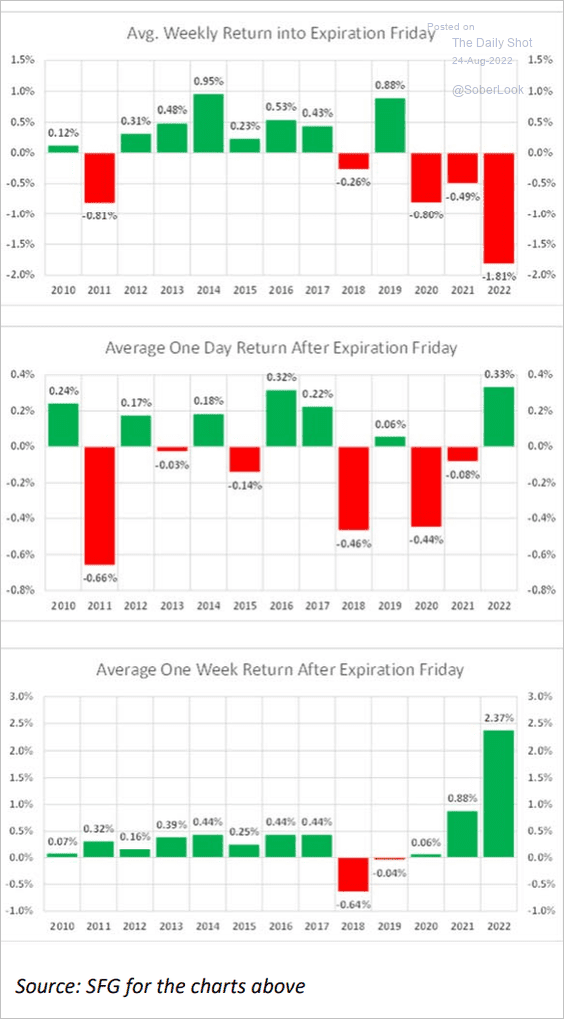 Source: Chris Murphy, Susquehanna International Group
Back to Index
Alternatives
1. Global private equity and VC deal value is down 63%.
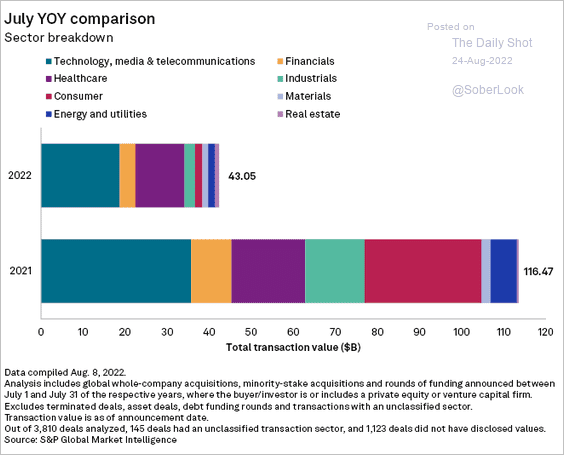 Source: S&P Global Market Intelligence
2. Infrastructure-focused fundraisng remains robust.
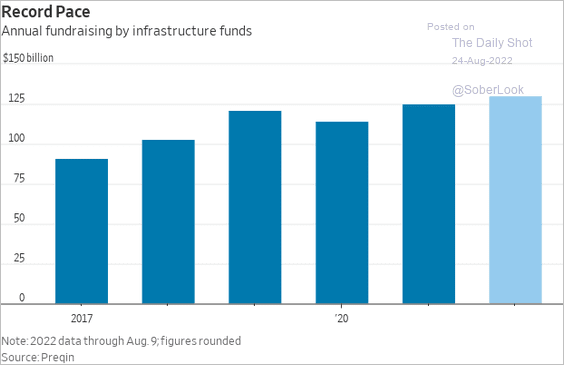 Source: @WSJ Read full article
3. Direct-lending funds’ capital raise continues to trend higher, …
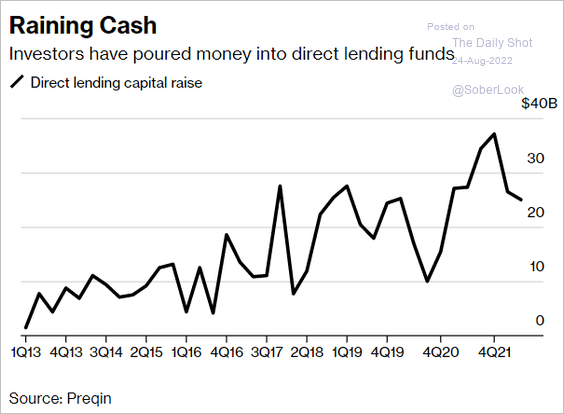 Source: Bloomberg Read full article
… boosting dry powder to $210 billion, according to Bloomberg.
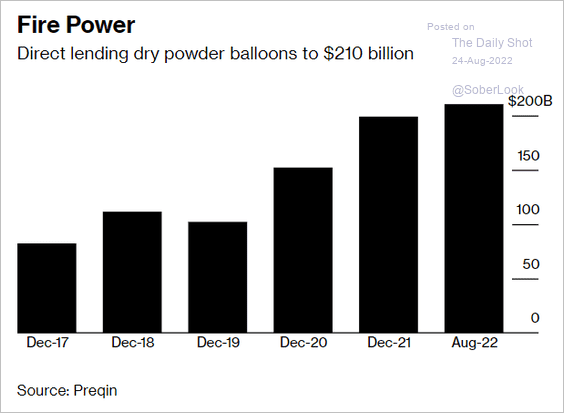 Source: Bloomberg Read full article
4. Private markets’ AUM is above $10 trillion.
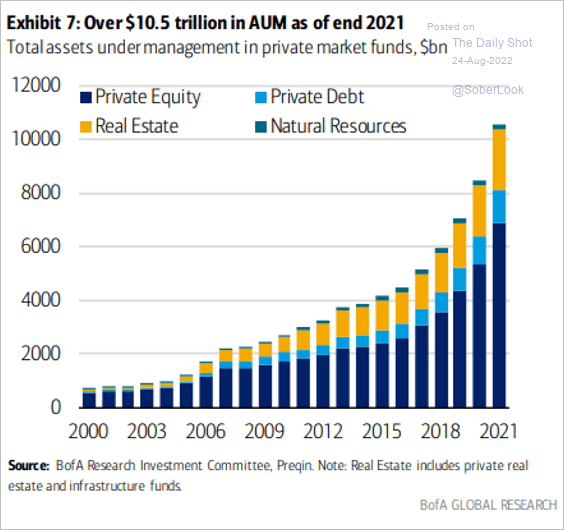 Source: BofA Global Research
Back to Index
Rates
1. ANZ sees the Fed raising rates to 4% in this cycle.
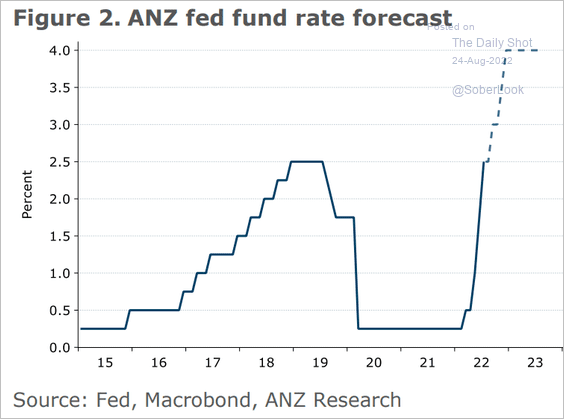 Source: @ANZ_Research
How does the current tightening cycle compare to previous ones?
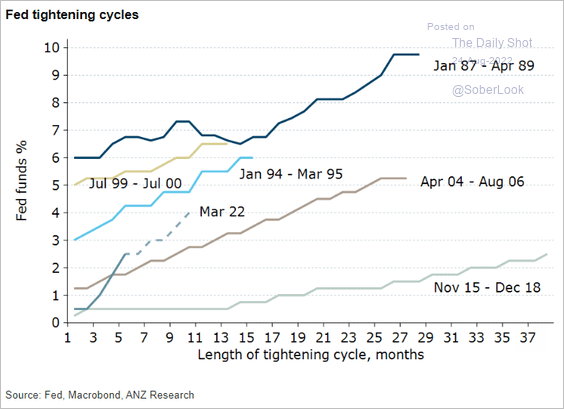 Source: @ANZ_Research
——————–
2. Market expectations are a poor predictor of the fed funds rate.
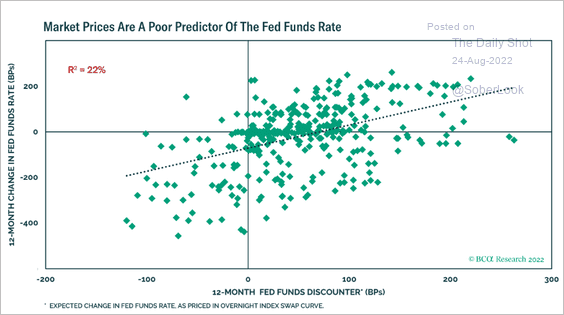 Source: BCA Research
3. Softer global demand (particularly for semiconductors) points to lower Treasury yields.
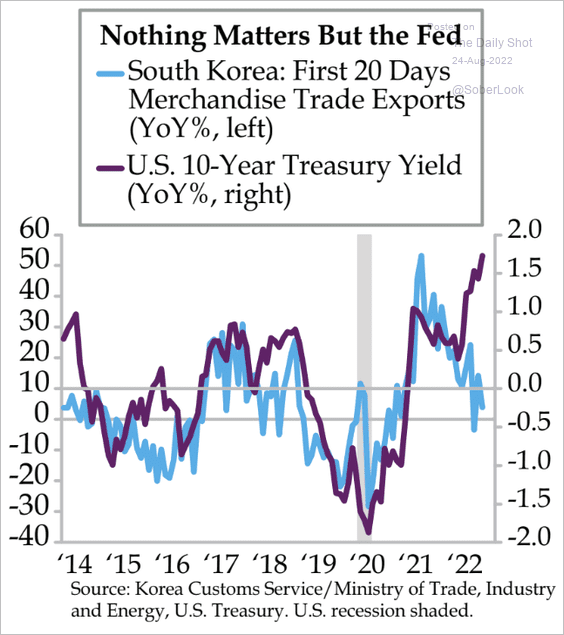 Source: Quill Intelligence
Back to Index
Global Developments
1. Global business activity is contracting, according to the Wold Economics SMI.
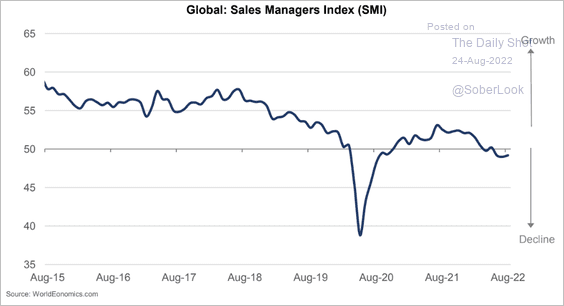 Source: World Economics
2. Indicators that are more sensitive to interest rate changes, such as mortgage approvals and auto sales, have declined over the past year.
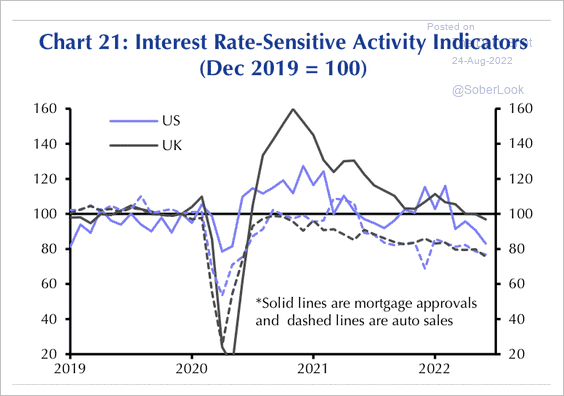 Source: Capital Economics
3. This chart shows office vacancy rates by region.
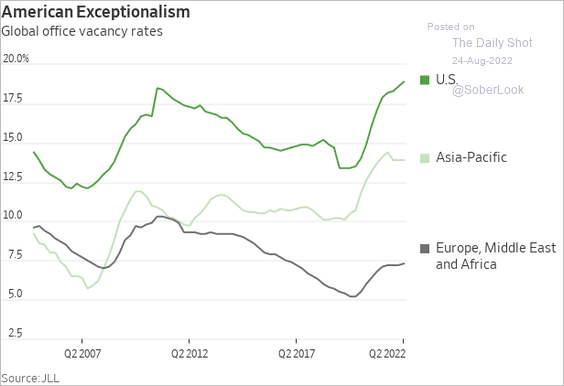 Source: @WSJ Read full article
——————–
Food for Thought
1. Once-per-week office visits:
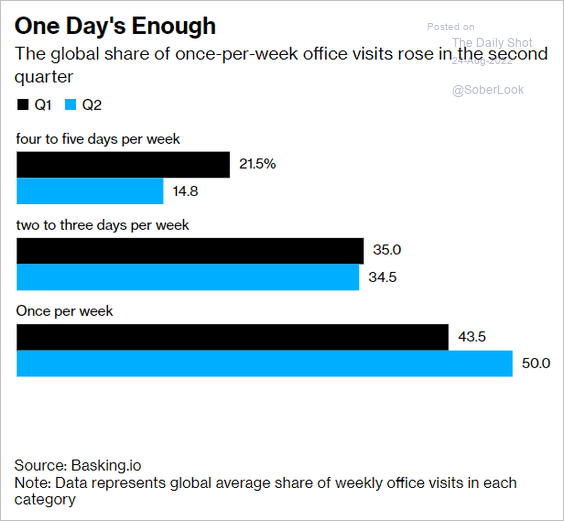 Source: Bloomberg Read full article
2. US agriculture employment:
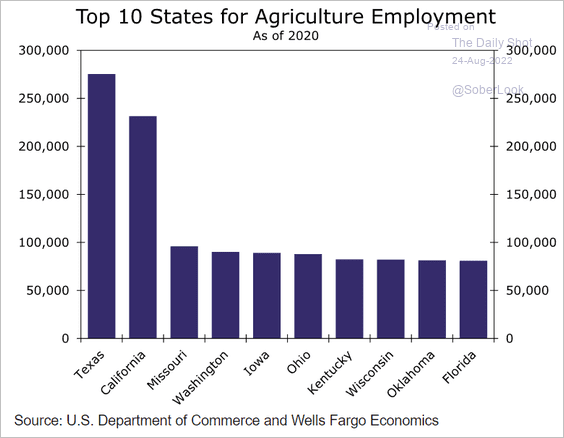 Source: Wells Fargo Securities
3. Cross-class friendships:
 Source: The Economist Read full article
4. Migrants arrested at the US southwest border:
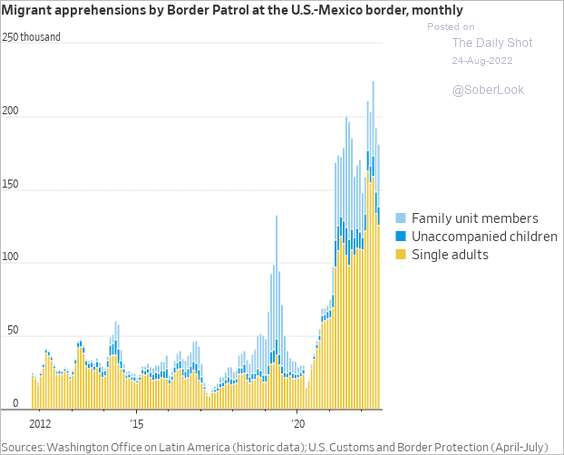 Source: @WSJ Read full article
5. Google search activity for “student loans”:
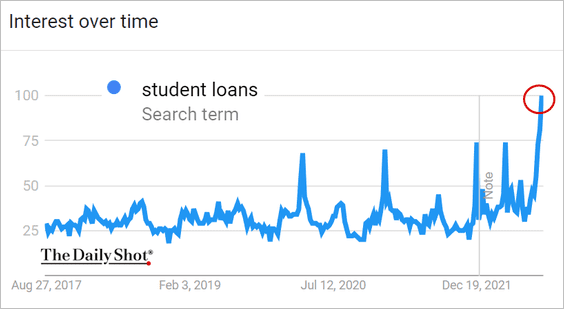 Source: Google Trends Further reading
6. Inequality vs. taxation:
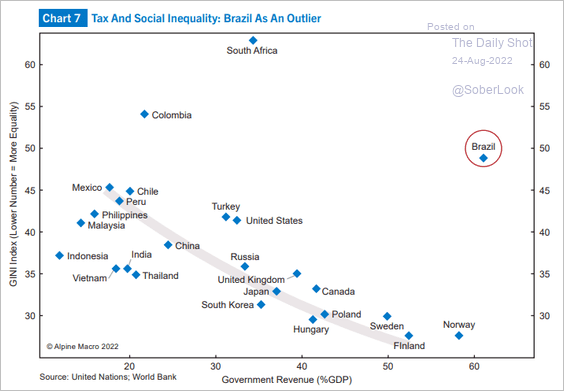 Source: Alpine Macro
7. The richest athletes:
 Source: @OpenAxisHQ
——————–
Back to Index