
The Daily Shot: 15-Sep-22
• The United States
• The United Kingdom
• The Eurozone
• Europe
• Asia – Pacific
• China
• Emerging Markets
• Cryptocurrency
• Commodities
• Energy
• Equities
• Credit
• Global Developments
• Food for Thought
The United States
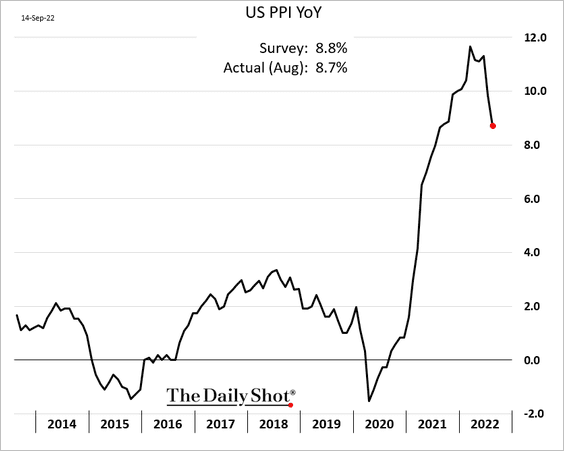
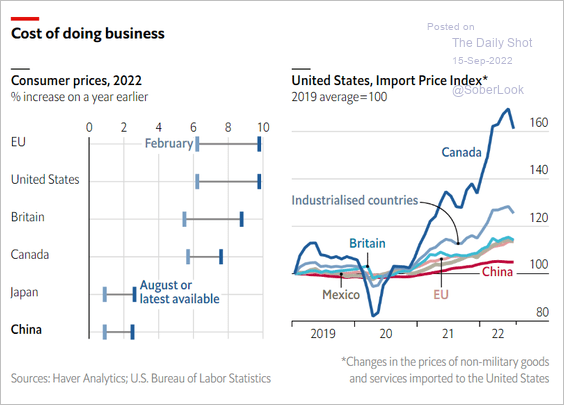
1. Let’s begin with some updates on inflation.
• The PPI is off the highs on a year-over-year basis, but producer price inflation continues to run hot.
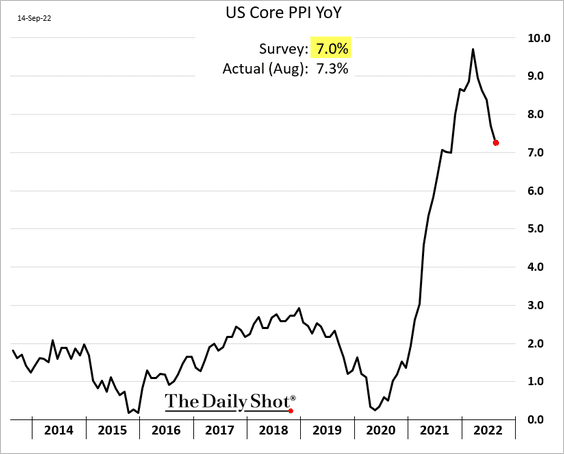
The core PPI was higher than expected.
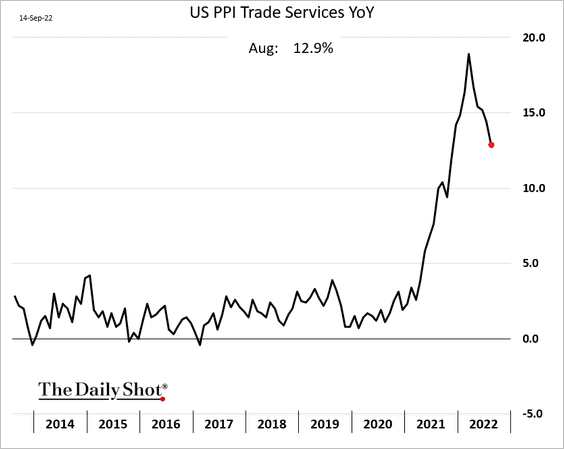
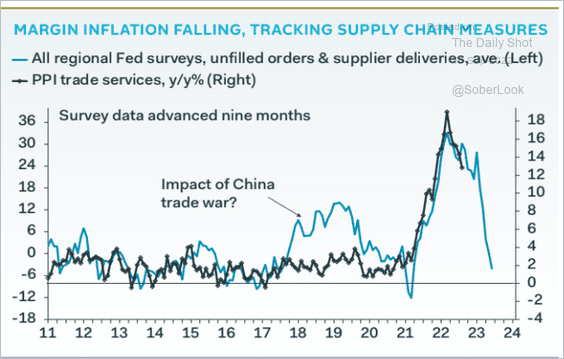
The trade services PPI has started to moderate as supply pressures ease, pointing to falling corporate margins ahead.
 Source: Pantheon Macroeconomics
——————–
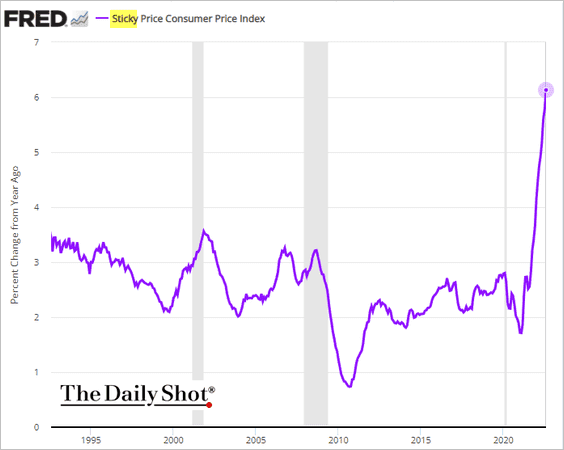
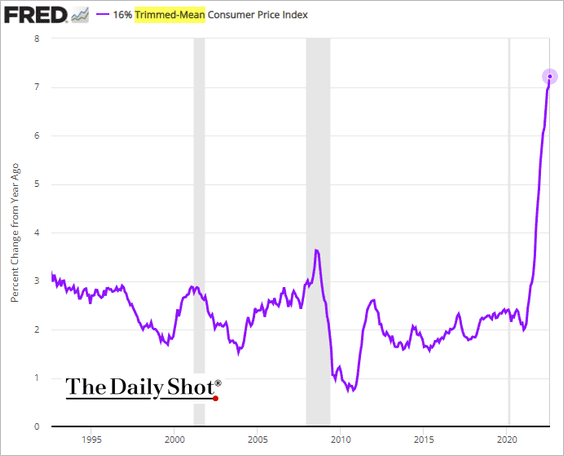
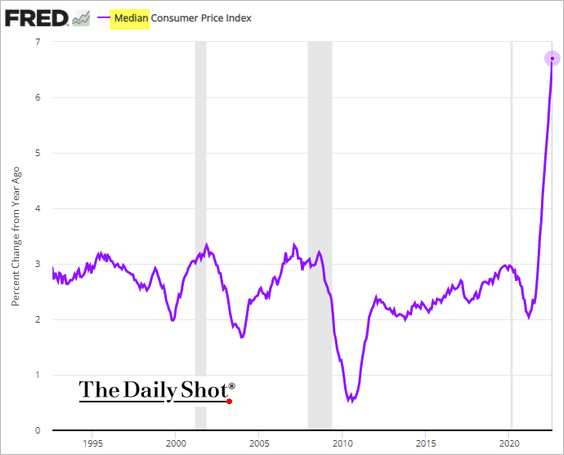
• Alternative measures of core consumer inflation continue to surge.
– Sticky CPI:
– Trimmed-mean CPI:
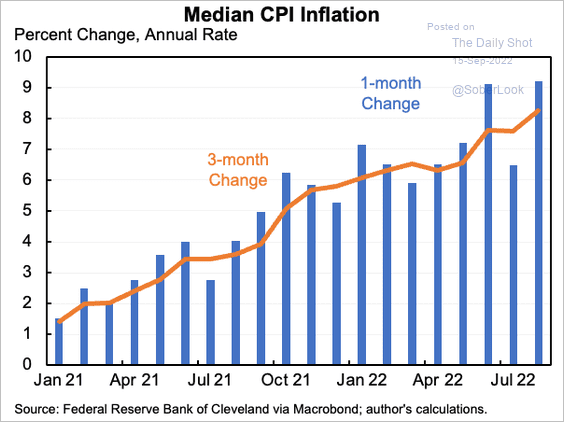
– Median CPI (2 charts):
 Source: @jasonfurman
——————–
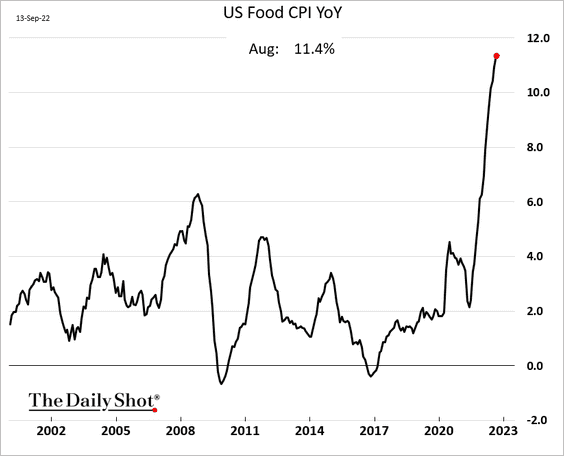
• Food inflation kept climbing in August (as predicted by the YipitData indicator)
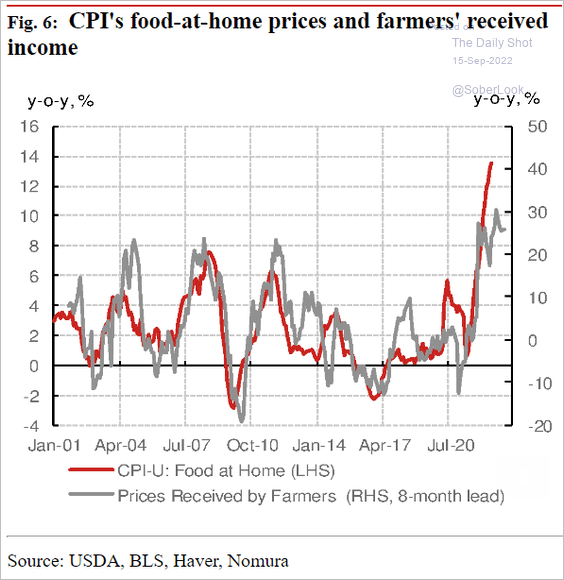
By the way, the food-at-home CPI has diverged from farmers’ income.
 Source: Nomura Securities
——————–
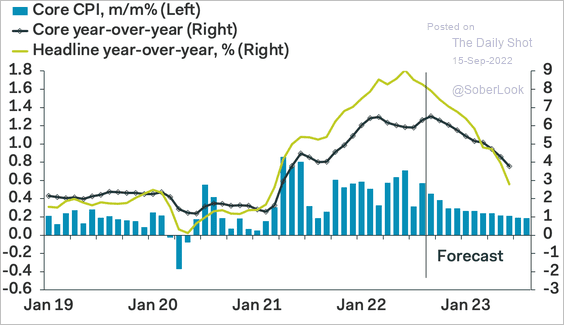
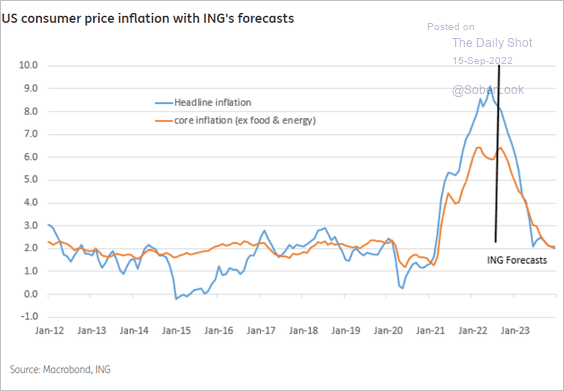
• Here are some CPI forecasts.
– Pantheon Macroeconomics:
 Source: Pantheon Macroeconomics
– ING:
 Source: ING
– Oxford Economics:
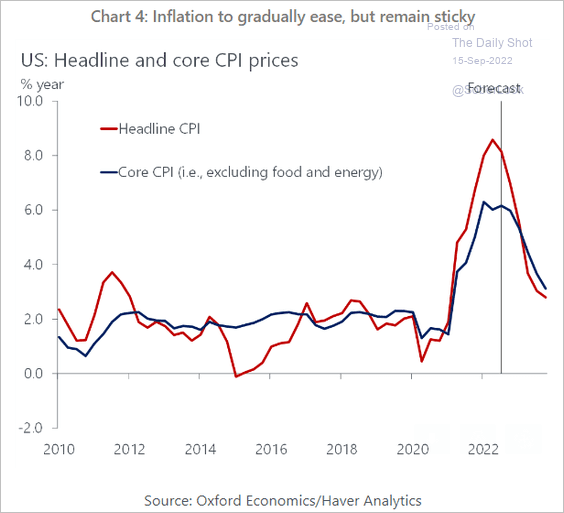 Source: Oxford Economics
– Deutsche Bank:
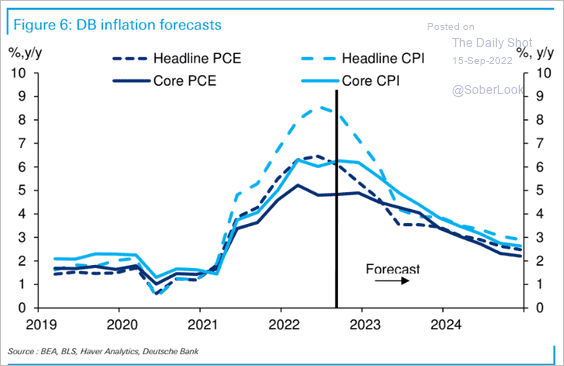 Source: Deutsche Bank Research
——————–
• Below are a few additional CPI figures.
– CPI component weights:
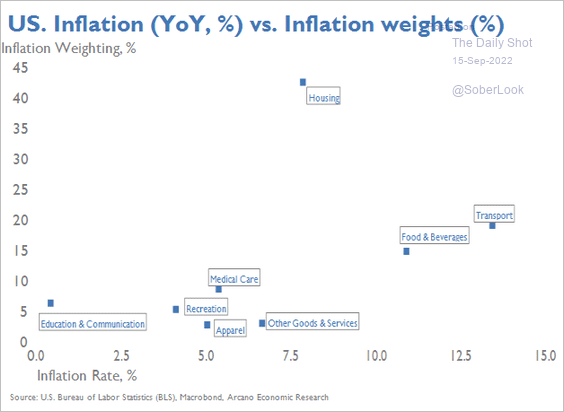 Source: Arcano Partners
– CPI components that are above 6%:
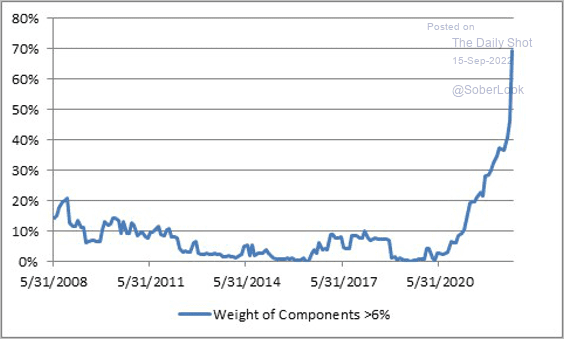 Source: @inflation_guy
– Supply- and demand-driven CPI components:
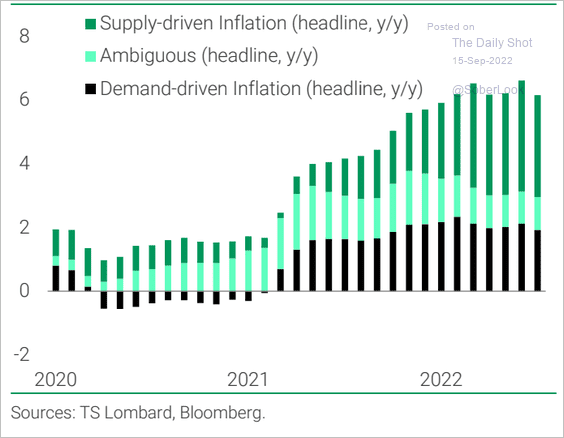 Source: TS Lombard
– Core services CPI vs. wages:
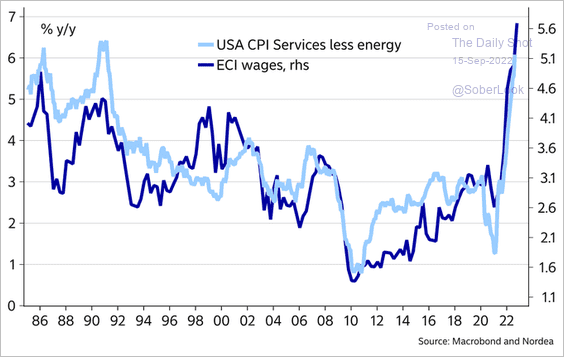 Source: @MikaelSarwe
– CPI by metro area:
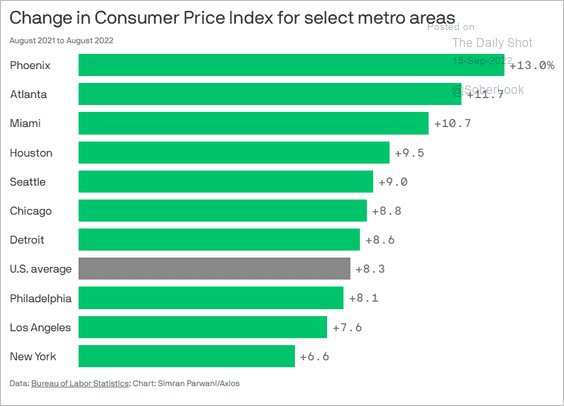 Source: @axios Read full article
——————–
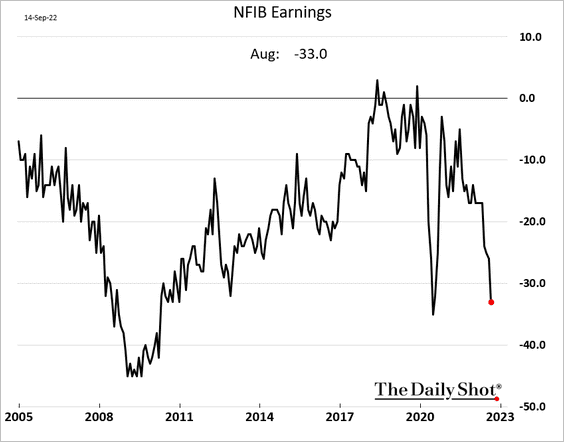
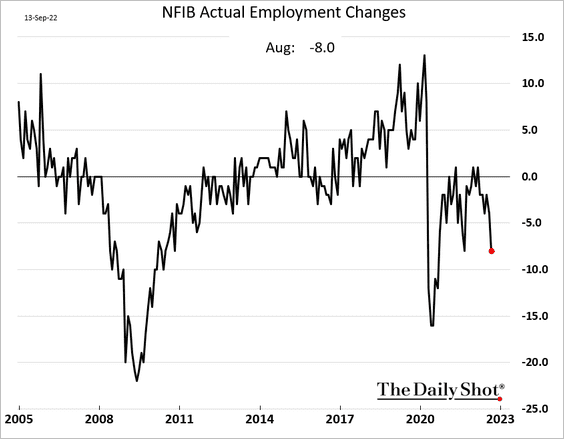
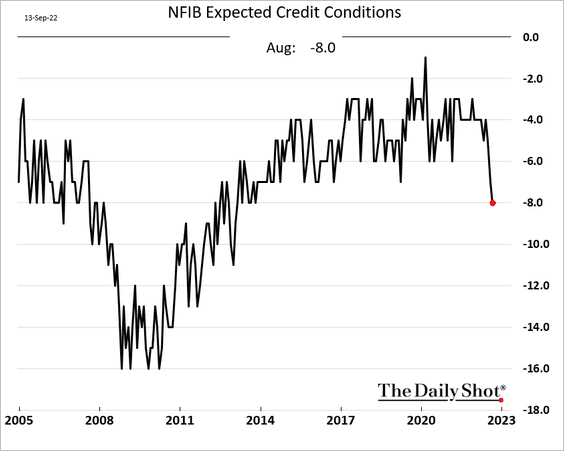
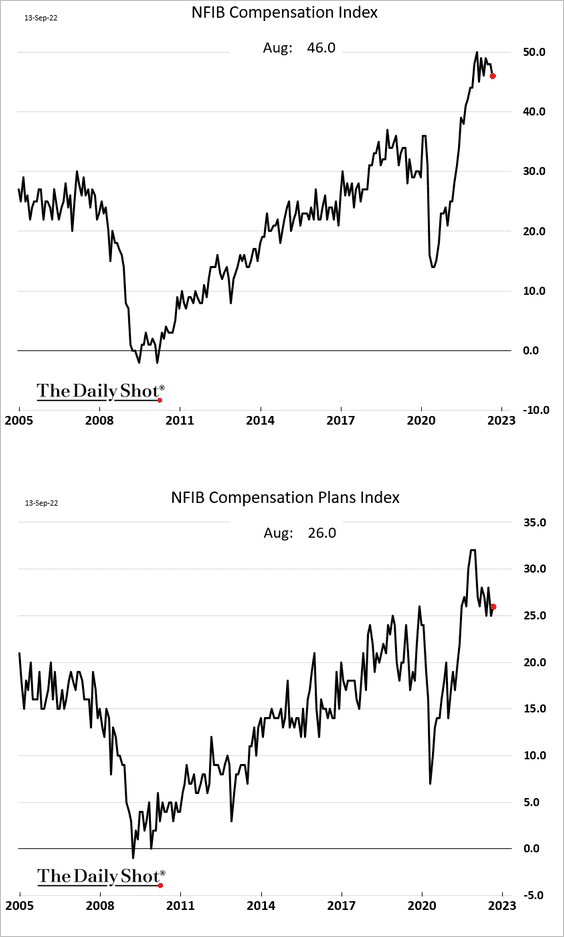
2. As we saw yesterday, the NFIB small business sentiment improved slightly in August. Here are some additional trends from the report.
• Earnings look recessionary:
• Employment:
• Expected credit conditions:
• Compensation indicators (still elevated):
• Price plans (pointing to slower inflation ahead):
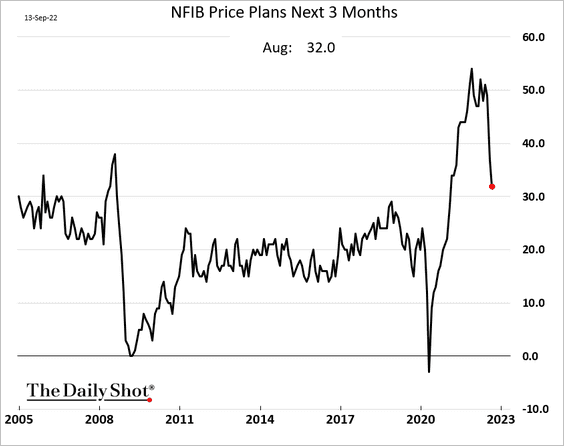
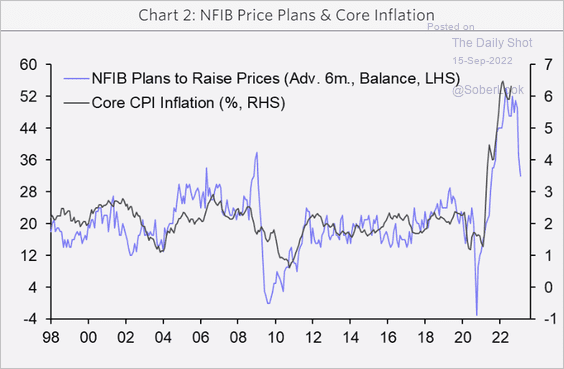 Source: Capital Economics
——————–
3. Mortgage applications are running just above 2013 levels.
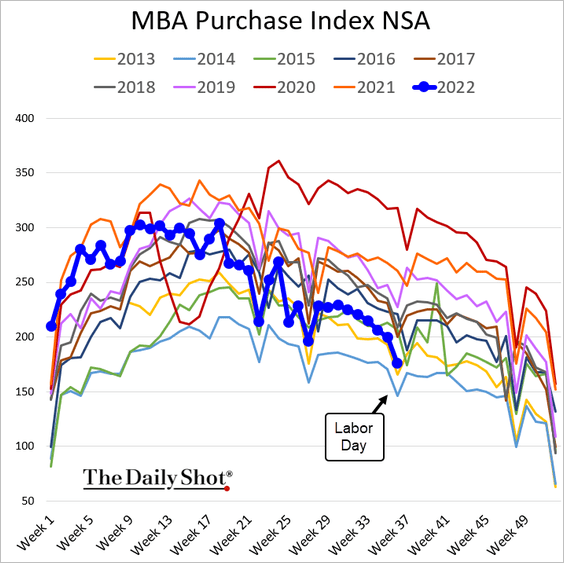
This chart shows mortgage locks.
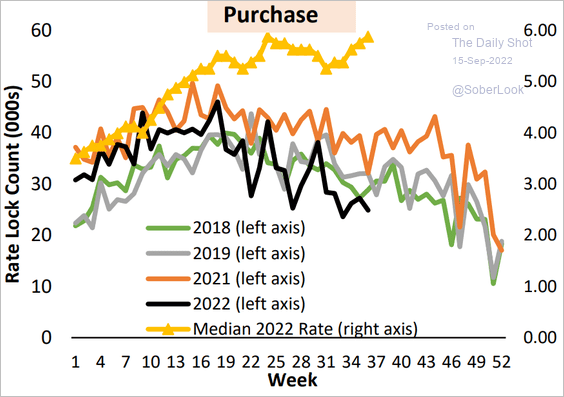 Source: AEI Center on Housing Markets and Finance
The Mortgage News Daily 30-year mortgage rate index hit 6.3%.
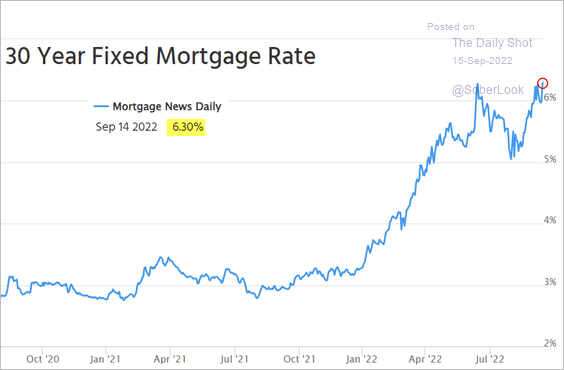 Source: Mortgage News Daily
——————–
4. The Treasury curve is increasingly inverted.
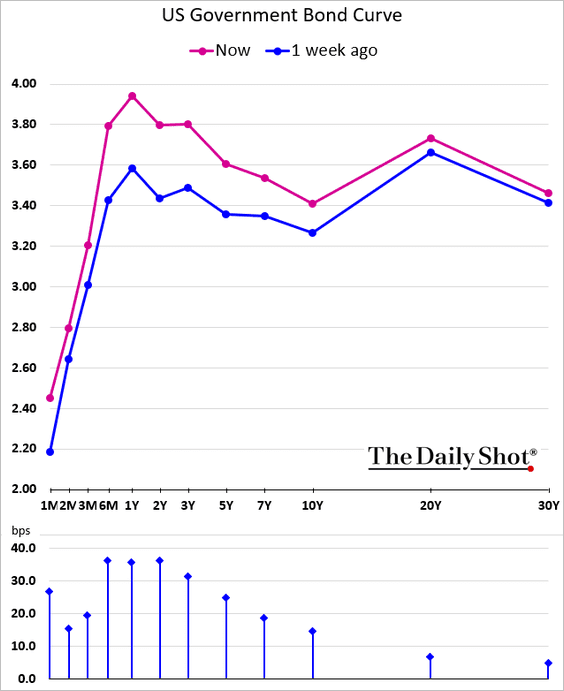
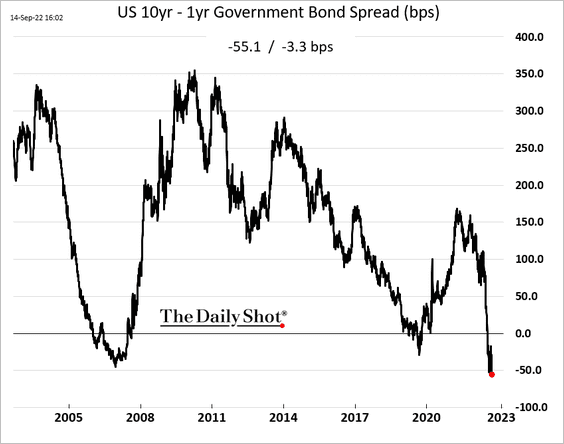
• 10yr – 1yr spread:
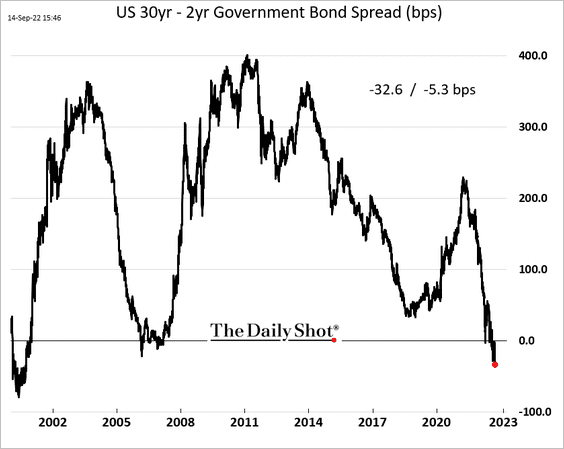
• 30yr – 2yr spread:
Back to Index
The United Kingdom
1. Inflation remains hot.
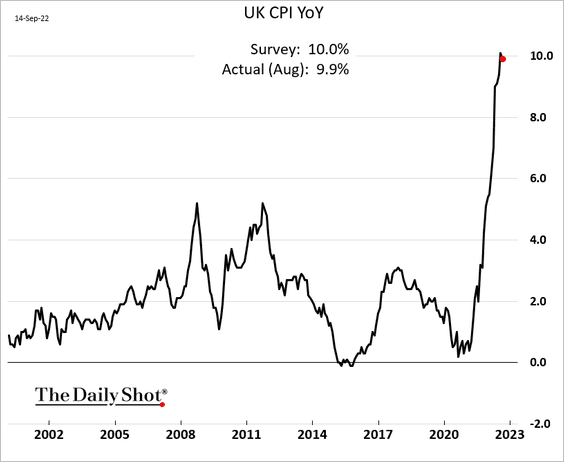
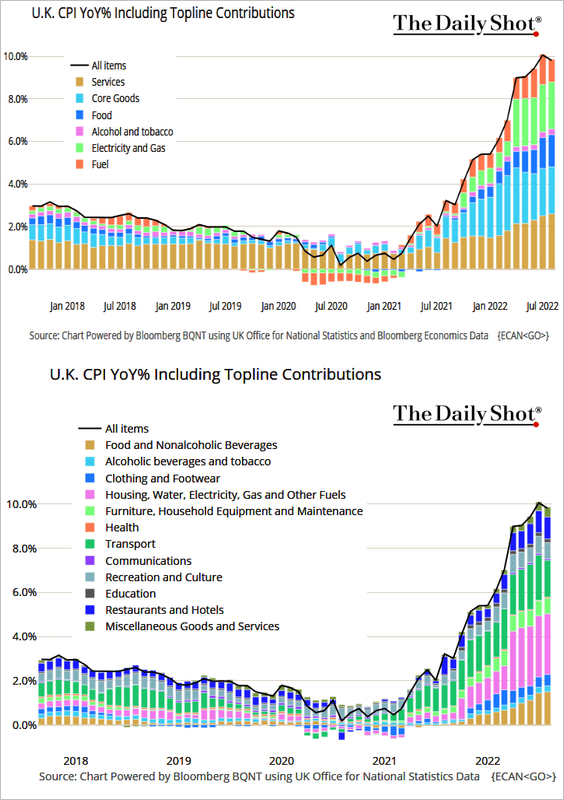 Source: @TheTerminal, Bloomberg Finance L.P.
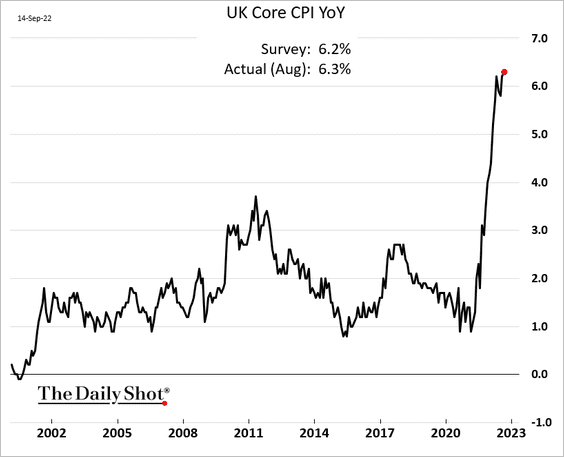
• Core CPI:
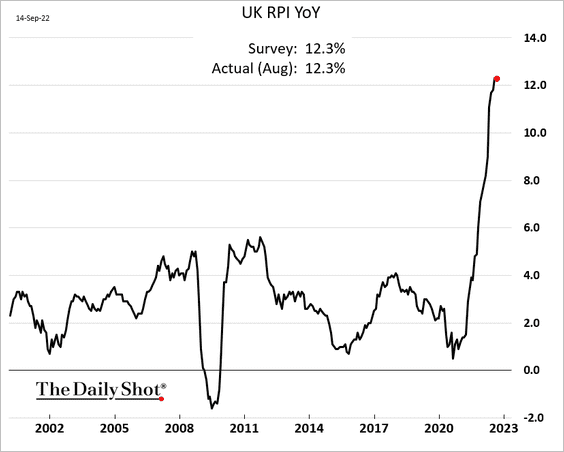
• Retail price index:
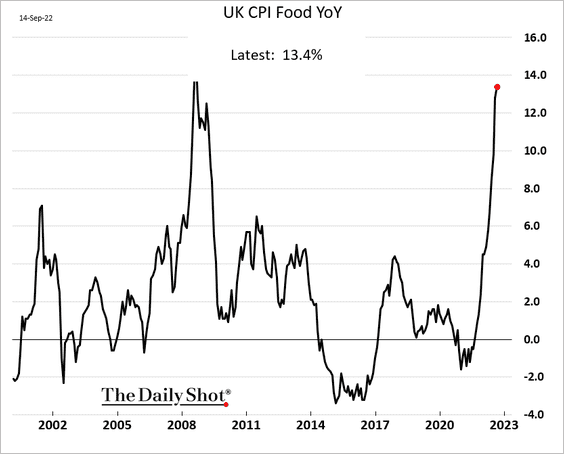
• Food inflation:
Rising inventories should help ease durable goods inflation.
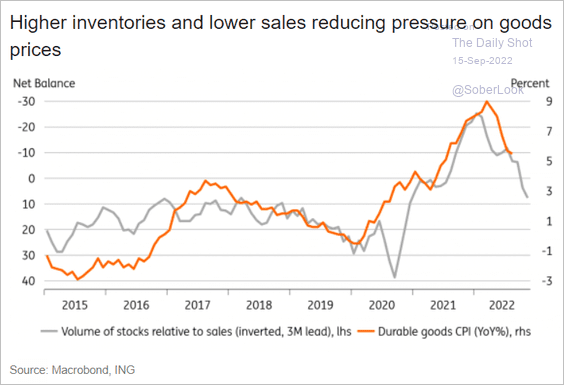 Source: ING
Here is a forecast from ING.
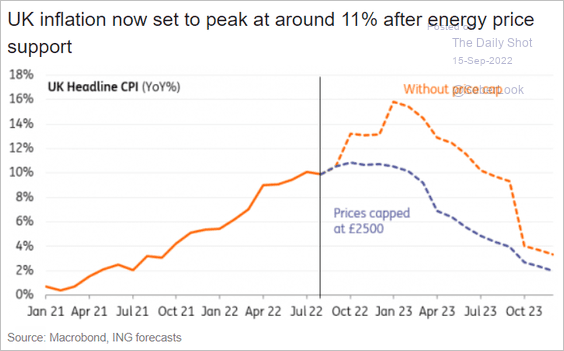 Source: ING
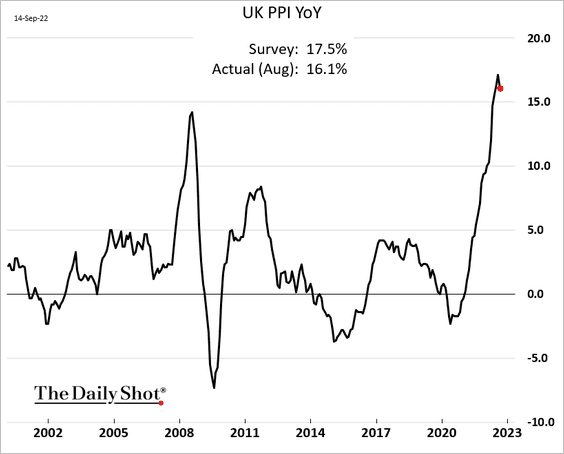
2. The PPI came off the highs.
3. Wage growth is starting to cool.
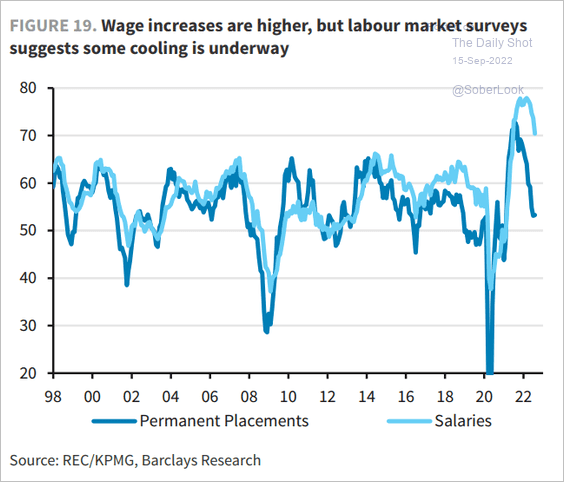 Source: Barclays Research
Back to Index
The Eurozone
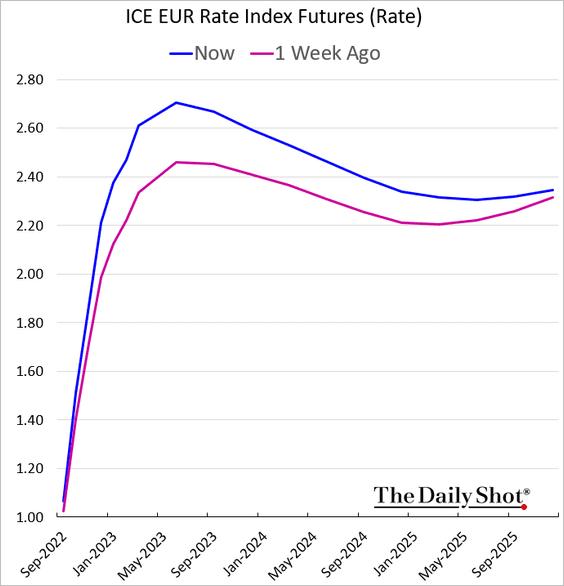
1. Rate hike expectations continue to climb (rate trajectory shown below), with the terminal rate hitting 2.7%.
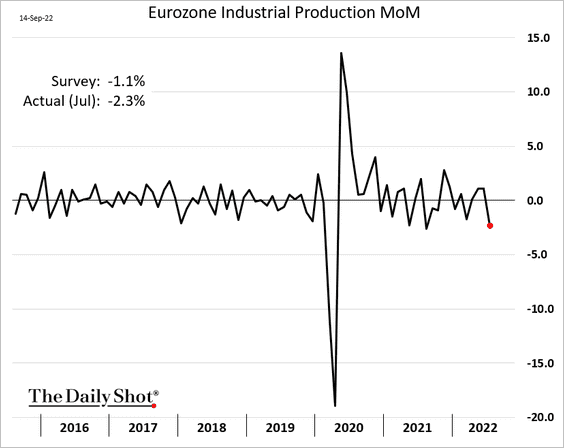
2. Industrial production dropped more than expected in July.
Energy-intensive sectors are under pressure.
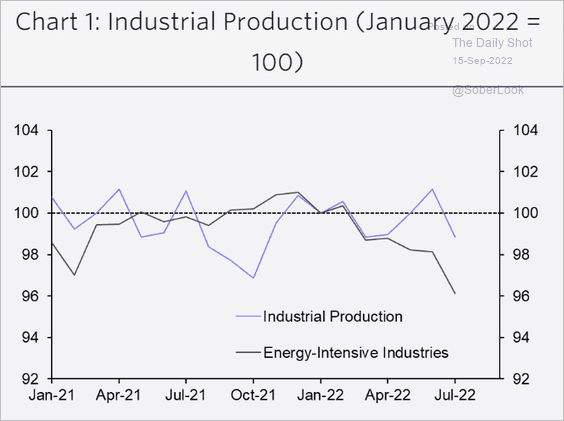 Source: Capital Economics
The PMI index points to downside risks for euro-area industrial production.
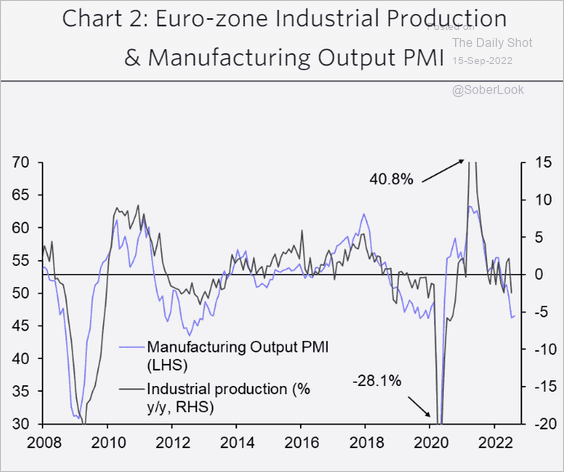 Source: Capital Economics
——————–
3. Germany has been shifting residential construction to renewables.
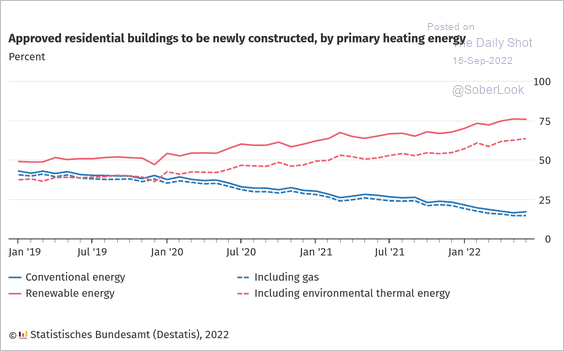 Source: @destatis_news
4. This chart shows renters vs. homeowners in the Eurozone.
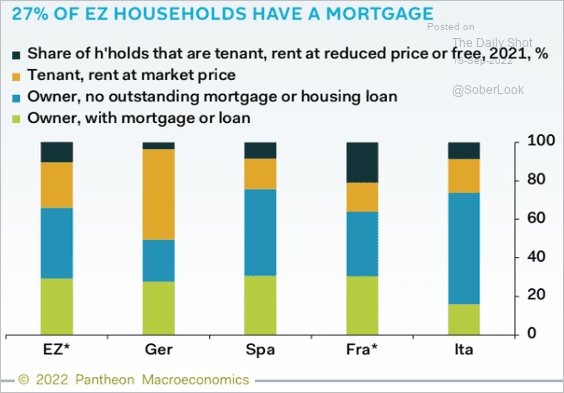 Source: Pantheon Macroeconomics
Back to Index
Europe
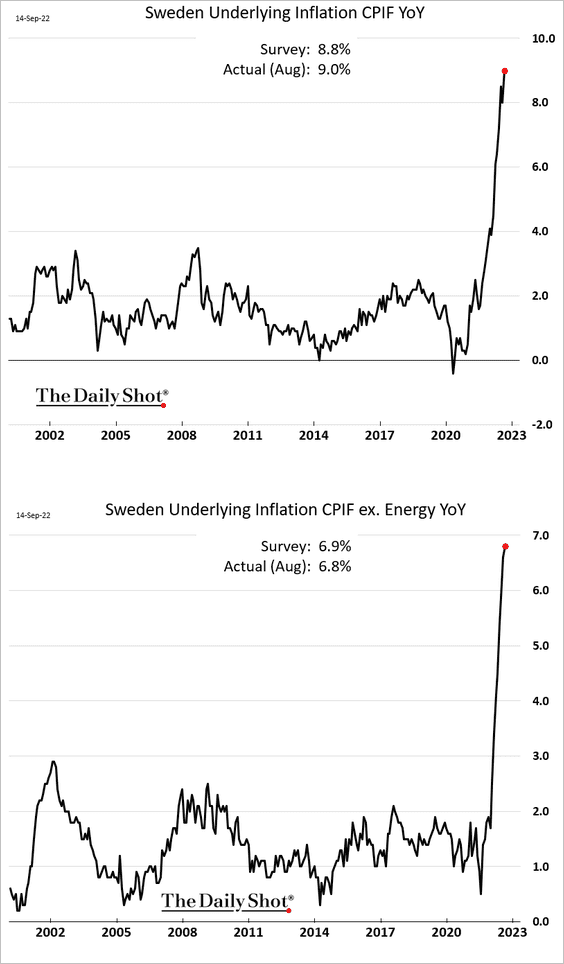
1. Sweden’s CPI continues to surge.
2. The gross supply of LNG to the European market (production plus imports) over the past quarter was not dramatically different compared to previous years. However, the pricing environment has changed.
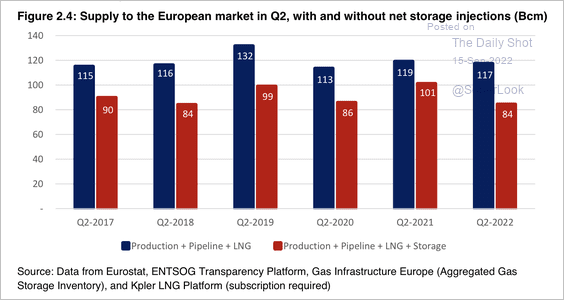 Source: Oxford Institute for Energy Studies
3. STOXX 600 earnings estimates have been outpacing other markets.
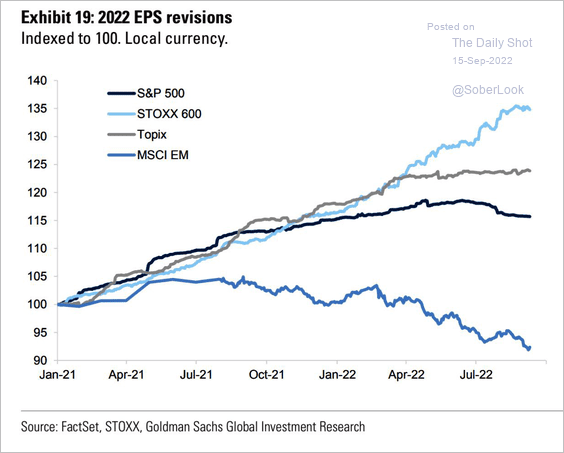 Source: Goldman Sachs; @_____JustMe__
4. This chart shows high-speed internet coverage in the EU.
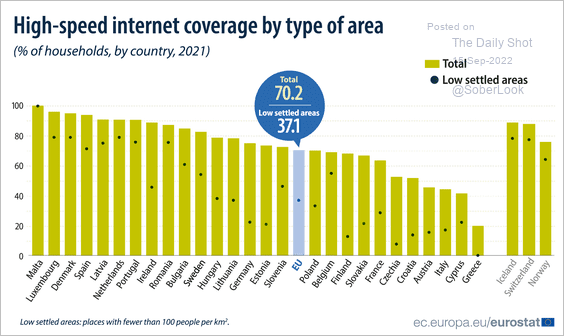 Source: Eurostat Read full article
Back to Index
Asia – Pacific
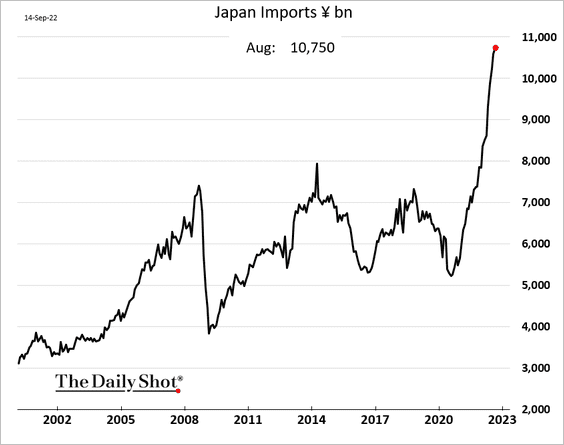
1. Japan’s trade deficit hit a new record, …
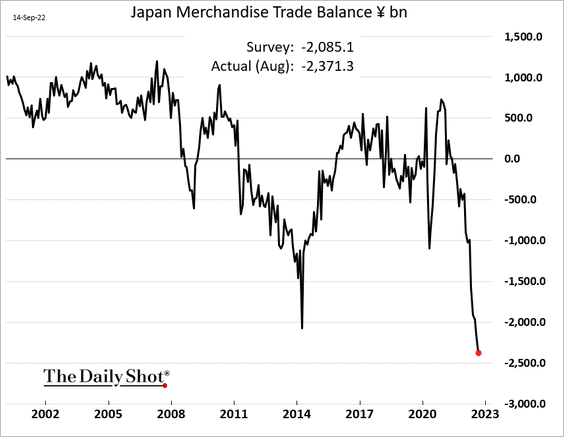
… as imports surge (mostly due to energy costs).
——————–
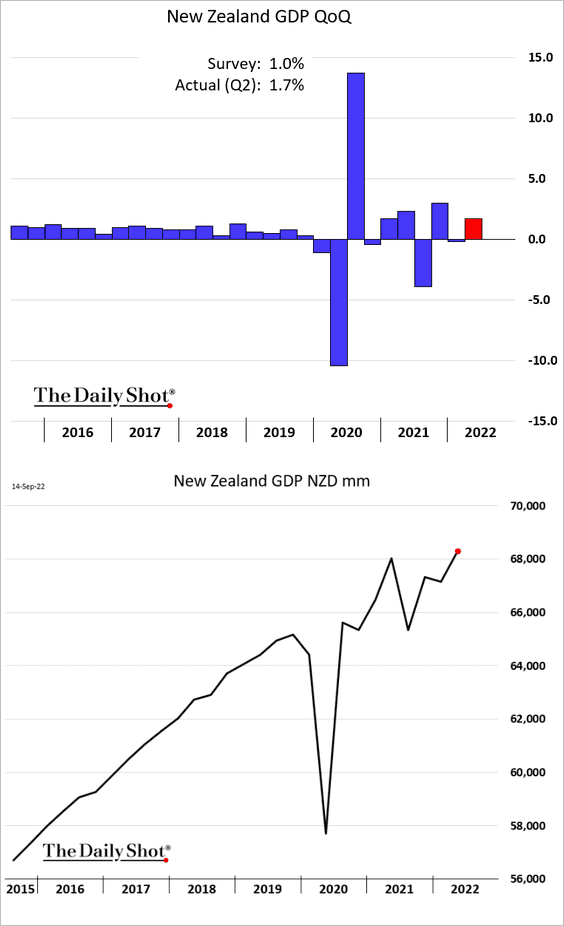
2. New Zealand’s Q2 GDP surprised to the upside.
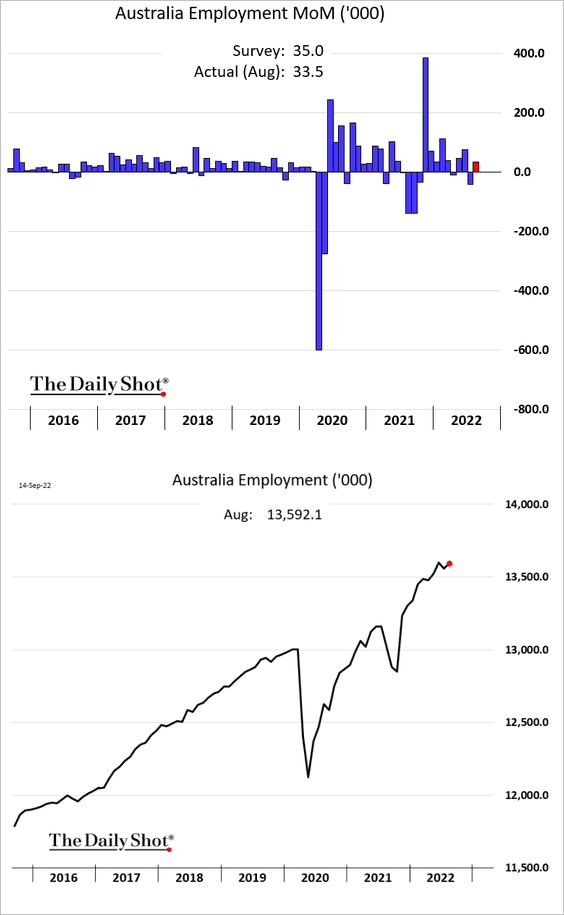
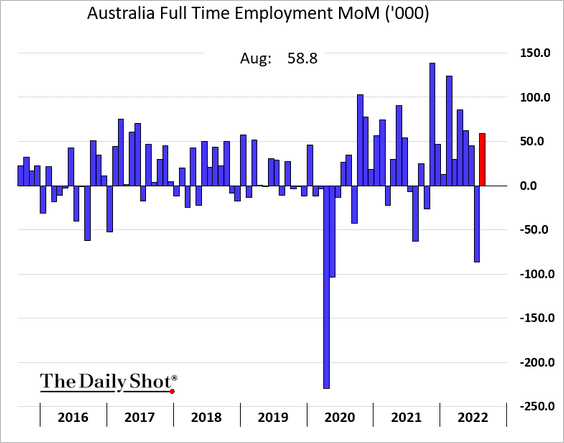
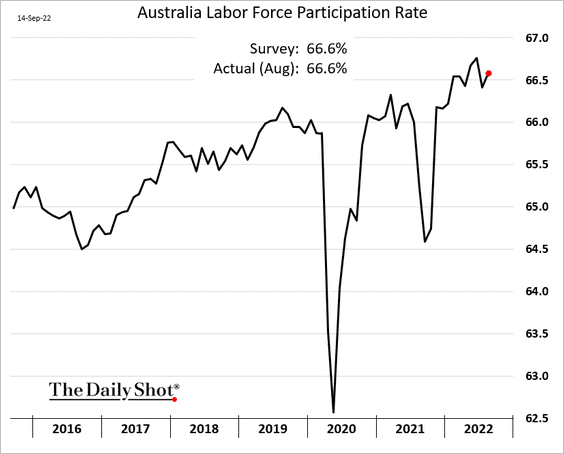
3. Australia’s employment report was in line with forecasts.
• Full-time employment:
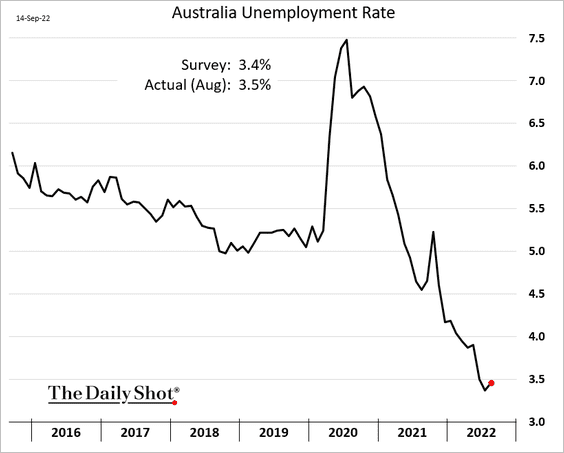
• The unemployment rate:
• Labor force participation:
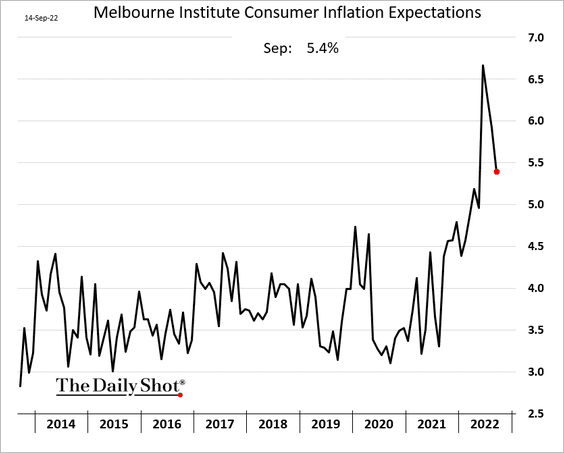
Separately, Australia’s consumer inflation expectations are easing.
Back to Index
China
1. The PBoC has lowered rates, although it appears insufficient to counter lackluster loan demand.
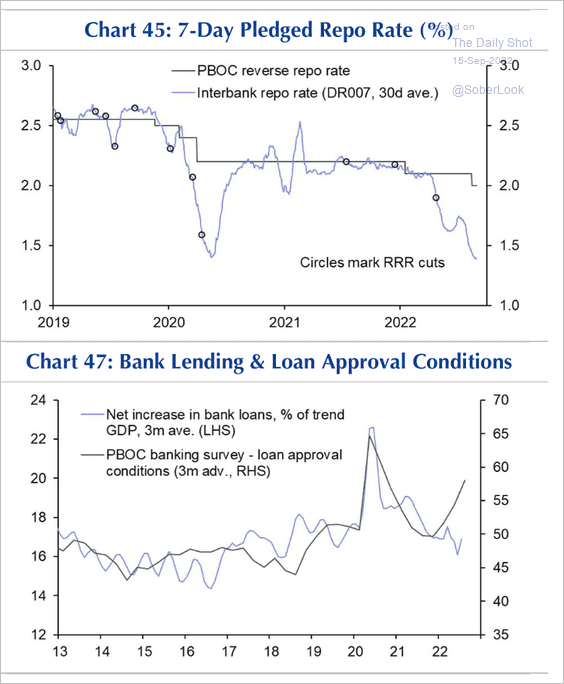 Source: Capital Economics
2. Corporate earnings are soft outside of energy.
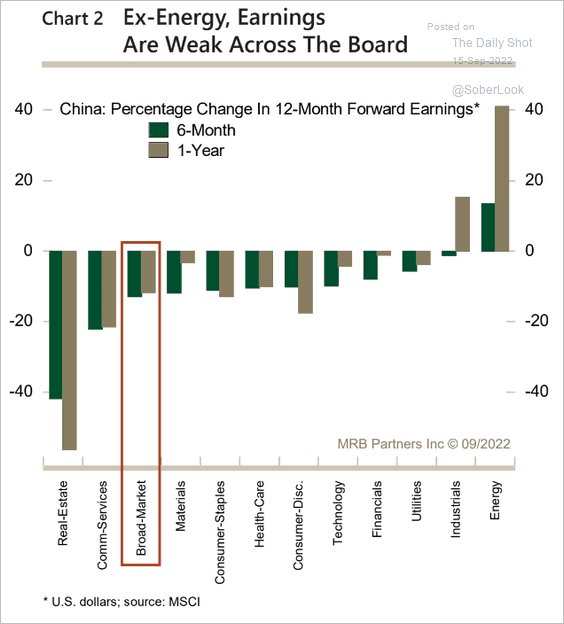 Source: MRB Partners
3. Inflation has been low relative to other economies, allowing for more stimulus.
 Source: The Economist Read full article
4. Investors increasingly see China’s 2022 growth below 4%.
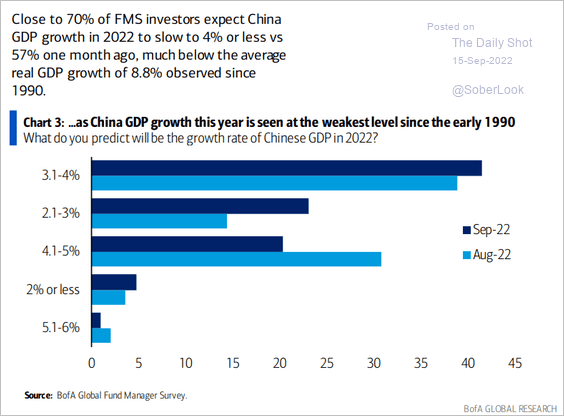 Source: BofA Global Research
Back to Index
Emerging Markets
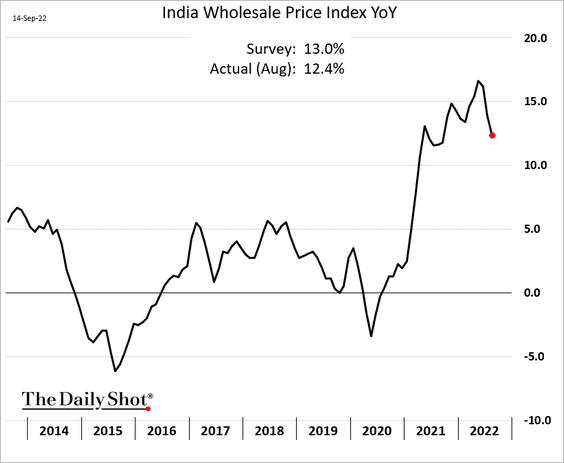
1. Let’s begin with India.
• The trade deficit eased slightly last month.
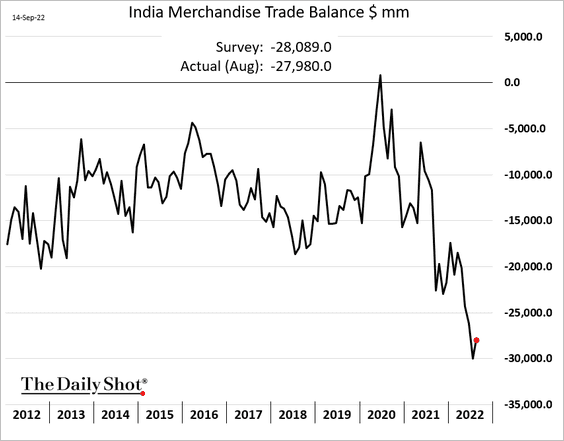
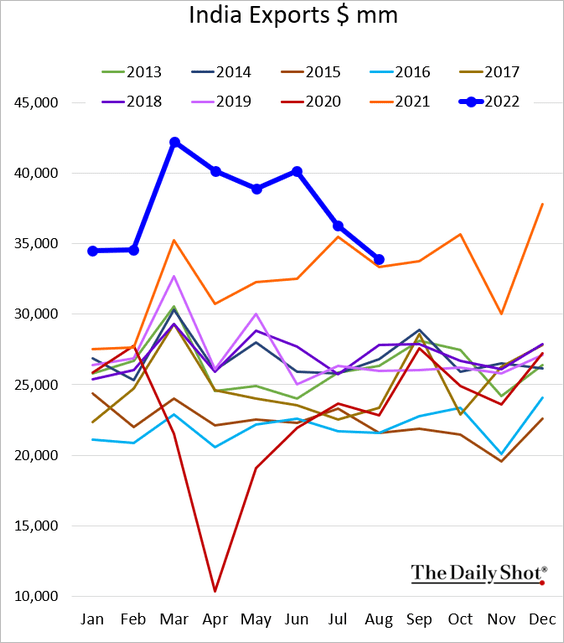
Exports are back at last year’s levels.
• Wholesale price inflation is starting to ease.
——————–
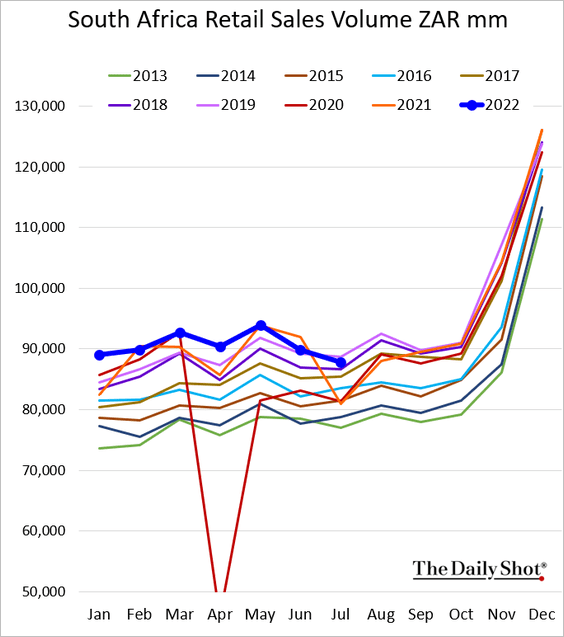
2. South Africa’s retail sales are now below 2019 levels.
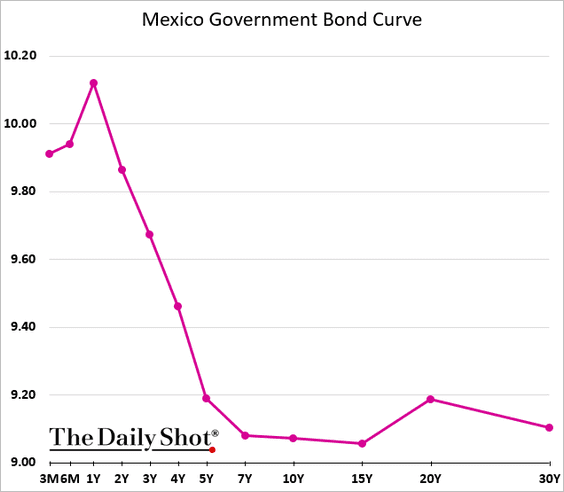
3. Mexico’s 2-year yield is nearing 10%.
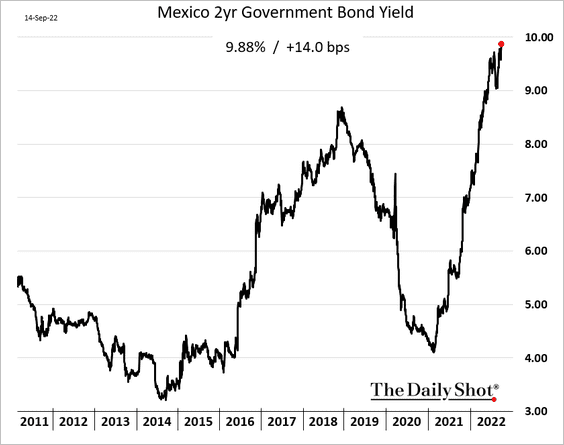
The yield curve is heavily inverted.
——————–
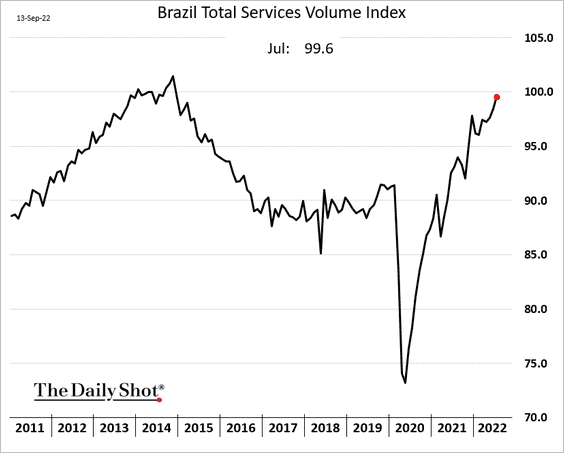
4. Brazil’s retail sales softened again in July.
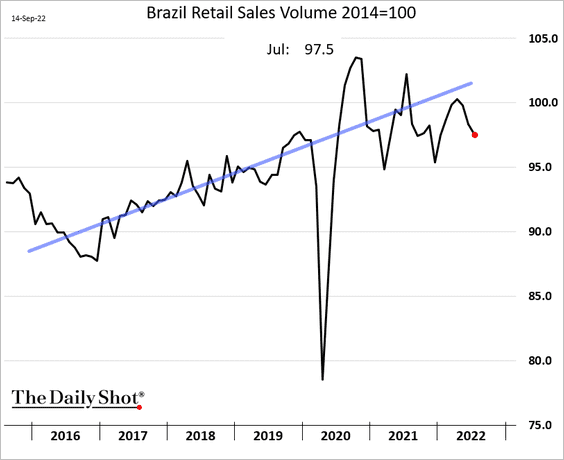
The nation’s service sector activity has been very strong.
——————–
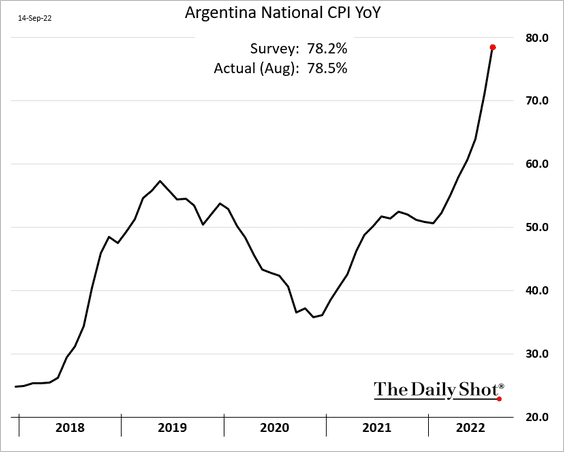
5. Argentina’s CPI is nearing 80%.
6. The performance of EM equities relative to developed markets largely tracks movements in the dollar.
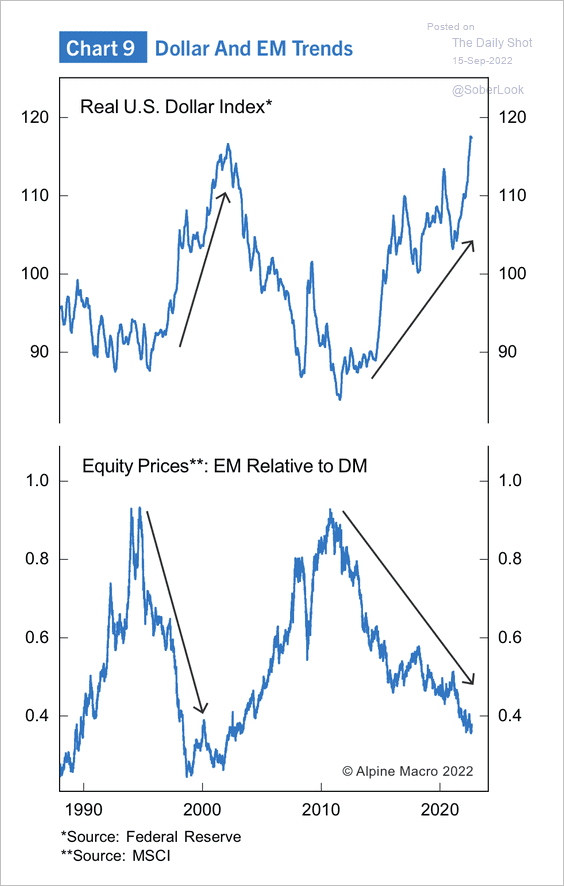 Source: Alpine Macro
7. This chart shows real policy rates in select economies.
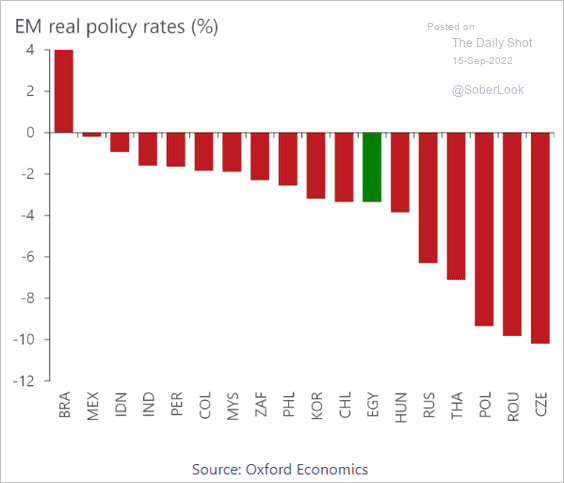 Source: Oxford Economics
Back to Index
Cryptocurrency
1. Bitcoin has been consolidating.
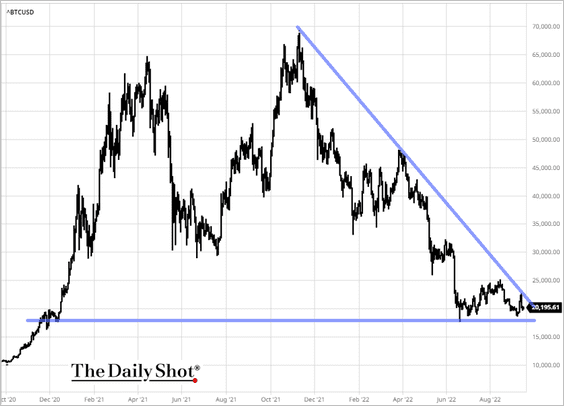 Source: barchart.com
2. The “Ethereum Merge” (a more efficient network upgrade) is attracting attention around the world.
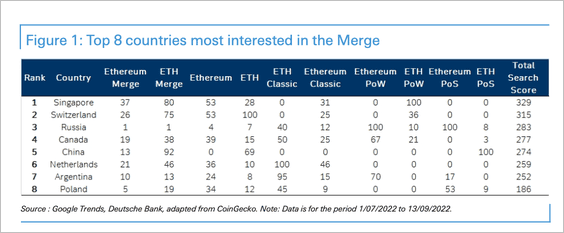 Source: Deutsche Bank Research
The correlation between the Nasdaq and Ether has weakened following the announcement of the expected date of the Merge.
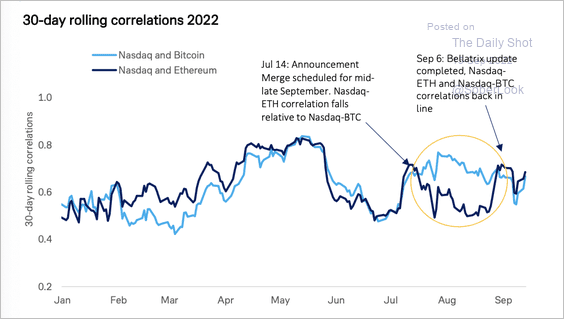 Source: Deutsche Bank Research
——————–
3. ETH has underperformed other top cryptos over the past month despite its recent spike.
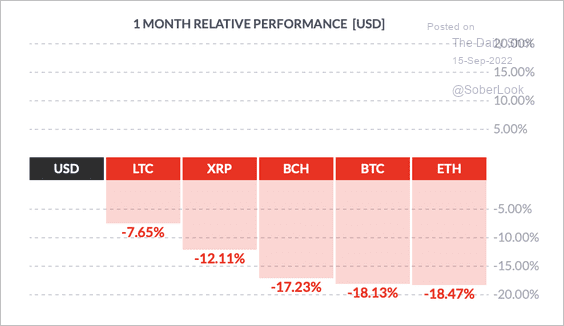 Source: FinViz
4. ETH’s put/call ratio ticked higher over the past week.
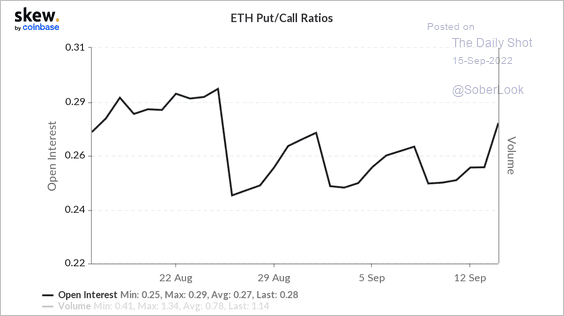 Source: Skew
Short-term implied volatility in the ETH options market is rising.
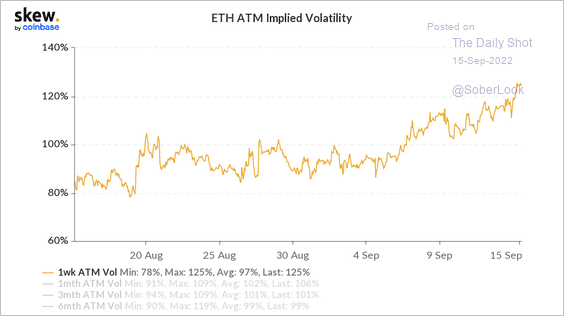 Source: Skew
Back to Index
Commodities
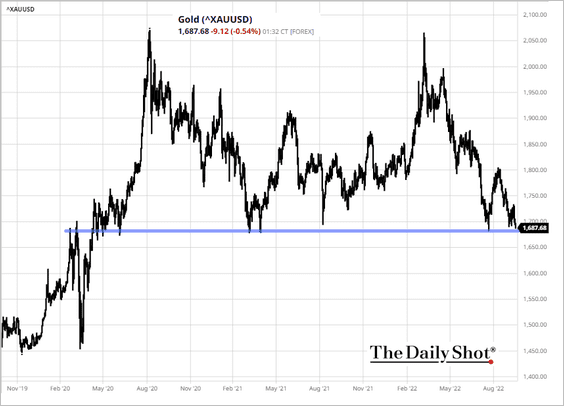
1. Gold is at support …
 Source: barchart.com
… and is vulnerable due to rising US real yields
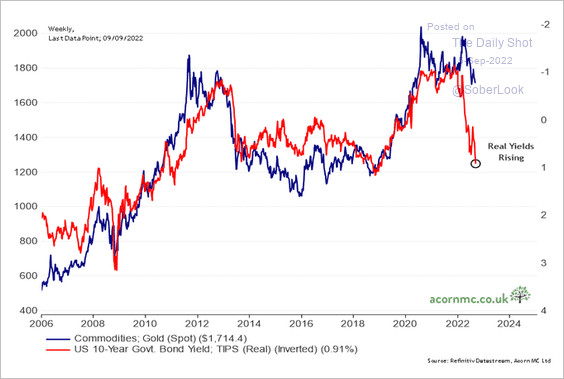 .
.
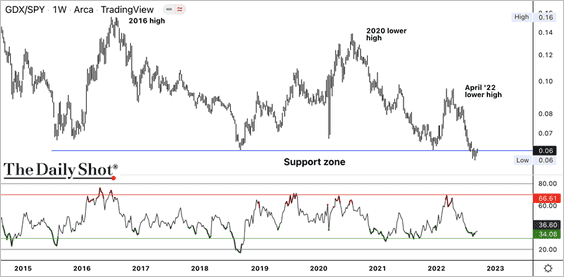
2. The VanEck Gold Miners ETF (GDX) is testing long-term support relative to the S&P 500.
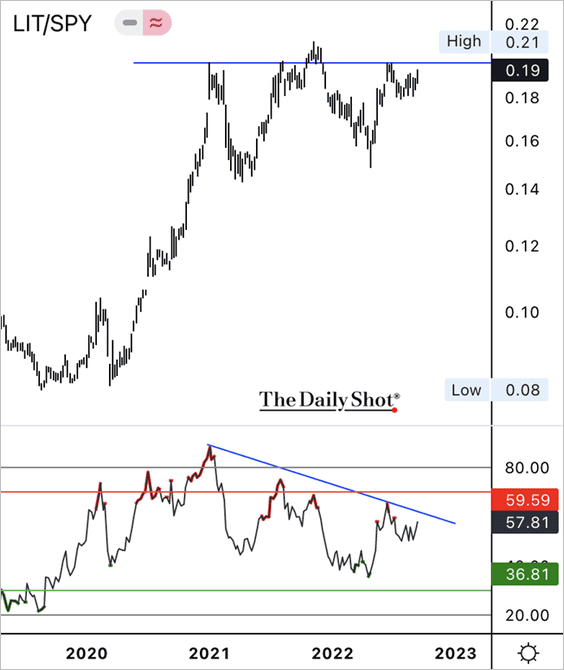
3. Will we see a breakout in the Global X Lithium ETF (LIT) relative to the S&P 500? The uptrend has lost momentum over the past year.
4. Inventories of key commodities are running below 5-year averages.
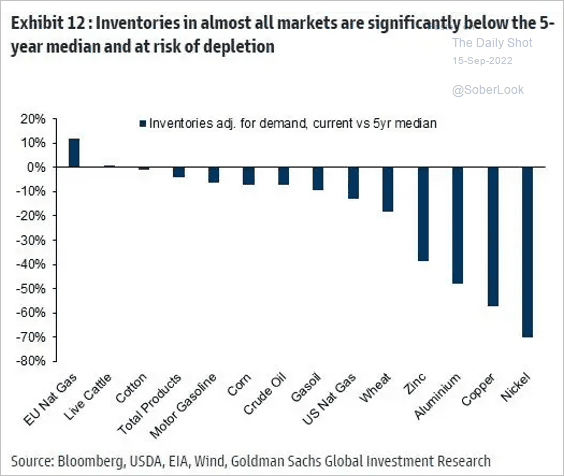 Source: Goldman Sachs; @chigrl
Back to Index
Energy
1. US gasoline demand remains soft relative to previous years (2 charts).
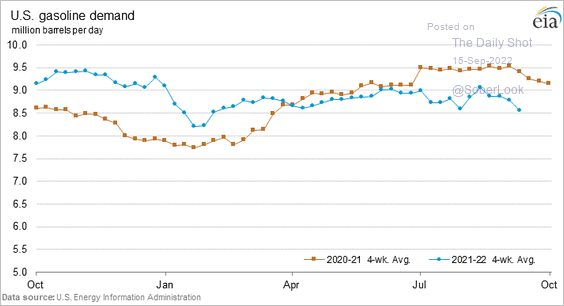
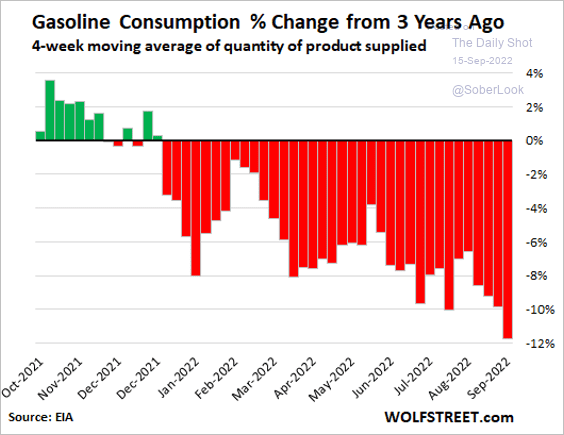 Source: @wolfofwolfst Read full article
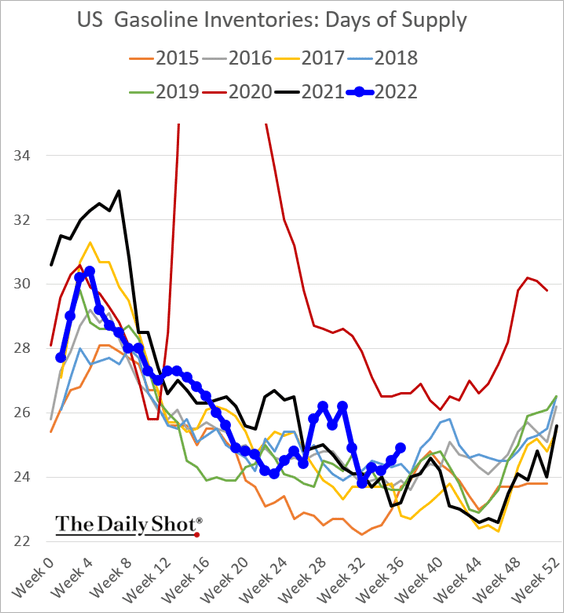
• Gasoline inventories, measured in days of supply, have been rising.
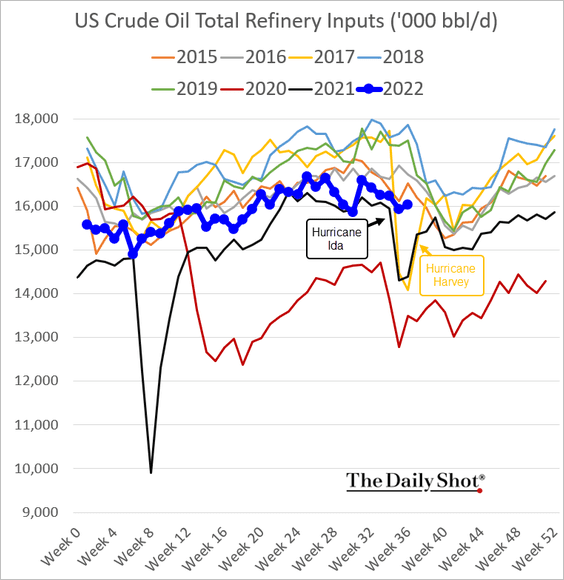
• Refinery inputs are relatively soft.
——————–
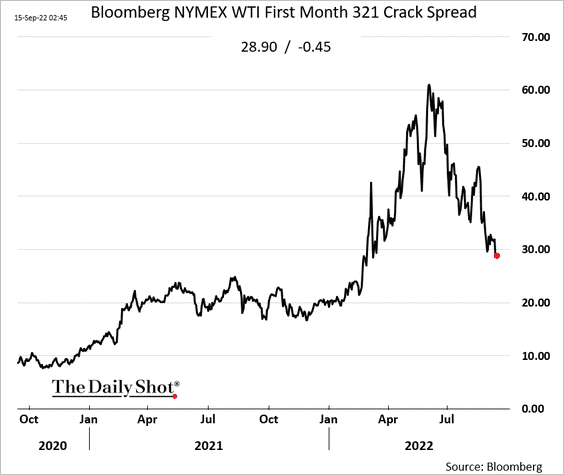
2. Crack spreads continue to ease.
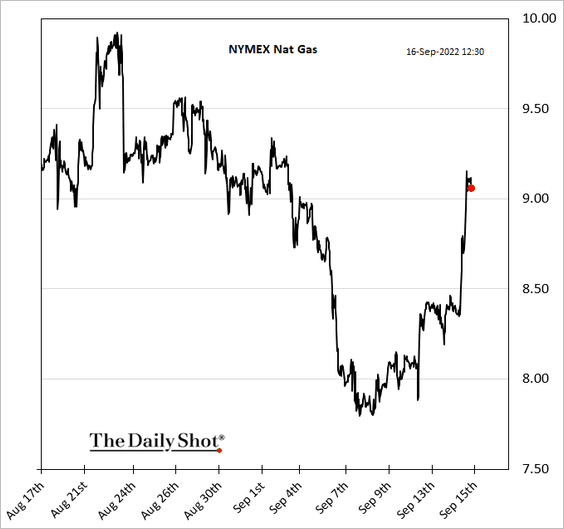
3. US natural gas prices jumped on hot weather and the looming rail strike (which could cause coal shortages at utilities).
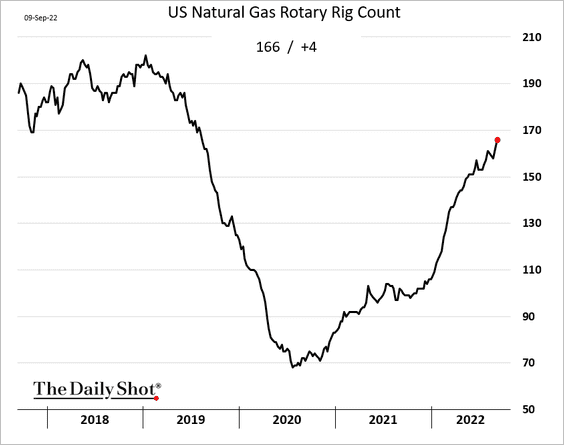
4. US natural gas rig count has been rising quickly, suggesting that production will increase.
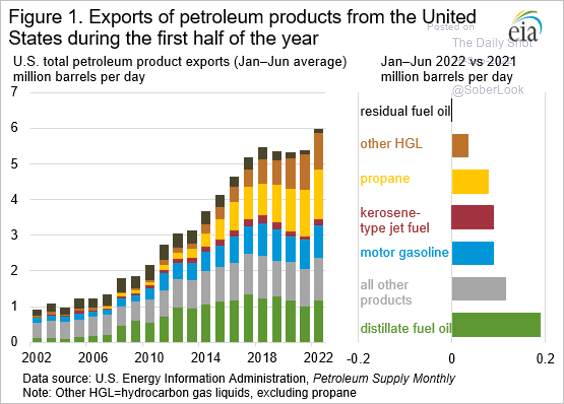
5. US petroleum products exports surged this year (HGL = hydrocarbon gas liquids such as propane, ethane, butanes, etc.).
 Source: @EIAgov
Back to Index
Equities
1. Multiple 4% one-day market declines are not common outside of recessions.
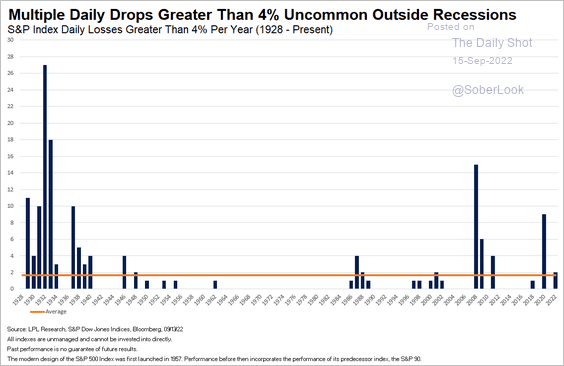 Source: LPL Research
• How does the market perform after very broad one-day declines?
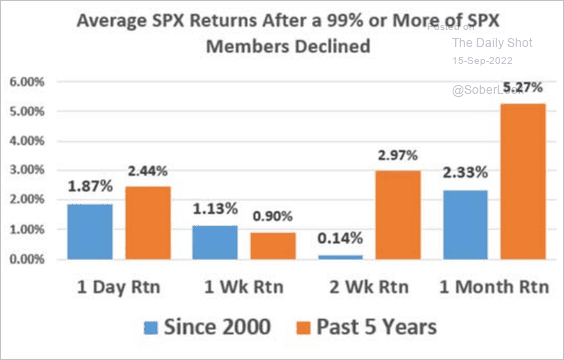 Source: Chris Murphy, Susquehanna International Group
——————–
2. Is the S&P 500 stuck in a trading range?
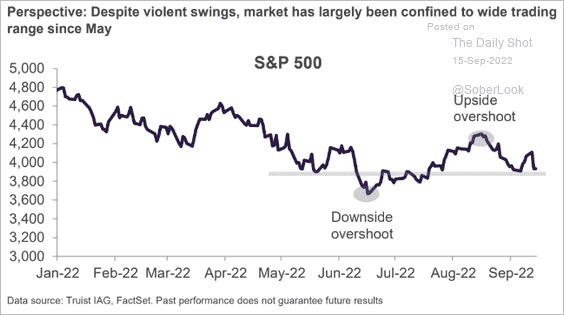 Source: Truist Advisory Services
3. Earnings estimates have been leveling off.
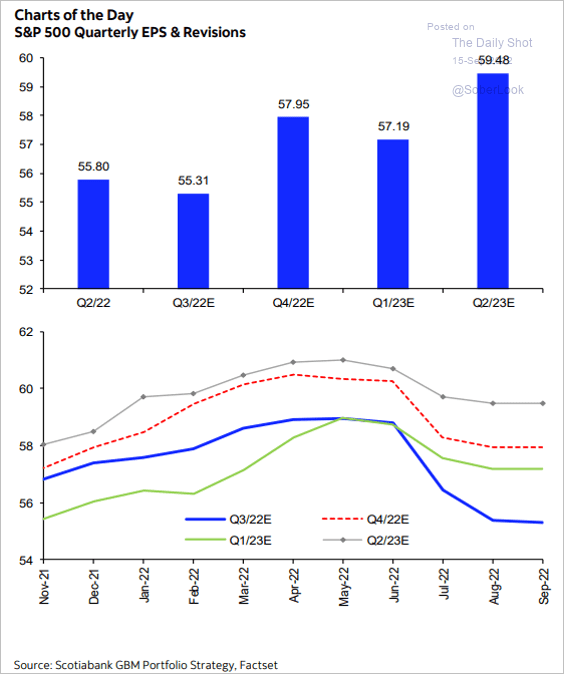 Source: Hugo Ste-Marie, Portfolio & Quantitative Strategy Global Equity Research, Scotia Capital
But investors’ profit expectations continue to deteriorate.
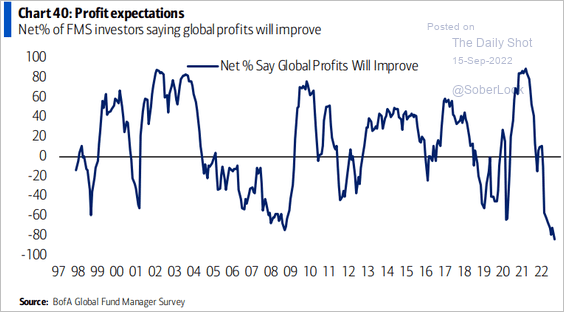 Source: BofA Global Research
——————–
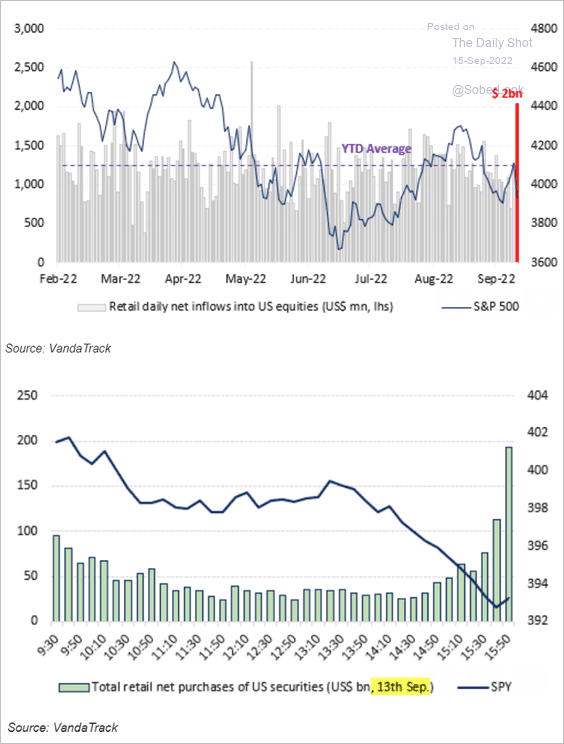
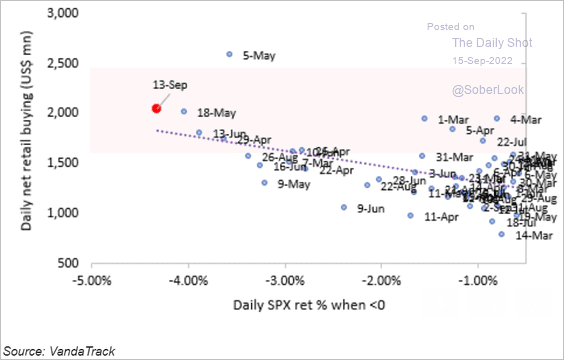
4. Retail investors took advantage of Tuesday’s market rout, …
 Source: Vanda Research
… as they continue to buy the dip.
 Source: Vanda Research
——————–
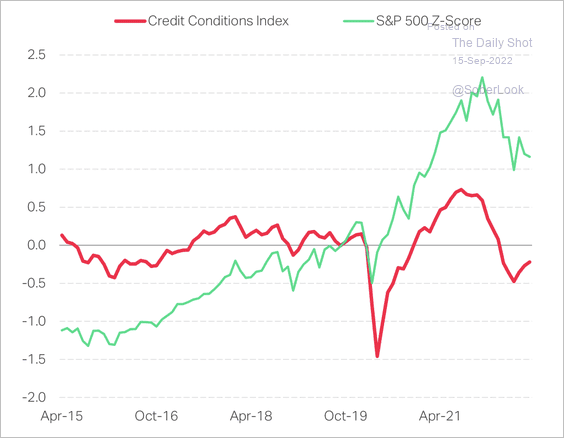
5. The improvement in credit conditions could be supportive for stocks, although risks remain, especially as data is subject to revisions.
 Source: TS Lombard
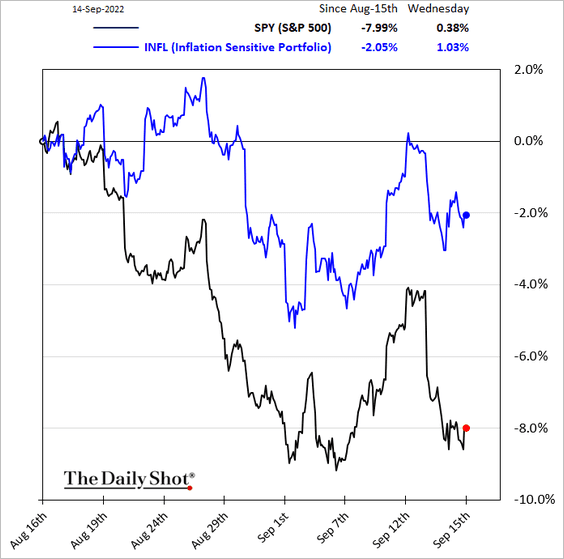
6. Stocks that tend to benefit from higher inflation have widened their outperformance in recent days.
7. Expiration Friday is coming.
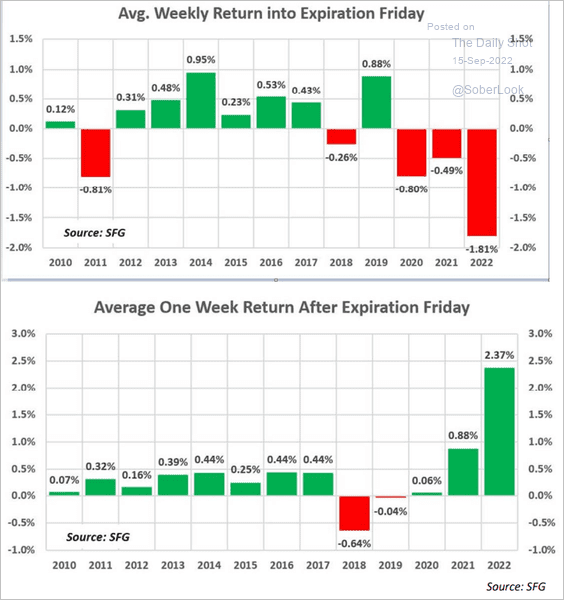 Source: Chris Murphy, Susquehanna International Group
8. Cyclical sectors’ relative valuations could fall further in a recession.
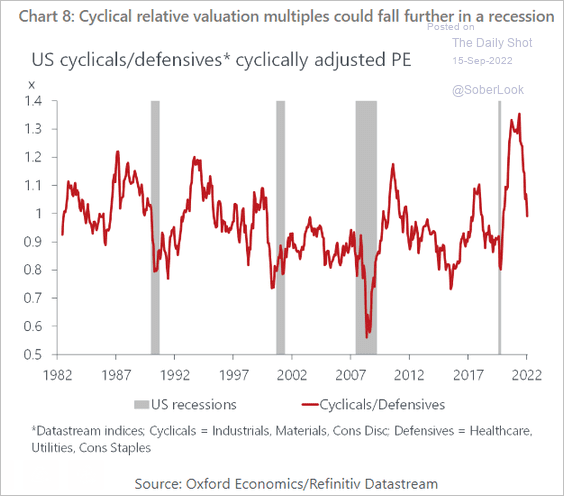 Source: Oxford Economics
Back to Index
Credit
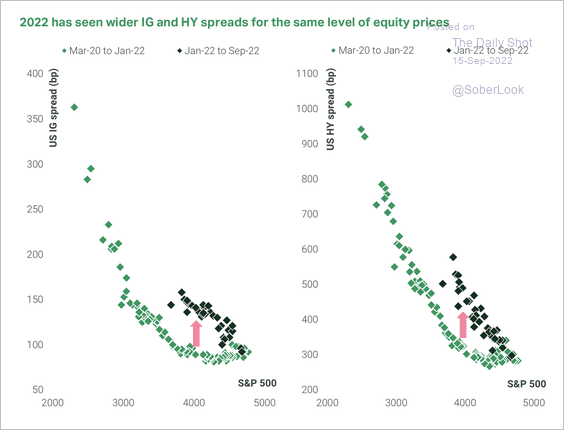
1. Credit spreads have been wider this year compared with last year for the same level of equity prices. This suggests investors get more compensation for risk in credit than equities, according to TS Lombard.
 Source: TS Lombard
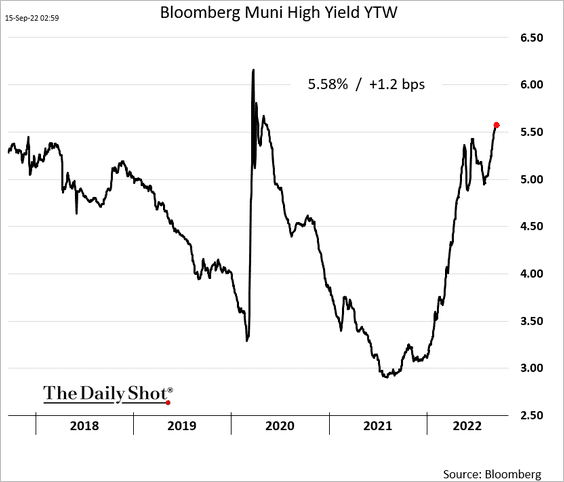
2. High-yield muni spreads continue to widen.
Back to Index
Global Developments
1. The dollar’s rally appears stretched. MRB Partners expects a currency rotation in the months ahead, once the global economy proves more resilient than investors currently anticipate.
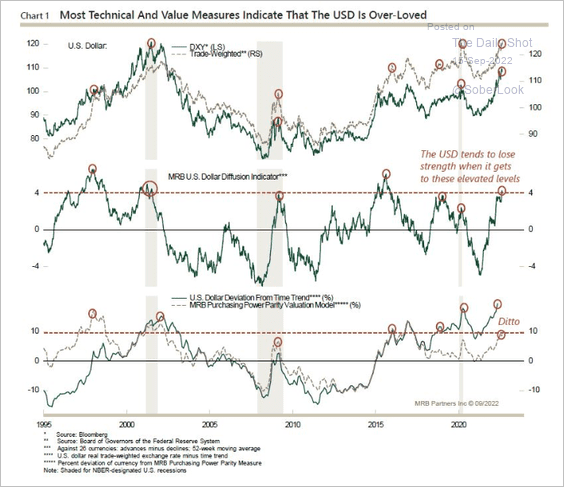 Source: MRB Partners
2. Safe-haven flows have benefitted the dollar over the past year (2 charts).
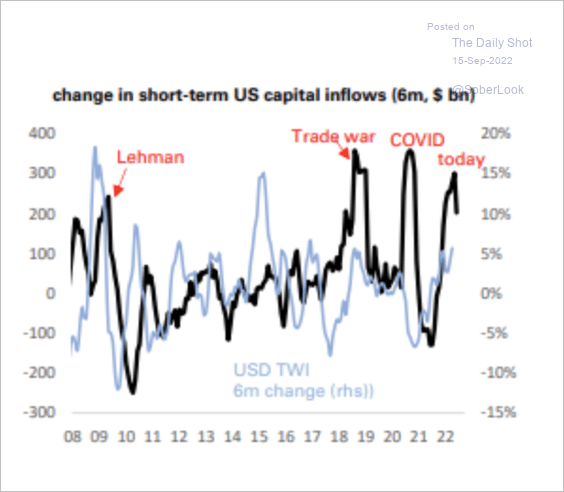 Source: Deutsche Bank Research
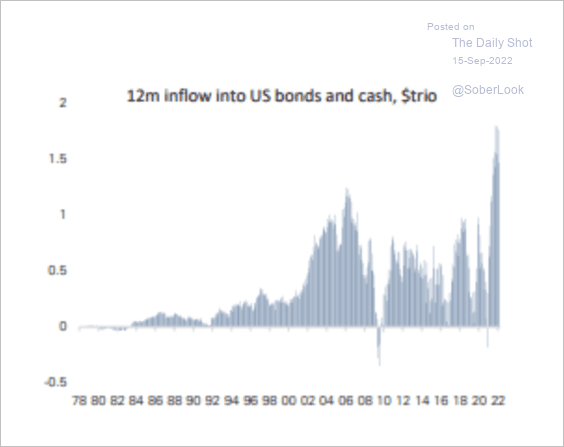 Source: Deutsche Bank Research
——————–
3. This chart shows fund managers’ allocations across asset classes and sectors.
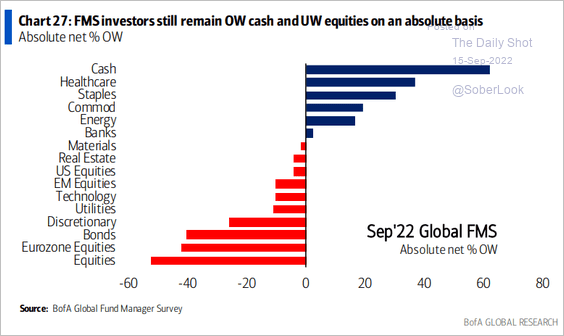 Source: BofA Global Research
4. Housing is getting repriced in some of the hottest markets.
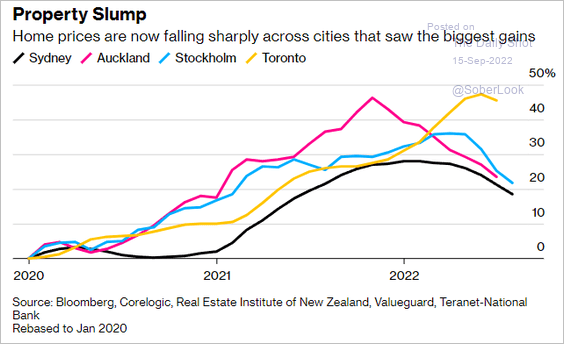 Source: Bloomberg Read full article
5. The OECD leading indicator continues to fall.
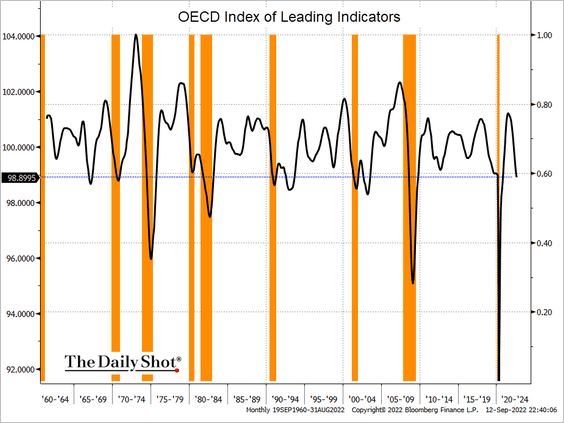 Source: @TheTerminal, Bloomberg Finance L.P.
——————–
Food for Thought
1. Share of unpaid taxes:
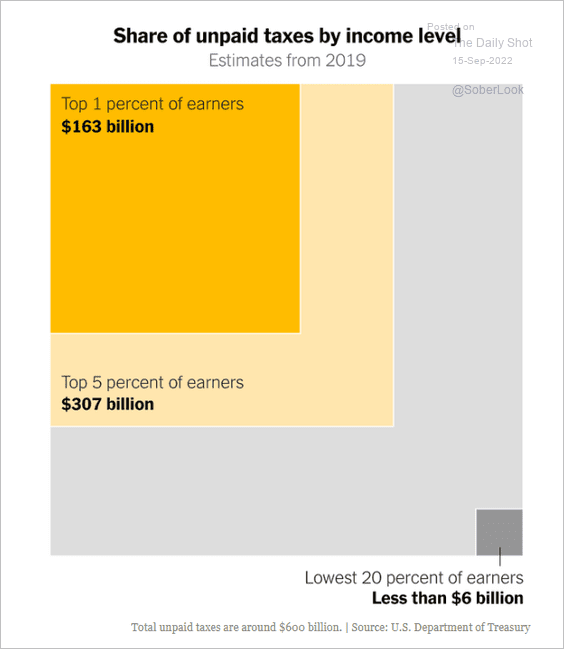 Source: The New York Times Read full article
2. Union petitions:
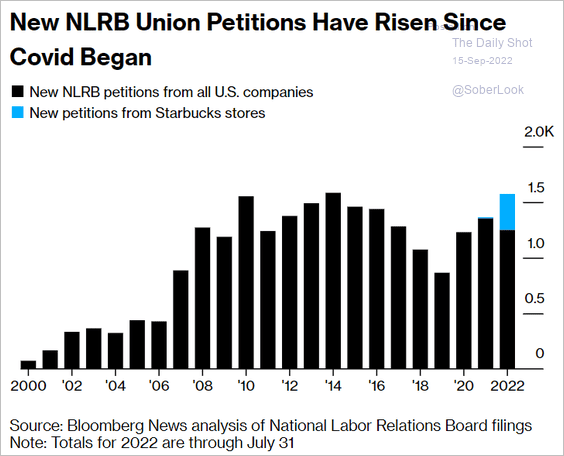 Source: Bloomberg Read full article Further reading
3. Job offers in the US:
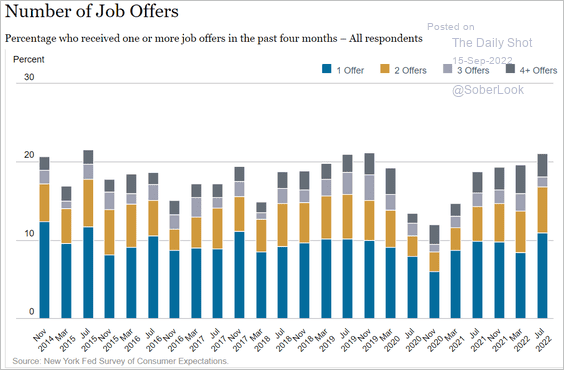 Source: Federal Reserve Bank of New York
4. Contributions and spending in Senate races:
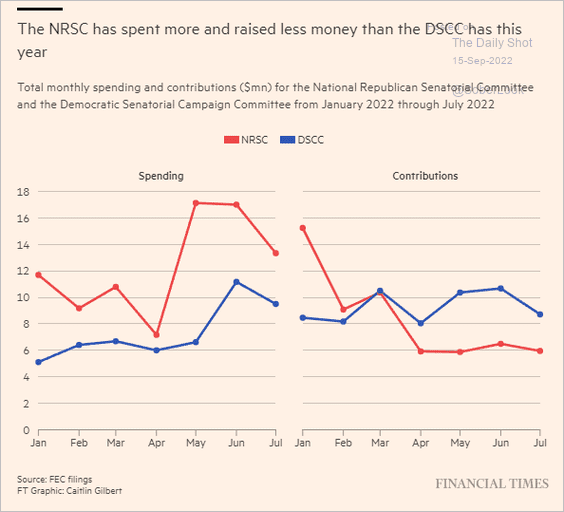 Source: @financialtimes Read full article
5. Slowing software sales:
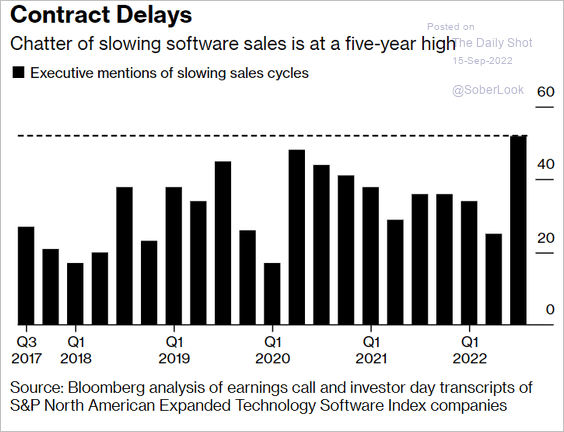 Source: Bloomberg Read full article
6. Lithium demand:
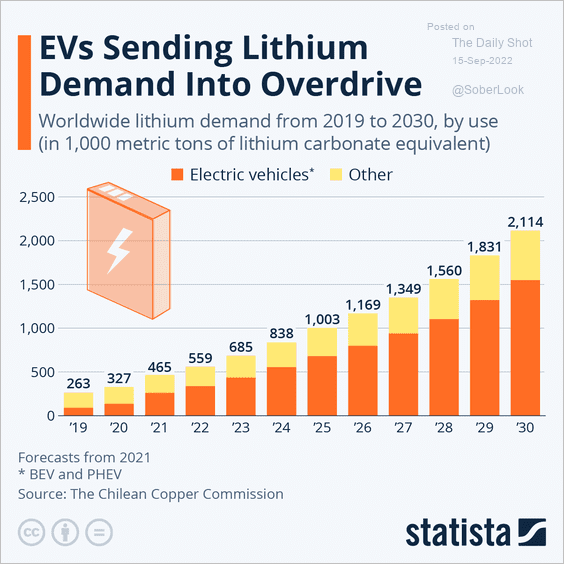 Source: Statista
7. California’s wine-grape harvest:
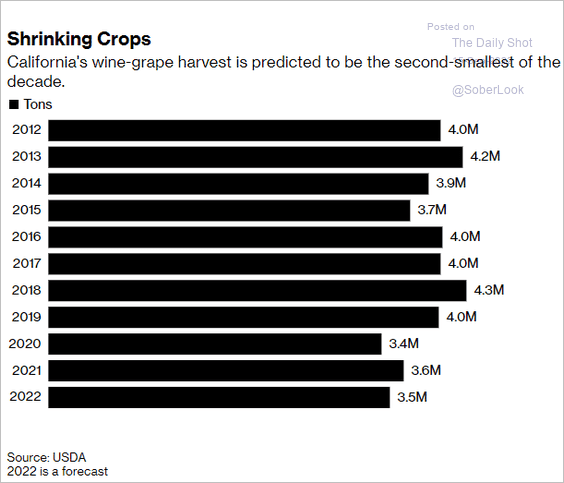 Source: @luxury Read full article
8. Popularity of different sports in the US:
 Source: Statista
——————–
Back to Index