
The Daily Shot: 02-Nov-22
• The United States
• Canada
• The United Kingdom
• The Eurozone
• Japan
• Asia – Pacific
• China
• Emerging Markets
• Commodities
• Energy
• Equities
• Credit
• Rates
• Global Developments
• Food for Thought
The United States
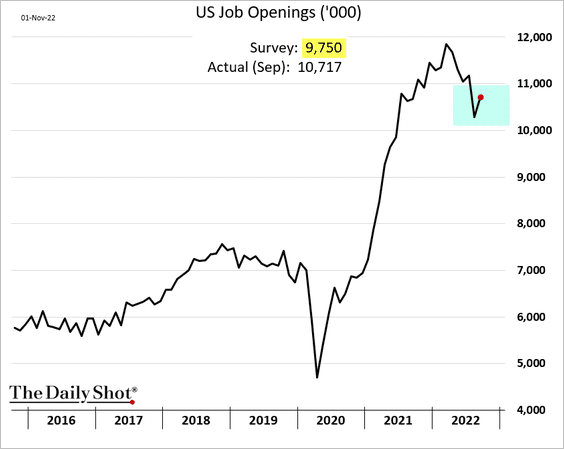
1. Job openings unexpectedly increased in September, pointing to persistent strength in the labor market.
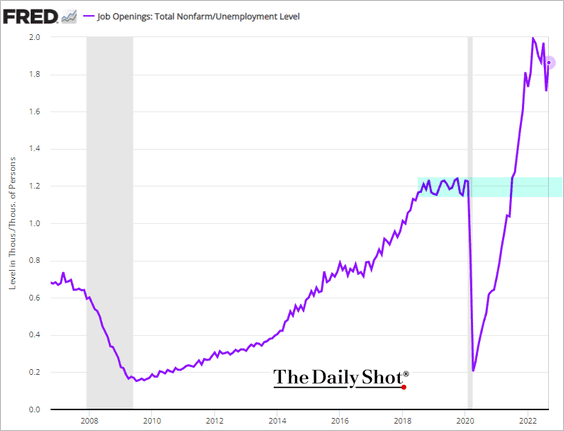
The Fed would like to see the openings-to-unemployment ratio closer to pre-COVID levels, but it’s not budging for now. This does not look like a signal to “pivot.”
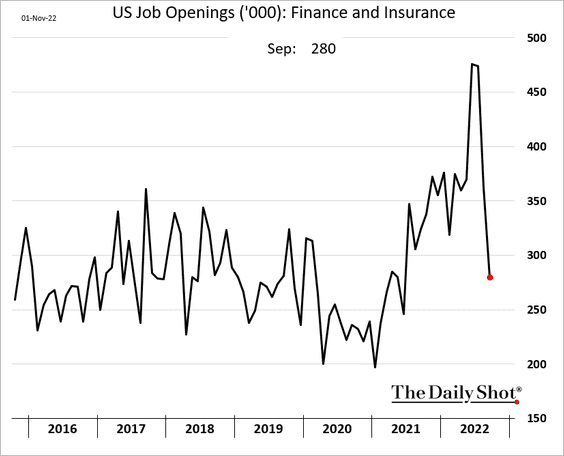
• Deteriorating mortgage activity sent labor demand in “finance and insurance” lower, …
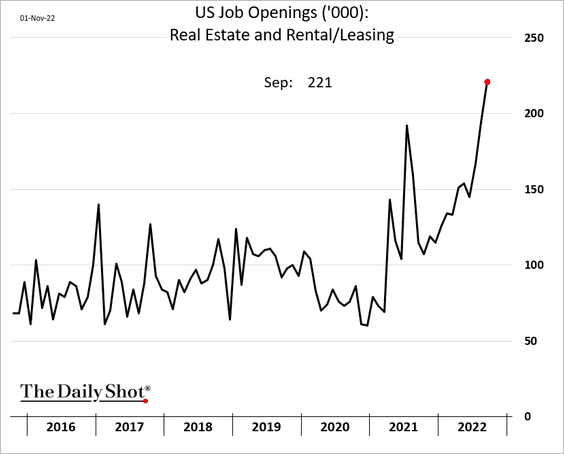
… but real estate rental and leasing vacancies have been surging.
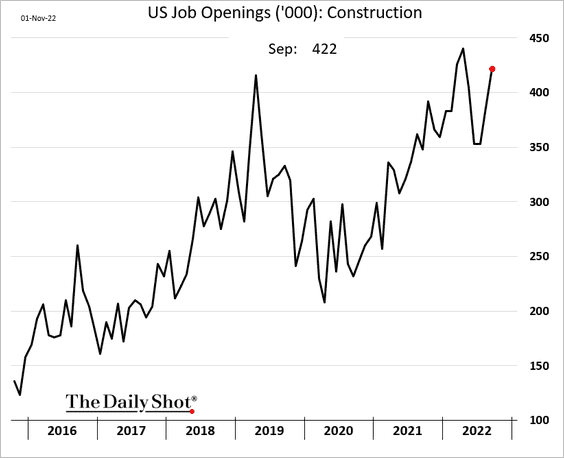
Moreover, construction openings unexpectedly increased in September.
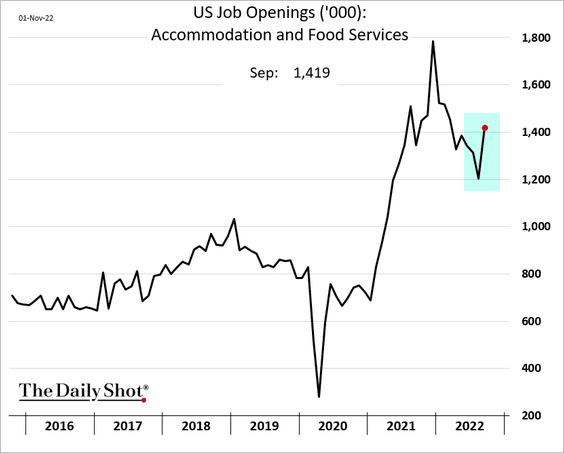
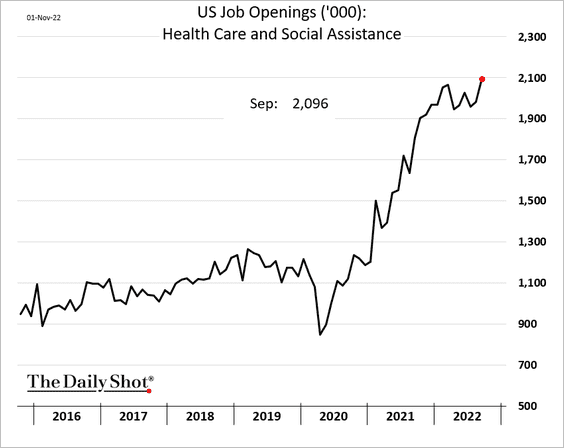
Here are some additional job openings trends.
– Hotels and restaurants:
– Logistics:
![]()
– Healthcare:
——————–
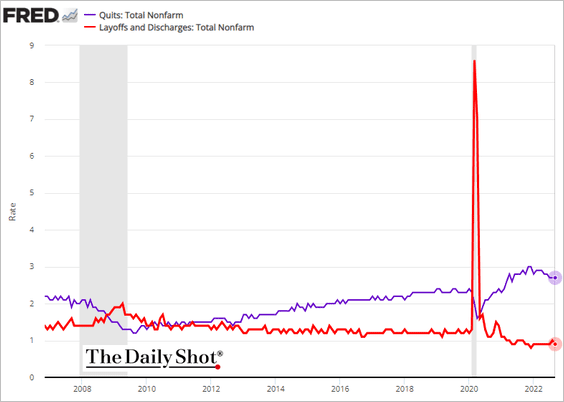
• Layoffs remain extremely low (red line).
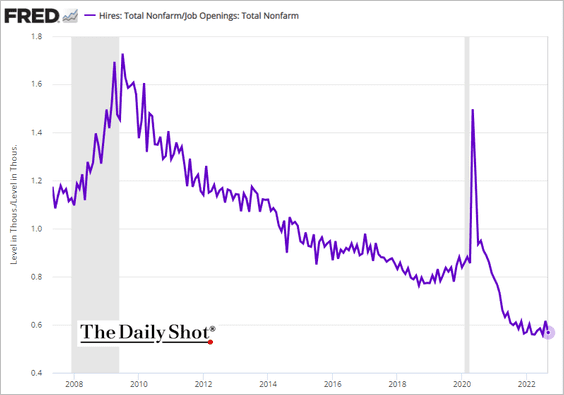
• Below is the hires-to-openings ratio.
• The Beveridge curve illustrates the imbalances in the labor market.
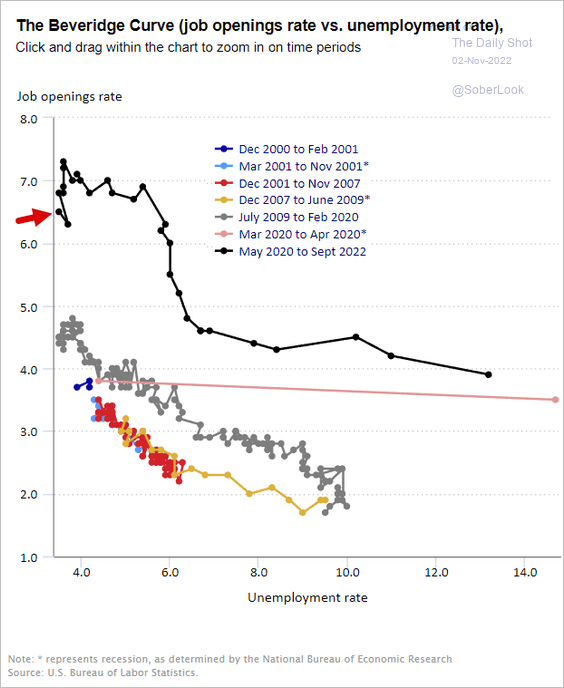 Source: BLS
——————–
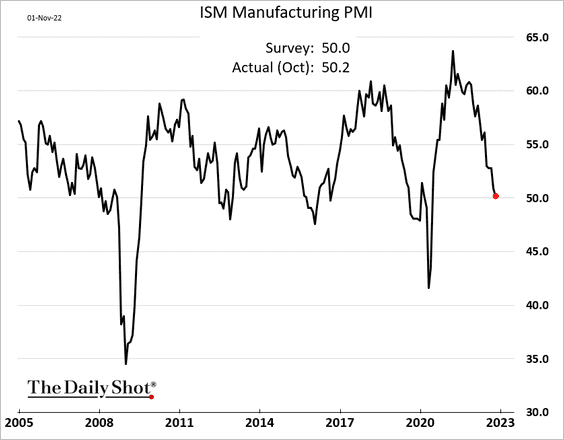
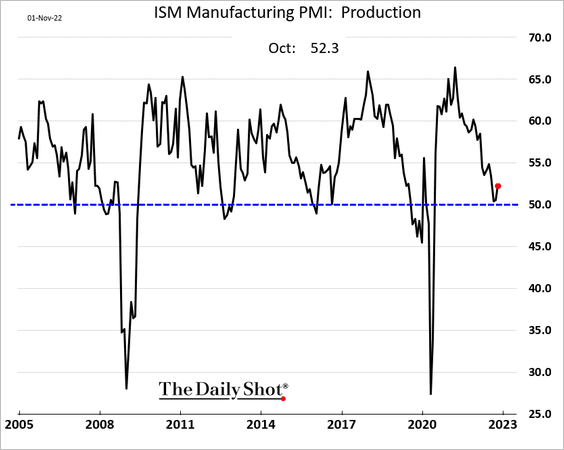
2. The ISM Manufacturing PMI declined again in October but held above 50 (indicating modest growth).
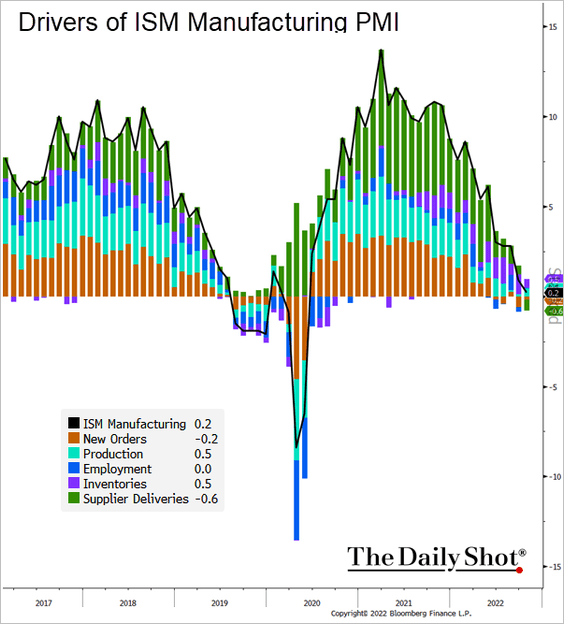
Here are the contributions to the PMI index.
 Source: @TheTerminal, Bloomberg Finance L.P.
• Manufacturing production is growing again.
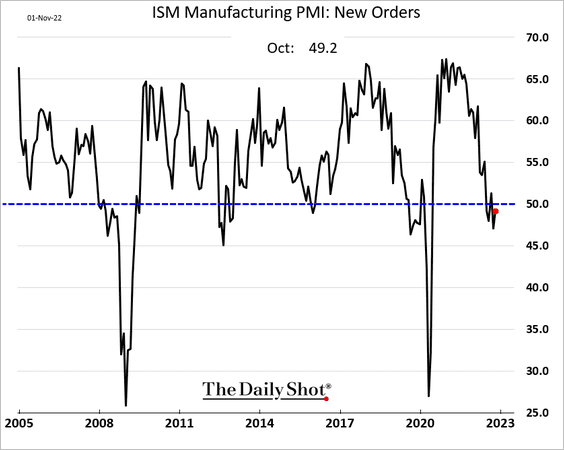
• New orders are still in contraction territory, but not by much.
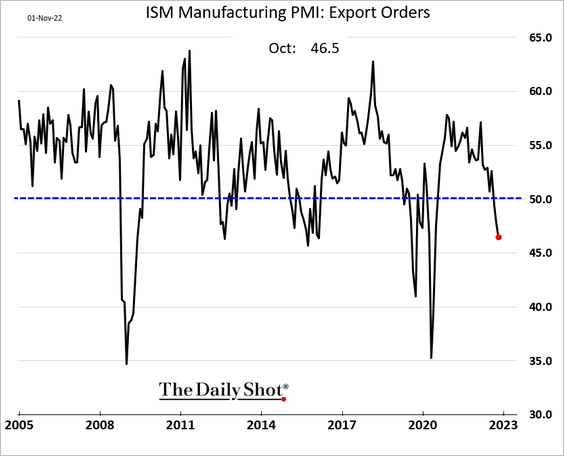
The decline in export orders accelerated, partially driven by the US dollar strength.
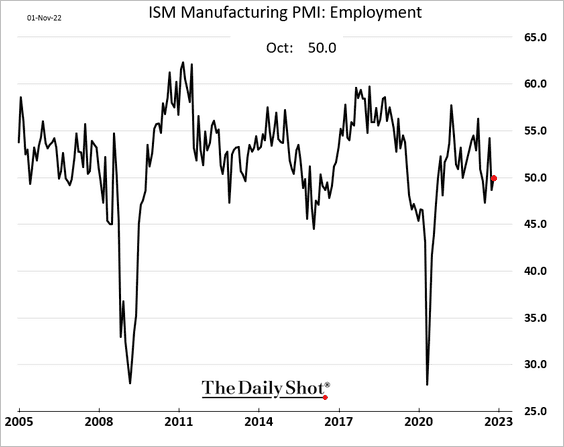
• The employment index is holding at 50 (no change).
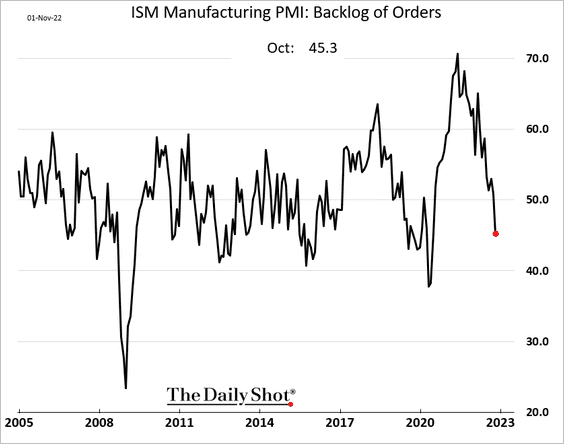
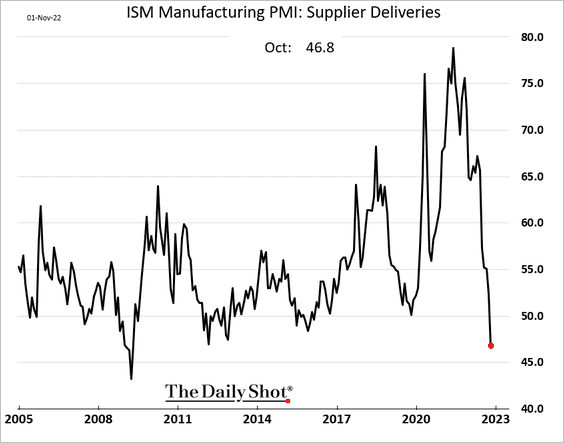
• Supply stresses are gone.
– Order backlogs (now declining):
– Supplier delivery times (also declining):
• Input prices are now falling, surprising to the downside.
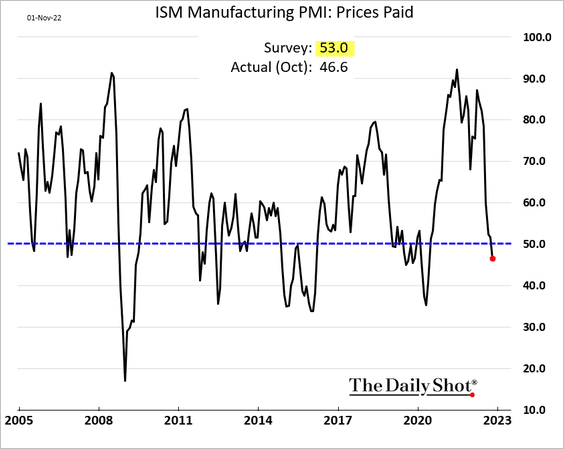
That’s good news for consumer inflation.
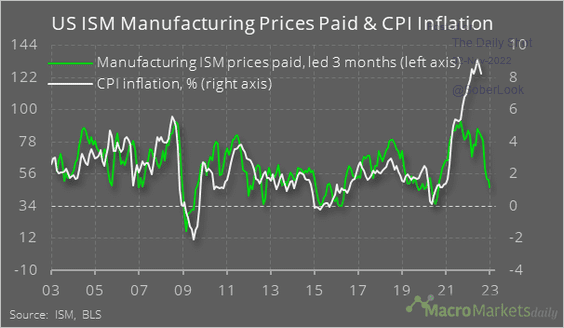 Source: @macro_daily
——————–
3. US vehicle sales picked up in October.
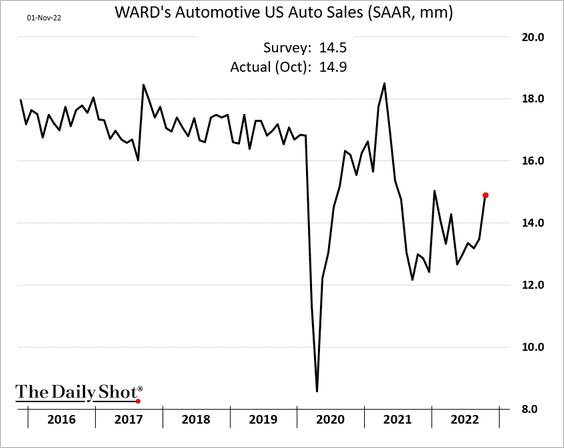
As prices moderate.
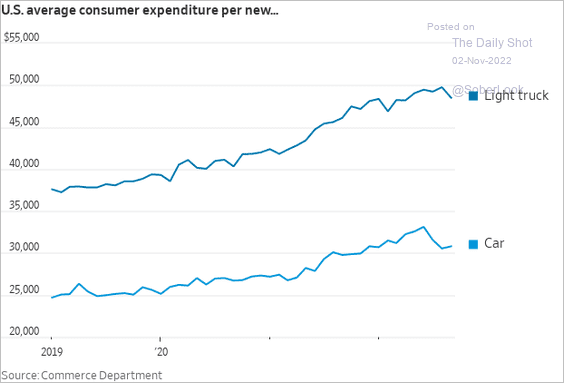 Source: @WSJ Read full article
Used car prices are in deflation territory.
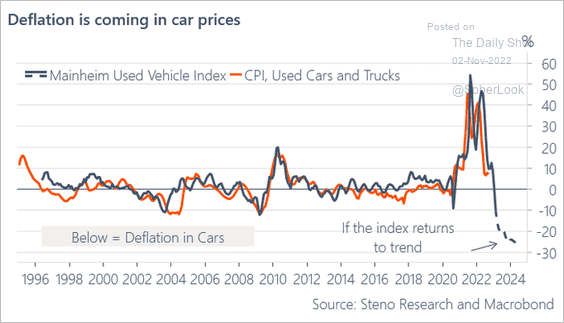 Source: @AndreasSteno
——————–
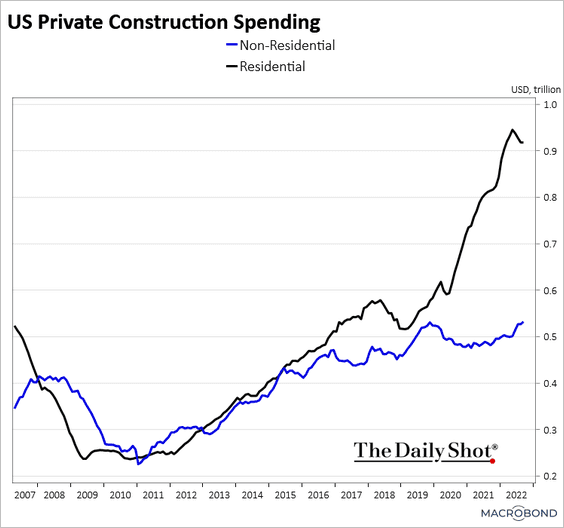
4. Construction spending unexpectedly increased in September.
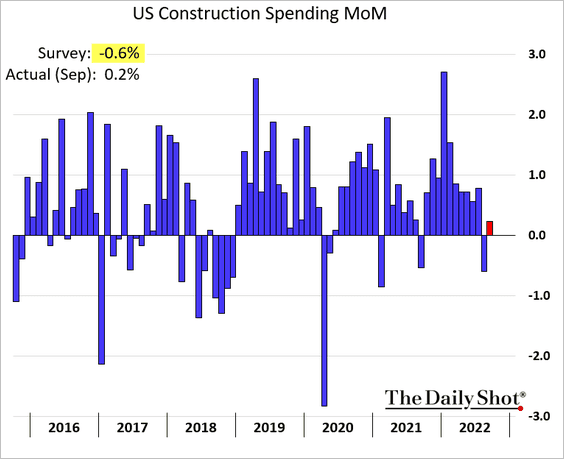
Residential spending stabilized, while non-residential expenditures are trending higher.
 Source: Chart and data provided by Macrobond
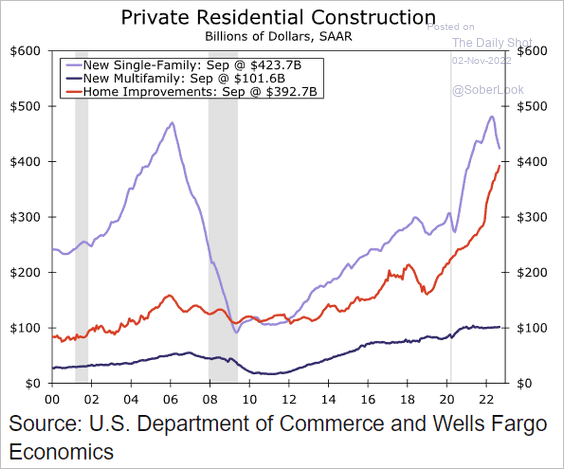
Here is the breakdown of residential spending (fueled in part by excess savings).
 Source: Wells Fargo Securities
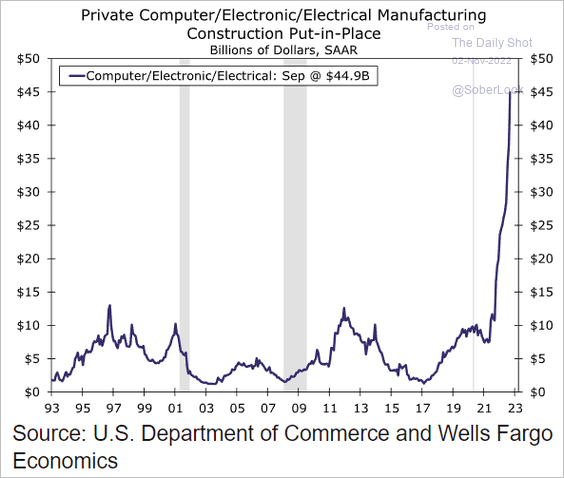
Construction spending on electronics manufacturing facilities has been surging amid reshoring efforts.
 Source: Wells Fargo Securities
——————–
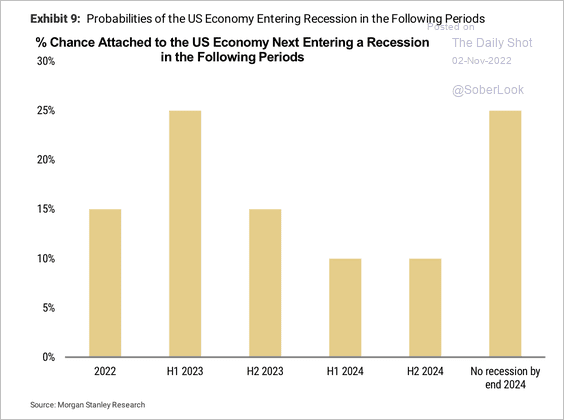
5. Here are some recession probabilities from Morgan Stanley.
 Source: Morgan Stanley Research
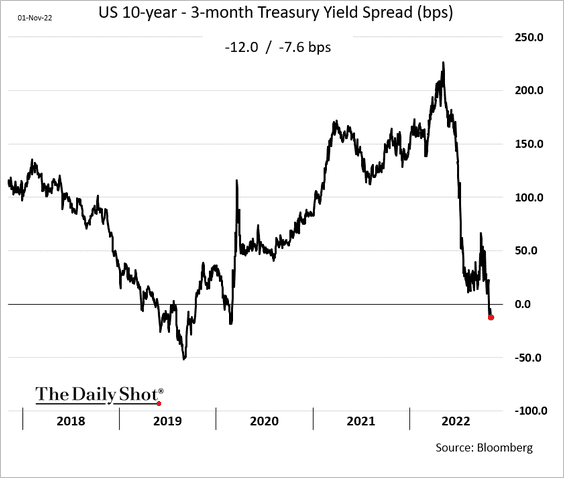
The 3-month/10-year portion of the Treasury curve remains inverted.
The short end of the curve is now also inverted.
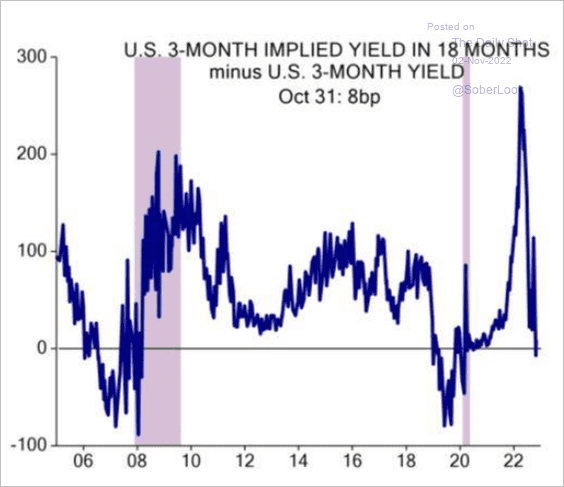 Source: Evercore ISI Research
Back to Index
Canada
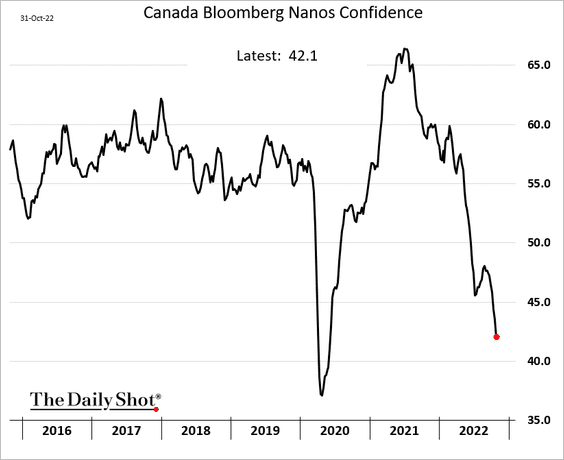
1. Consumer confidence continues to plunge.
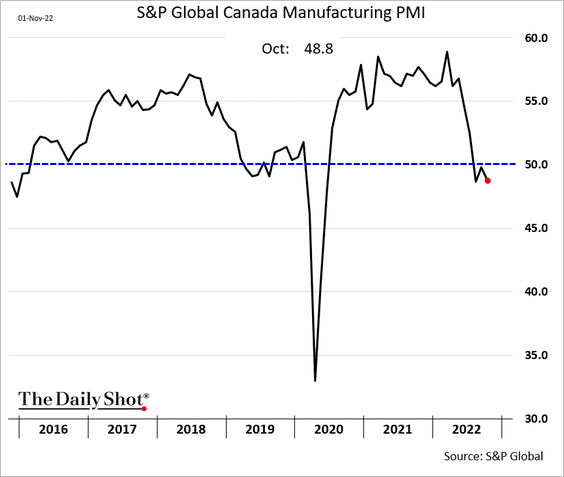
2. The October PMI report showed factory activity still in contraction territory.
3. Here is home price appreciation vs. disposable income for the US and Canada.
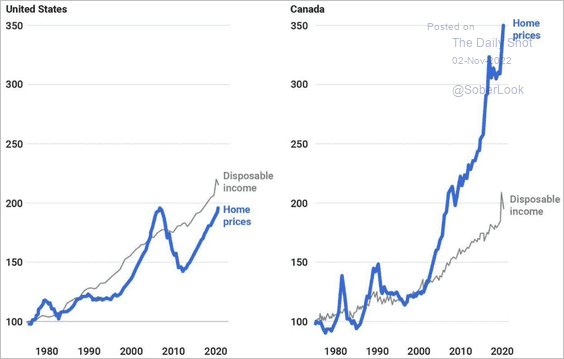 Source: @MPelletierCIO
Back to Index
The United Kingdom
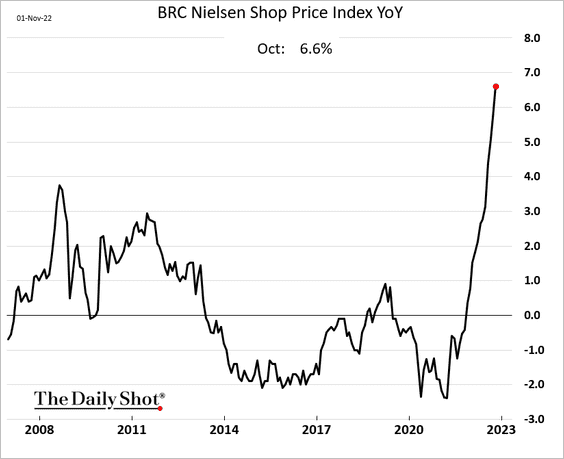
1. Prices charged by shops continue to surge.
 Source: Bloomberg Read full article
——————–
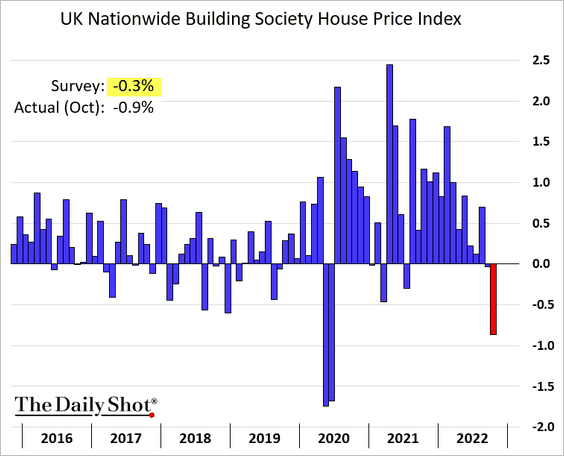
2. Home prices tumbled in October.
 Source: Reuters Read full article
——————–
3. The UK manufacturing sector is in recession territory.
 Source: Reuters Read full article
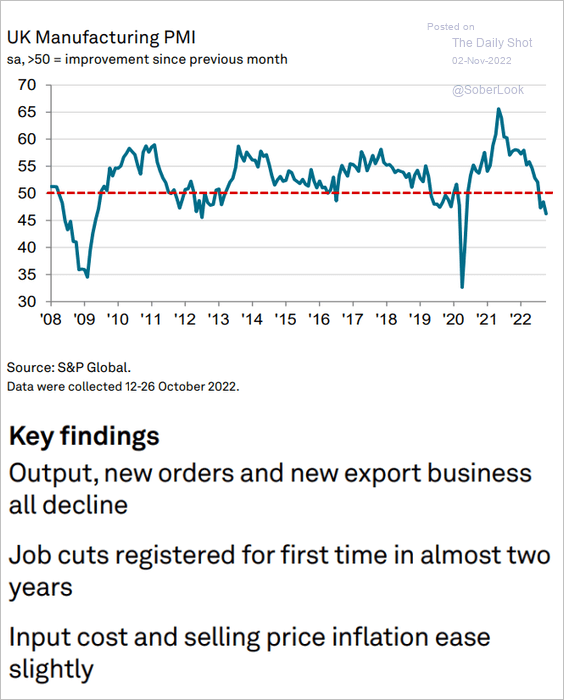 Source: S&P Global PMI
——————–
4. UK real yields are still too low compared with other major economies.
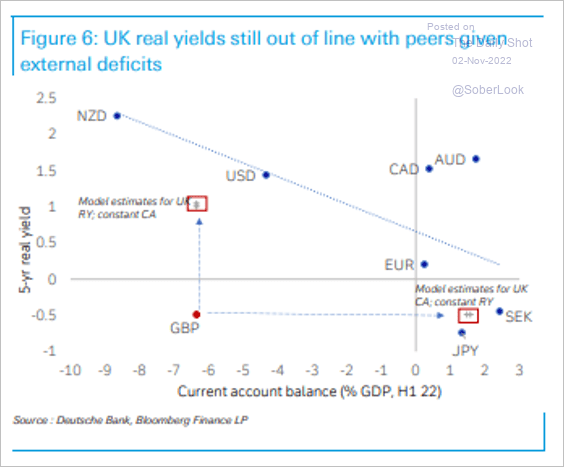 Source: Deutsche Bank Research
Back to Index
The Eurozone
1. The ECB rate is approaching restrictive territory
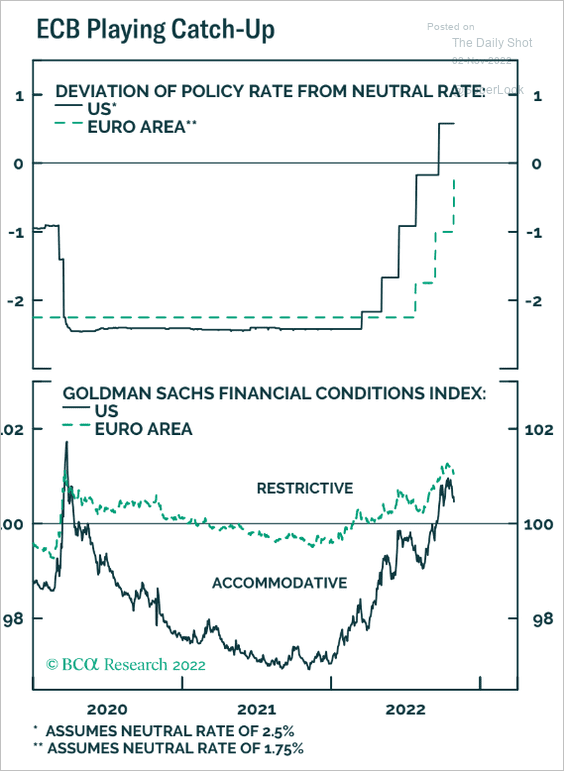 Source: BCA Research
2. Surveys point to a deterioration in euro-area exports.
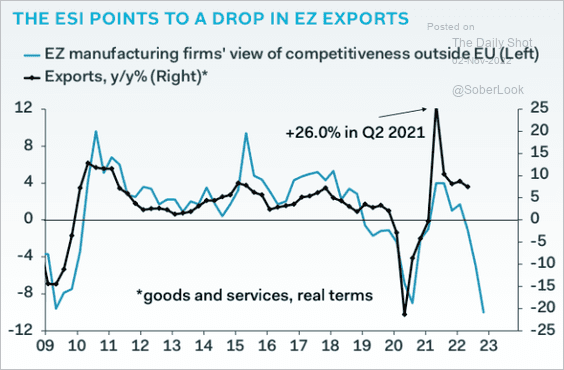 Source: Pantheon Macroeconomics
3. Real wages have been falling.
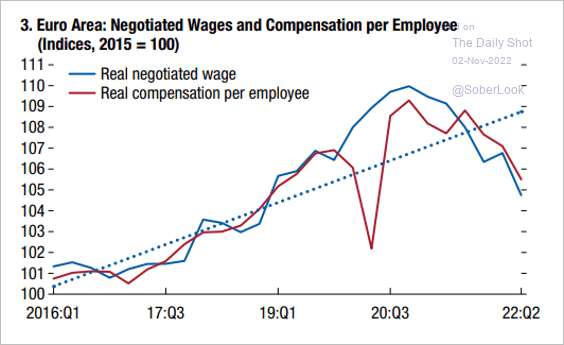 Source: IMF Read full article
4. The ECB’s survey of forecasters points to a prolonged recession.
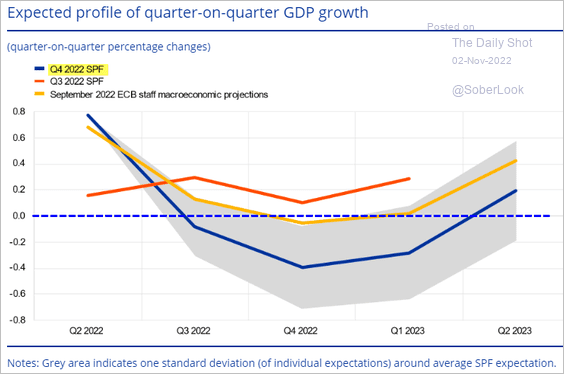 Source: ECB Read full article
5. The ECB’s €4.5 trillion of reserves will become increasingly expensive for the Eurosystem as rates climb.
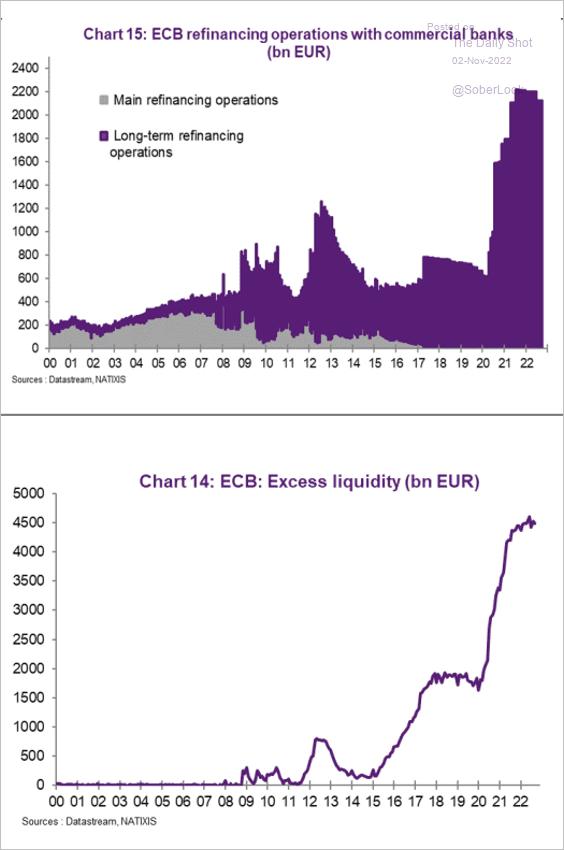 Source: Natixis
Back to Index
Japan
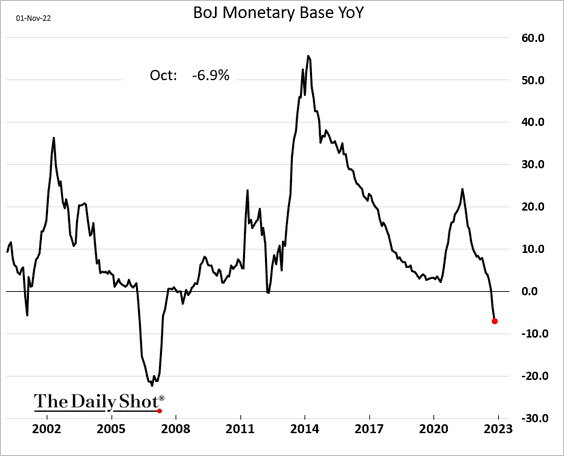
1. The monetary base is now down vs. last year.
2. Headline CPI is expected to slow over the next two years.
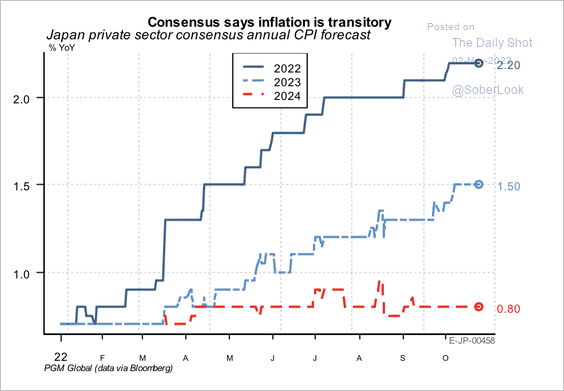 Source: PGM Global
3. The output gap is still negative, a persistent drag on inflation.
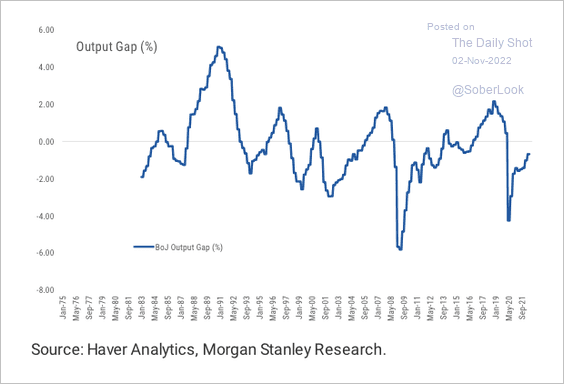 Source: Morgan Stanley Research
4. Short-term interest rate markets are pricing the overnight rate at five basis points by next April’s policy meeting. Will the BoJ signal the end of negative rates?
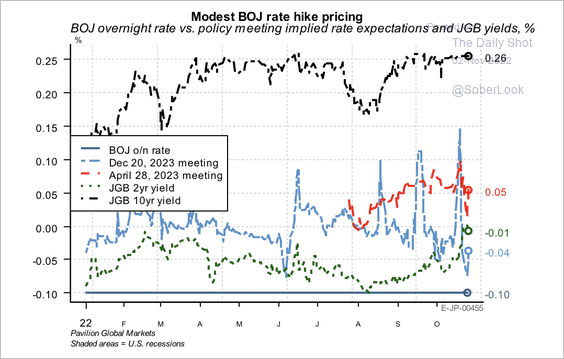 Source: PGM Global
Back to Index
Asia – Pacific
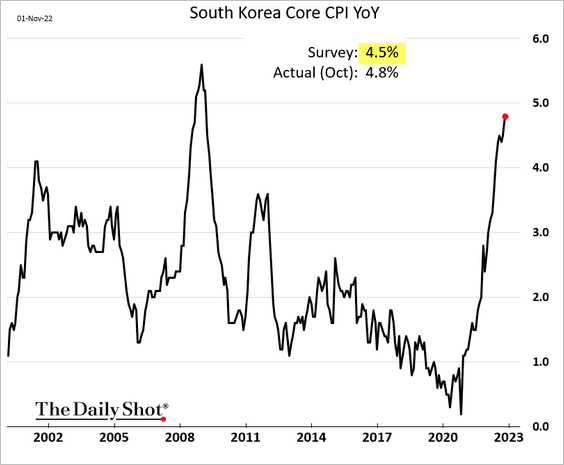
1. South Korea’s core CPI surprised to the upside.
But rental prices have been declining.
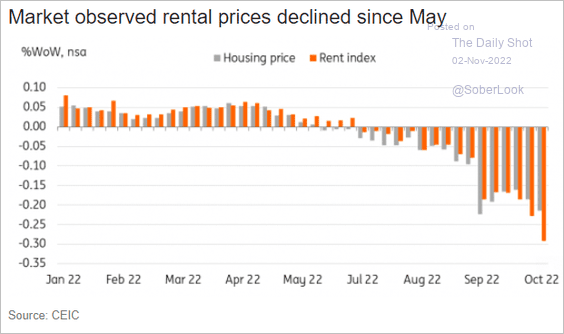 Source: ING
——————–
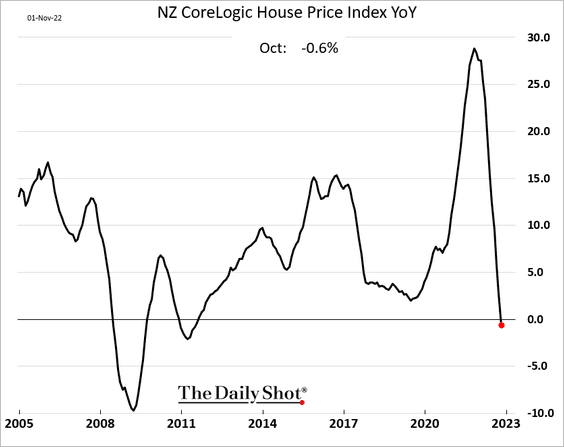
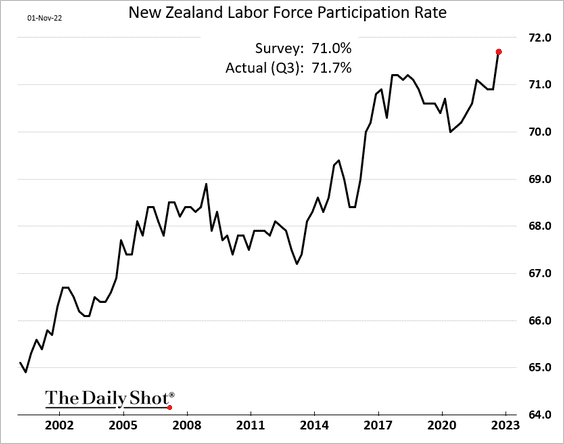
2. Next, we have some updates on New Zealand.
• Home prices are now down vs. a year ago.
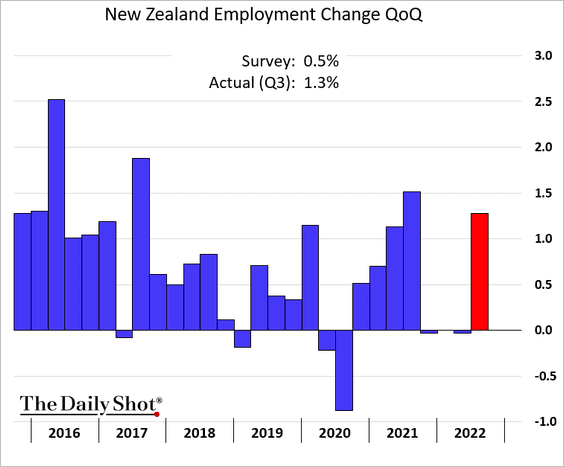
• Employment surprised to the upside last quarter.
– Wages are surging.
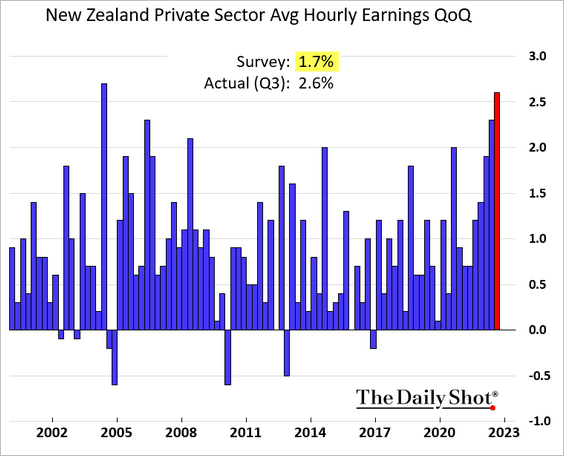
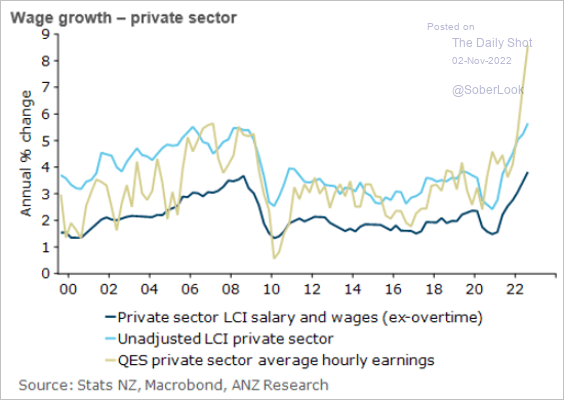 Source: @ANZ_Research
– The participation rate hit a new high.
——————–
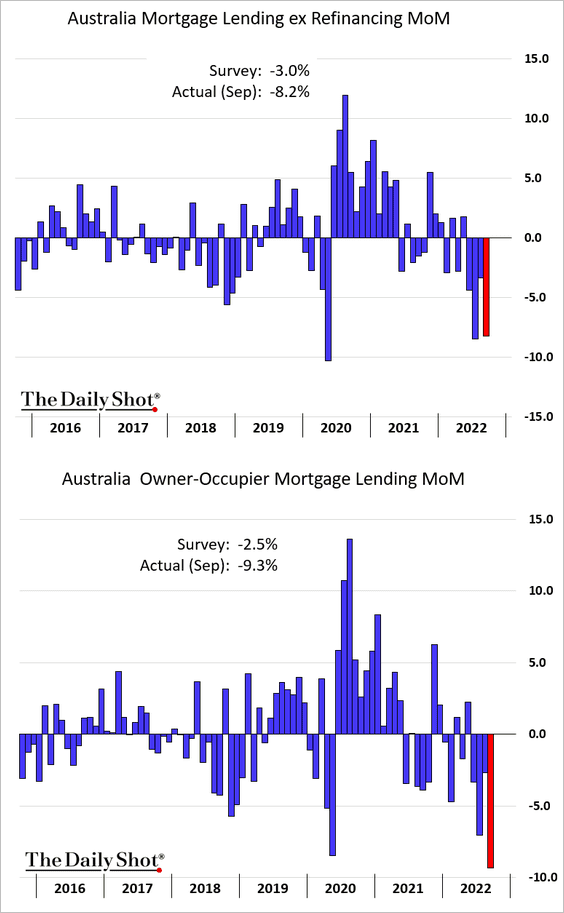
3. Australian mortgage lending declined much more than expected in September.
 Source: @ANZ_Research
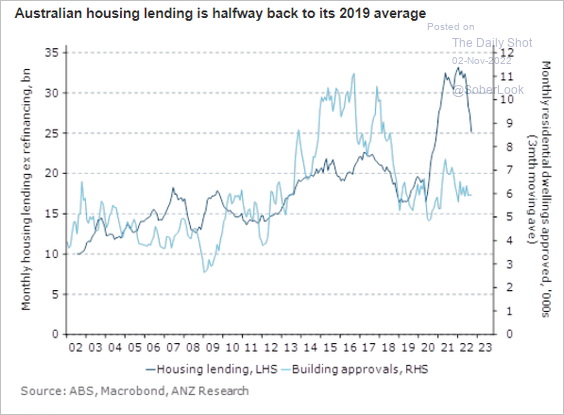
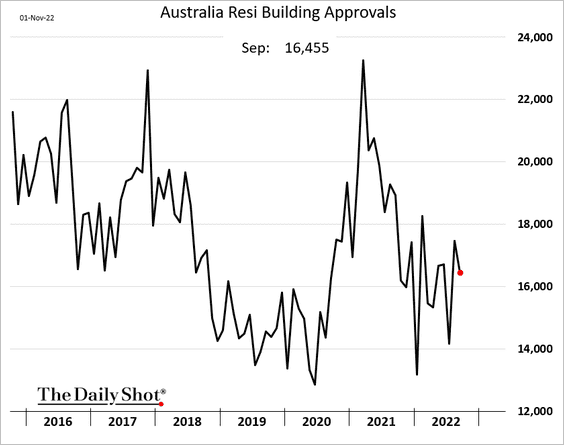
But building approvals remain stable.
Back to Index
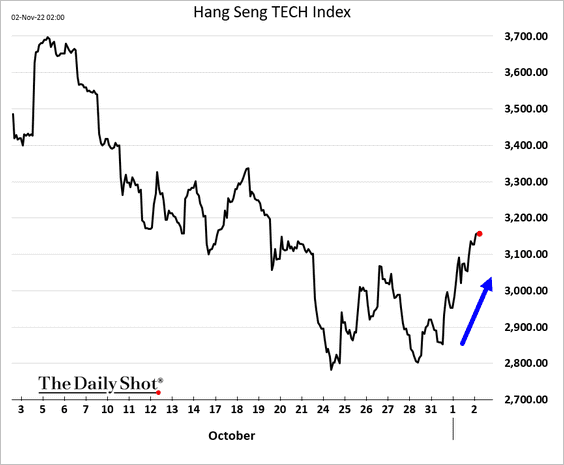
China
1. Stocks are rising on rumors of reopening plans.
2. Some pension funds are allocating away from China.
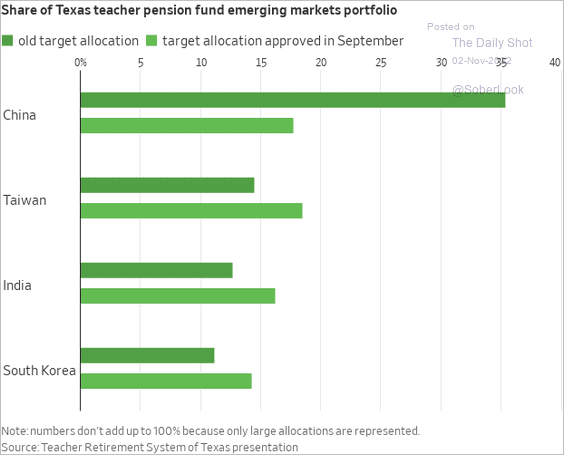 Source: @WSJ Read full article
3. M&A activity has been strong.
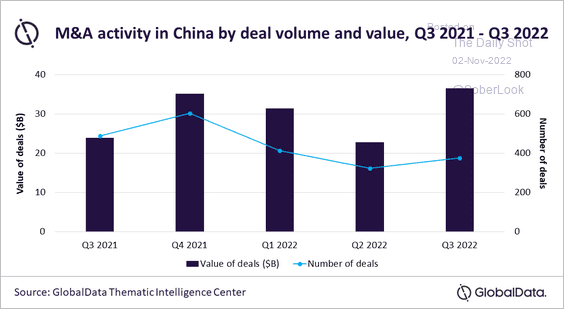 Source: GlobalData
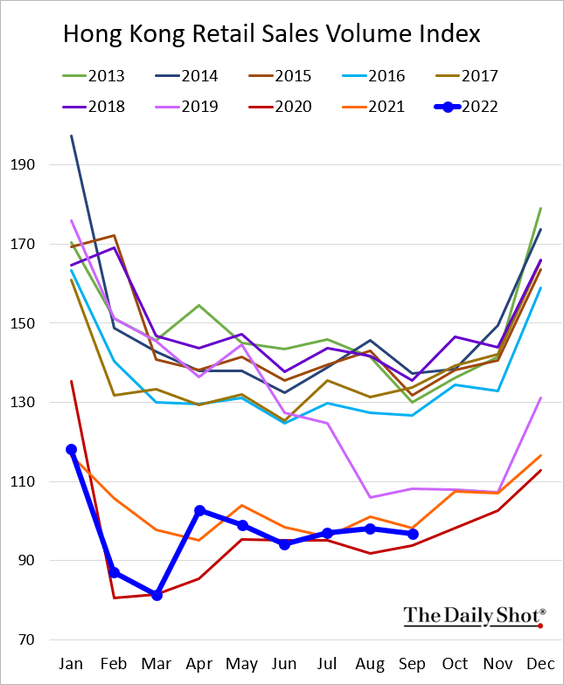
4. Hong Kong’s retail sales remain depressed.
Back to Index
Emerging Markets
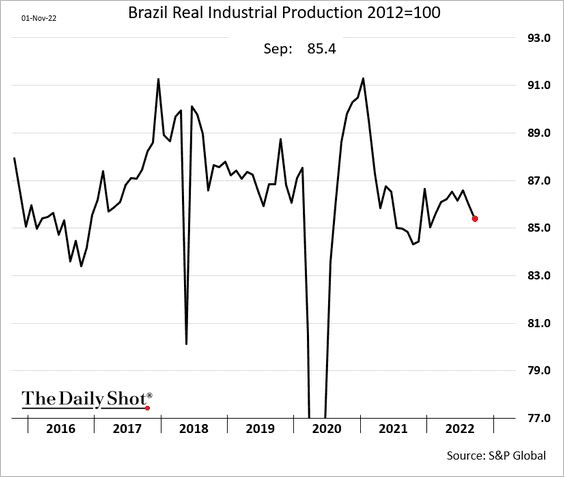
1. Brazil’s industrial production declined in September.
The PMI report shows stalling growth in manufacturing.
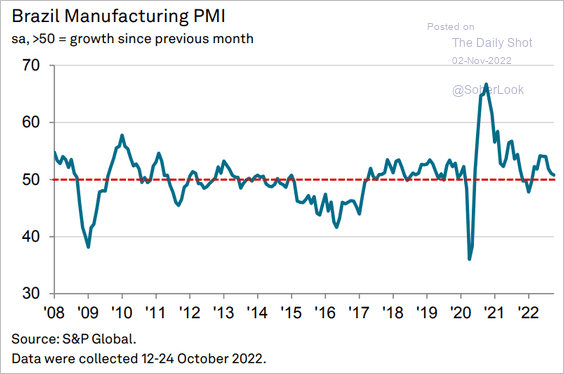 Source: S&P Global PMI
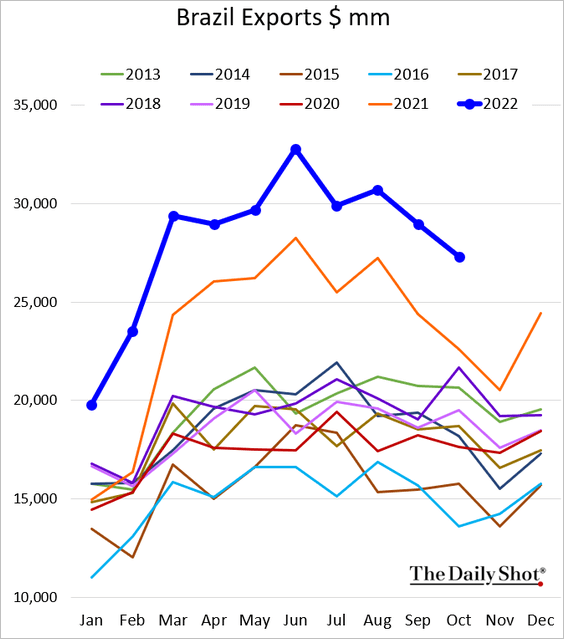
But exports remain strong.
——————–
2. Mexico’s manufacturing is stable but shows little growth.
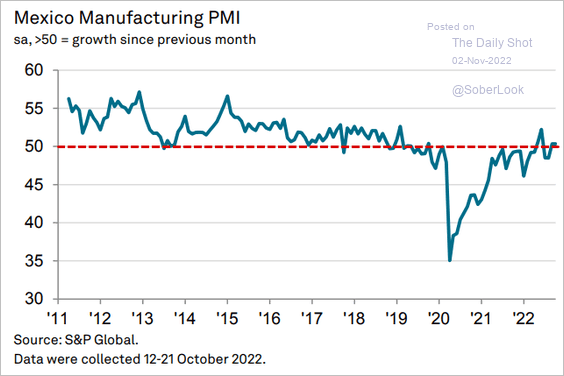 Source: S&P Global PMI
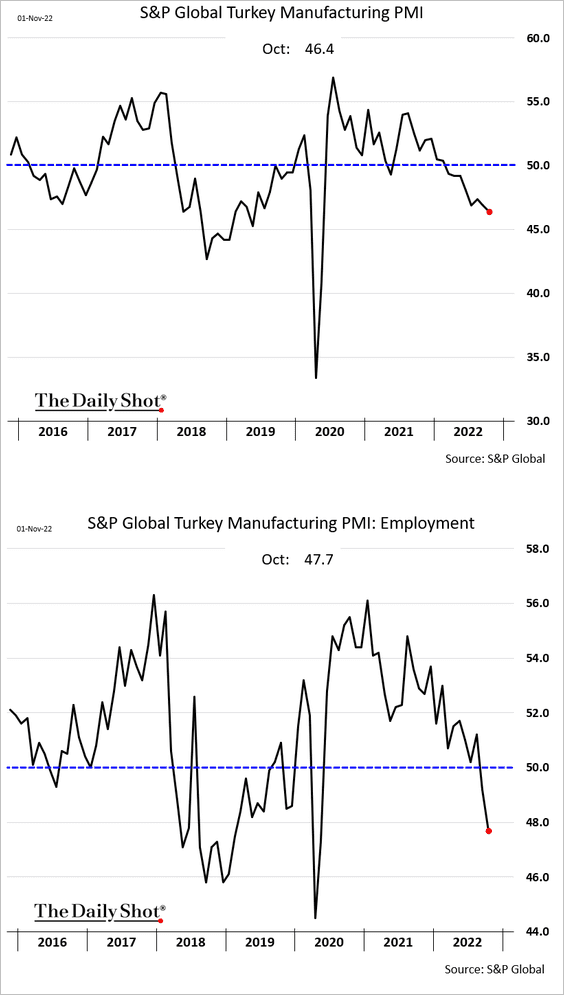
3. Turkey’s factory activity continues to contract.
4. India’s infrastructure push has been accelerating.
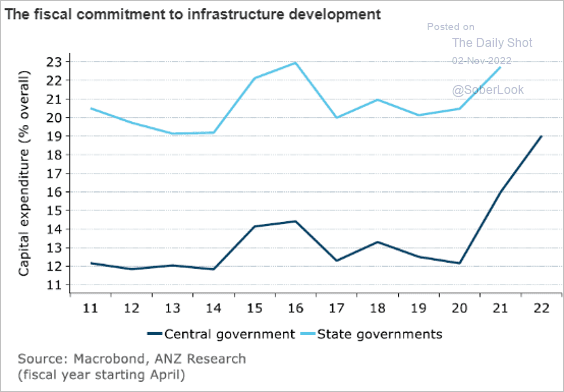 Source: @ANZ_Research
Back to Index
Commodities
1. Gold has experienced the worst losing (monthly) streak since 1869.
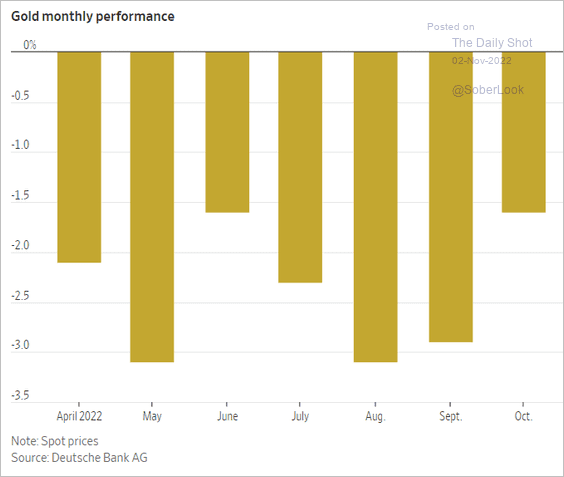 Source: @WSJ Read full article
But central banks have accelerated gold purchases.
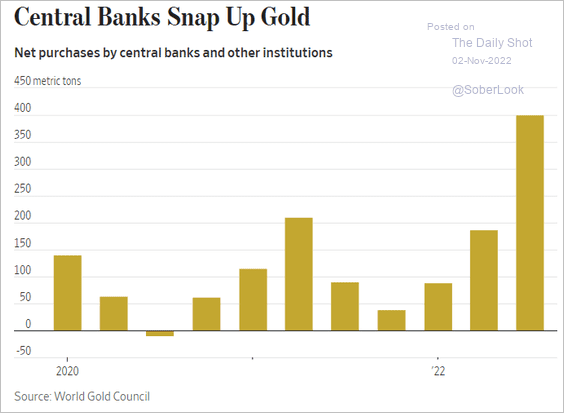 Source: @WSJ Read full article
——————–
2. The US winter wheat crop is not in great shape.
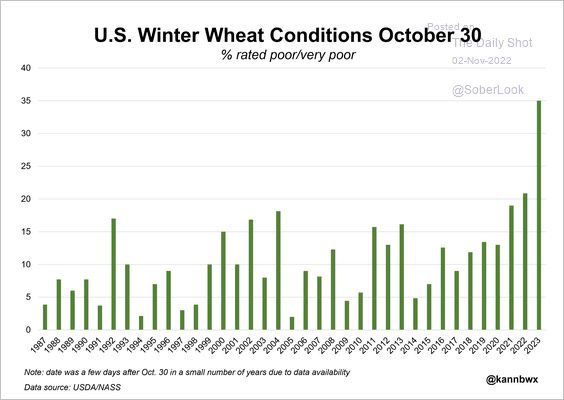 Source: @kannbwx
Back to Index
Energy
1. US East Coast diesel shortages have been severe.
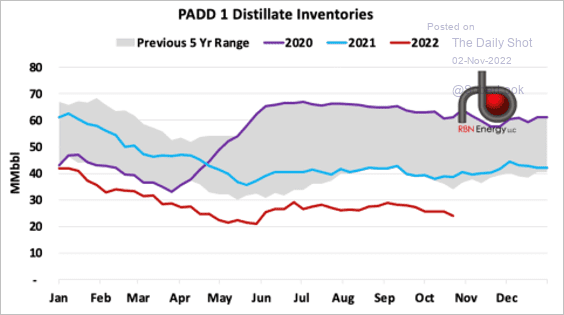 Source: RBN Energy Read full article
2. This chart shows the breakdown of US shale production.
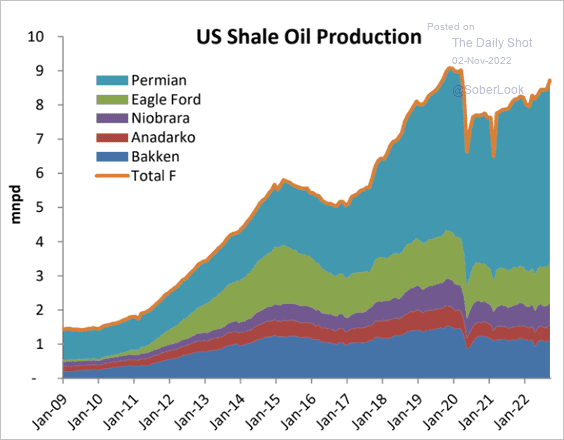 Source: Princeton Energy Advisors
Back to Index
Equities
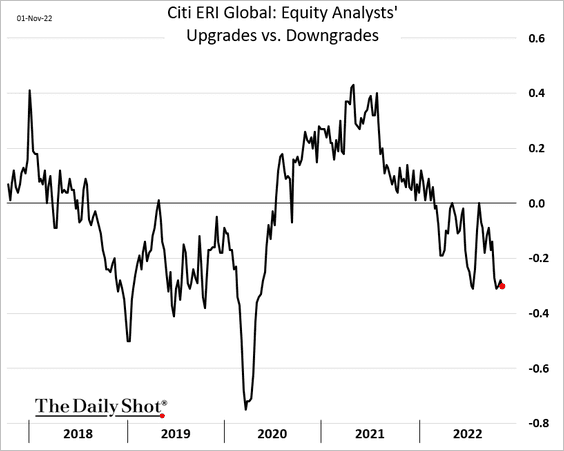
1. Global corporate earnings continue to see a wave of downgrades.
2. This chart shows large-cap performance in October across global markets.
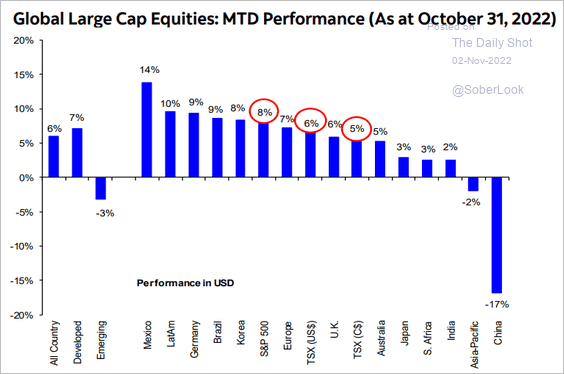 Source: Hugo Ste-Marie, Portfolio & Quantitative Strategy Global Equity Research, Scotia Capital
3. US equities tend to underperform international markets when the dollar weakens.
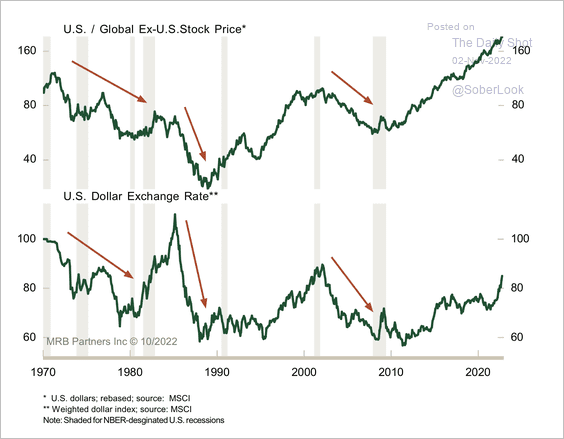 Source: MRB Partners
4. Next, we have market reactions to earnings/sales announcements.
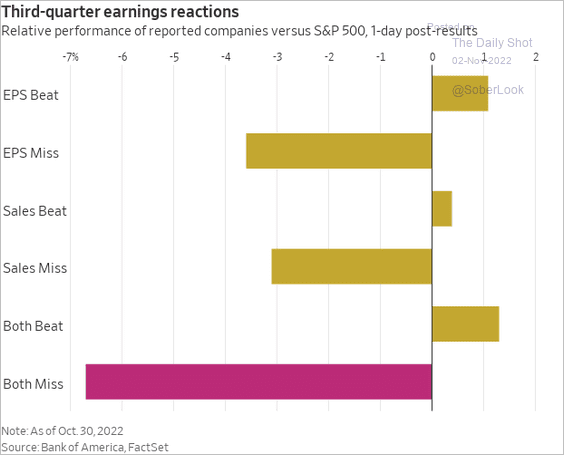 Source: @WSJ Read full article
Here is some history of reactions to sales beats and misses.
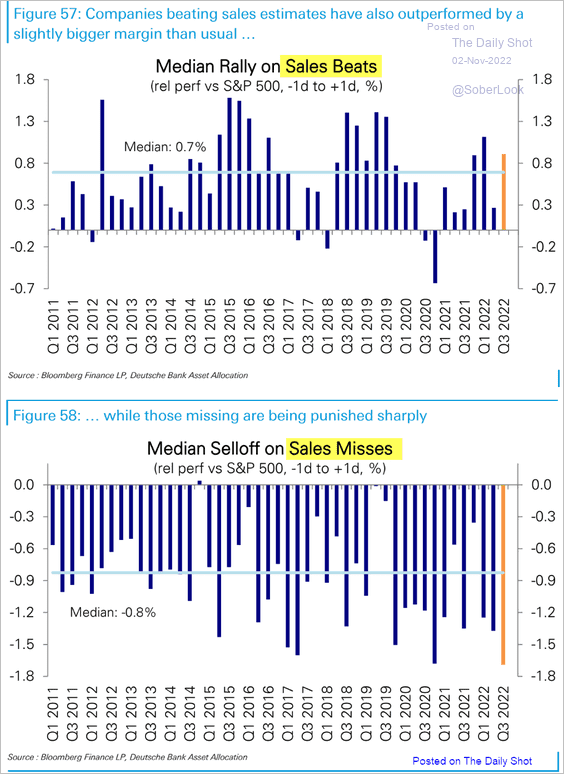 Source: Deutsche Bank Research
——————–
5. Earnings growth ex-energy is negative again in Q3.
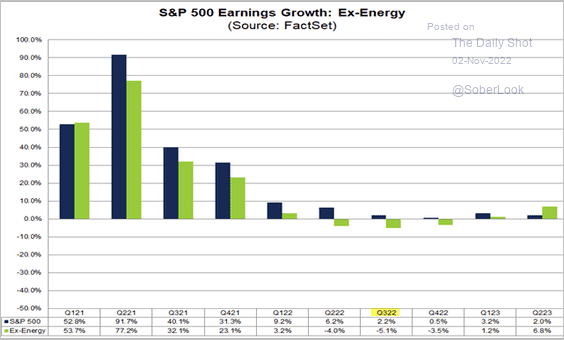 Source: @FactSet Read full article
6. Positioning is still very bearish.
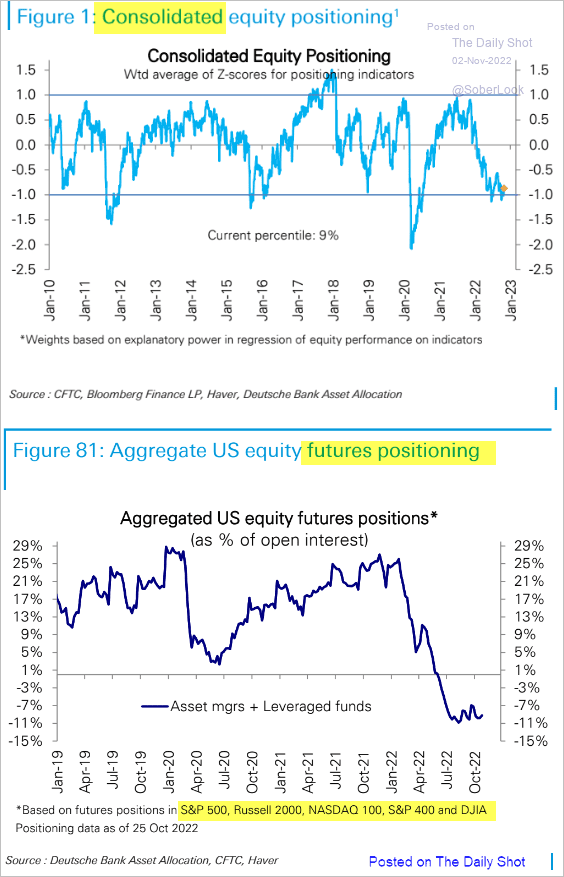 Source: Deutsche Bank Research
7. Next, we have ETF flows by year.
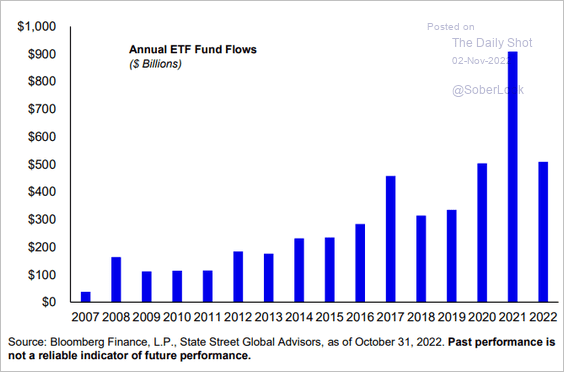 Source: SPDR Americas Research, @mattbartolini
8. Short-dated S&P 500 options volume has been extreme, exacerbating market volatility.
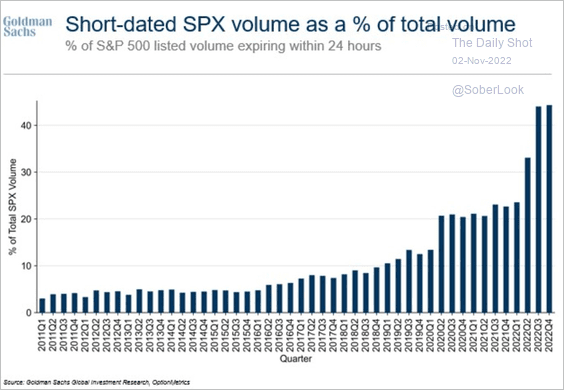 Source: Goldman Sachs; @luwangnyc, @markets Read full article
9. And it’s been a volatile year, …
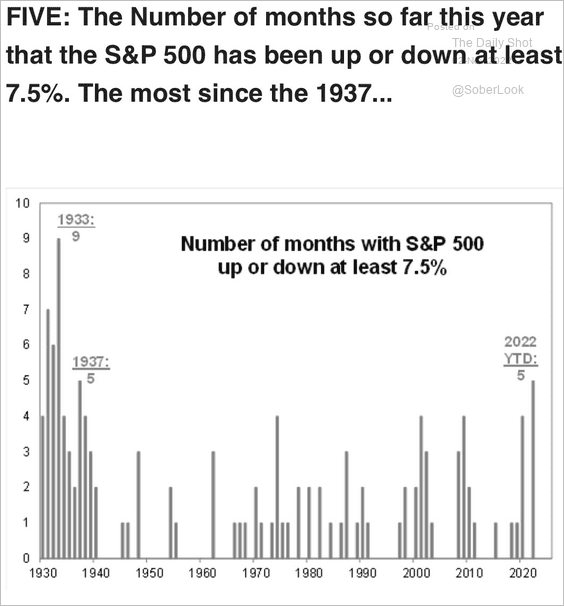 Source: @PhilipJagd
… including intraday volatility. This chart shows 1%+ reversal days.
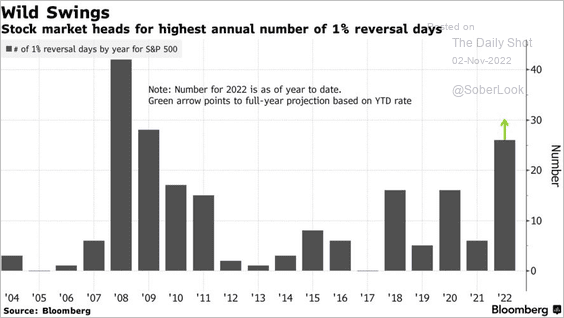 Source: @luwangnyc, @markets Read full article
Back to Index
Credit
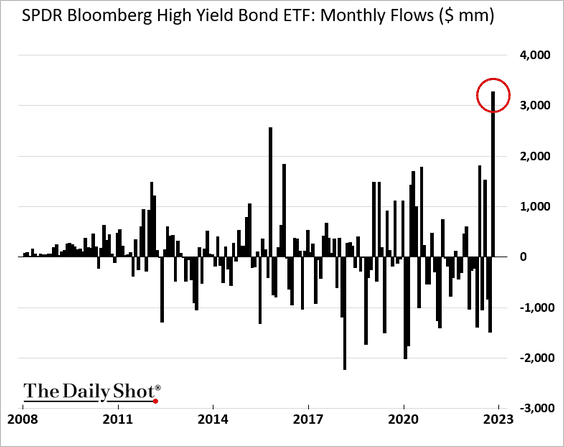
1. High-yield ETFs got some inflows last month.
2. CLO issuance is trailing last year’s volume.
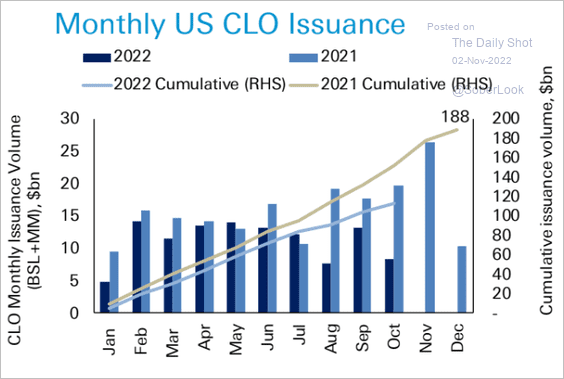 Source: Deutsche Bank Research
CLO senior debt spreads remain elevated.
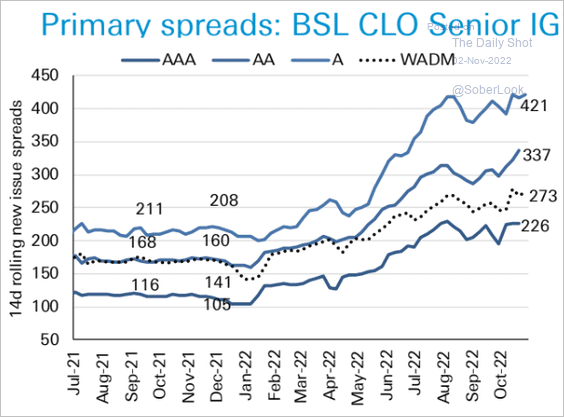 Source: Deutsche Bank Research
Back to Index
Rates
1. Does the housing market pain signal lower Treasury yields ahead?
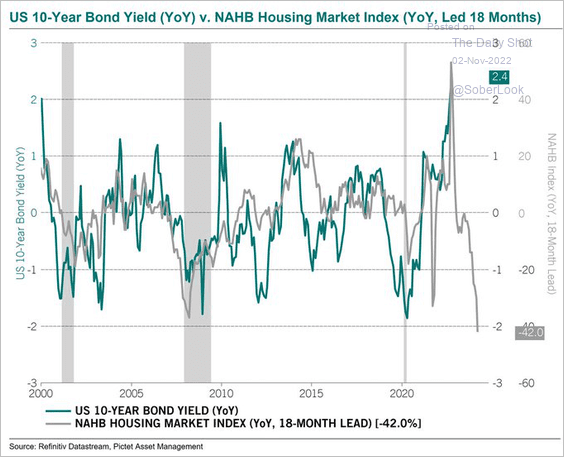 Source: @steve_donze
2. Off-the-run Treasury liquidity has been terrible.
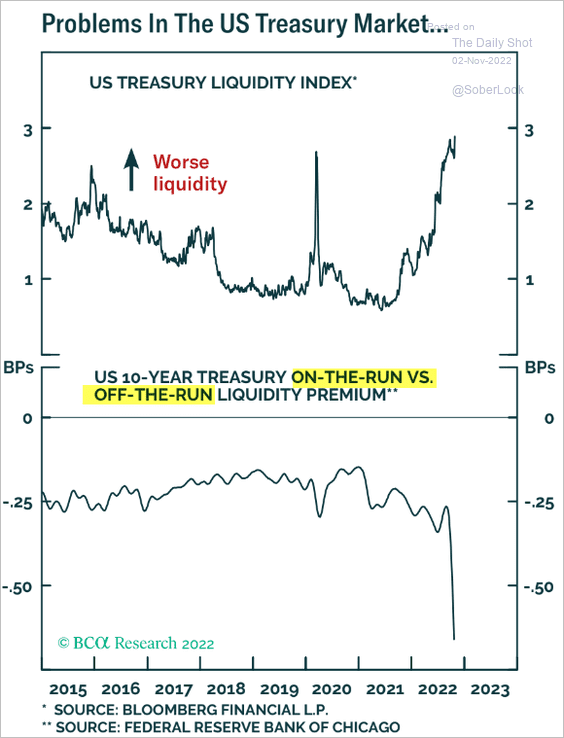 Source: BCA Research
3. QT has been slower than expected in part due to the collapse in MBS refinancing rates (the Fed’s MBS portfolio is taking much longer to reduce without direct sales).
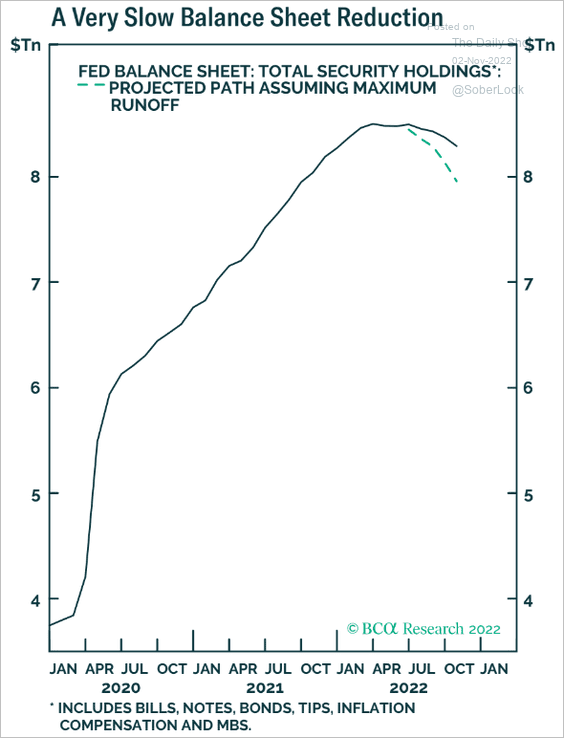 Source: BCA Research
Back to Index
Global Developments
1. Global equities and G7 government bonds are oversold, while the dollar is overbought.
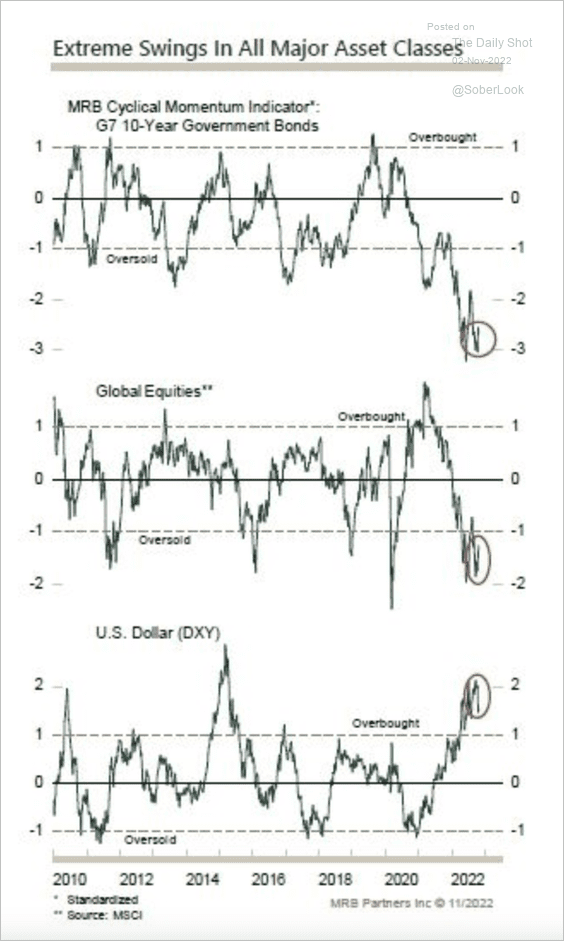 Source: MRB Partners
2. Speculative long positioning in the dollar is at an extreme.
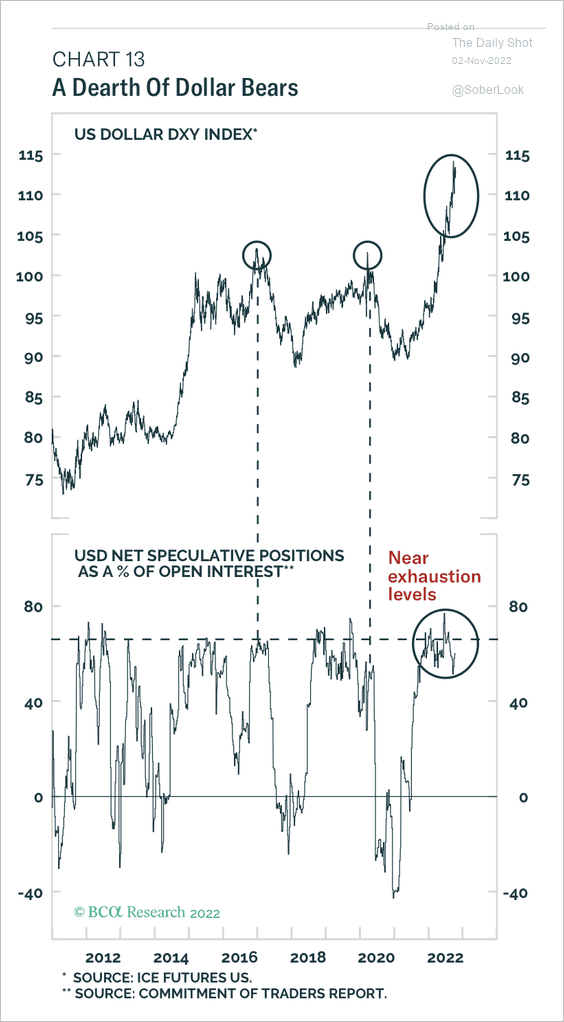 Source: BCA Research
3. Here is a look at major asset class returns in October, led by Russian and European equities, …
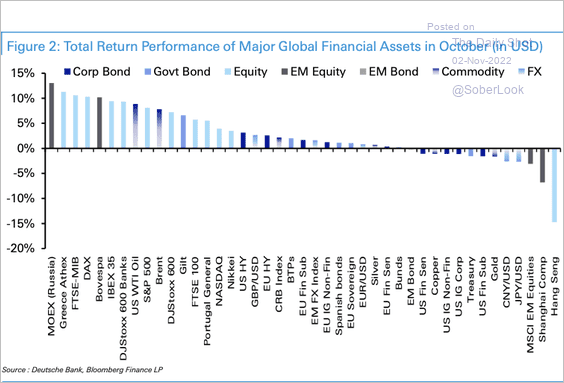 Source: Deutsche Bank Research
… and Hong Kong equities and UK government bonds have underperformed year-to-date.
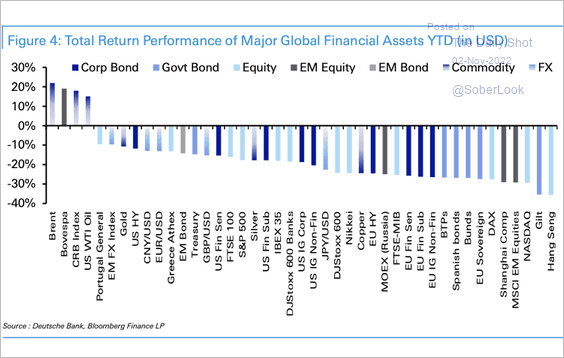 Source: Deutsche Bank Research
——————–
4. This chart shows market expectations for policy rates in advanced economies.
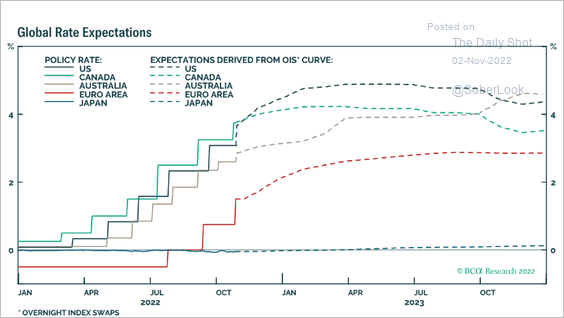 Source: BCA Research
——————–
Food for Thought
1. Strong-form social distancing by age (people with no plans to return to pre-COVID activities):
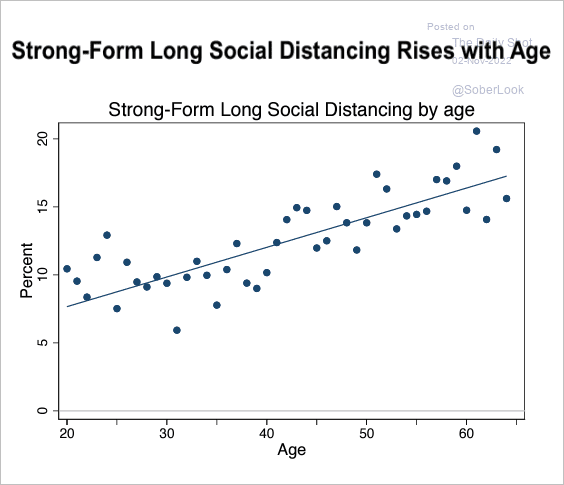 Source: Barrero, Bloom, Davis Read full article
2. Children suffering from stunting:
 Source: @dr_appie
3. Pollution in major cities:
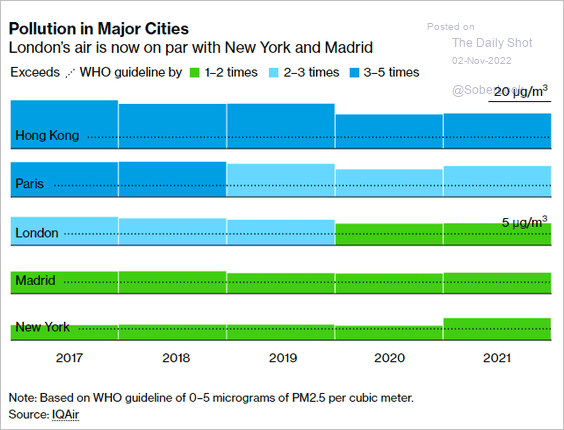 Source: @BBGVisualData Read full article
4. Does the federal government have too much power?
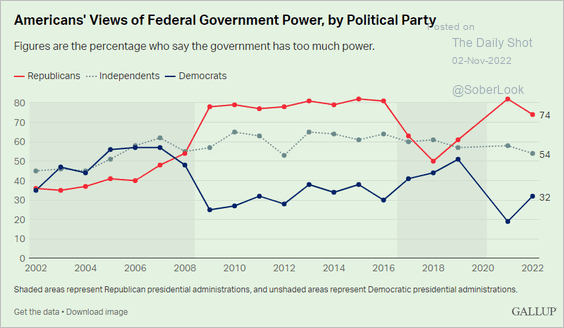 Source: Gallup Read full article
5. Latino Americans’ views on Democrats and Republicans:
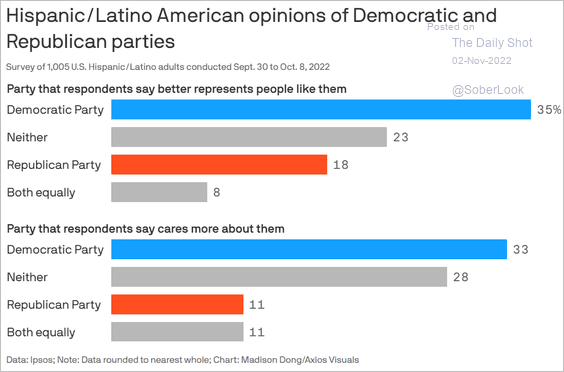 Source: @axios Read full article
6. Military veterans in Congress:
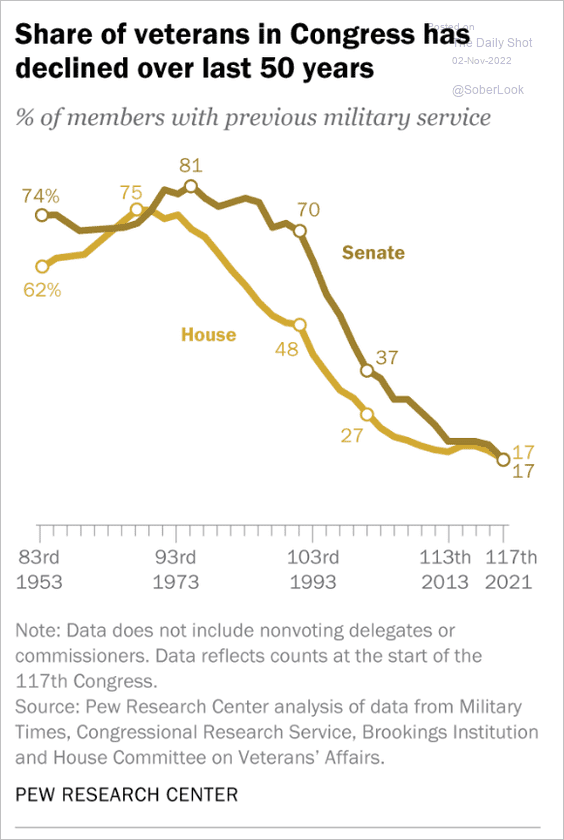 Source: Pew Research Center Read full article
7. Nominal and real Halloween spending:
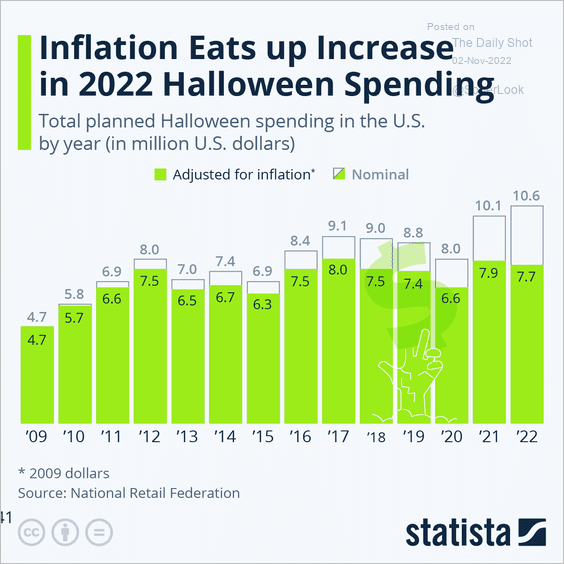 Source: Statista
8. The Cistercian numerals:
 Source: @Rainmaker1973 Read full article
——————–
Back to Index