
The Daily Shot: 08-Nov-22
• The United States
• The United Kingdom
• The Eurozone
• Japan
• Asia – Pacific
• China
• Emerging Markets
• Cryptocurrency
• Commodities
• Equities
• Alternatives
• Rates
• Global Developments
• Food for Thought
The United States
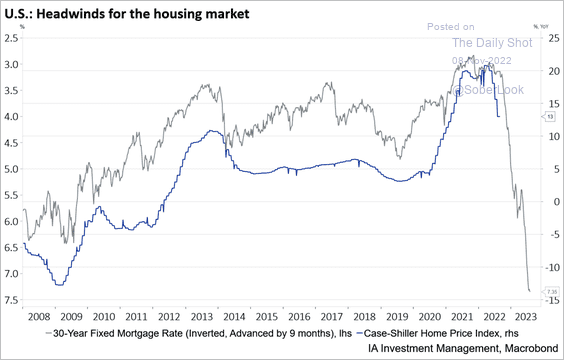
1. Let’s begin with the housing market.
• The surge in mortgage rates suggests that home prices will see year-over-year declines at the national level.
 Source: Industrial Alliance Investment Management
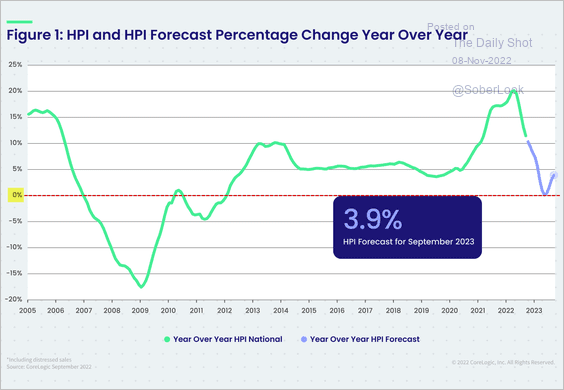
But CoreLogic does not see home price appreciation dipping into negative territory.
 Source: CoreLogic
Why? It’s about persistently tight supplies. Here is a quote from Selma Hepp.
CoreLogic HPI forecast does suggest that home price appreciation will slow considerably by early 2023 and record about 0% YOY change in May. And while the national HPI is not expected to turn negative, there are markets that are expected to see YoY declines, such as Phoenix, Las Vegas, Houston. The reason that national price growth is not expected to turn considerably negative is the continued inventory constraint and the fact that existing homeowners are not forced to sell (households have locked in low mortgage payments and mortgage rates and most have built up substantial equity). Consumer sentiment for home sellers suggests that sellers increasingly don’t believe it’s a good time to sell right now.
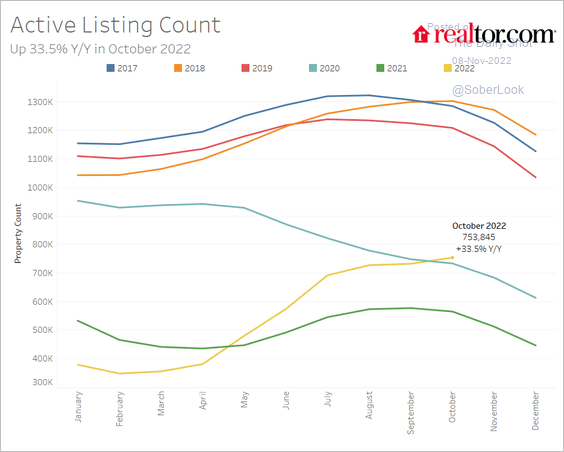
• Listings are up substantially vs. last year but still relatively low.
 Source: National Association of REALTORS
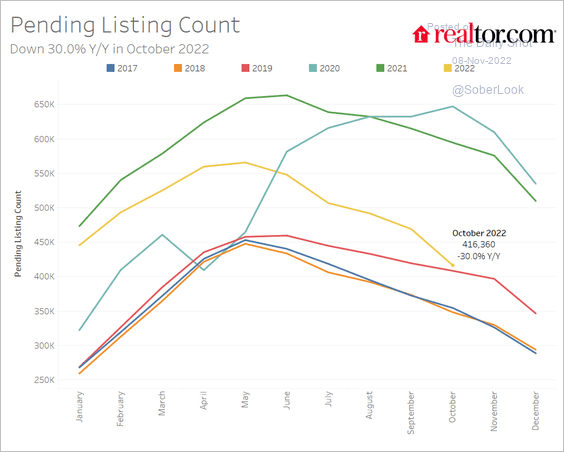
And pending listings are falling.
 Source: National Association of REALTORS
• Price cuts are more common.
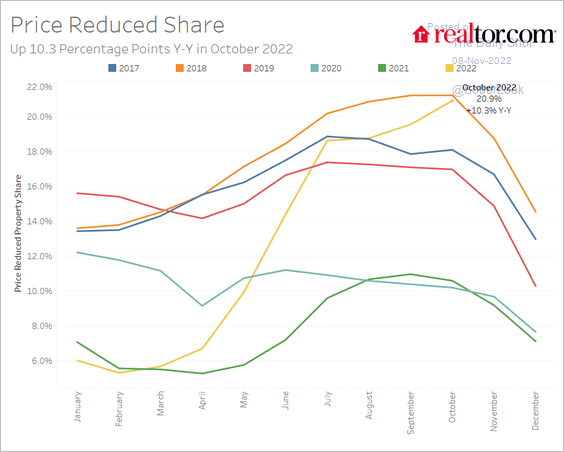 Source: National Association of REALTORS
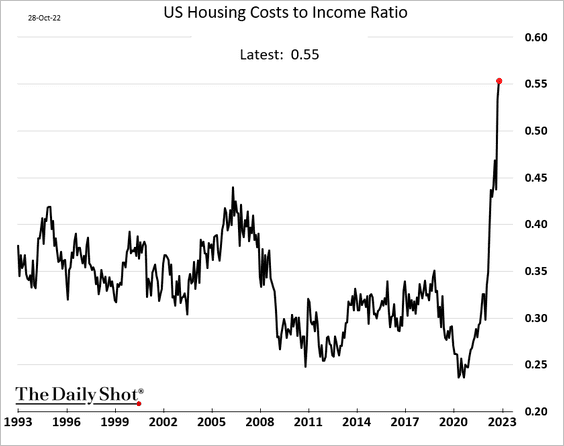
• This chart shows the US housing market costs-to-income ratio.
• Housing employment has been held up by an elevated stock of homes under construction. A downturn is coming next year.
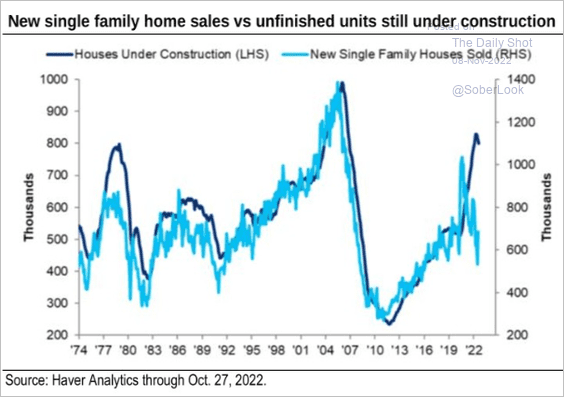 Source: Citi Private Bank
2. Next, let’s take a look at rental market trends.
• Rents as a share of disposable income are at the pre-COVID peak.
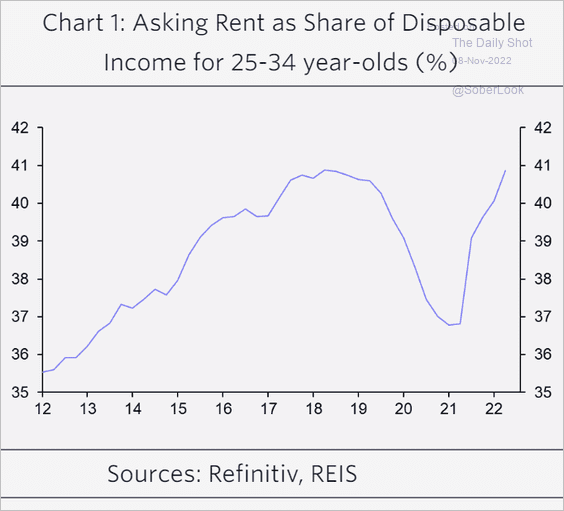 Source: Capital Economics
• Rents declined sharply in October.
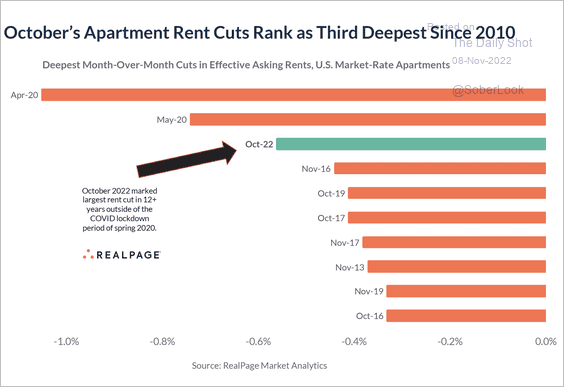 Source: RealPage
• Numerous leading indicators are signaling lower rent inflation ahead.
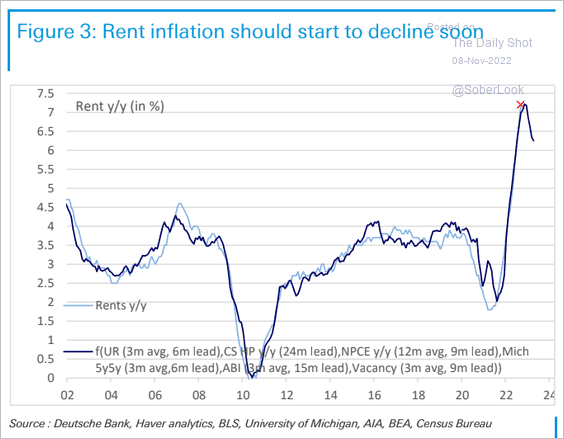 Source: Deutsche Bank Research
– Apartment tightness index:
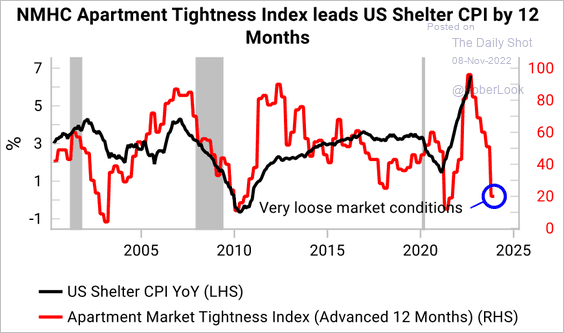 Source: Variant Perception
– Home price appreciation:
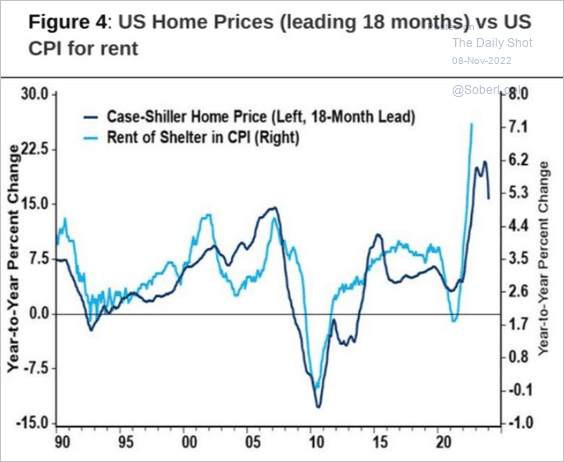 Source: Citi Private Bank
——————–
3. Here are some trends in household credit.
• Demand for mortgages is sinking.
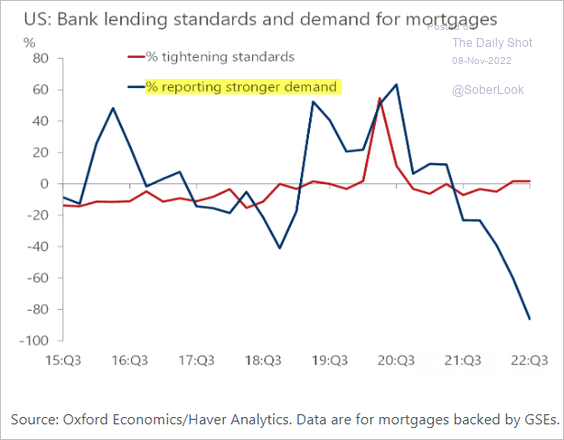 Source: Oxford Economics
• Credit card debt continues to climb (2 charts).
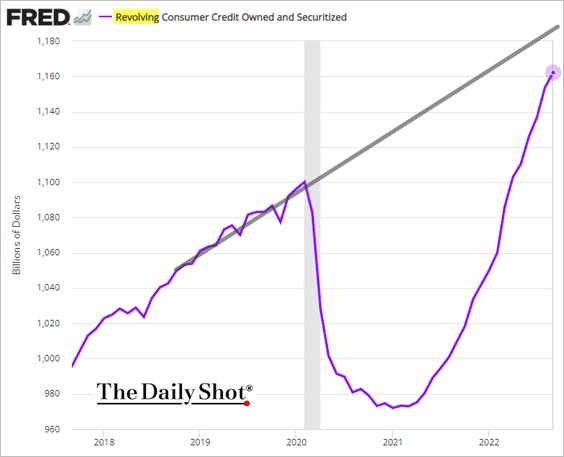
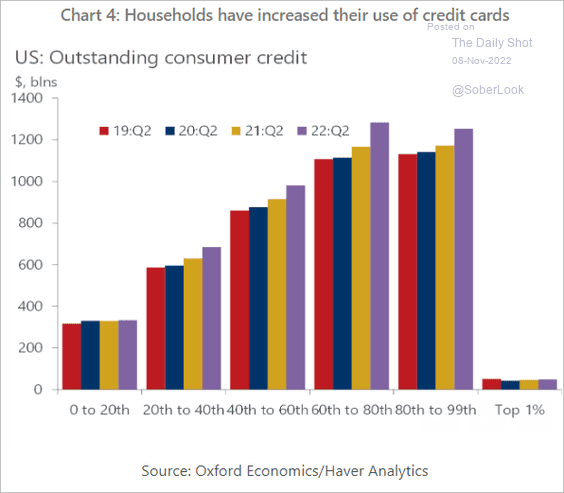 Source: Oxford Economics
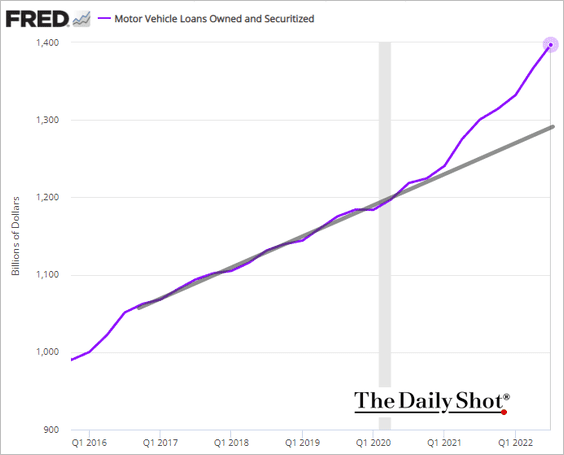
• Auto loan balances are rising much faster than the pre-COVID trend.
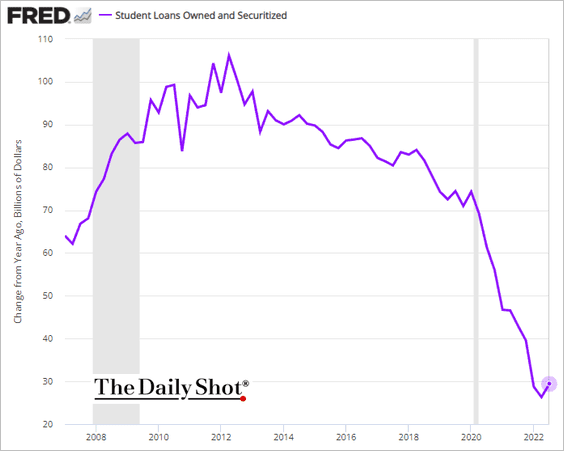
• Student debt growth has stabilized.
——————–
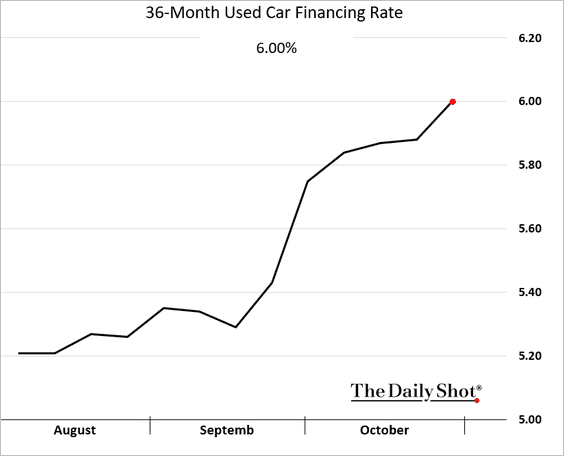
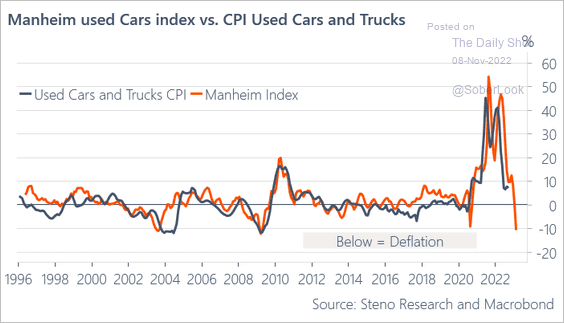
4. Winter is coming to the used car market. Wholesale prices are down almost 11% from a year ago, …
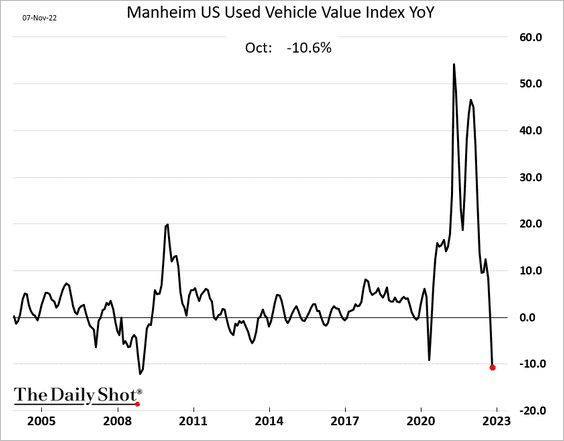
… as used car financing rates surge.
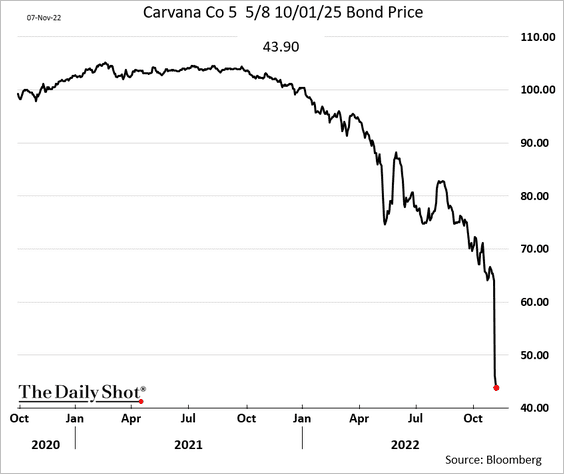
• Carvana’s share price has collapsed, …
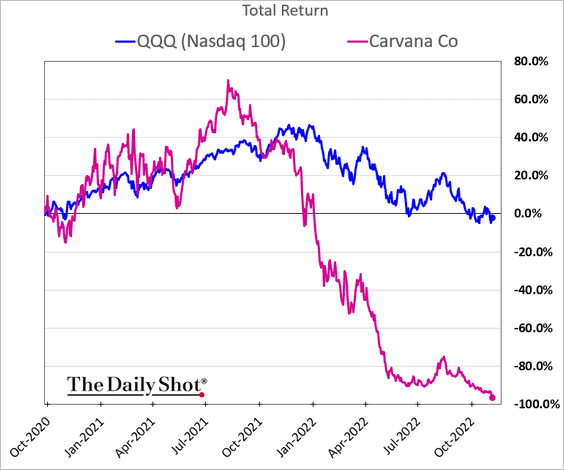
… and bond prices are crashing.
• Used car deflation should be a drag on the core CPI.
 Source: @AndreasSteno
——————–
5. The terminal rate continues to grind higher.
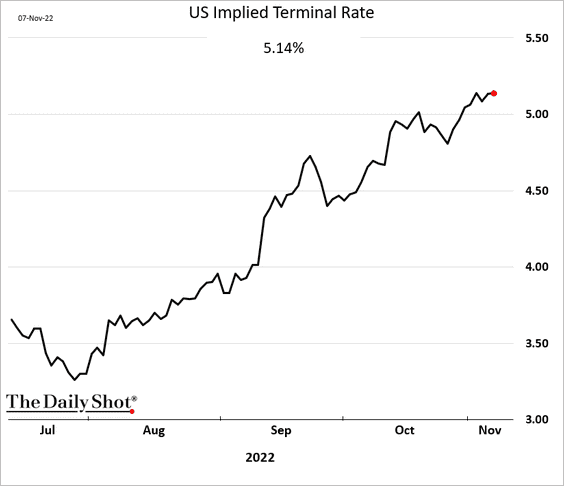
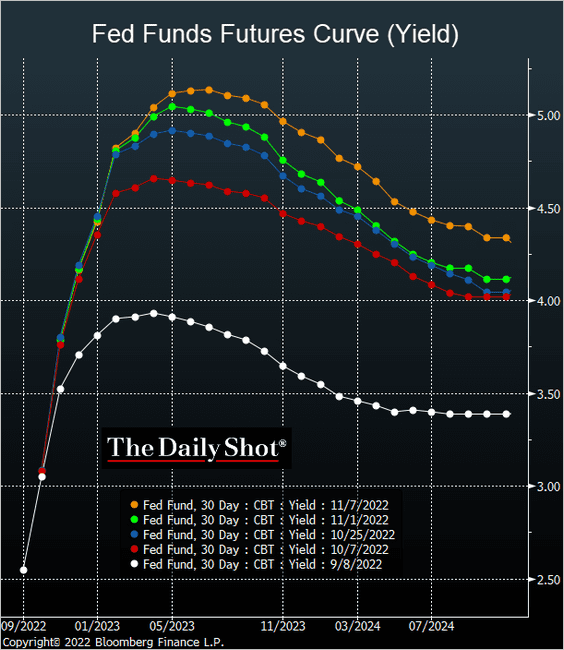
Here is the evolution of the market-based fed funds rate trajectory.
 Source: @TheTerminal, Bloomberg Finance L.P.
Back to Index
The United Kingdom
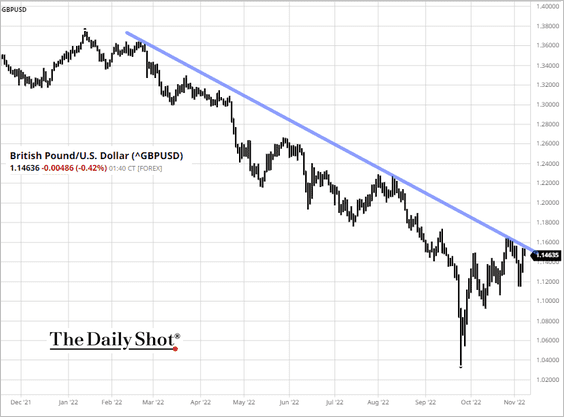
1. The pound is holding its downtrend resistance.
2. There is still a large supply of gilts hitting the market next year.
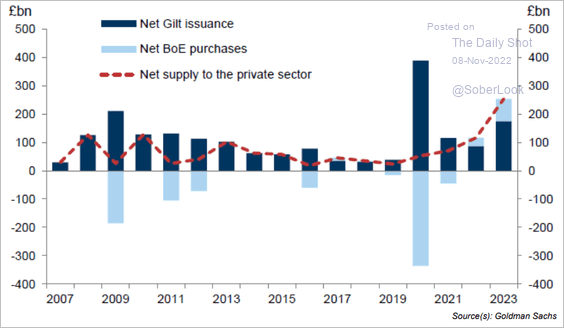 Source: Goldman Sachs; III Capital Management
Back to Index
The Eurozone
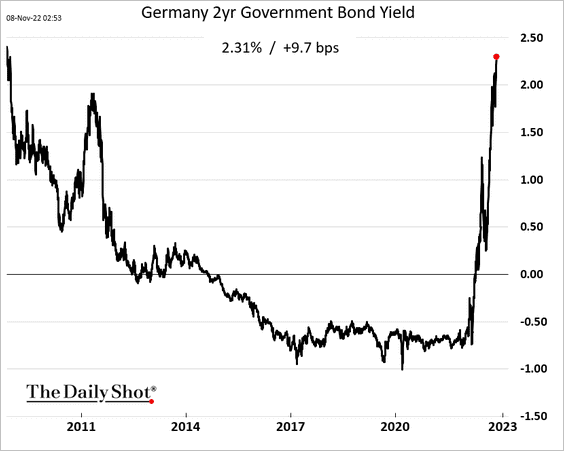
1. Germany’s 2-year yield hit the highest level since 2008.
2. How long will Germany’s industrial production remain resilient?
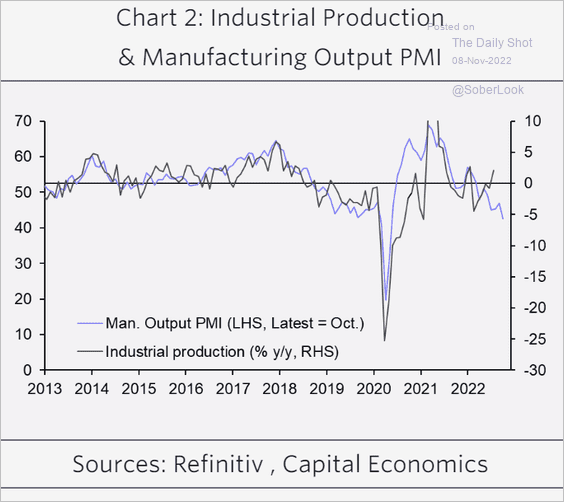 Source: Capital Economics
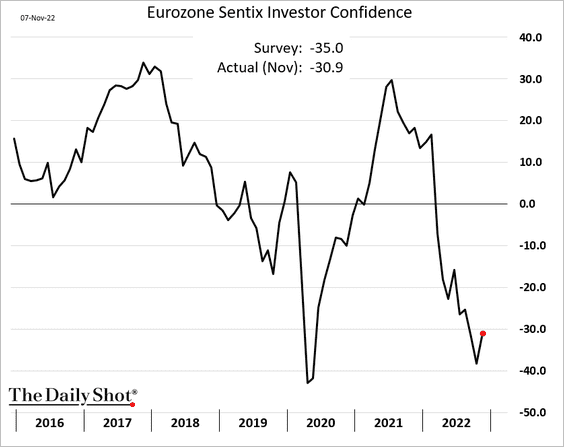
3. The Eurozone Sentix investor confidence index bounced from the lows.
4. The economy faces a growing list of problems.
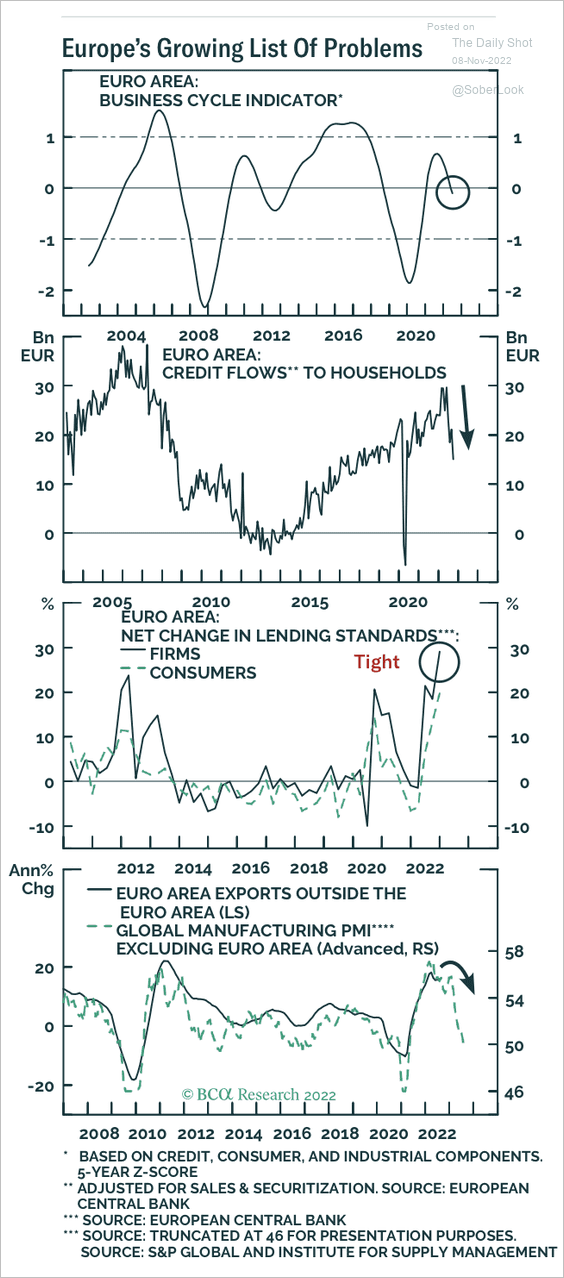 Source: BCA Research
5. The reduction in loan demand amid tighter lending standards points to a substantial decline in credit and money growth.
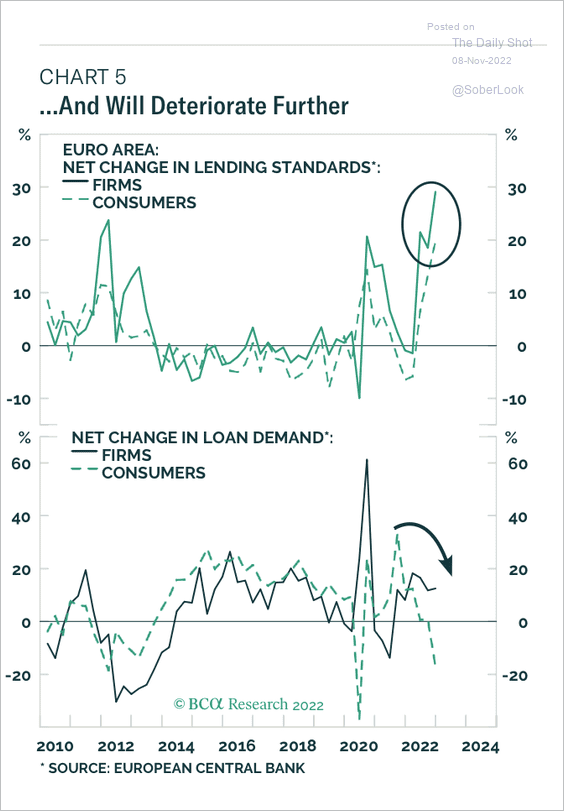 Source: BCA Research
6. Here is the breakdown of the euro-area current account balance.
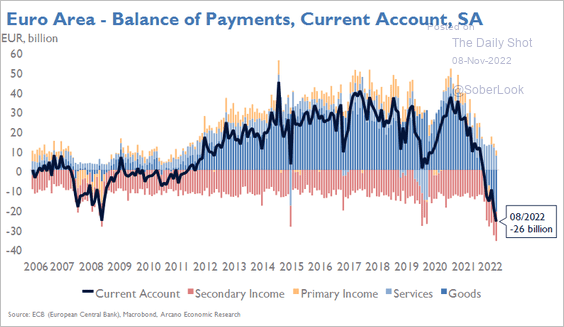 Source: Arcano Economics
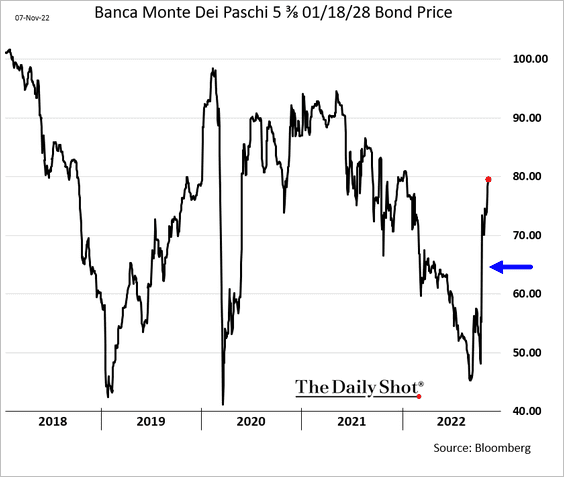
7. Italy’s troubled bank Banca Monte dei Paschi completed its recapitalization.
 Source: MarketWatch Read full article
Bond prices jumped.
Back to Index
Japan
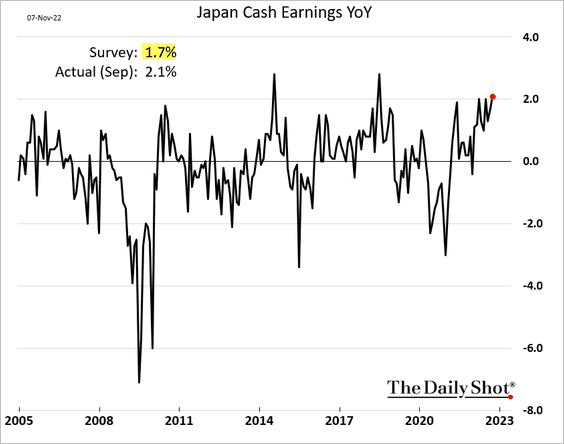
1. Wage growth surprised to the upside, fueling inflation concerns.
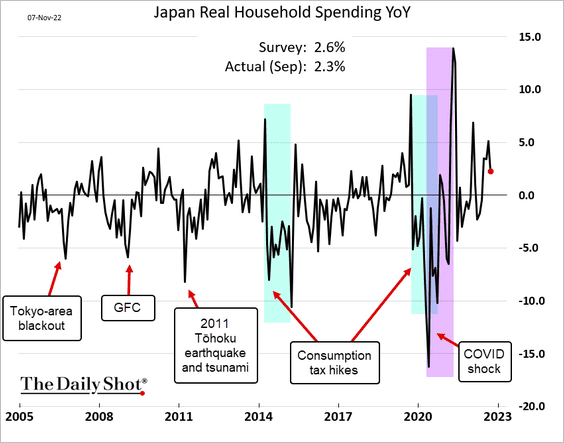
2. But household spending slowed.
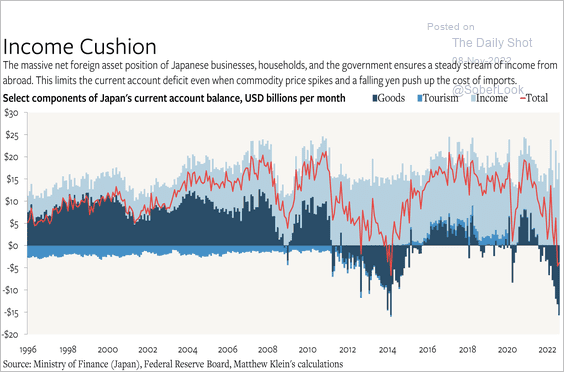
3. Massive foreign income cushions the current account from the surge in commodity costs.
 Source: @Brad_Setser, @M_C_Klein Read full article
4. Currency hedging made all the difference for USD investors in Japanese shares.
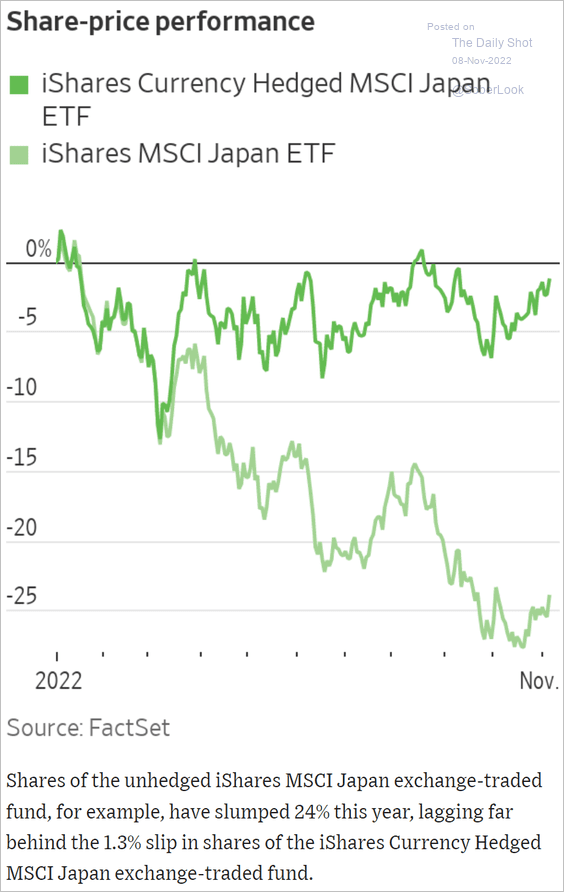 Source: @WSJ Read full article
Back to Index
Asia – Pacific
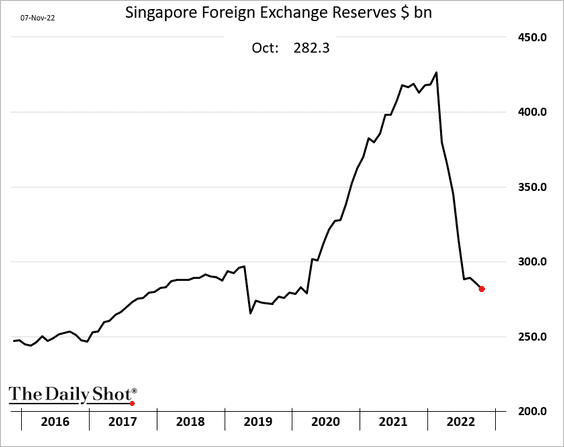
1. Singapore’s FX reserves continue to move lower.
2. New Zealand’s inflation expectations continue to climb.
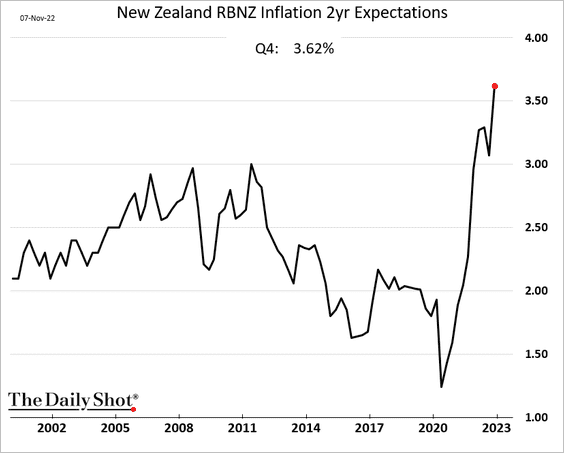
Going forward, the RBNZ rate hikes are expected to outpace the Fed.
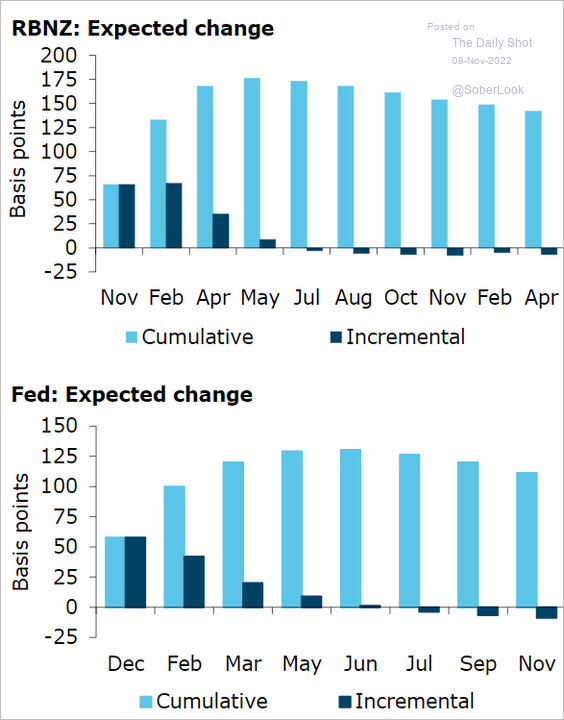 Source: @ANZ_Research
——————–
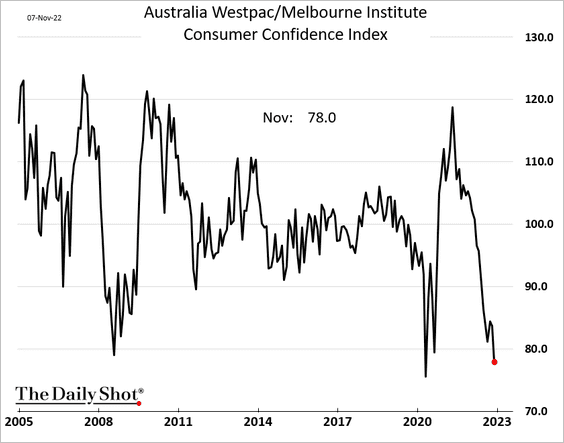
3. Australian business confidence declined last month.
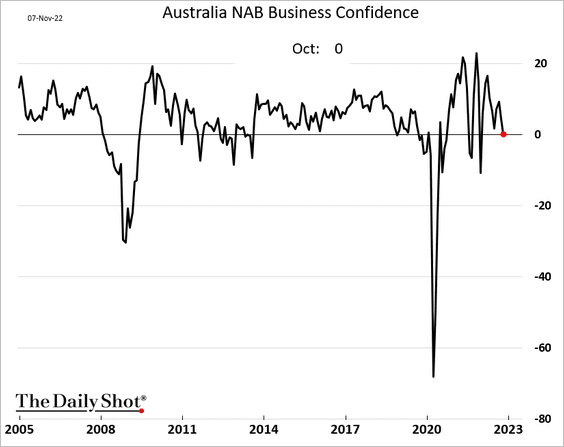
Consumer confidence continues to deteriorate.
Back to Index
China
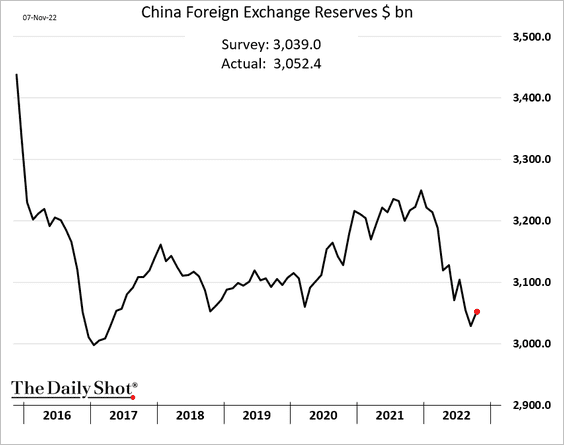
1. FX reserves edged higher last month.
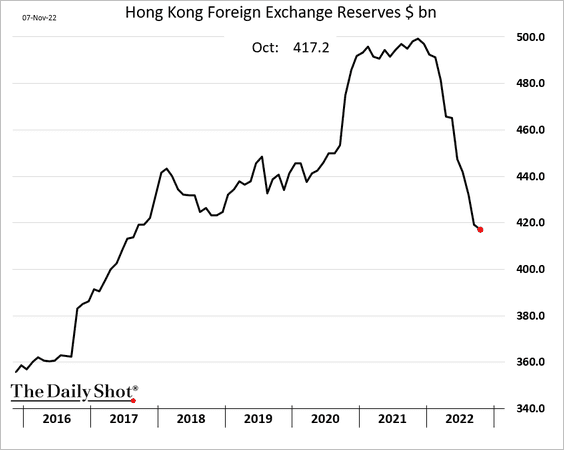
2. Hong Kong’s FX reserves continue to move lower.
3. The Hang Seng Tech Index is at resistance.
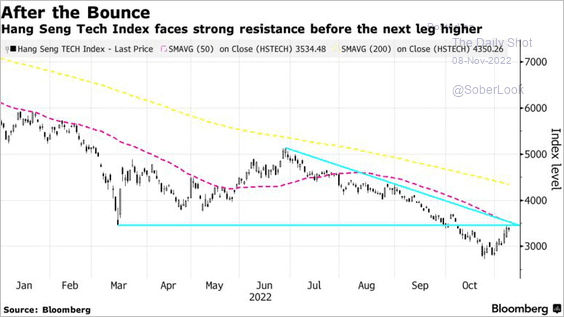 Source: @brettamiller30, @markets Read full article
Back to Index
Emerging Markets
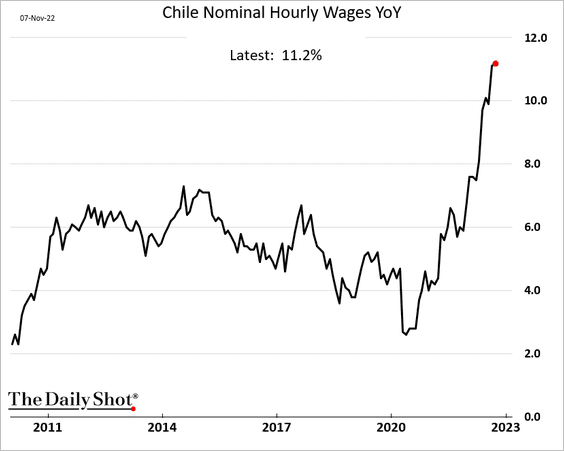
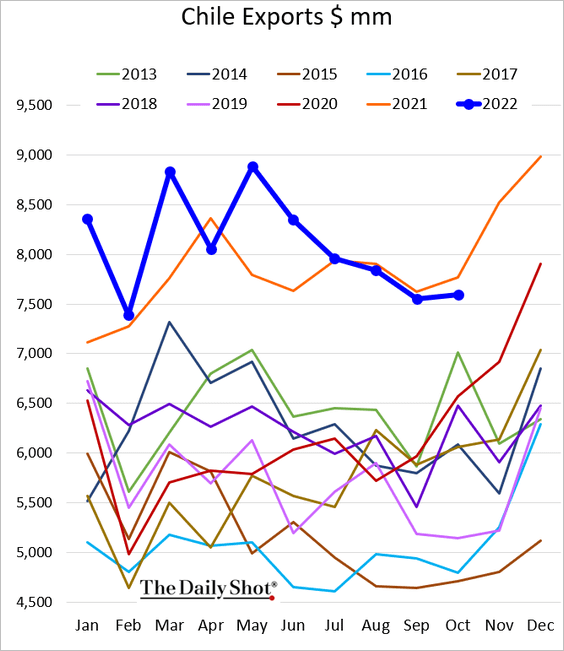
1. Chile’s wage growth is above 11%, fueling price pressures.
Exports are now firmly below last year’s levels.
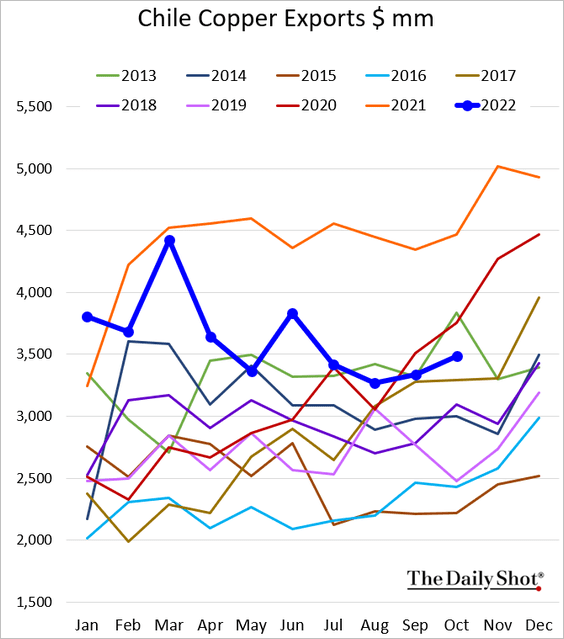
This chart shows Chile’s copper exports.
——————–
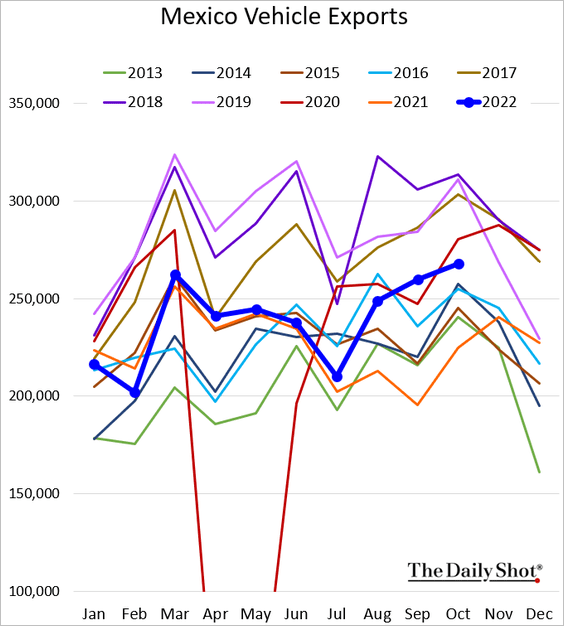
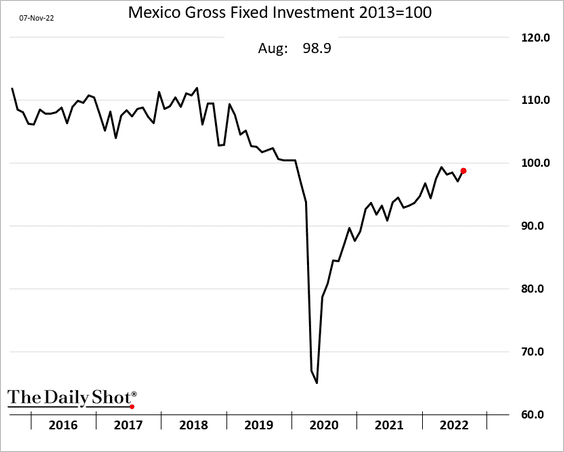
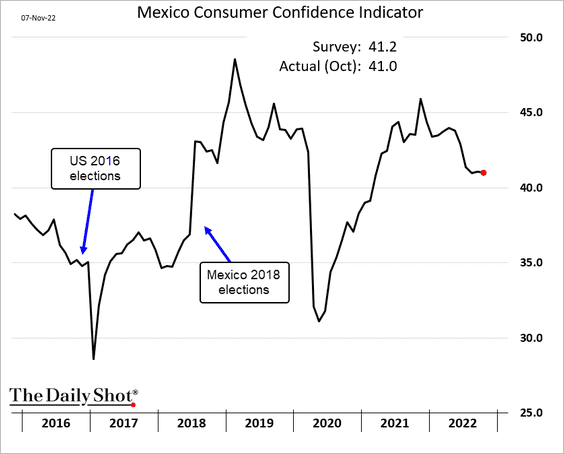
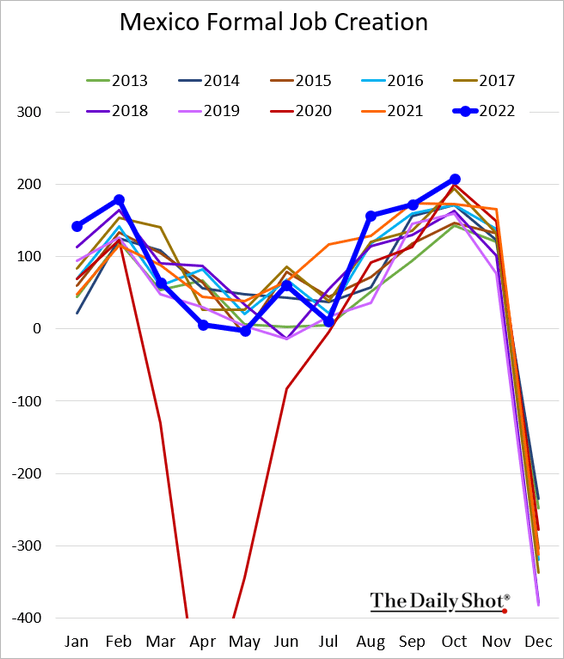
2. Next, we have some updates on Mexico.
• Vehicle exports are improving.
• Business investment is nearing pre-COVID levels.
• Consumer confidence remains stable.
• Formal job creation hit a new high.
——————–
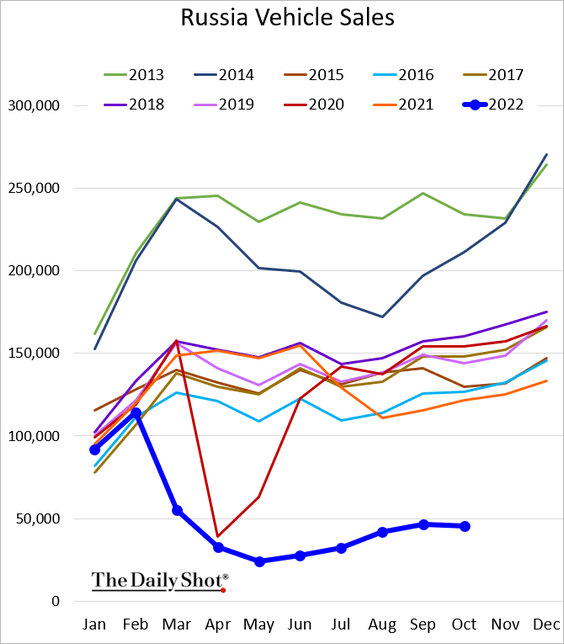
3. Russian vehicle sales remain depressed.
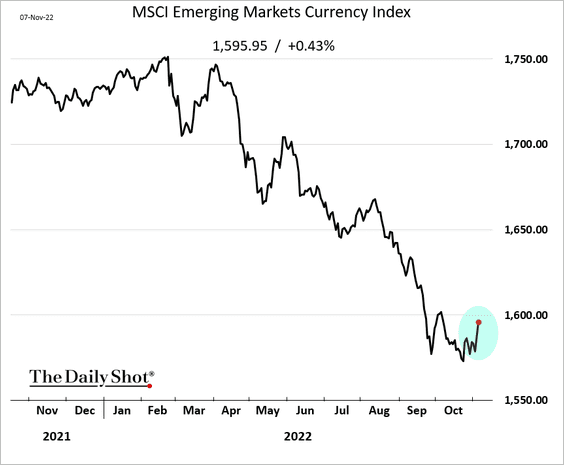
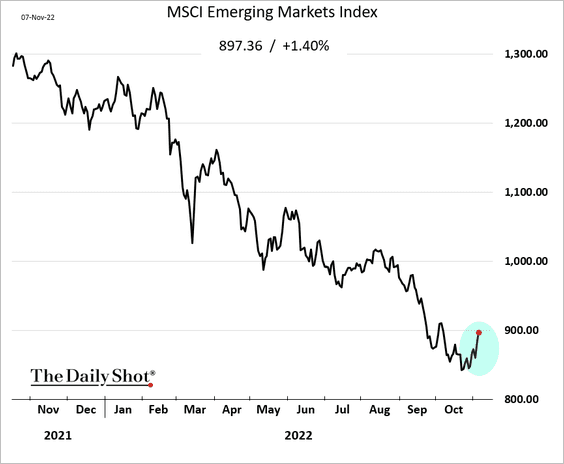
4. EM currencies and stocks (2nd chart) bounced from recent lows.
——————–
5. Indian stocks appear overvalued versus Chinese stocks.
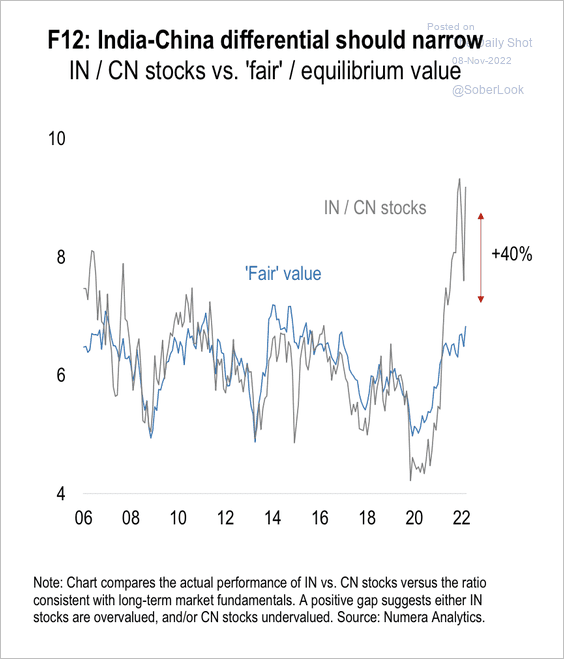 Source: Numera Analytics
Back to Index
Cryptocurrency
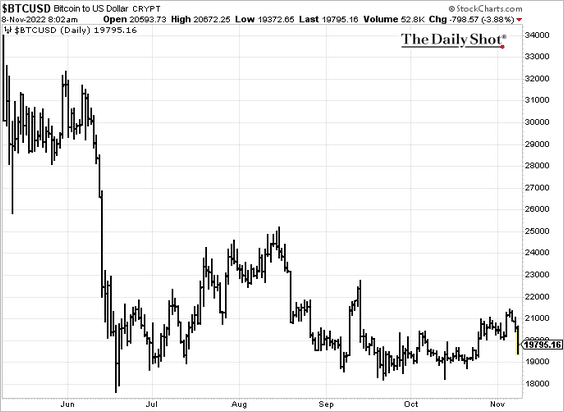
1. Cryptos are under pressure this morning, …
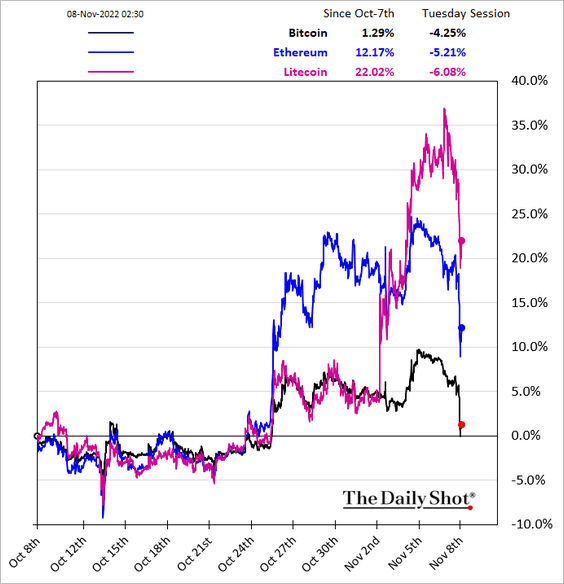
… as bitcoin dips below $20k again.
——————–
2. Bitcoin’s realized volatility continues to trend lower.
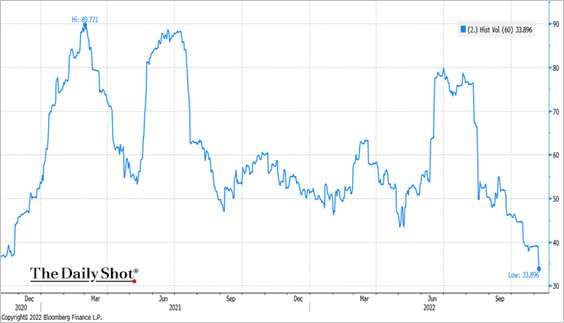 Source: @TheTerminal, Bloomberg Finance L.P.
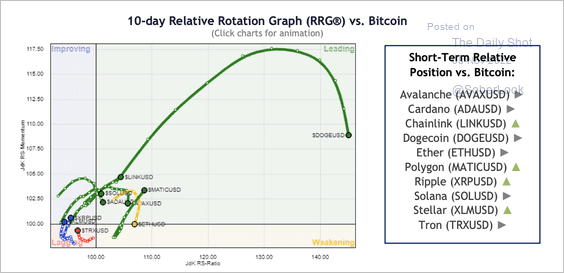
3. Several altcoins are improving relative to bitcoin, especially dogecoin (DOGE), Chainlink (LINK), and Polygon (MATIC). Chart compares relative strength and momentum versus BTC over the past 10 days.
 Source: @StocktonKatie
4. Crypto investment products saw minor outflows last week, driven by long and short-bitcoin funds. Investors returned to Ether-focused funds after four straight weeks of outflows
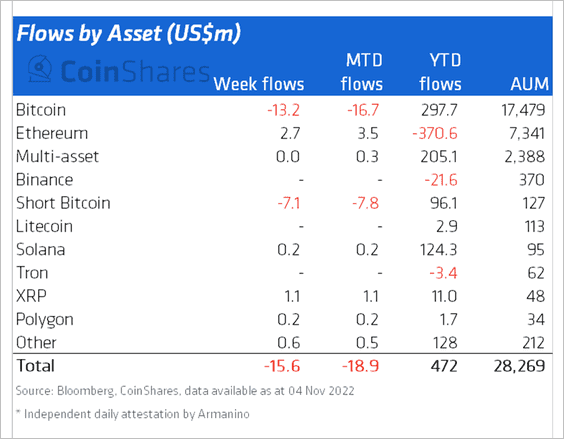 Source: CoinShares Read full article
US and Canadian funds continued to see outflows, while some European funds saw inflows last week.
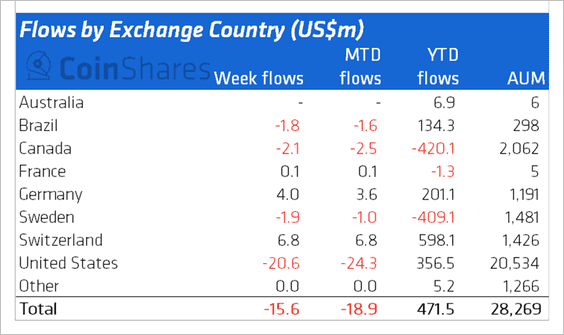 Source: CoinShares Read full article
——————–
5. On an annualized basis, realized volatility of bitcoin and ether prices are higher than traditional assets.
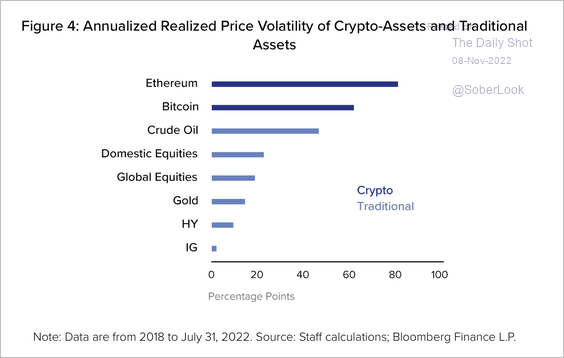 Source: Financial Stability Oversight Council
6. This chart shows the estimated extent of global financial scams and “rug pulls” during the past six years.
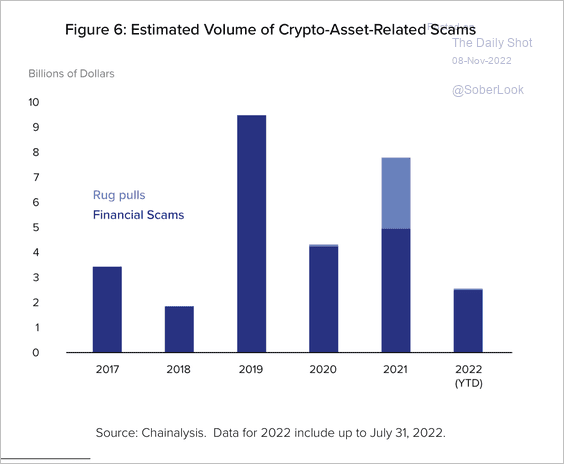 Source: Financial Stability Oversight Council
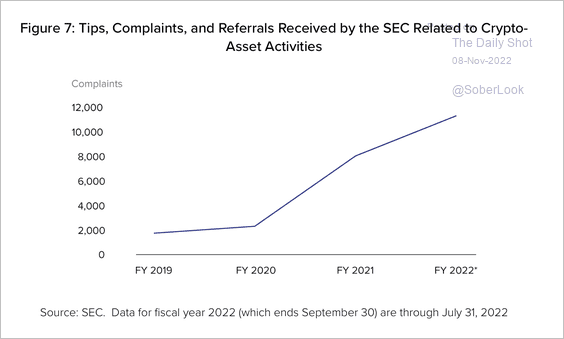
7. The SEC has seen an increase in crypto complaints.
 Source: Financial Stability Oversight Council
8. FTX’s FTT token dipped with a significant spike in volume on rumors about insolvency at the crypto exchange.
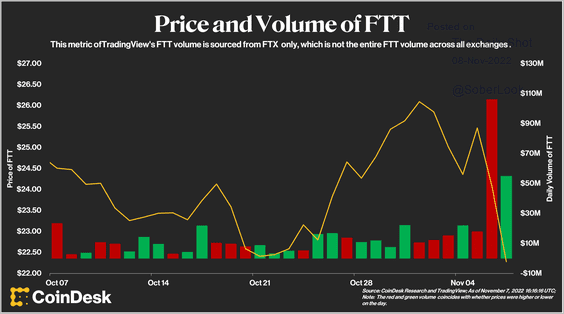 Source: CoinDesk Read full article
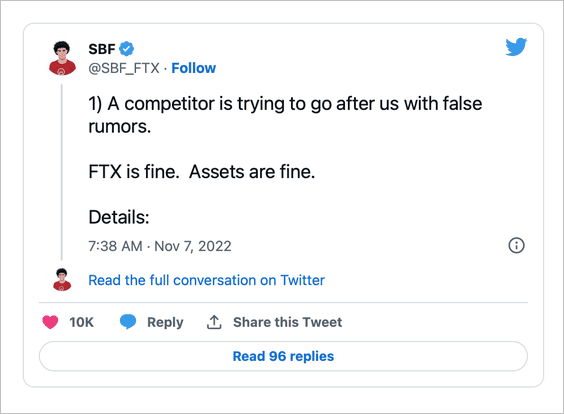 Source: @SBF_FTX
Back to Index
Commodities
1. Coffee futures continue to sink.
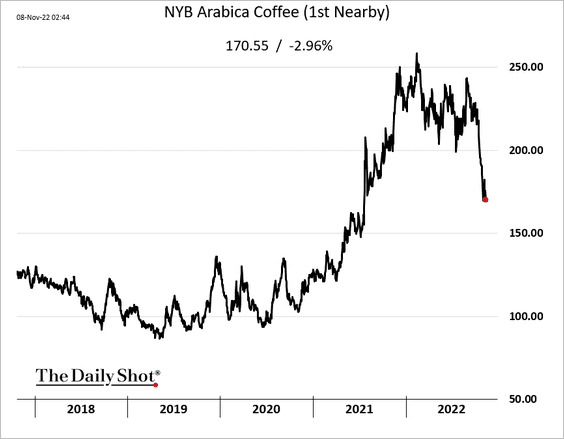
 Source: Reuters Read full article
——————–
2. This chart shows rare earths output over time.
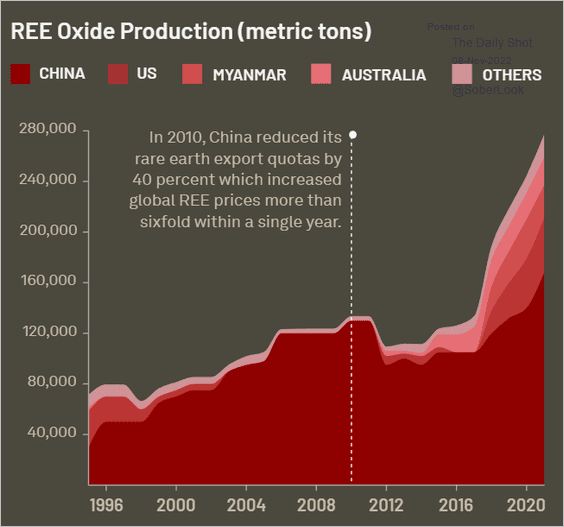 Source: kontinentalist.com Read full article
Back to Index
Equities
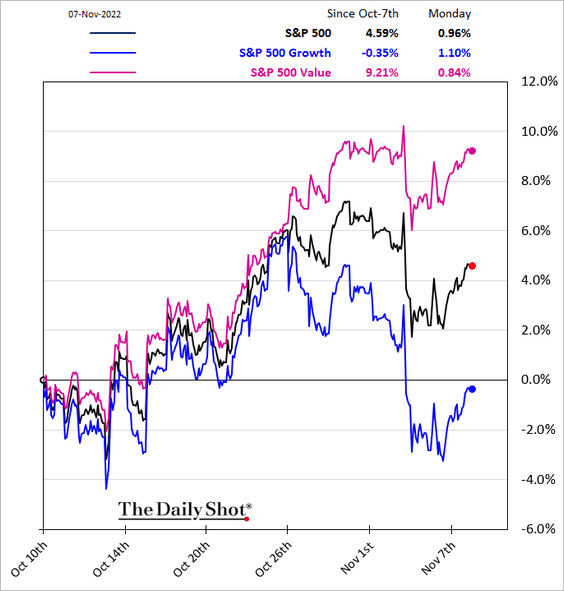
1. The Dow continues to outperform, …
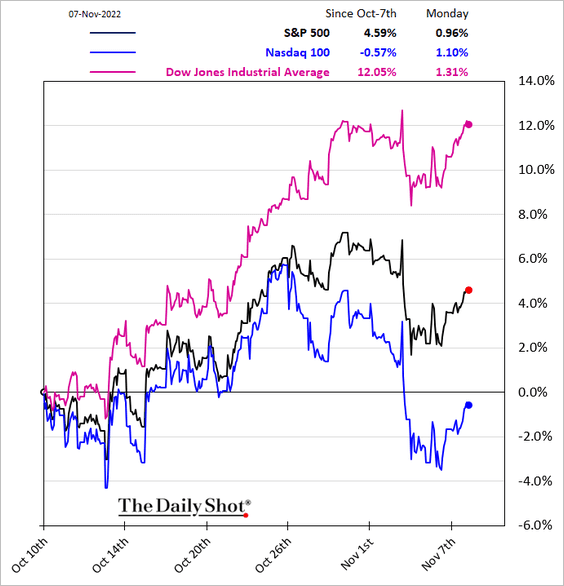
… as growth shares lag.
——————–
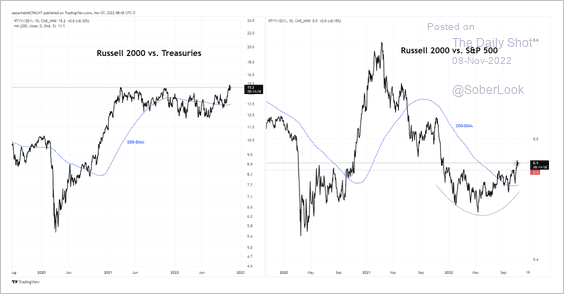
2. The Russell 2,000 small-cap index is strengthening versus large-caps and Treasuries.
 Source: Aazan Habib, Paradigm Capital
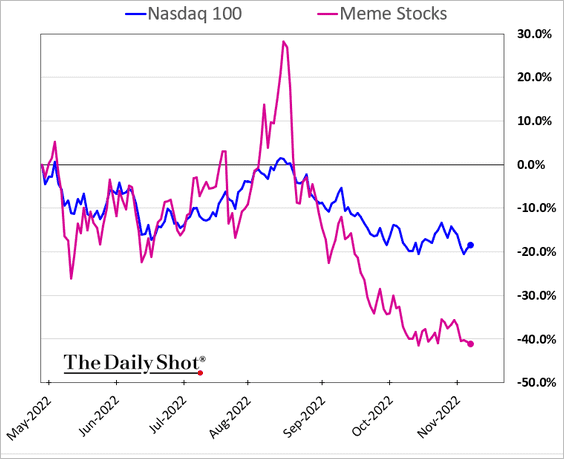
3. The Reddit crowd’s attempt to stage a meme comeback in August didn’t end well.
4. The current equity risk premium points to weak long-term market performance relative to Treasuries.
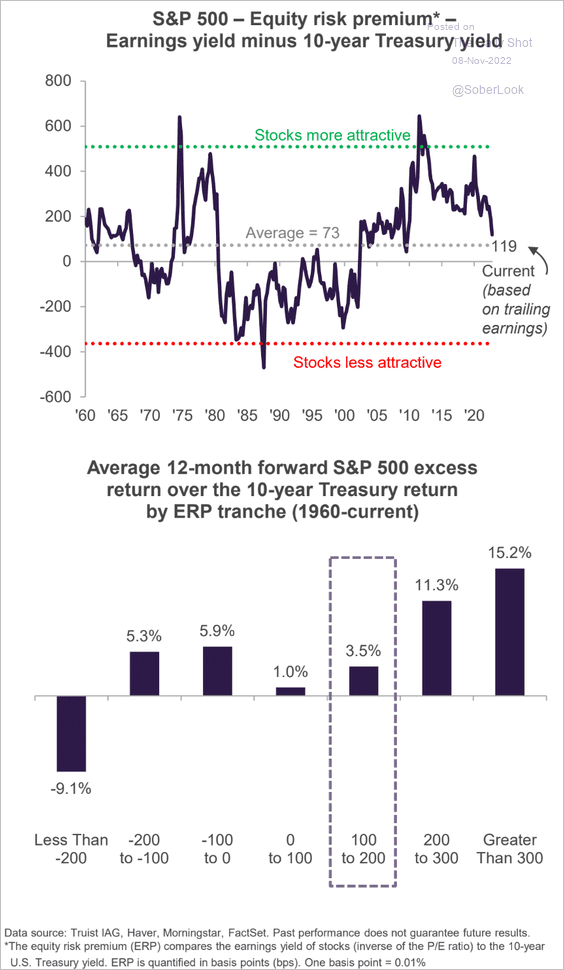 Source: Truist Advisory Services
5. This figure shows the risk/return profile by sector based on the past three years.
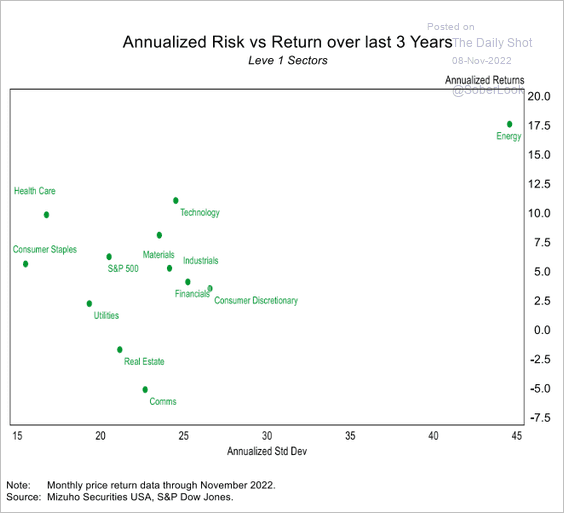 Source: Mizuho Securities USA
6. US bank net interest margins are starting to recover despite increasingly inverted yield curves.
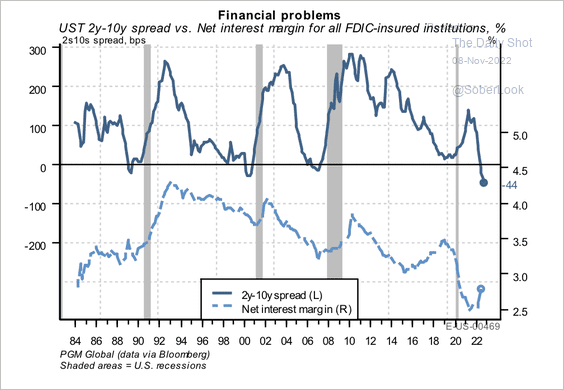 Source: PGM Global
7. Industrials have been outperforming.
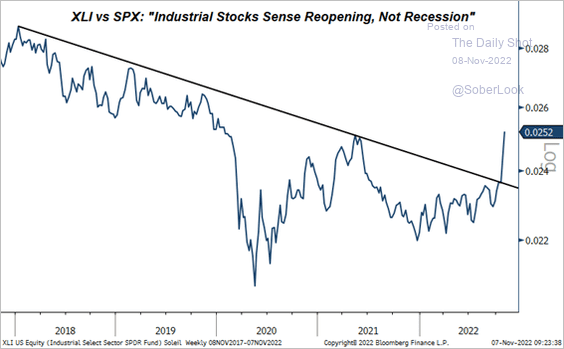 Source: Evercore ISI Research
8. The Treasury yield/equity correlation is likely to remain negative for some time, according to Deutsche Bank.
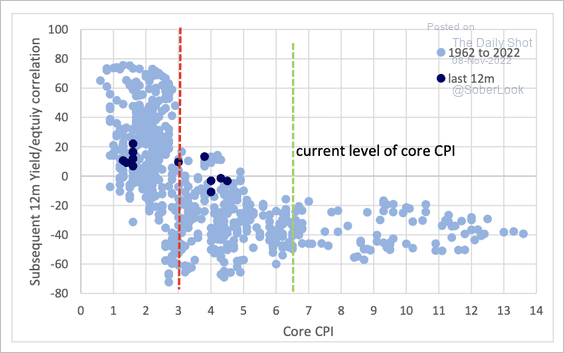 Source: Deutsche Bank Research
9. The S&P 500 skew is near multi-decade lows.
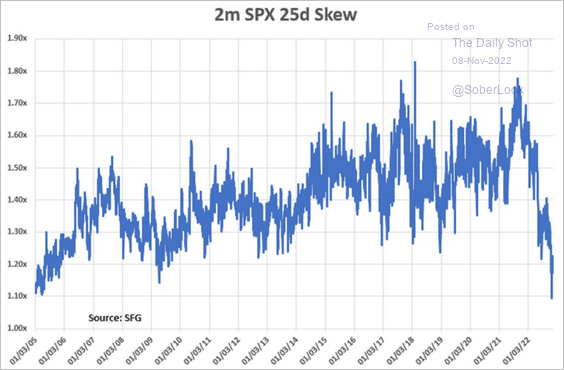 Source: Chris Murphy, Susquehanna International Group
10. VIX has diverged from the S&P 500 again.
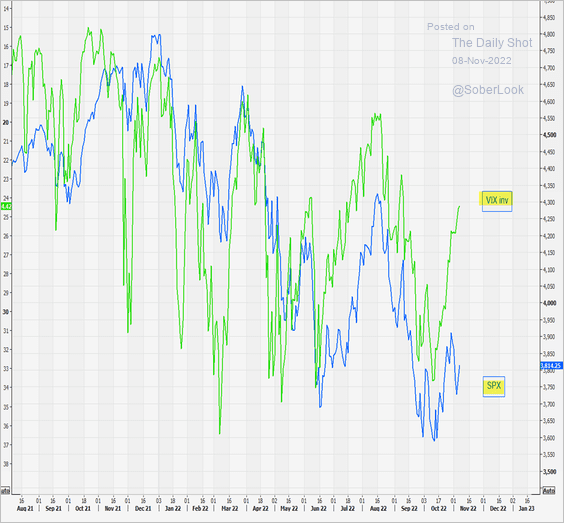 Source: @themarketear
Back to Index
Alternatives
1. US university endowments have faced recent losses. High exposure to venture capital helped some endowments outperform in prior years but has now become a drag on returns, according to PitchBook.
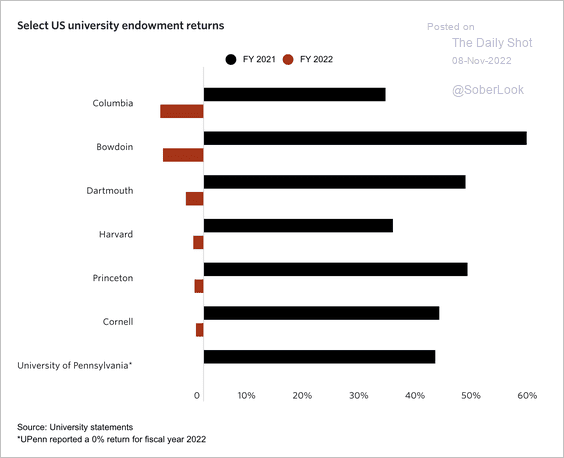 Source: PitchBook Read full article
2. Private funds’ capital calls have been outpacing distributions, which could force investors to sell liquid assets.
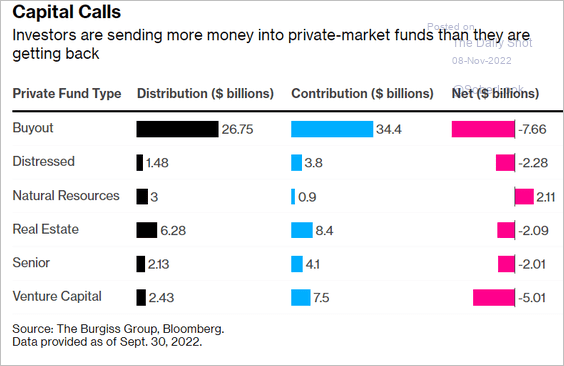 Source: @markets, @SofiaHCBBG, @richhend Read full article
3. Overall, hedge funds have declined less than equity, fixed income, and credit indices this year.
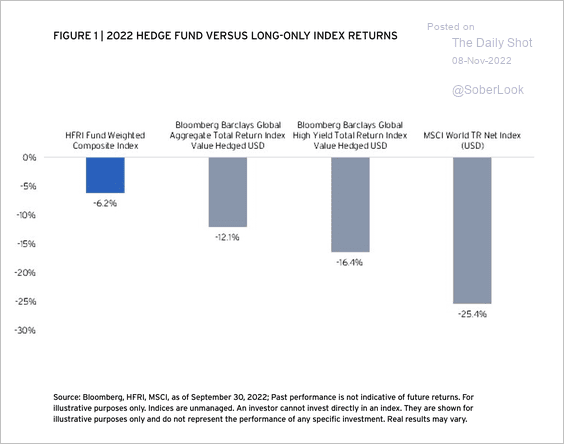 Source: Citi Private Bank
But there has been a significant dispersion in hedge fund strategy returns this year.
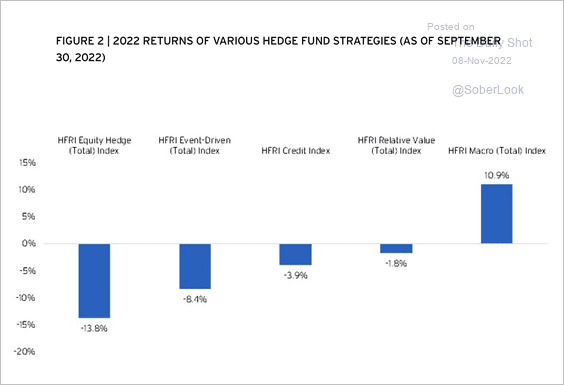 Source: Citi Private Bank
——————–
4. This chart shows gender representation in private equity.
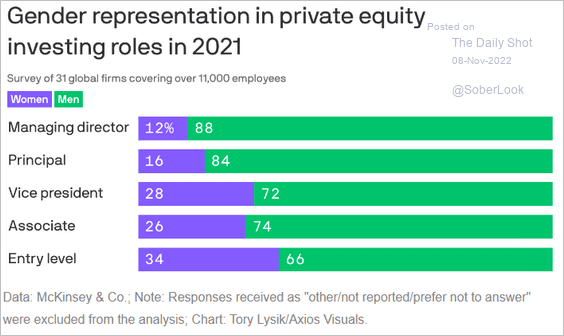 Source: @axios Read full article
Back to Index
Rates
1. Will Treasury yields face downside pressure as the economy slows?
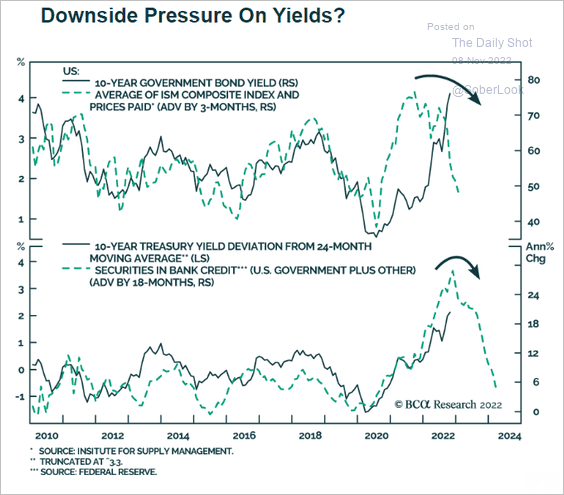 Source: BCA Research
2. Treasury implied volatility declined sharply last week.
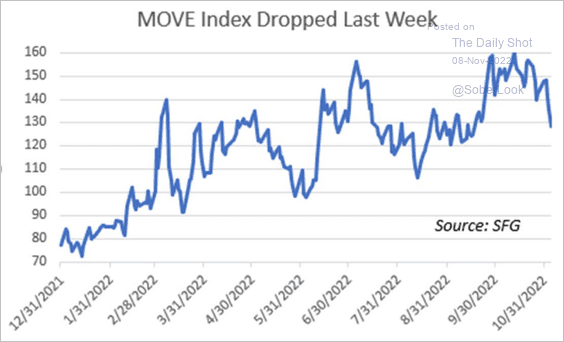 Source: Chris Murphy, Susquehanna International Group
Back to Index
Global Developments
1. What’s next for the US dollar?
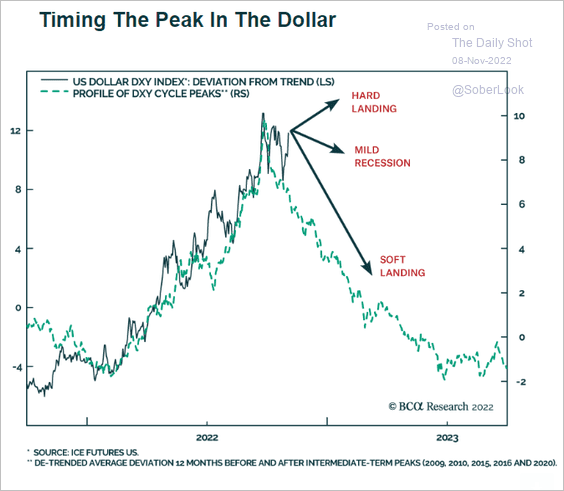 Source: BCA Research
2. Economic activity has slowed sharply around the world.
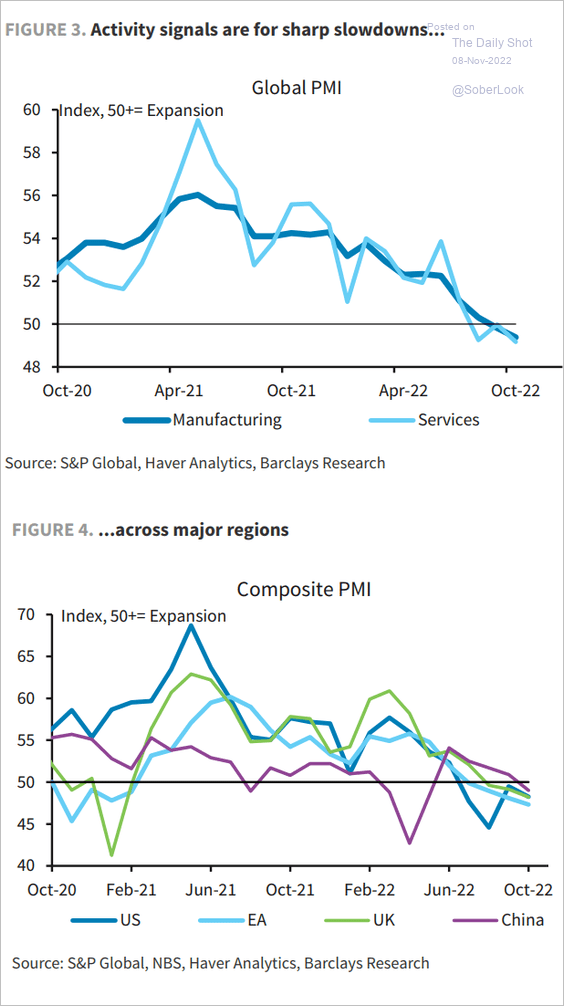 Source: Barclays Research
3. This chart shows central bank assets relative to GDP.
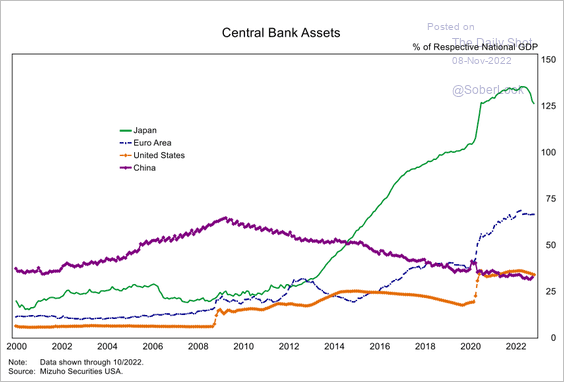 Source: Mizuho Securities USA
4. Here is a look at global wealth per capita by region.
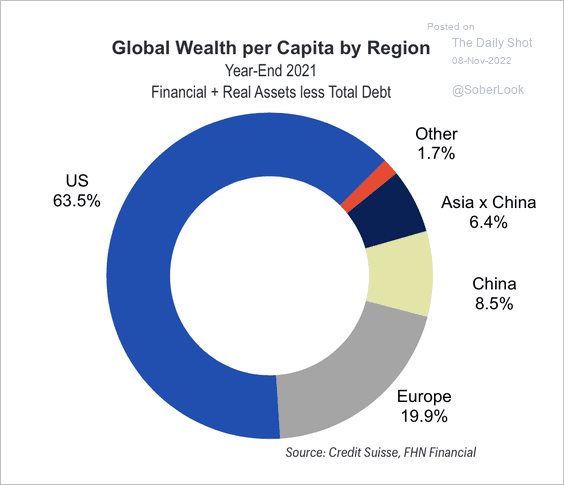 Source: FHN Financial
5. Yields have increased amid slowing economic growth, which is negative for earnings.
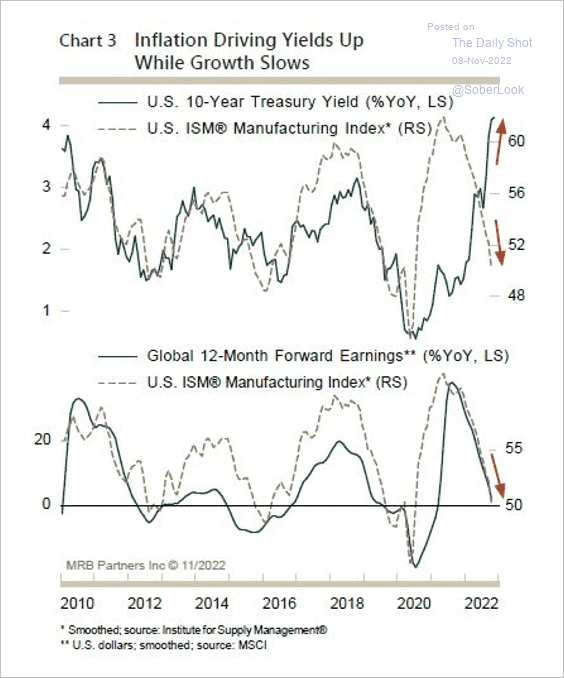 Source: MRB Partners
——————–
Food for Thought
1. US federal government’s net interest paid:
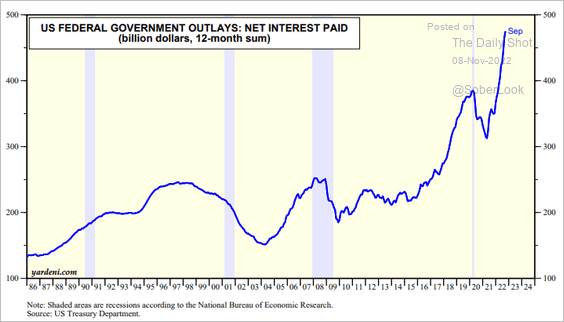 Source: Yardeni Research
2. Further deterioration in student test scores in the US (3 charts):
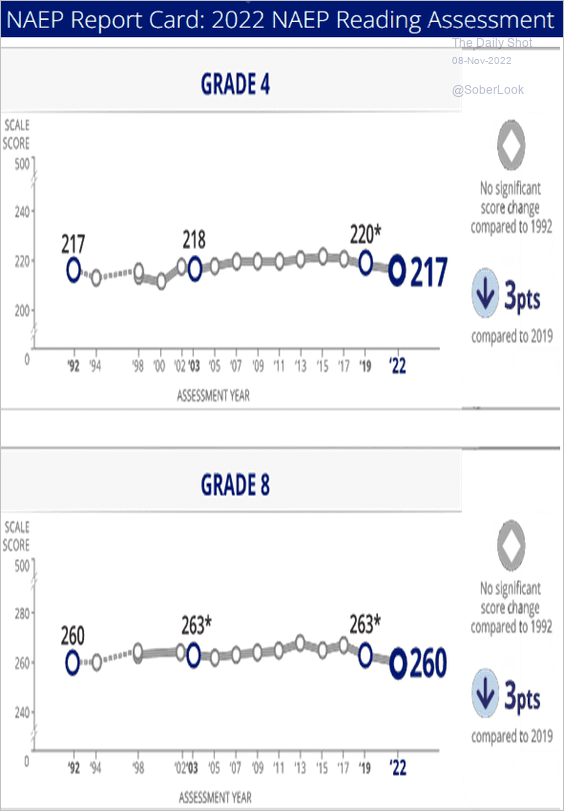 Source: The Nation’s Report Card Further reading
 Source: The Nation’s Report Card Further reading
 Source: Statista
——————–
3. The midterm election megadonors (2 charts):
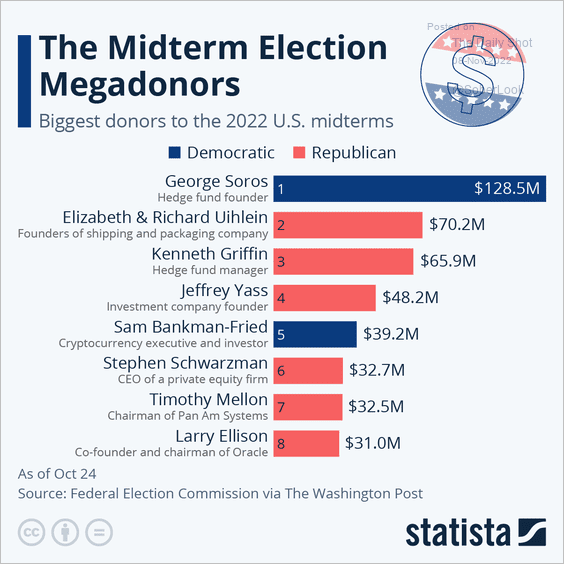 Source: Statista
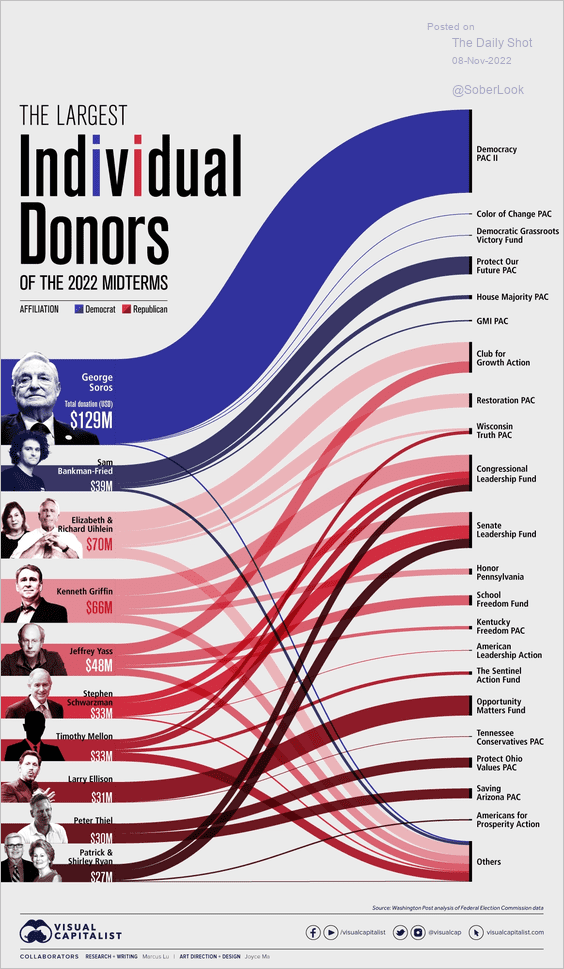 Source: Visual Capitalist
——————–
4. US political party identification:
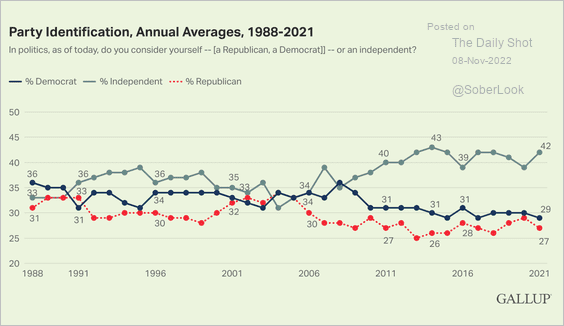 Source: Gallup Read full article
5. Getting news on TikTok:
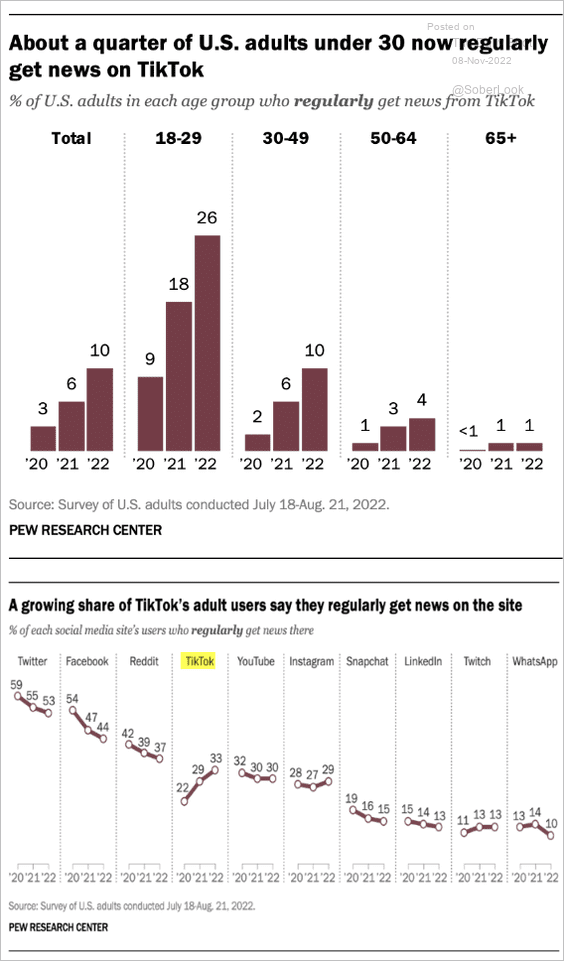 Source: Pew Research Center Read full article
6. Netflix subscriber growth:
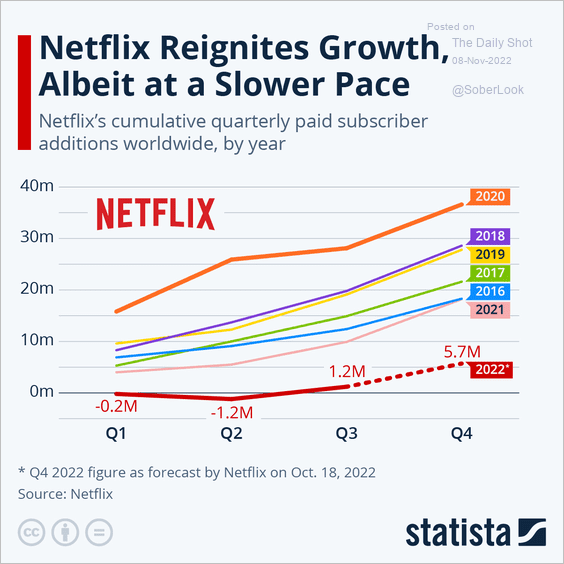 Source: Statista
7. Squid Game projected revenue:
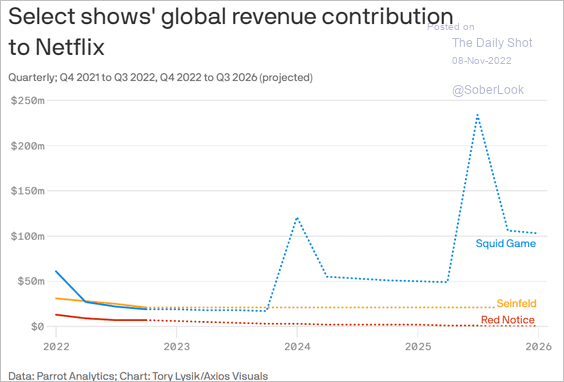 Source: @axios Read full article
——————–
Back to Index