The Daily Shot: 30-Nov-22
• The United States
• Canada
• The United Kingdom
• The Eurozone
• Europe
• Asia – Pacific
• China
• Emerging Markets
• Cryptocurrency
• Energy
• Equities
• Alternatives
• Credit
• Rates
• Global Developments
• Food for Thought
The United States
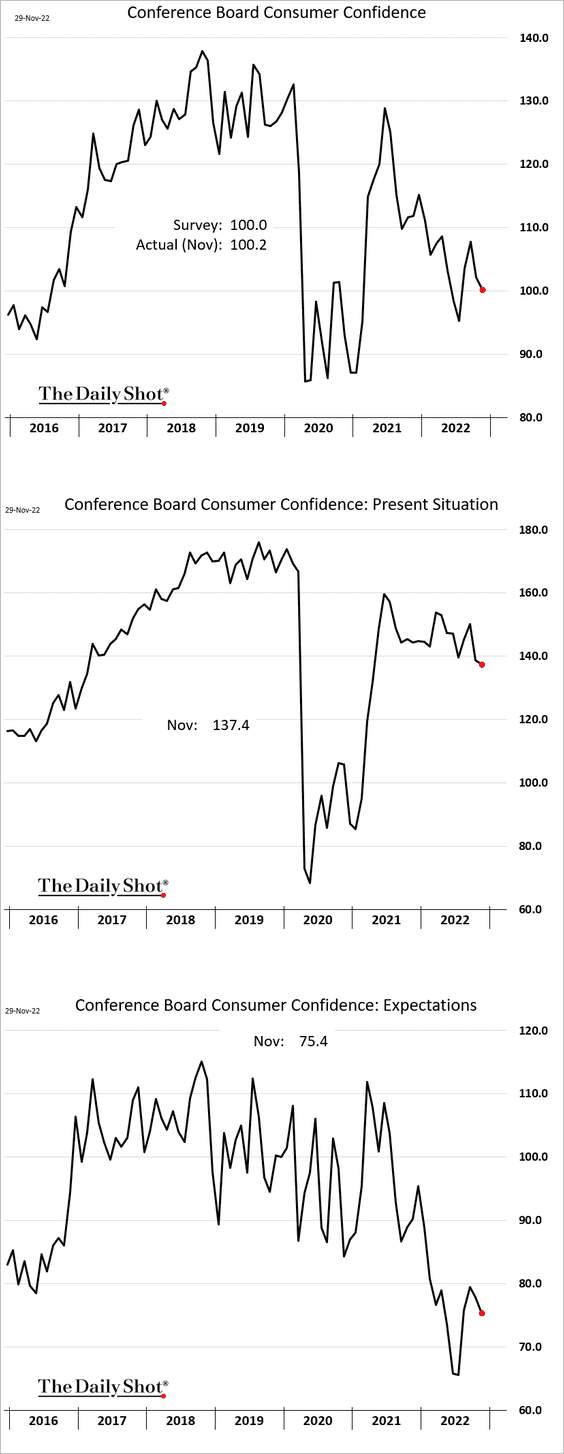
1. The Conference Board’s consumer sentiment index declined this month.
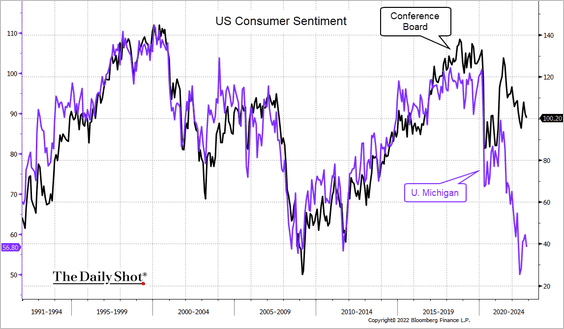
• The gap versus the U. Michigan indicator remains near record levels, …
 Source: @TheTerminal, Bloomberg Finance L.P.
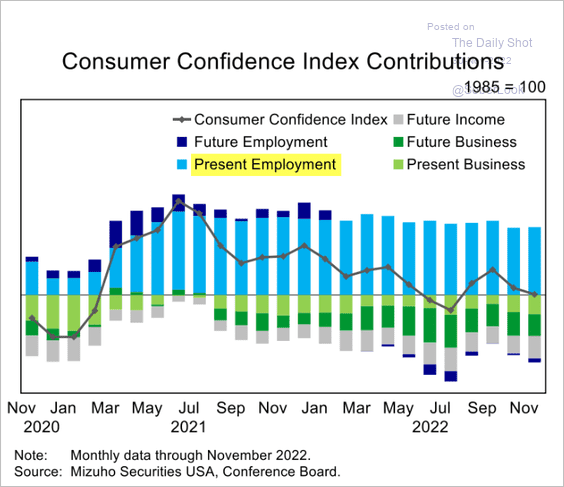
… with the labor market strength supporting the Conference Board’s index.
 Source: Mizuho Securities USA
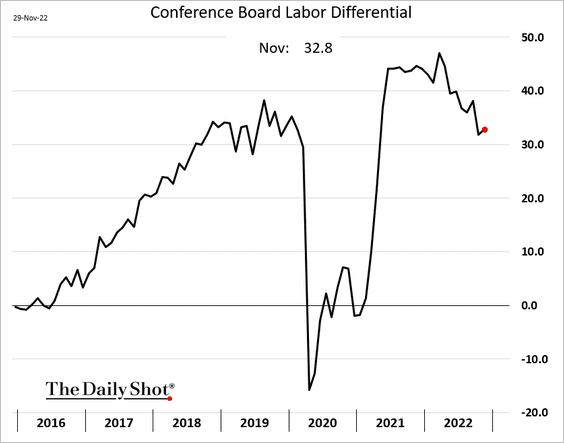
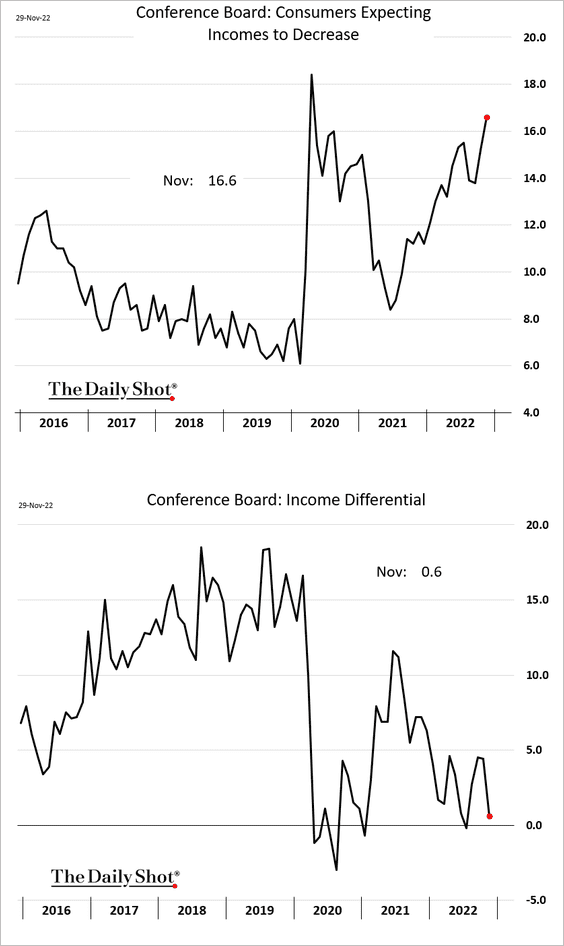
• The labor differential (“jobs plentiful” – “jobs hard to get”) is holding up – an indication that further Fed tightening may be required to balance the labor market.
• More households expect lower incomes ahead.
• The spread between the expectations and current conditions indicators is starting to rise, which usually signals a recession.
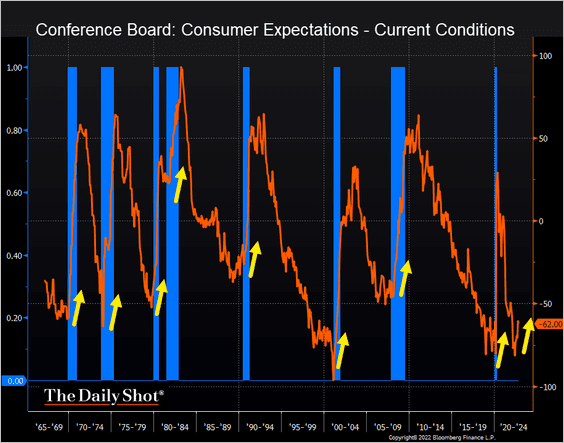 Source: @TheTerminal, Bloomberg Finance L.P.
However, the yield curve has not started steepening.
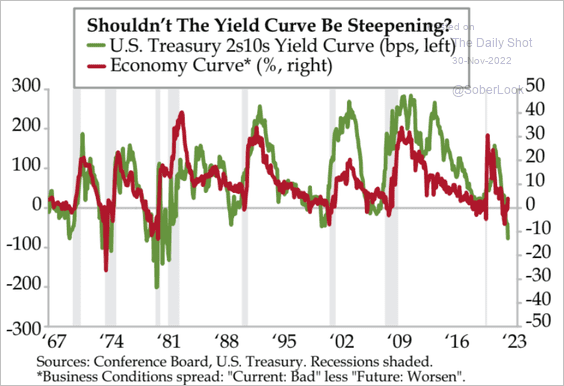 Source: Quill Intelligence
——————–
2. Here are some updates on the housing market.
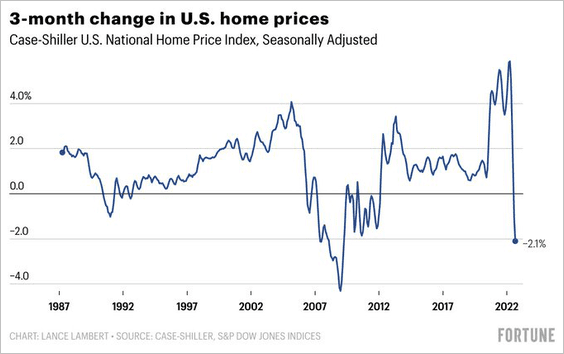
• Home prices declined again in September (which we knew from other indicators).
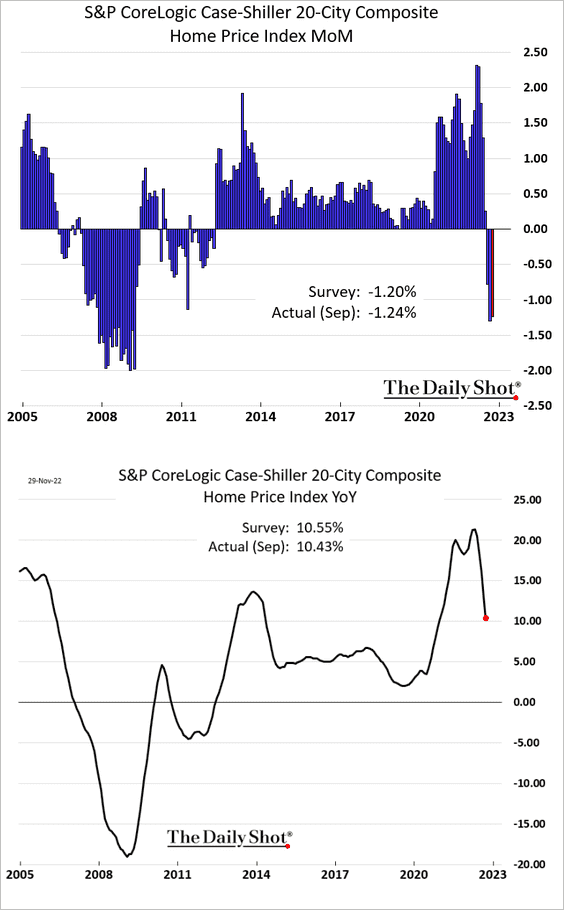
Here is the 3-month change in home prices.
 Source: @NewsLambert
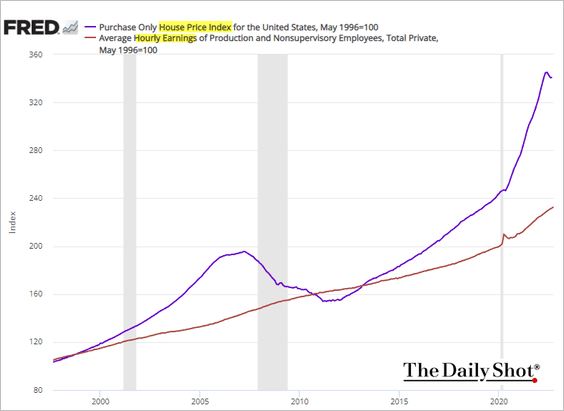
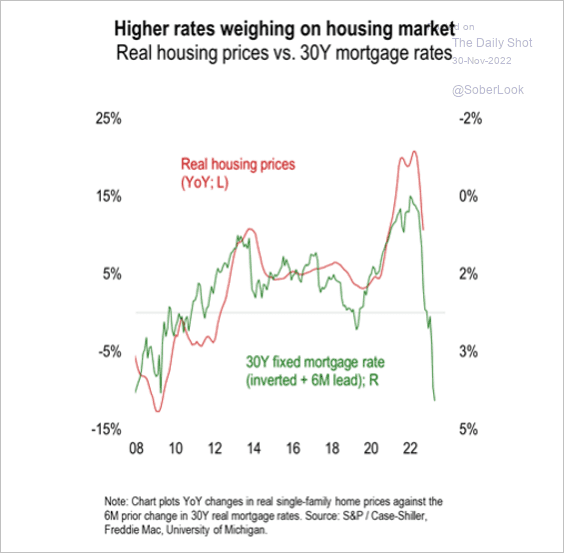
And there is more to go (2 charts).
 Source: Numera Analytics (@NumeraAnalytics)
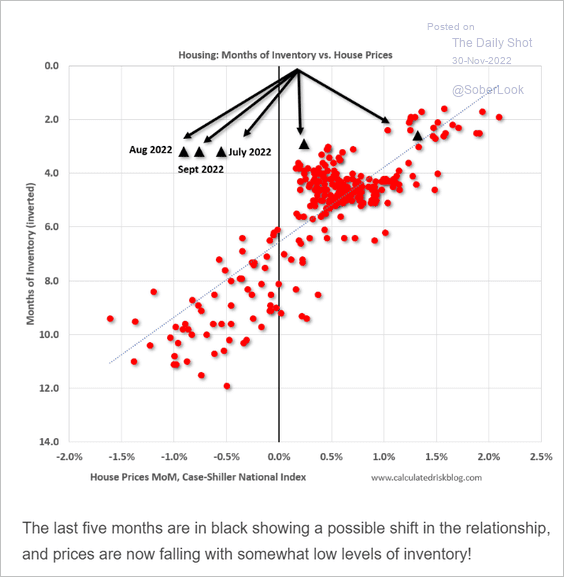
• Prices are falling despite low inventories (see comment from Bill McBride below).
 Source: Calculated Risk
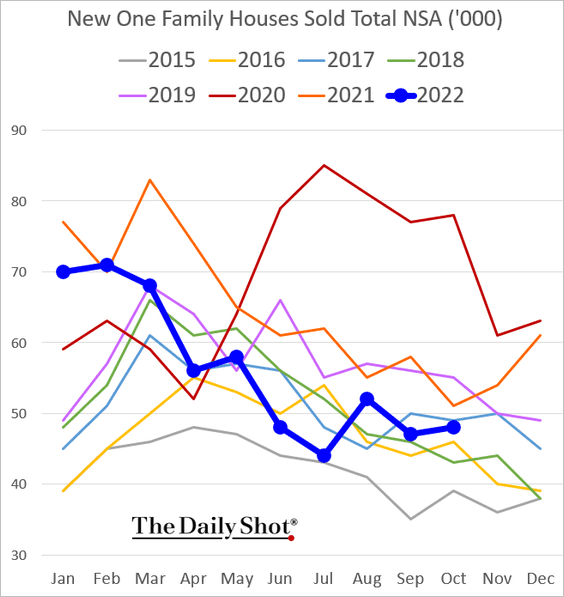
• New home sales held up in October.
 Source: FOX Business Read full article
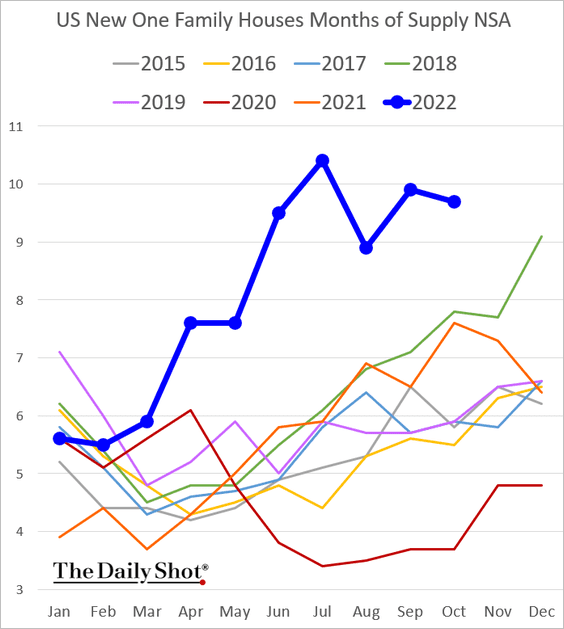
• Inventories of new homes remain elevated.
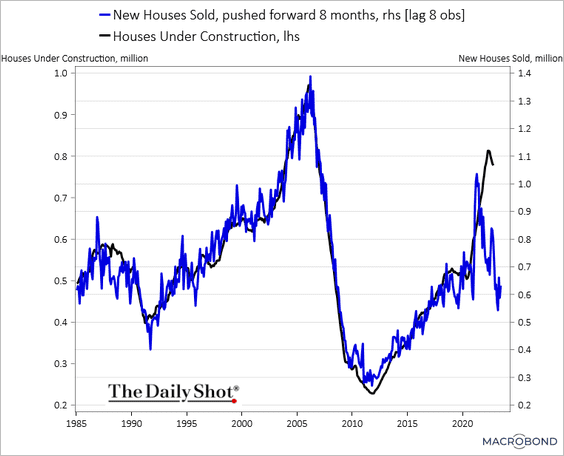
• Construction activity will decline after the backlog dwindles.
 Source: Chart and data provided by Macrobond
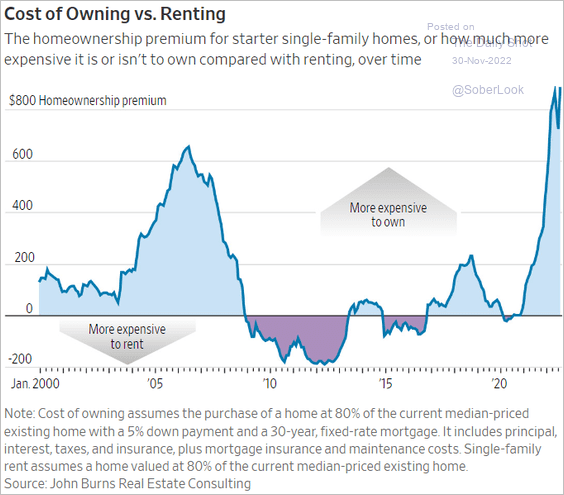
• Own or rent?
 Source: @WSJ Read full article
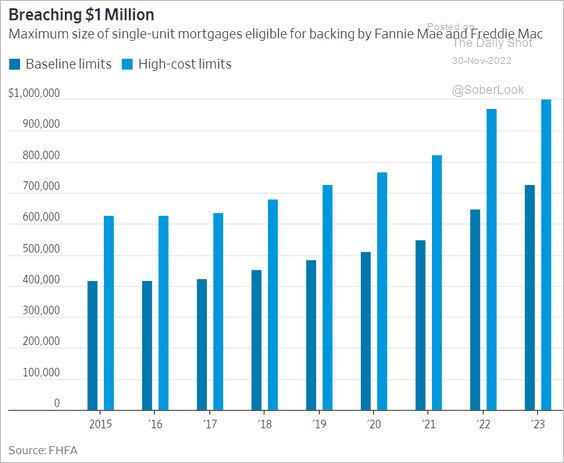
• One million dollar mortgages in high-cost areas will now qualify for backing by Fannie Mae and Freddie Mac.
 Source: @WSJ Read full article
——————–
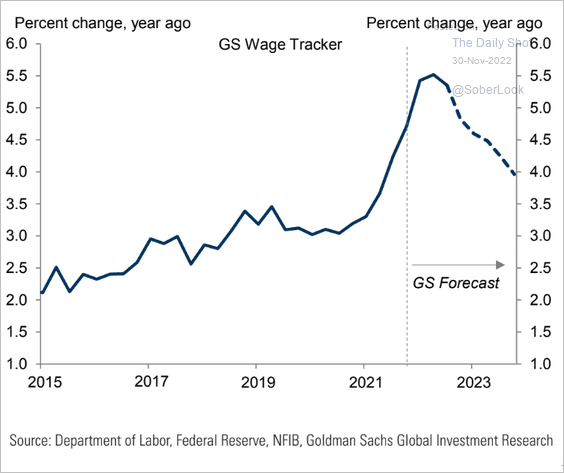
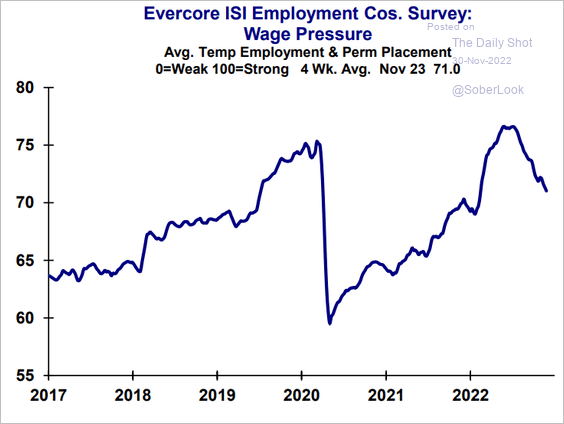
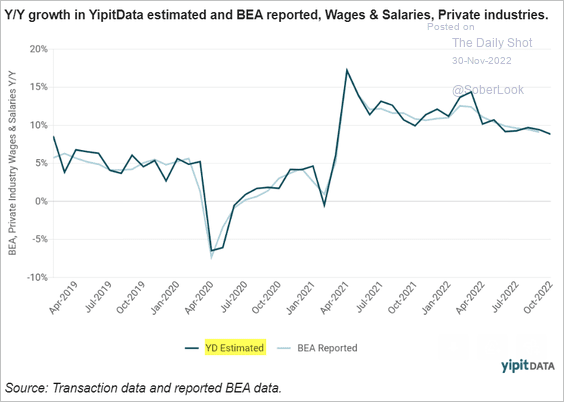
3. Next, we have some updates on wage pressures.
• Wage growth is yet to peak, according to Goldman.
 Source: Goldman Sachs
• Here is the Evercore ISI index of wage pressures.
 Source: Evercore ISI Research
• YipitData estimates show a further slowdown in wage growth in the first half of the month. The deceleration remains very gradual.
 Source: YipitData
——————–
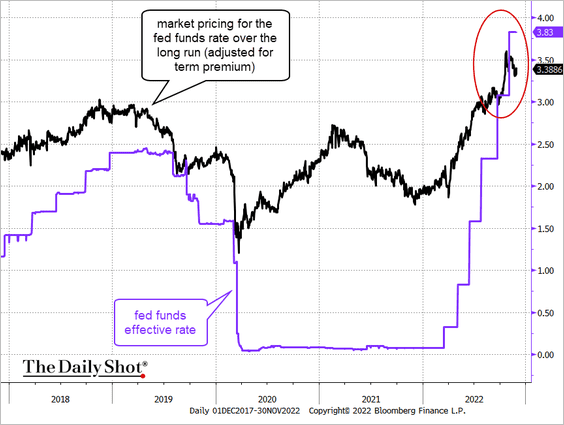
4. The current fed funds rate is mildly restrictive, according to market pricing.
 Source: @TheTerminal, Bloomberg Finance L.P.
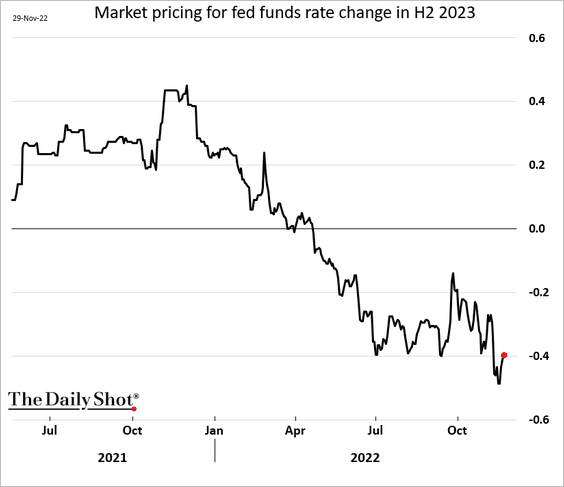
• The market is still pricing rate cuts in the second half of next year.
——————–
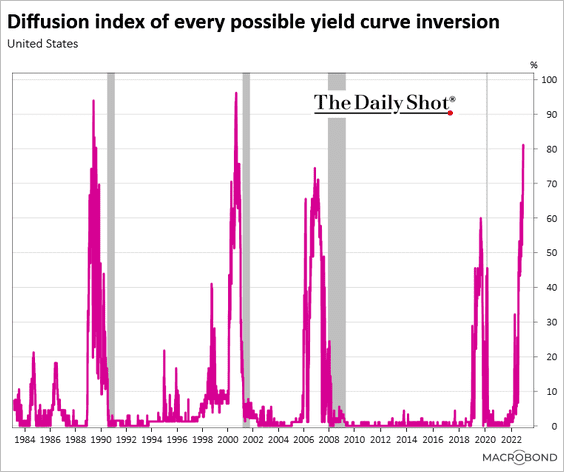
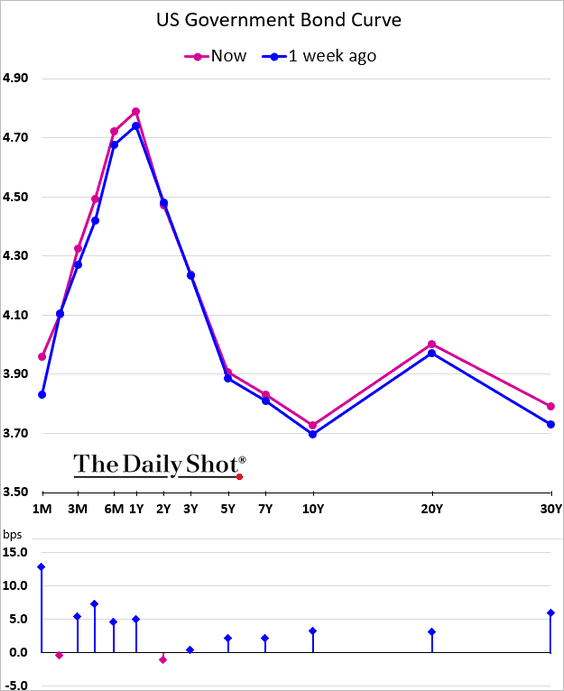
5. Over 80% of the Treasury curve is now inverted.
 Source: Chart and data provided by Macrobond
Back to Index
Canada
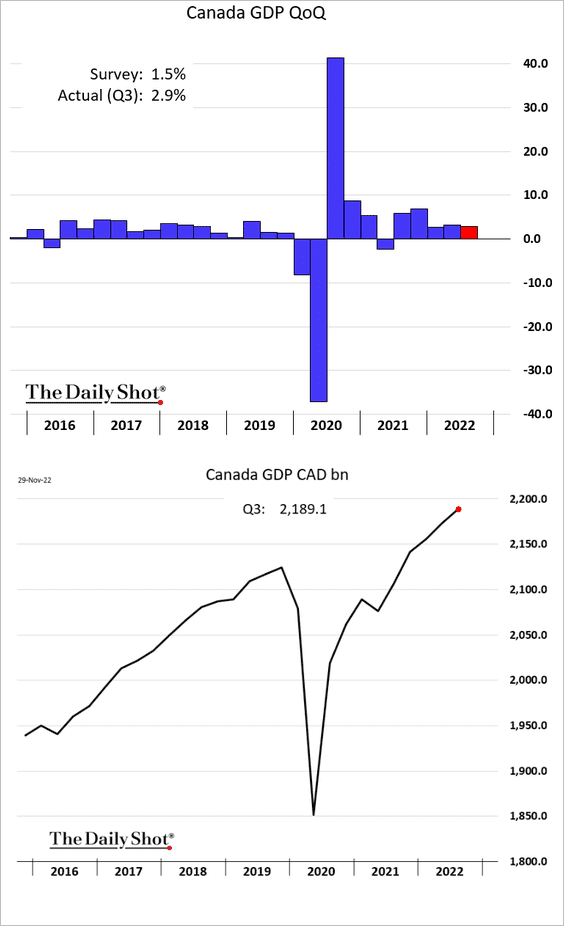
1. The Q3 GDP growth topped expectations.
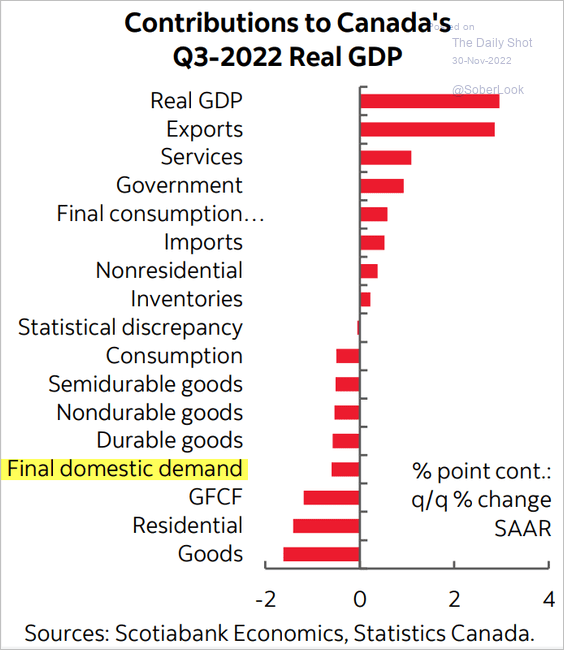
But domestic demand declined.
 Source: Scotiabank Economics
——————–
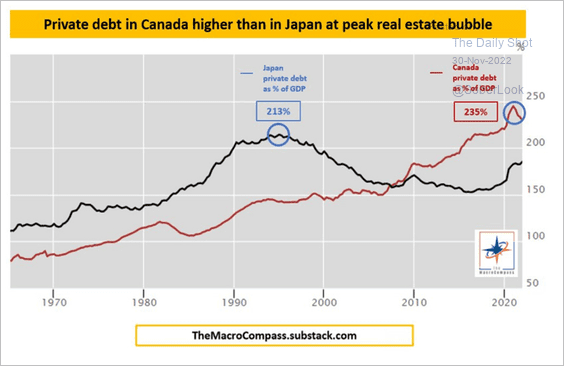
2. Private debt levels are very high.
 Source: @MacroAlf
Back to Index
The United Kingdom
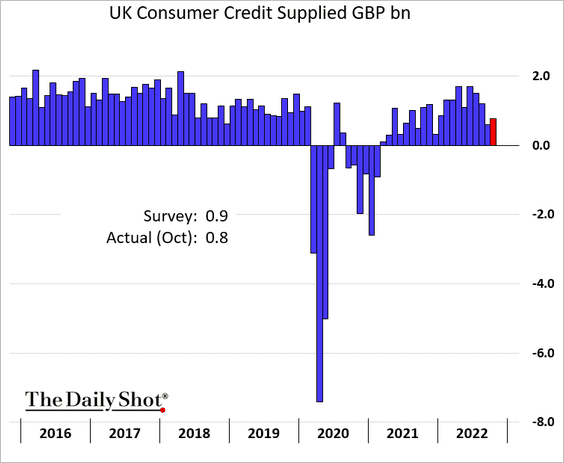
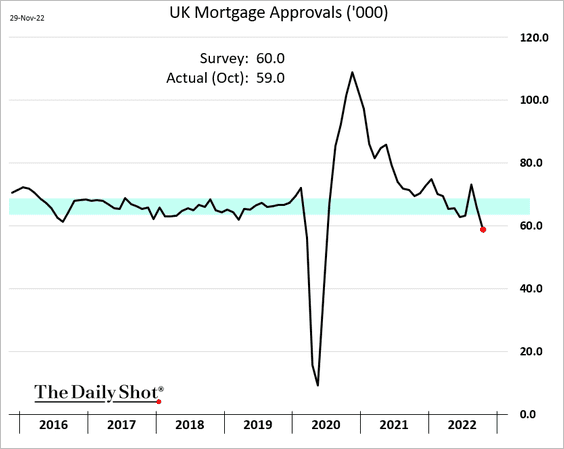
1. Consumer credit growth is holding up.
But mortgage approvals dipped below pre-COVID levels.
——————–
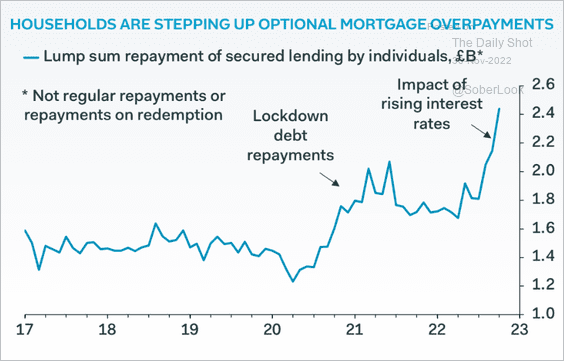
2. Households are increasingly paying down their mortgages amid higher rates.
 Source: Pantheon Macroeconomics
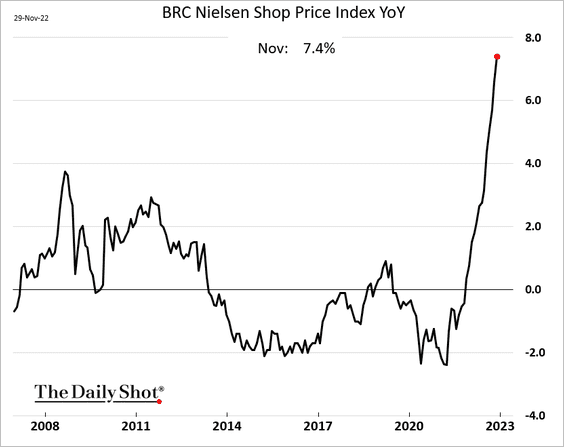
3. Retail inflation remains punishingly high.
 Source: BRC Read full article
——————–
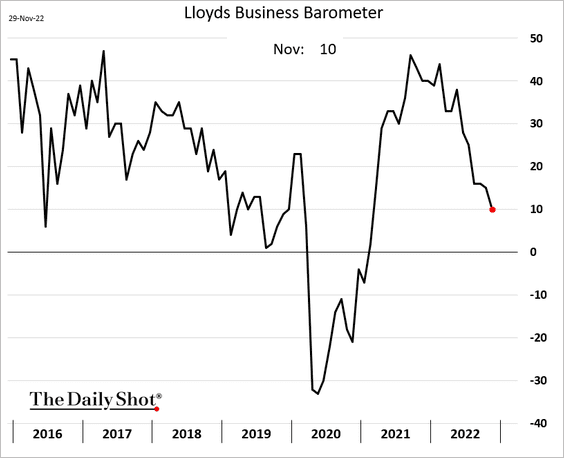
4. The Lloyds business sentiment index continues to sink.
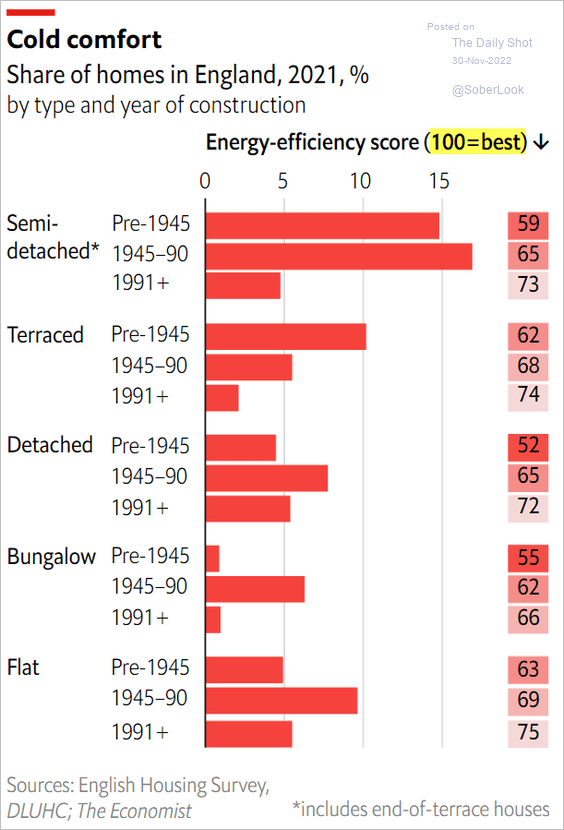
5. This chart shows energy-efficiency scores in the UK.
 Source: The Economist Read full article
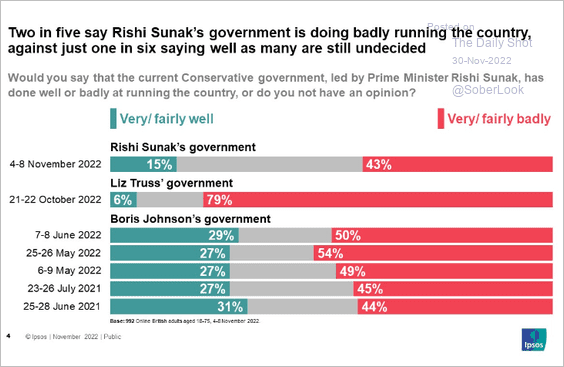
6. Finally, we have government job approval ratings.
 Source: Ipsos Read full article
Back to Index
The Eurozone
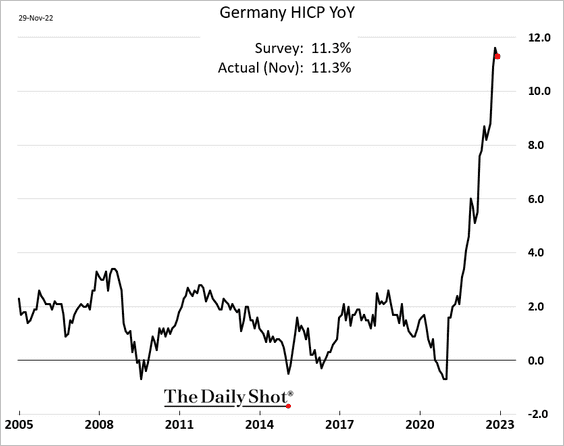
1. Germany’s inflation edged lower this month.
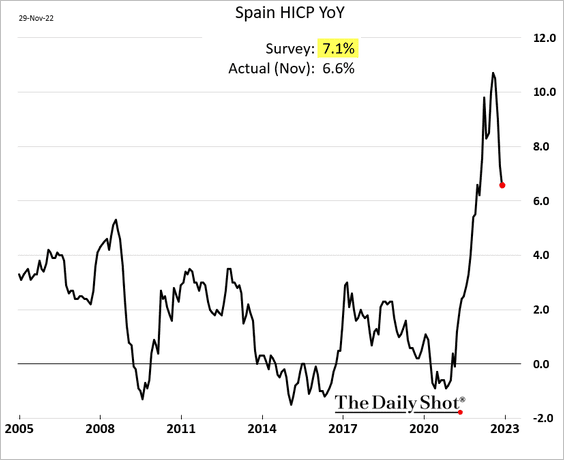
• Spain’s CPI is falling rapidly.
Here is Spain’s PPI.
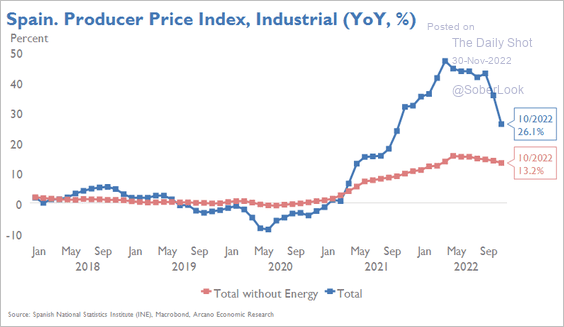 Source: Arcano Economics
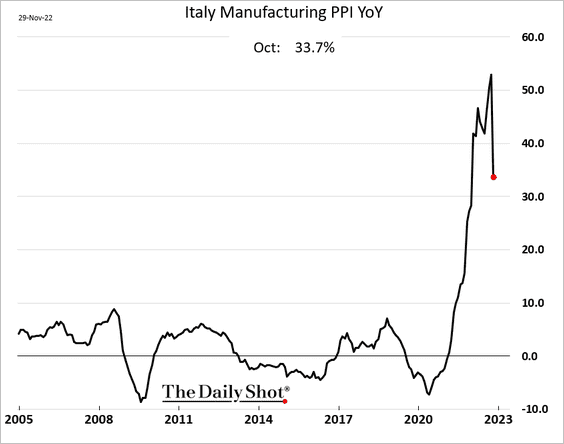
• Italy’s PPI is also declining.
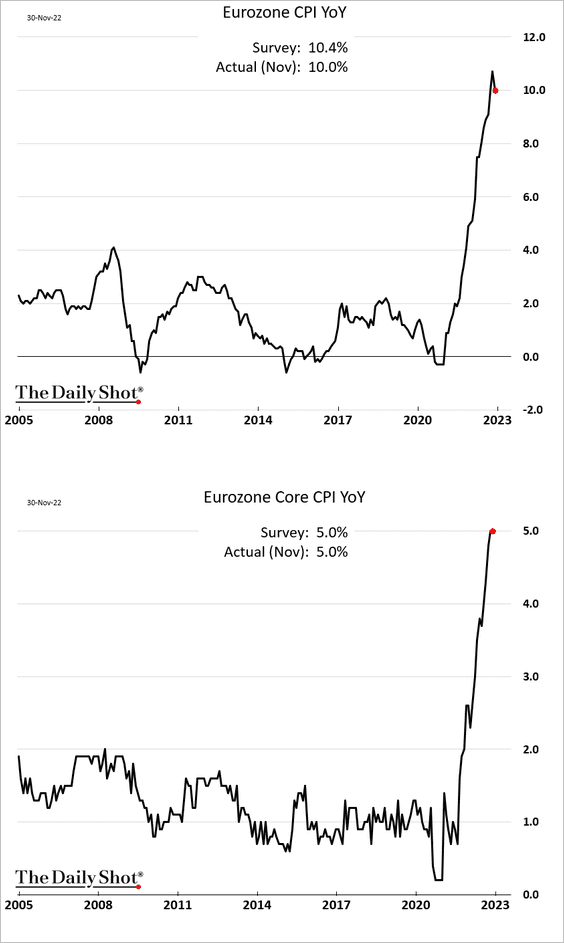
• Inflation slowed a bit at the Eurozone level, but the core CPI is holding at 5%.
——————–
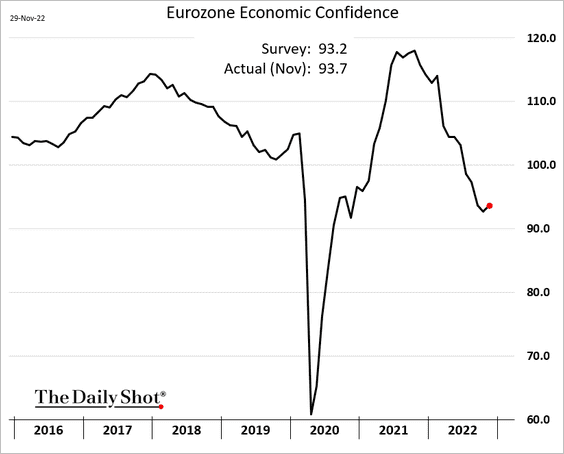
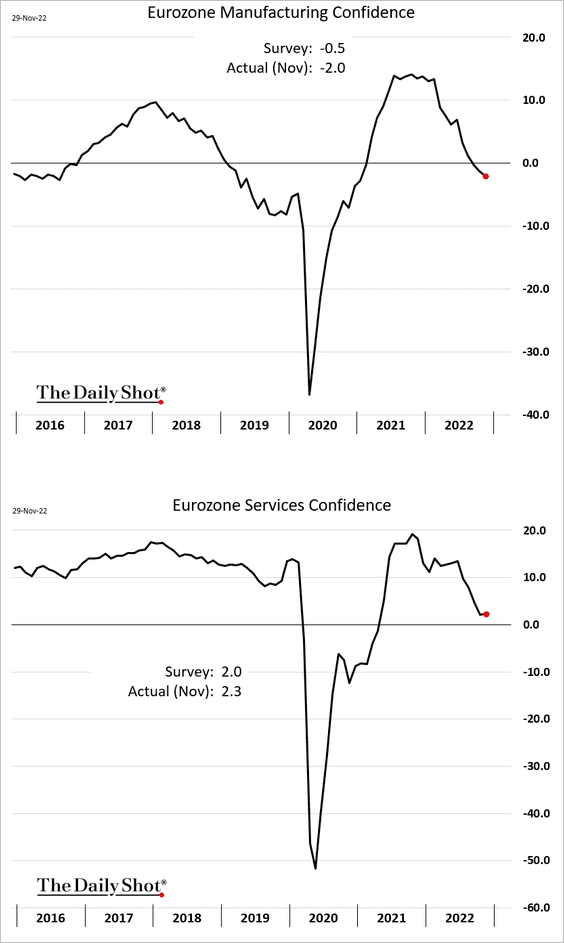
2. Economic confidence ticked higher due to a modest improvement in consumer sentiment.
Here are the euro-area business confidence indicators.
——————–
3. Eurozone bank non-performing loans (NPLs) are still far from the recessionary zone. However, Deutsche Bank expects NPLs to rise next year as financial conditions tighten.
 Source: Deutsche Bank Research
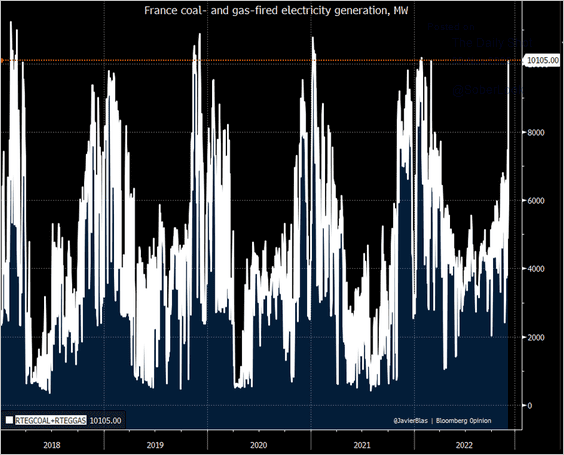
4. France is relying more on natural gas and coal to offset weak output from nuclear reactors.
 Source: @JavierBlas
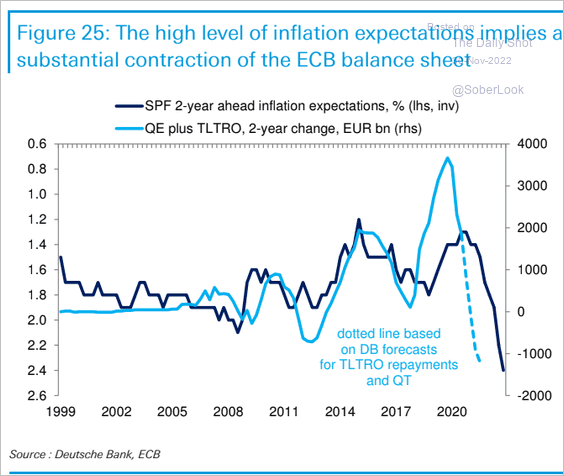
5. The Eurosystem balance sheet has plenty of room to shrink amid high inflation expectations.
 Source: Deutsche Bank Research
Back to Index
Europe
1. Let’s begin with Sweden
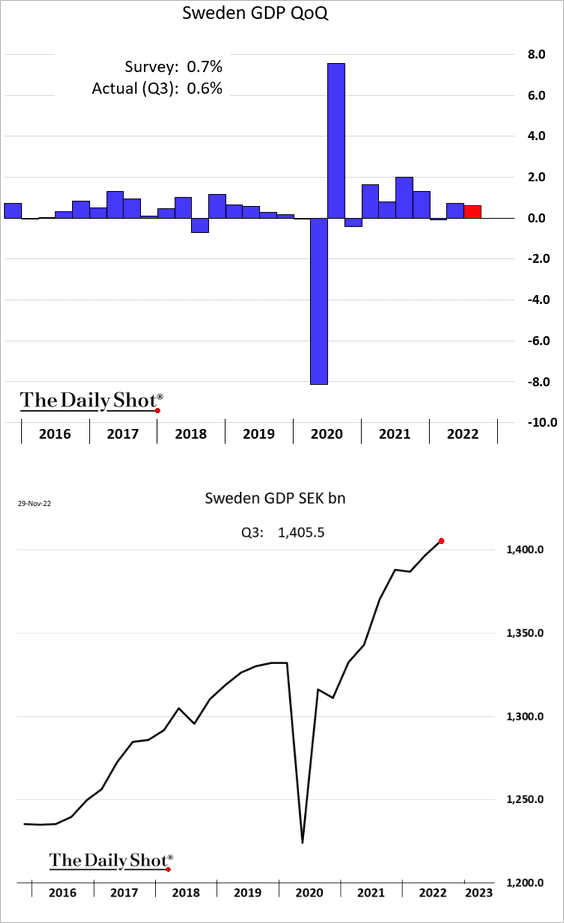
• The economy continued to grow in Q3.
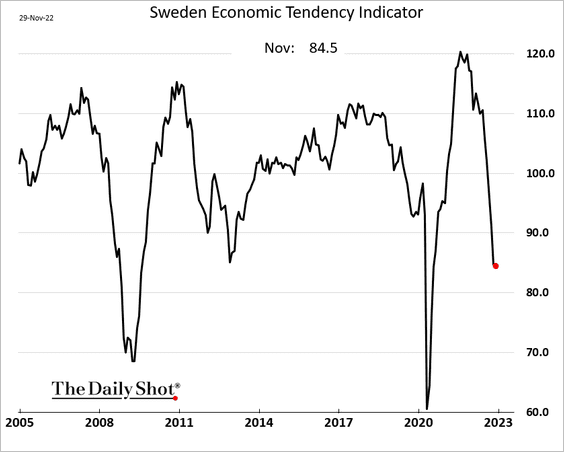
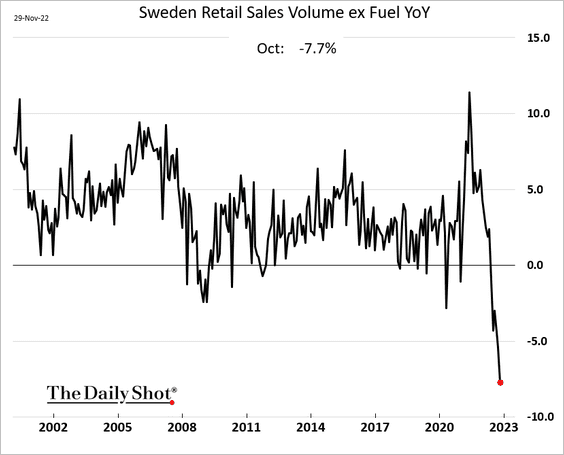
• But Sweden’s economic outlook darkened in Q4.
– Business and consumer sentiment:
– Retail sales (record year-over-year decline):
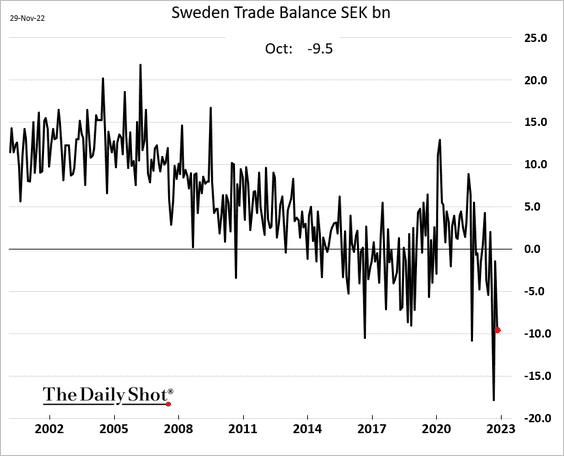
• The trade deficit remains elevated.
——————–
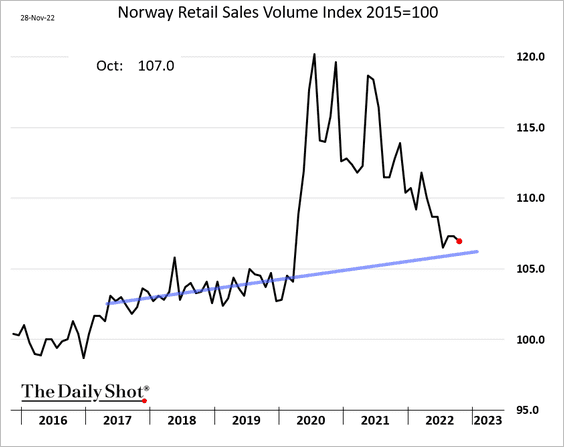
2. Norway’s retail sales are approaching the pre-COVID trend.
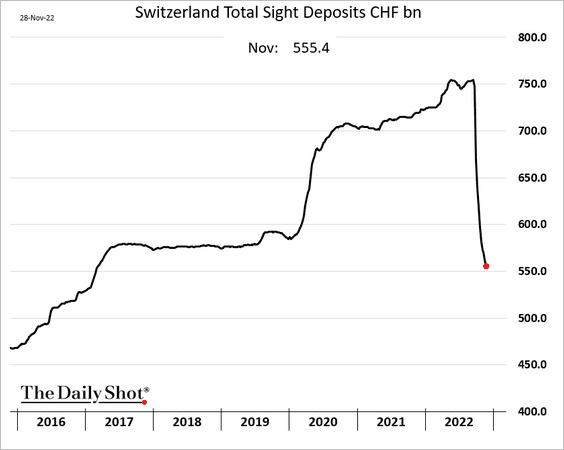
3. The Swiss central bank continues to remove liquidity from the market.
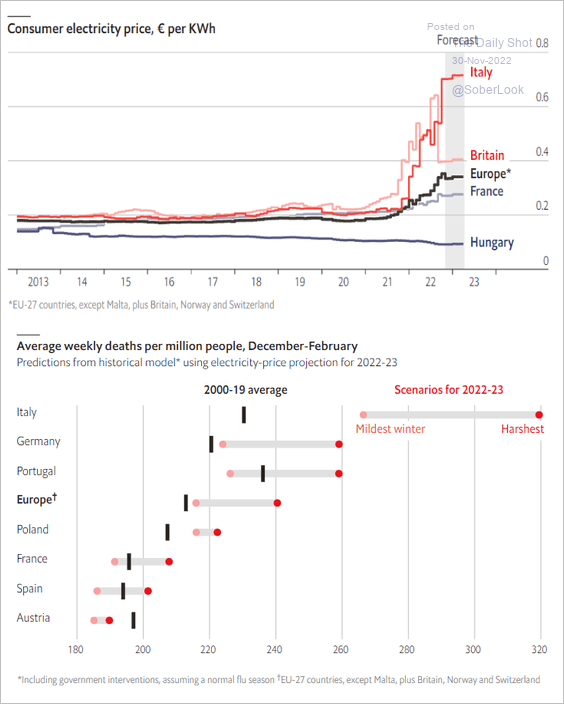
4. Europe is facing a challenging winter.
 Source: The Economist Read full article
Back to Index
Asia – Pacific
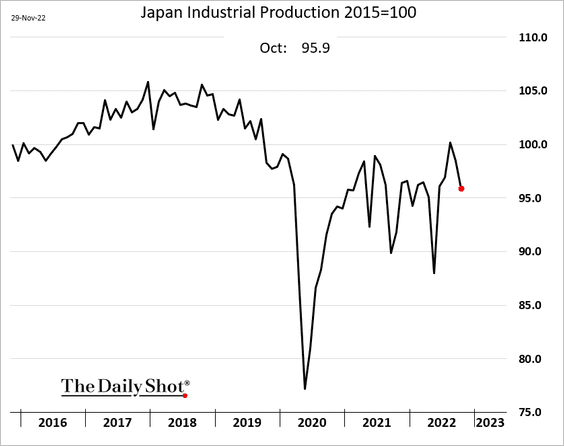
1. Japan’s industrial production declined in October.
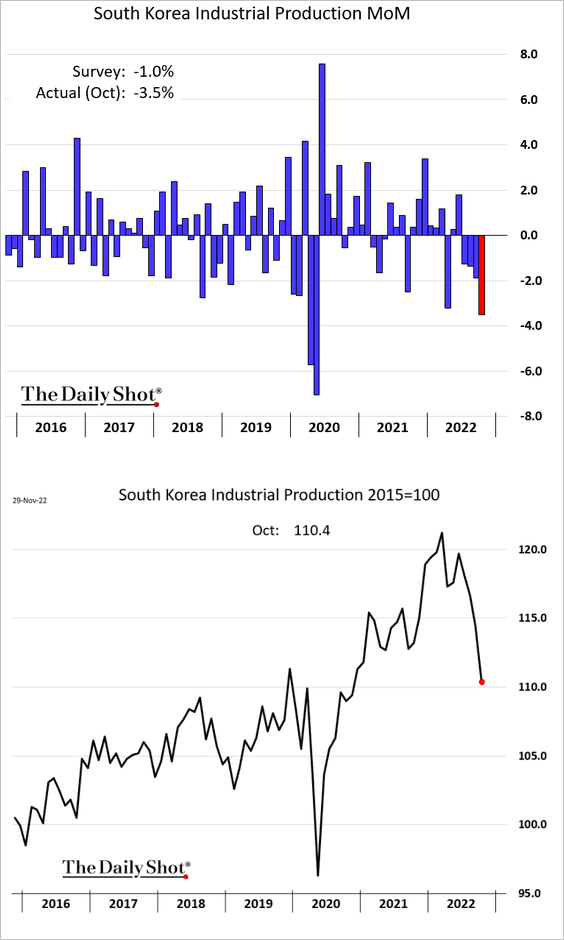
2. South Korea’s industrial production is tanking.
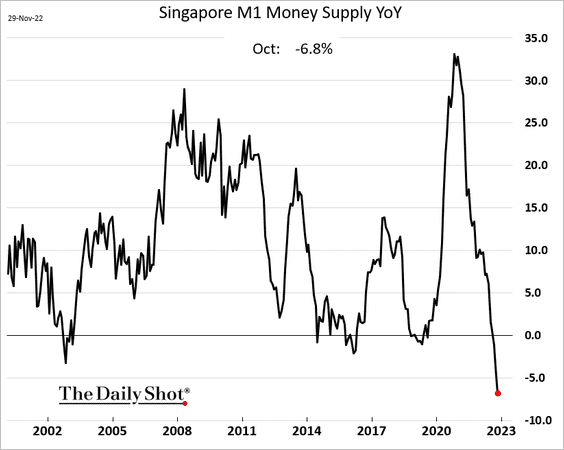
3. Singapore is facing a sharp drop in liquidity.
4. F/X reserves have decreased sharply across Asia.
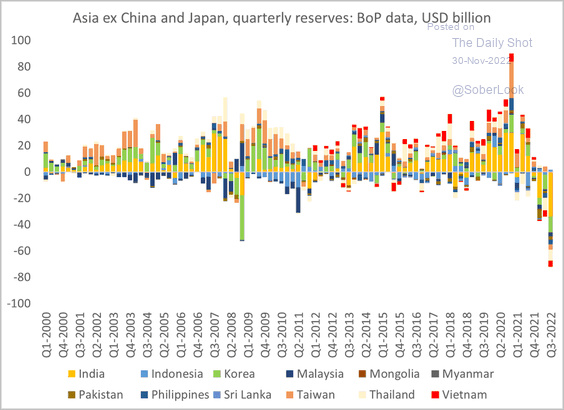 Source: @Brad_Setser Read full article
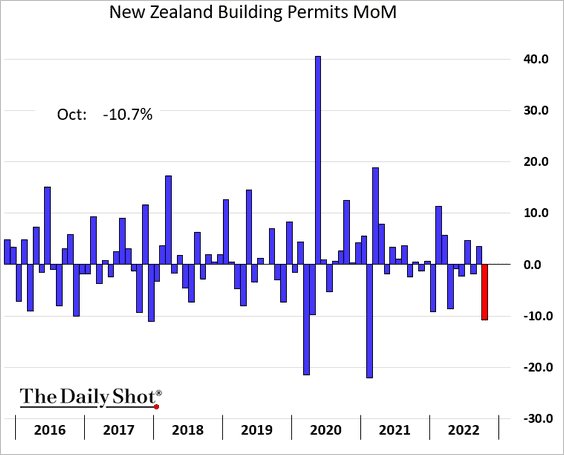
5. New Zealand’s building permits declined by almost 11% in October.
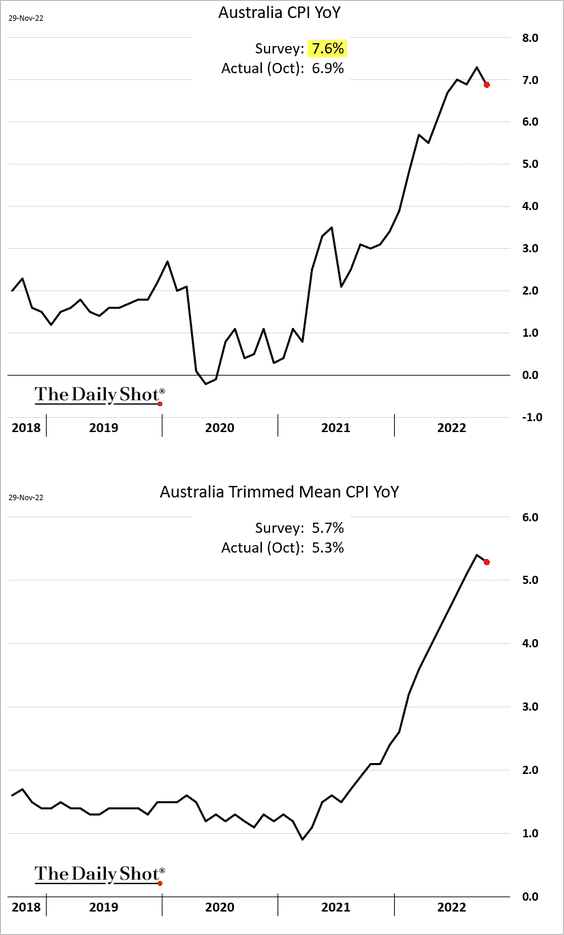
6. Next, we have some updates on Australia.
• The monthly CPI (which is an incomplete inflation index) seems to be peaking.
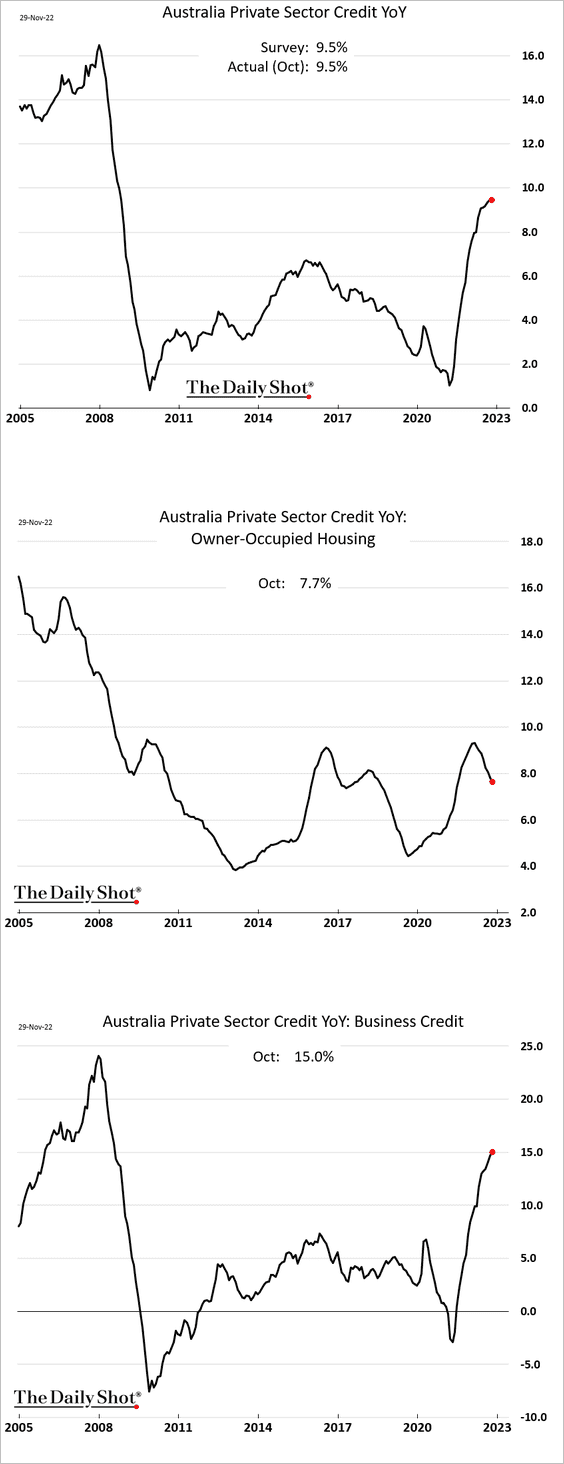
• Private-sector credit growth has been propped up by business lending.
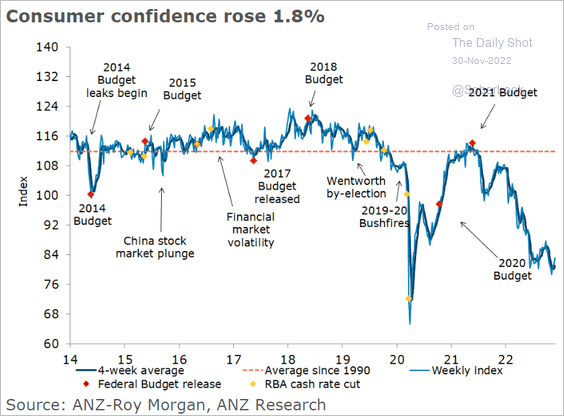
• Is consumer confidence finally stabilizing (at very low levels)?
 Source: @ANZ_Research
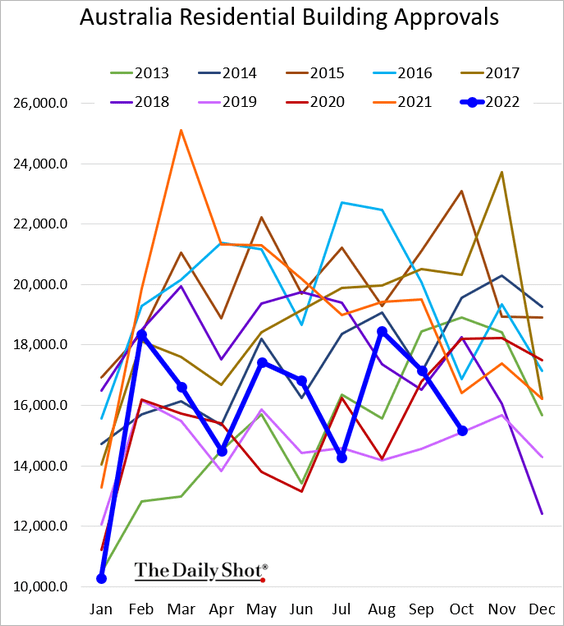
• Building approvals were soft in October.
Back to Index
China
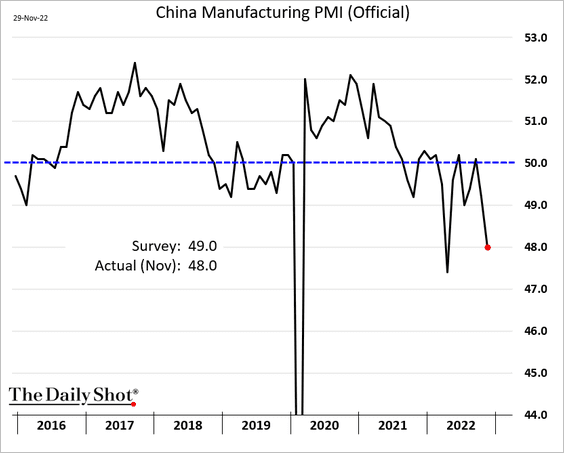
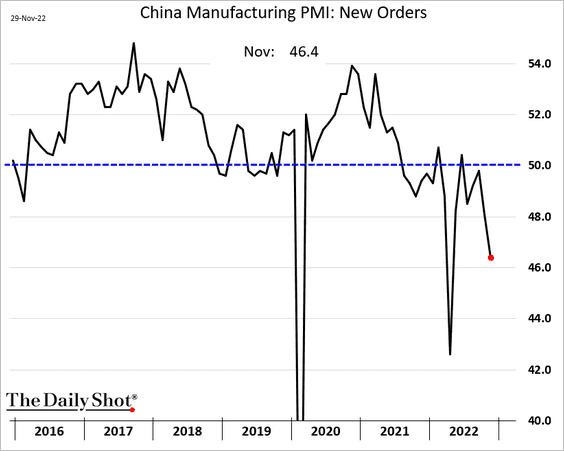
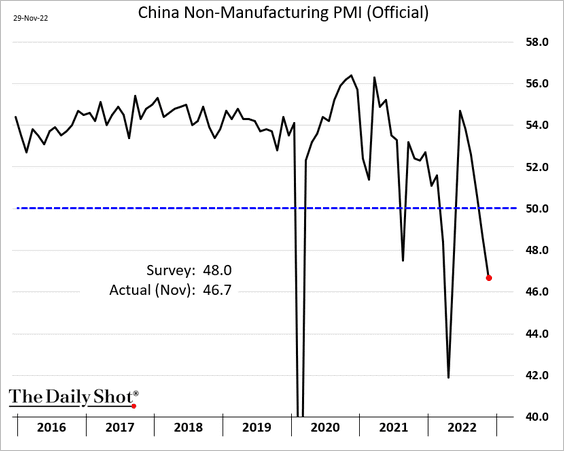
1. The official PMI report showed shrinking business activity this month.
• Manufacturing:
• Non-manufacturing:
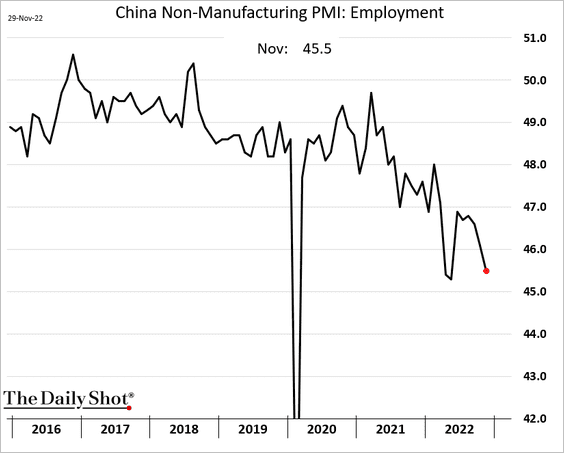
• Service-sector companies seem to be rapidly shedding jobs (which is adding to China’s social unrest).
 Source: @WSJ Read full article
——————–
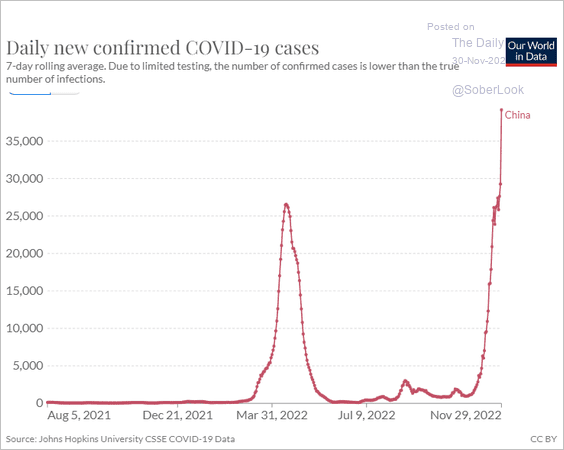
2. New COVID cases continue to hit record highs.
 Source: Our World in Data
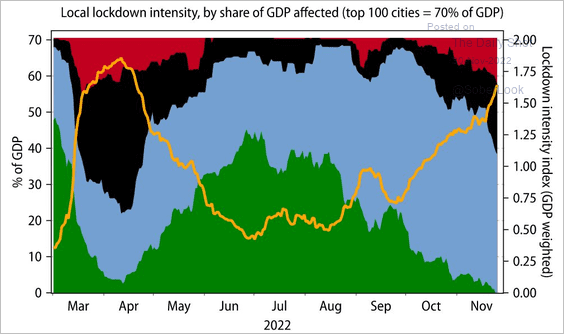
• The Gavekal lockdown intensity index keeps rising.
 Source: Gavekal Research
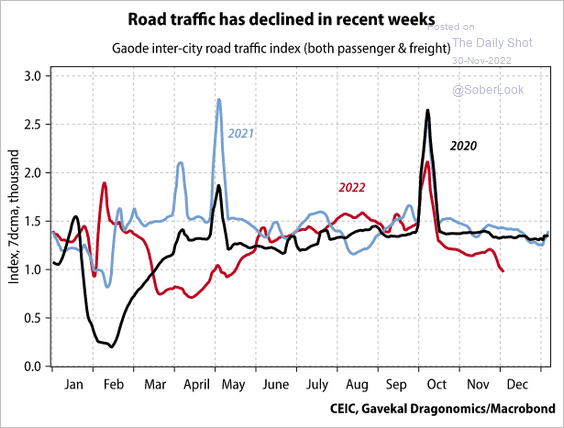
• Mobility continues to deteriorate.
 Source: Gavekal Research
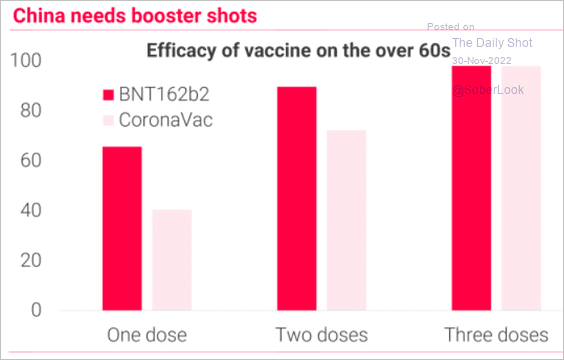
• Older citizens need booster shots.
 Source: TS Lombard
——————–
3. Stocks and the renminbi are rebounding.
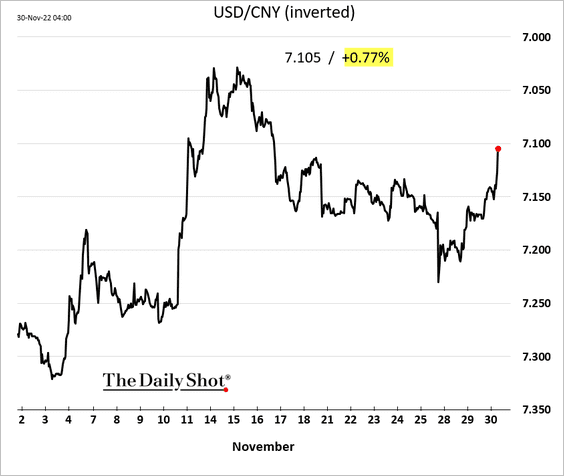
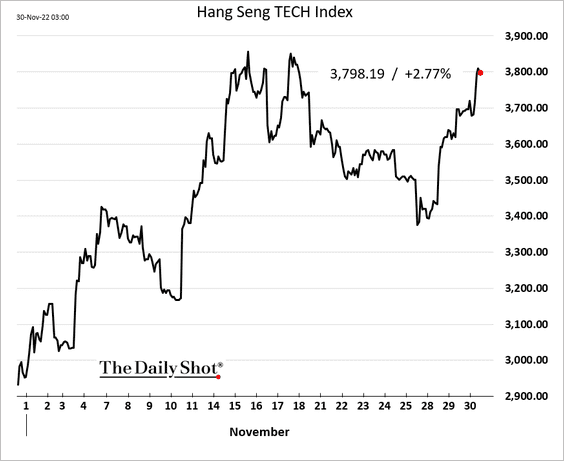
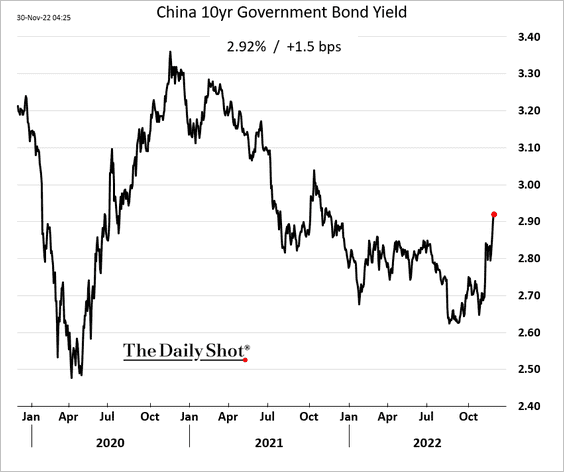
Bond yields continue to climb.
——————–
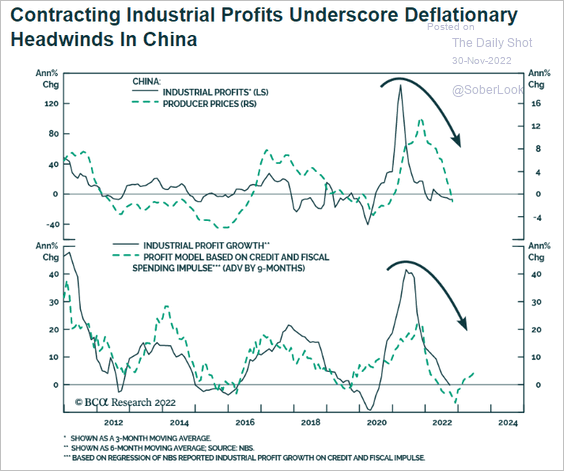
4. China will be facing disinflationary pressures.
 Source: BCA Research
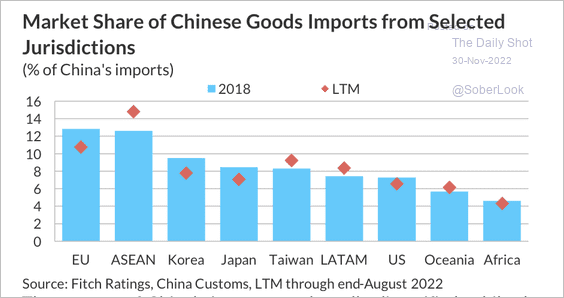
5. The market share of ASEAN countries in China’s imports has risen since 2018.
 Source: Fitch Ratings
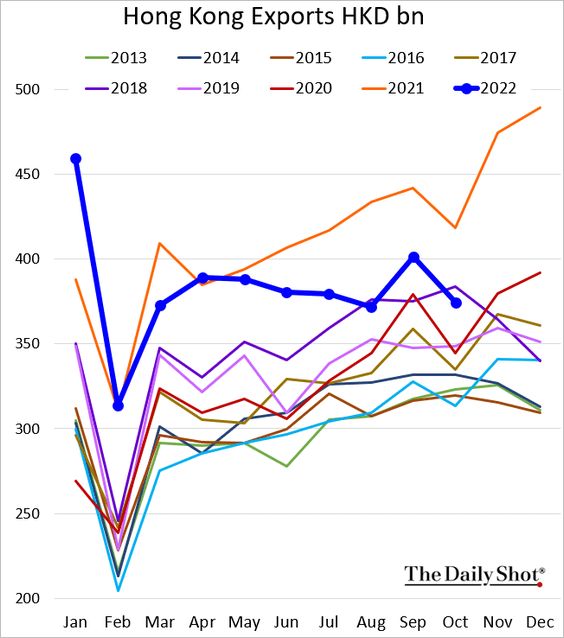
6. Hong Kong’s exports are trending lower.
Back to Index
Emerging Markets
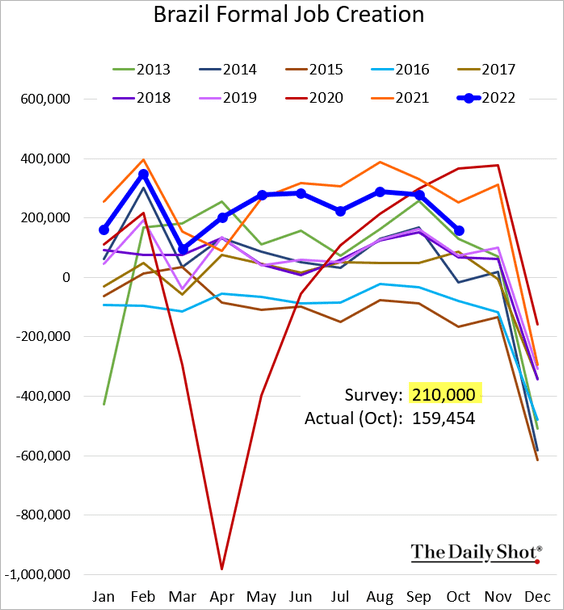
1. Brazil’s job creation is falling behind last year’s levels.
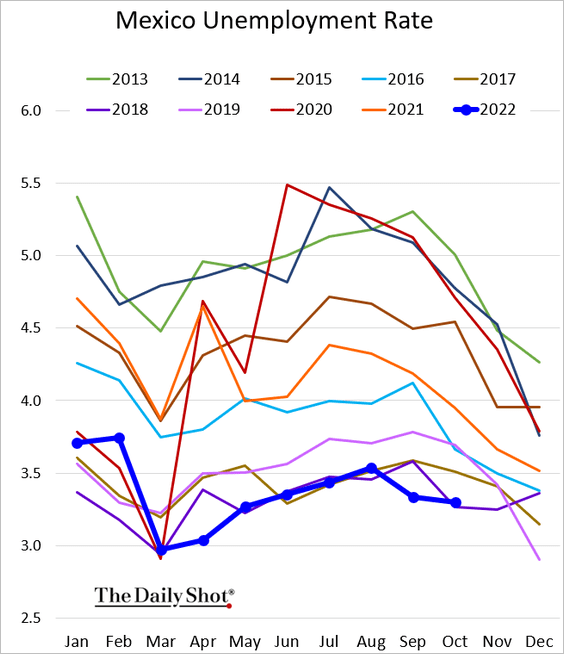
2. Mexico’s unemployment rate remains near pre-COVID lows.
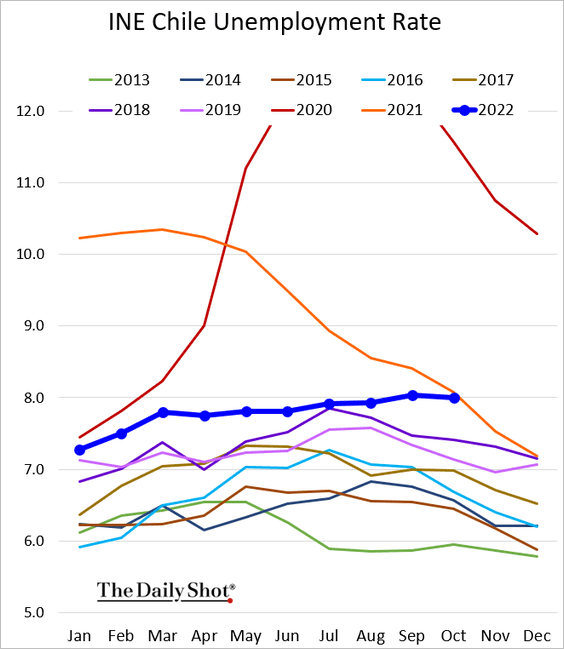
3. Chiles’s unemployment rate has been grinding higher.
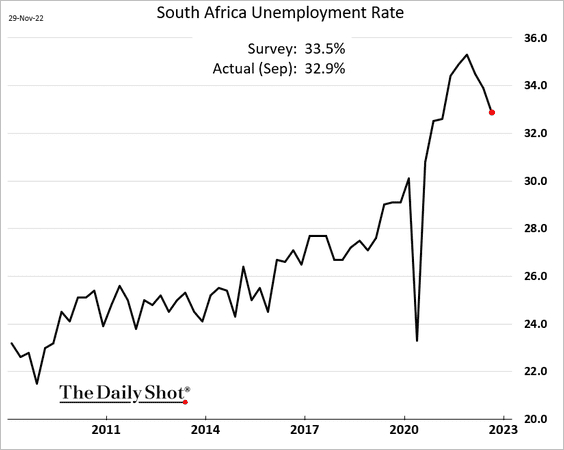
4. South Africa’s unemployment rate is coming off the peak.
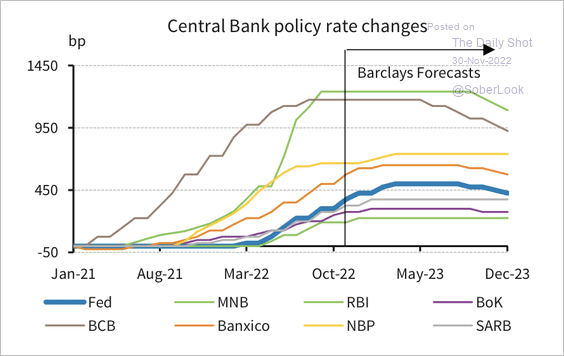
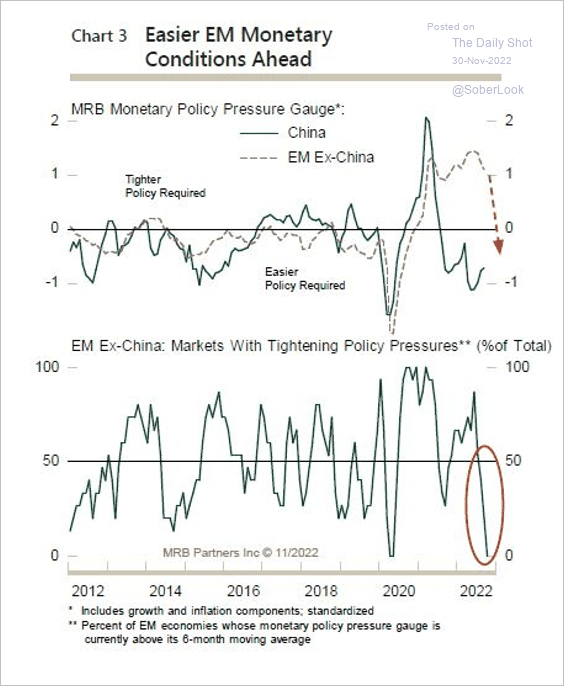
5. EM central banks are close to ending their tightening cycle …
 Source: Barclays Research
… and could soon reverse course.
 Source: MRB Partners
Back to Index
Cryptocurrency
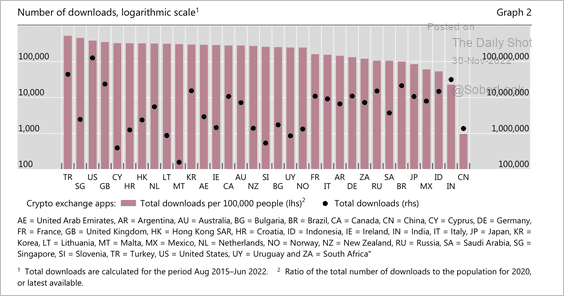
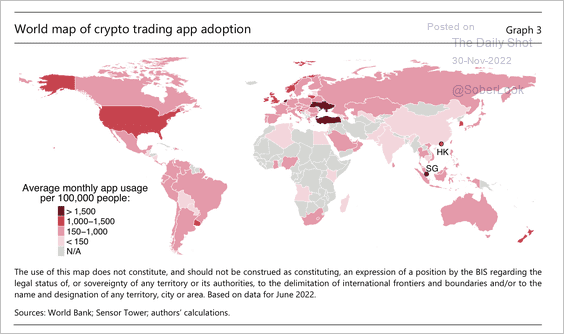
1. Crypto app adoption is highest in Turkey, Singapore, the US, and the UK. (2 charts)
 Source: BIS
 Source: BIS
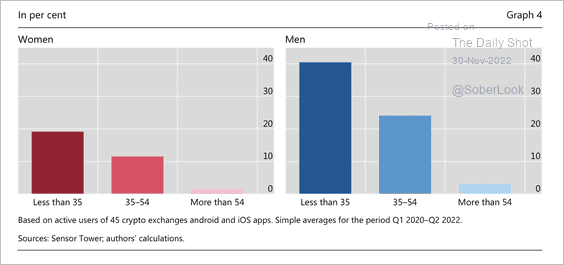
• More than 40% of crypto app users are young men, according to download data.
 Source: BIS
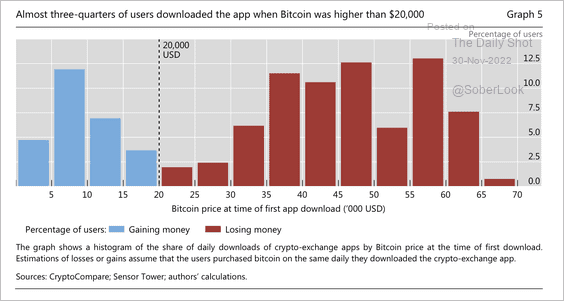
• Most retail investors downloaded crypto apps when prices were higher than $20K.
 Source: BIS
——————–
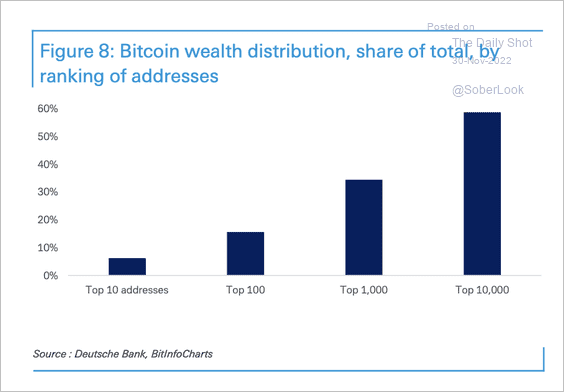
2. Bitcoin holdings are highly concentrated.
 Source: Deutsche Bank Research
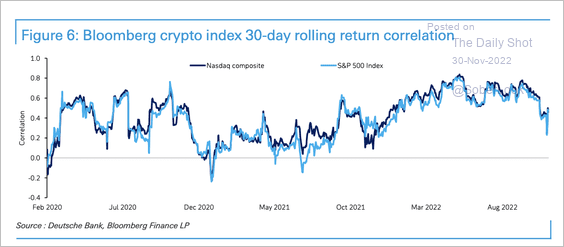
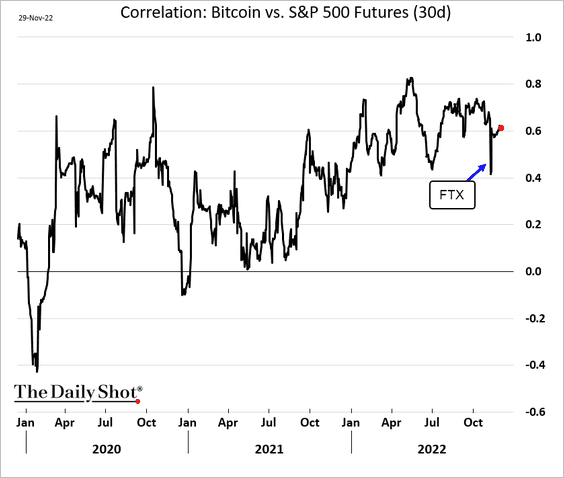
3. Bitcoin’s correlation with stocks has fallen after the FTX implosion but has since picked up.
 Source: Deutsche Bank Research
——————–
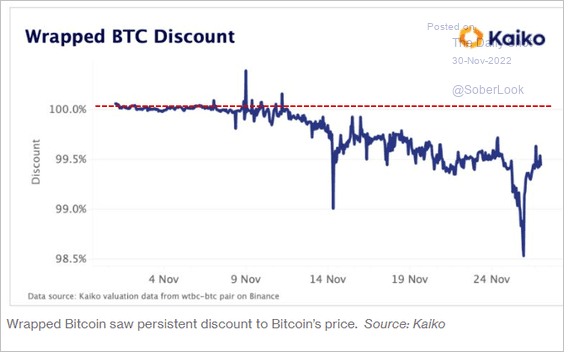
4. Wrapped Bitcoin (used on the Ethereum blockchain) is trading at a discount to BTC amid convertibility concerns.
 Source: @business, @MuyaoShen Read full article
Back to Index
Energy
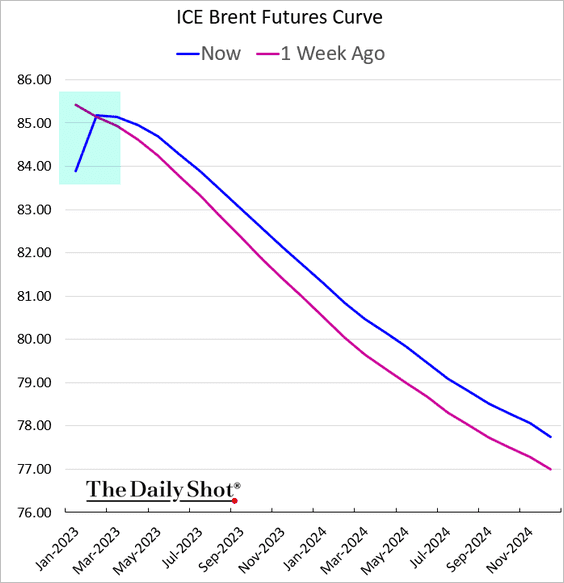
1. The front end of the Brent curve is in contango, signaling softer demand.
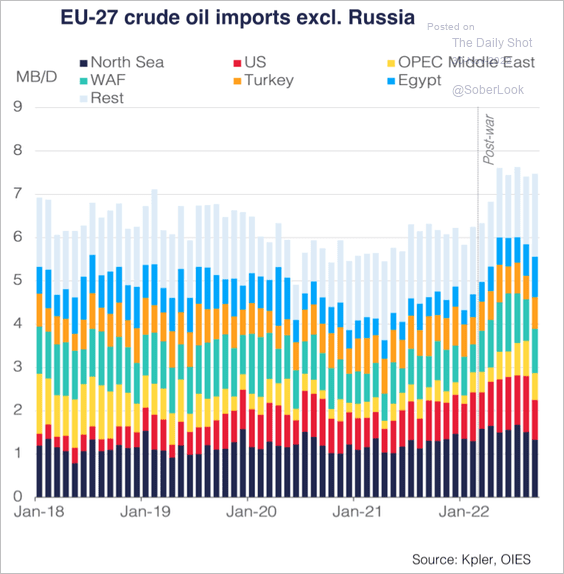
2. This chart shows the EU’s crude oil imports, excluding Russia.
 Source: Oxford Institute for Energy Studies
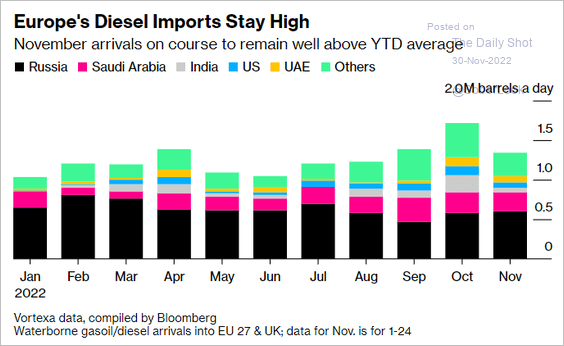
• Europe is still heavily dependent on diesel imports from Russia.
 Source: @markets, @JWittels Read full article
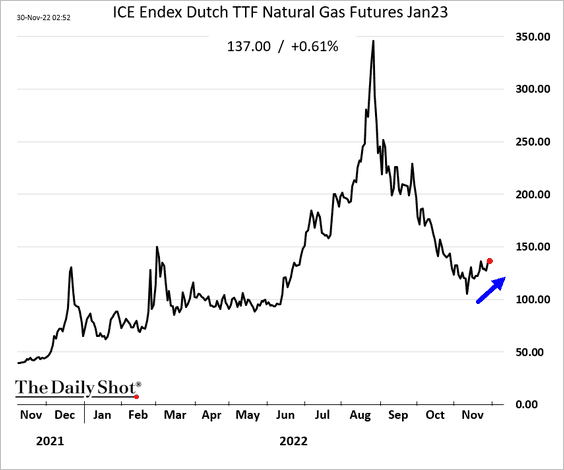
• European natural gas prices are rising again.
——————–
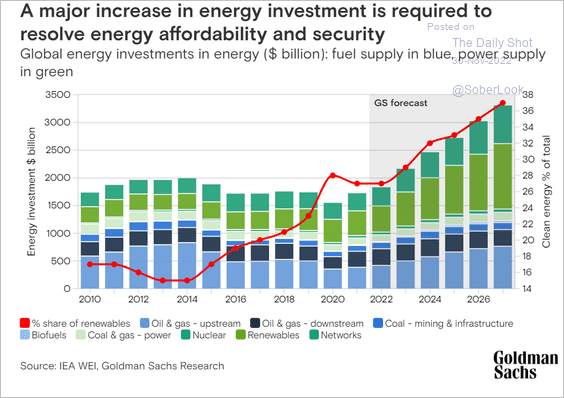
3. Global energy investment requirements will grow sharply over the next few years, according to Goldman.
 Source: Goldman Sachs
4. This chart shows US utility-scale energy storage capacity.
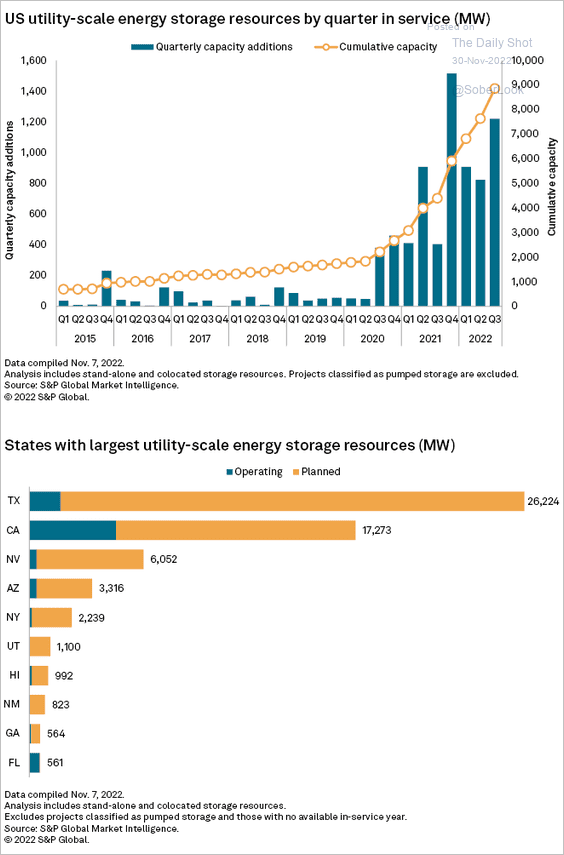 Source: S&P Global Market Intelligence
Back to Index
Equities
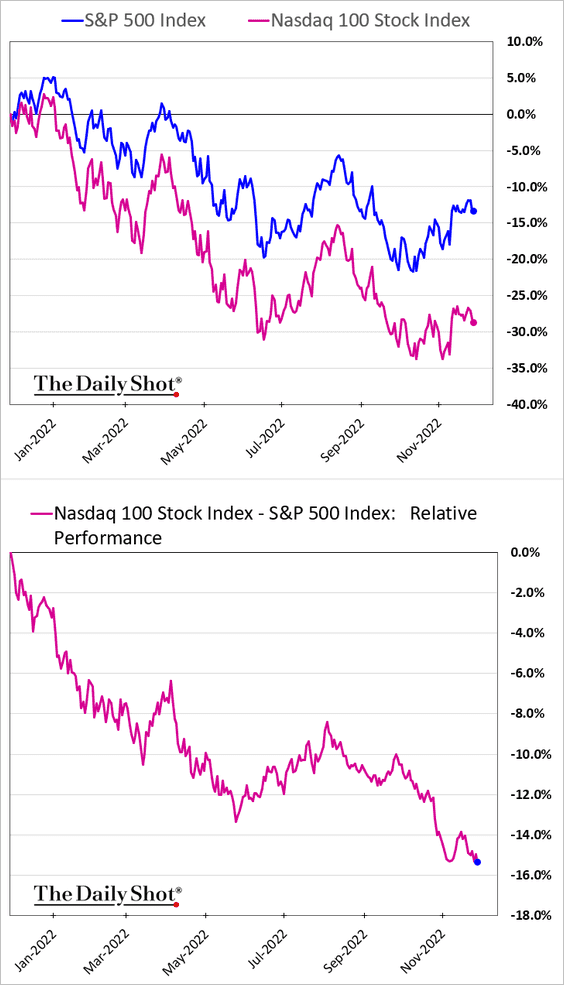
1. The Nasdaq 100 continues to widen its underperformance, now lagging the S&P 500 by more than 15% over the past 12 months.
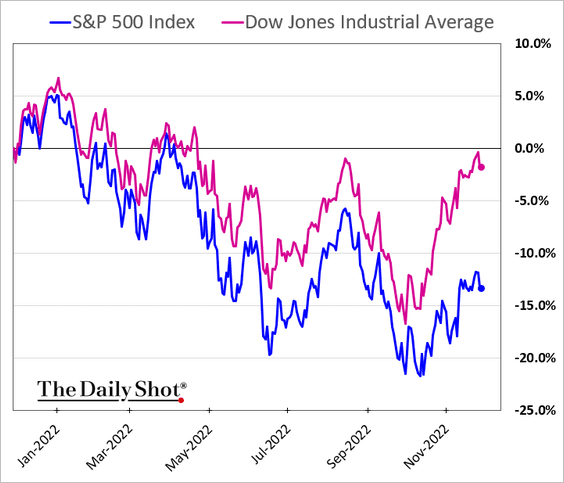
The Dow is outperforming (nearly flat vs. 12 months ago).
——————–
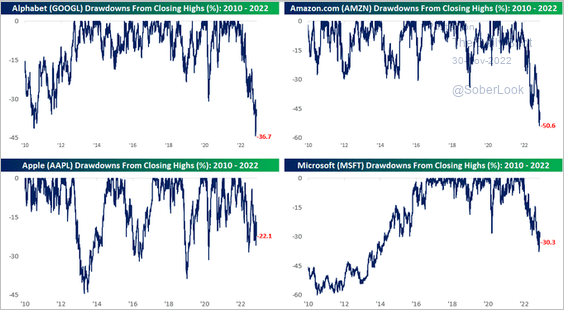
2. The drawdown on the S&P 500’s four largest stocks is still severe.
 Source: @bespokeinvest Read full article
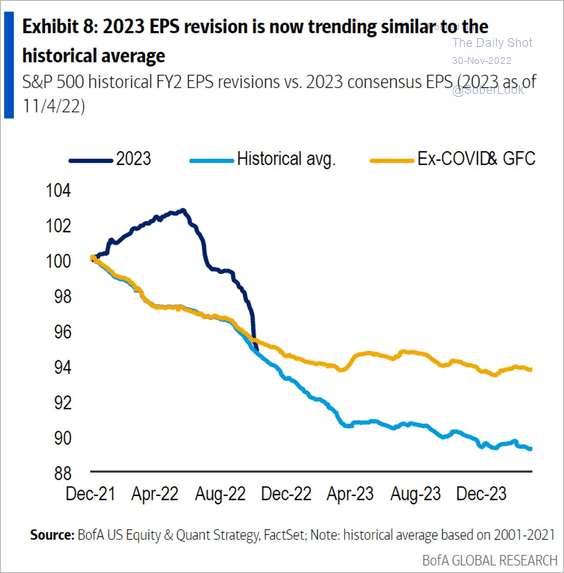
3. Analysts keep downgrading the S&P 500 earnings estimates for 2023, …
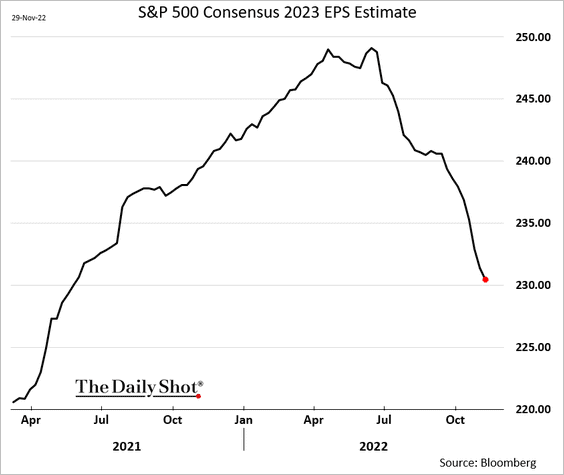
… which are now back to the historical trend for this time of the year.
 Source: BofA Global Research
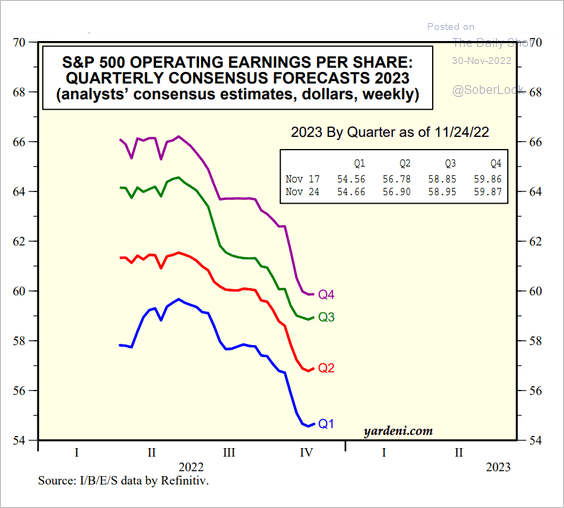
Here are the quarterly projections.
 Source: Yardeni Research
——————–
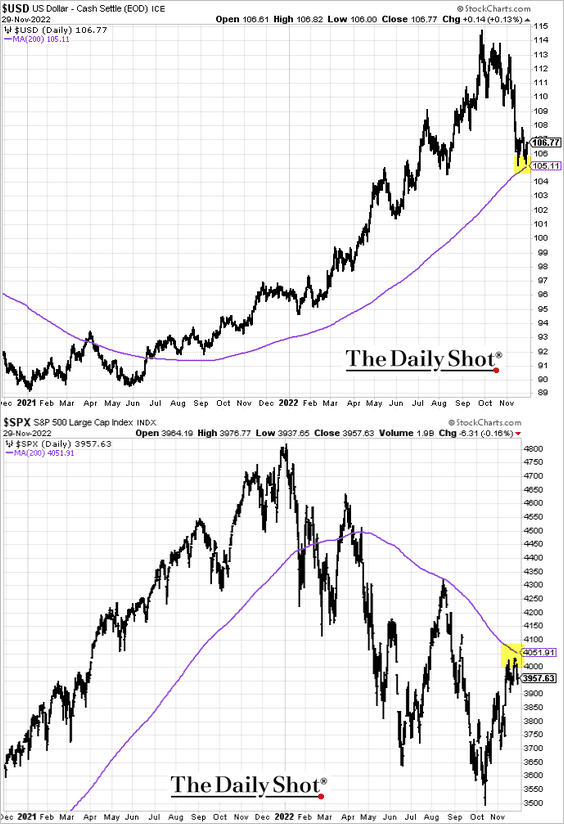
4. Will the S&P 500 fade from resistance as the dollar tests support?
——————–
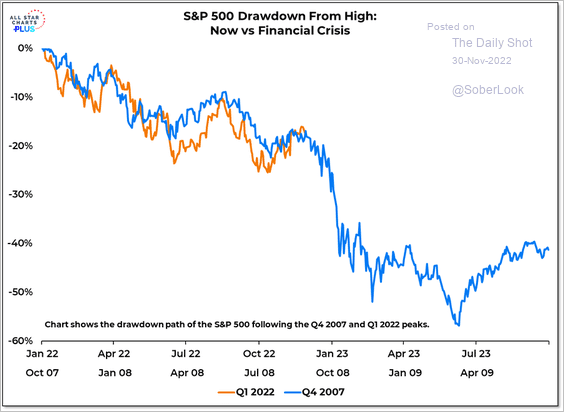
5. The 2008 analog appears to be intact.
 Source: @WillieDelwiche
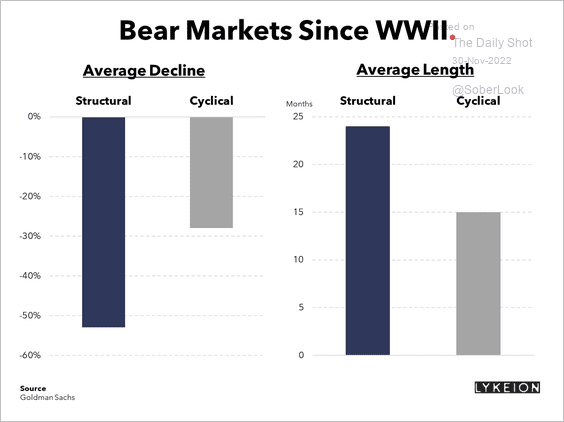
6. Structural bear markets (caused by financial bubbles) are deeper and last longer than cyclical bear markets (caused by rising rates or profit contractions).
 Source: Lykeion Read full article
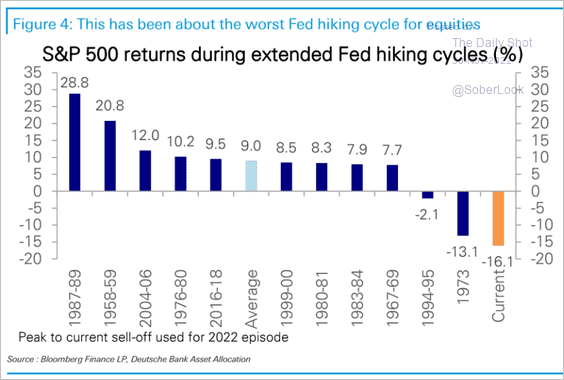
7. This has been the worst Fed hiking cycle for equities.
 Source: Deutsche Bank Research
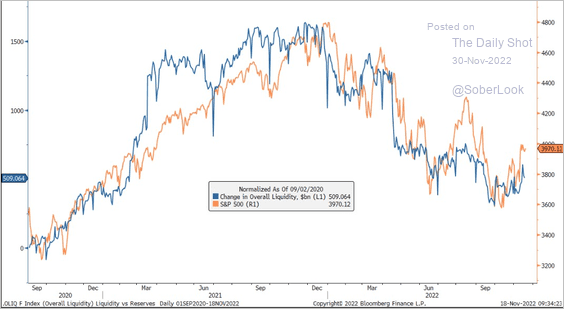
8. Will the Fed’s quantitative tightening pull stock prices lower?
 Source: @jessefelder, Morgan Stanley Research, @markets, @luwangnyc Read full article
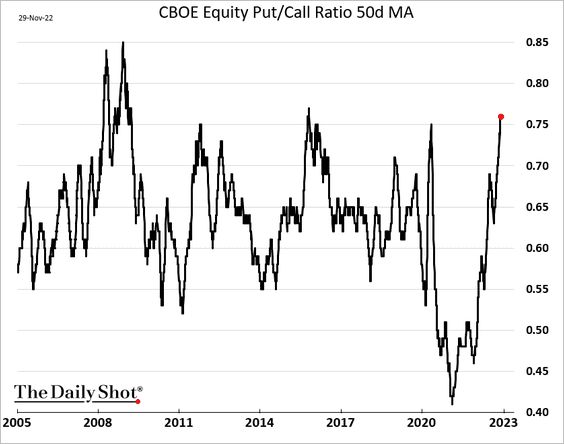
9. The put/call ratio’s 50-day moving average is at multi-year highs.
Back to Index
Alternatives
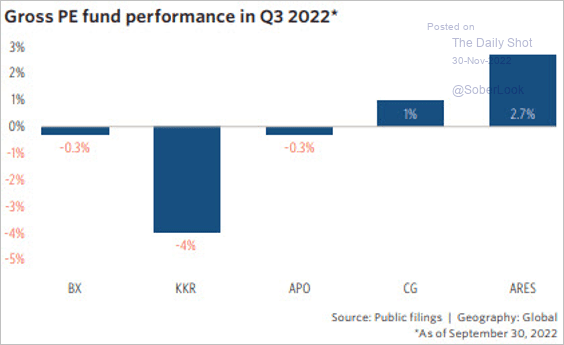
1. Here is a look at public PE firms’ fund performance in Q3.
 Source: PitchBook
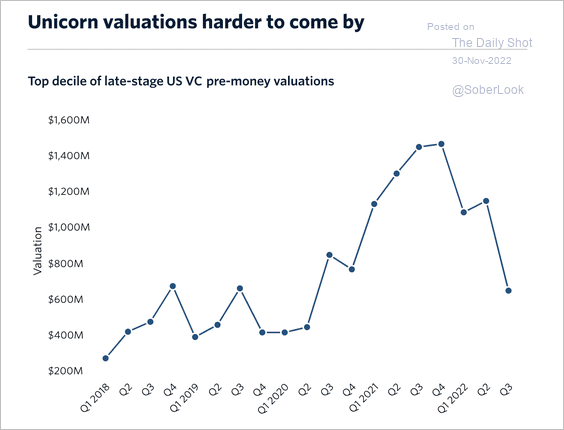
2. Tech M&A valuations have declined massively from the 2021 peak.
 Source: Quill Intelligence
The top decile of late-stage startups by valuation have seen their price plummet in Q3.
 Source: PitchBook
——————–
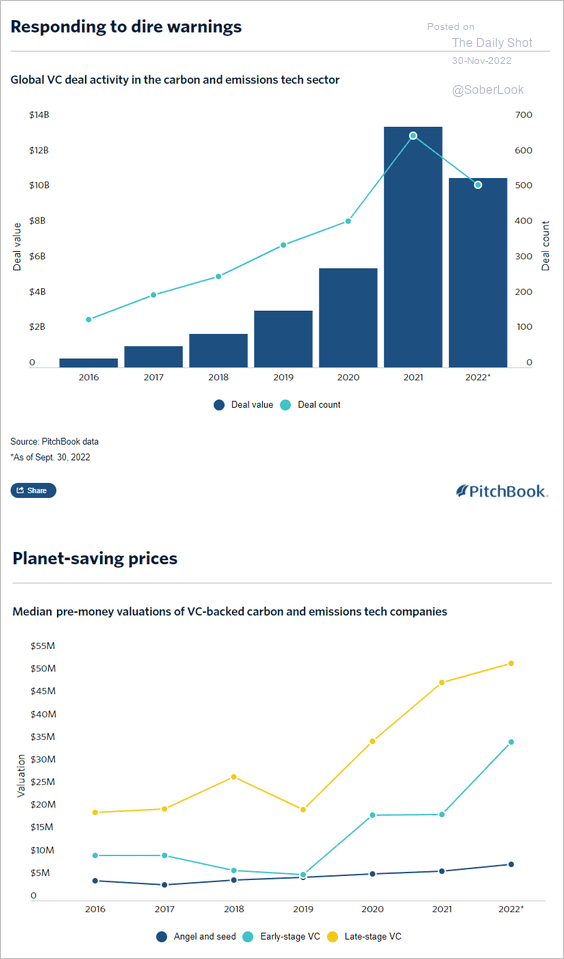
3. This chart shows VC decarbonization deals and valuations.
 Source: PitchBook
Back to Index
Credit
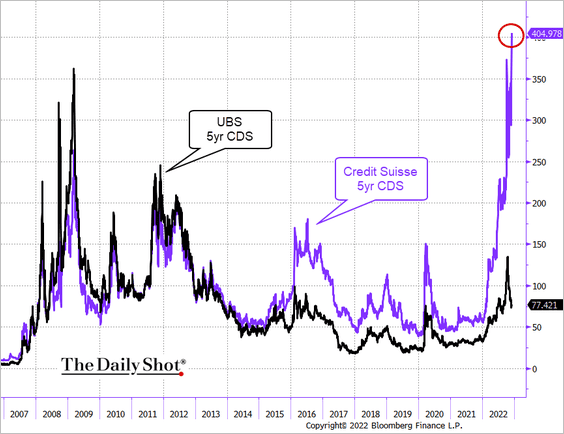
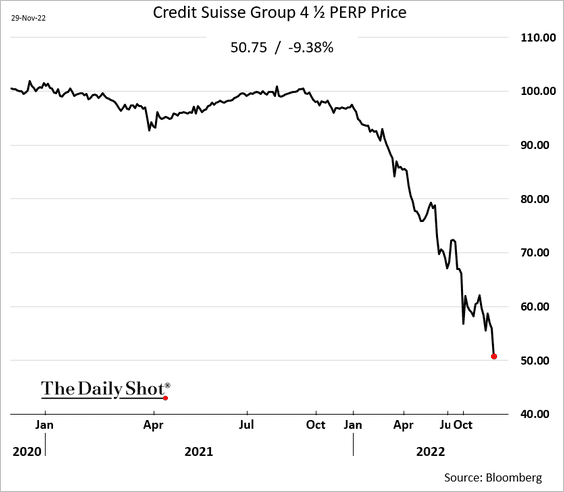
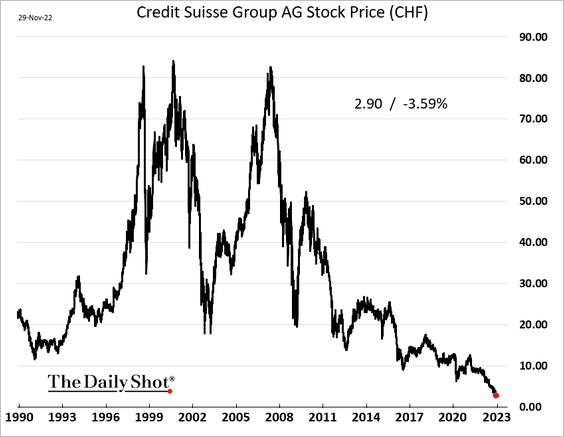
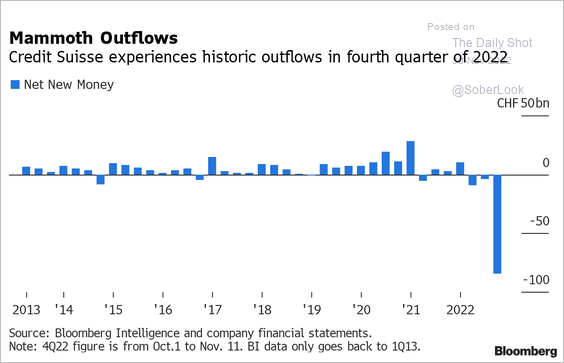
1. The market is doubting whether Credit Suisse will survive.
 Source: Reuters Read full article
• CS credit default swap spread:
 Source: @TheTerminal, Bloomberg Finance L.P.
• CoCo price:
• Share price (collapsing):
• Asset outflows:
 Source: @Mhalftermeyer, @myriamBalez, @StevenArons, @business, @TheTerminal, Bloomberg Finance L.P. Read full article
——————–
2. Banks’ risk-based capital ratio remains near median levels since the financial crisis.
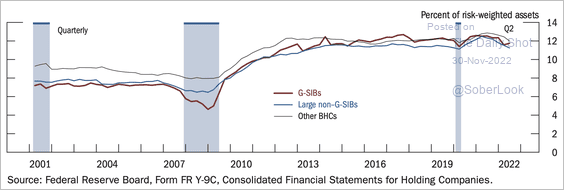 Source: Federal Reserve Read full article
The ratio of banks’ common equity to tangible equity has decreased this year.
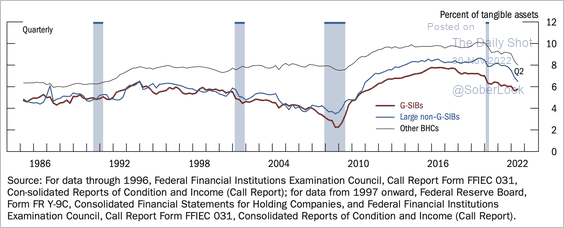 Source: Federal Reserve Read full article
——————–
3. Bigger US banks have been more cautious.
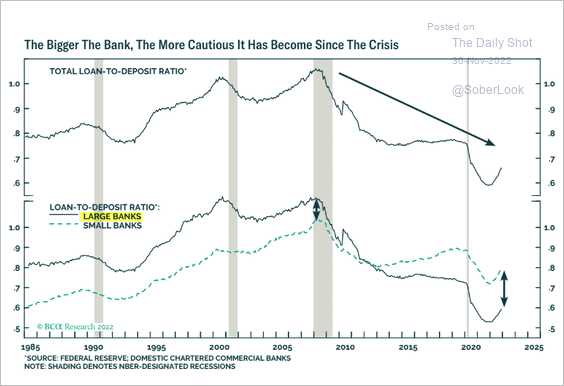 Source: BCA Research
4. Banks are trying to unload $42 billion of hung debt (which they already marked down sharply).
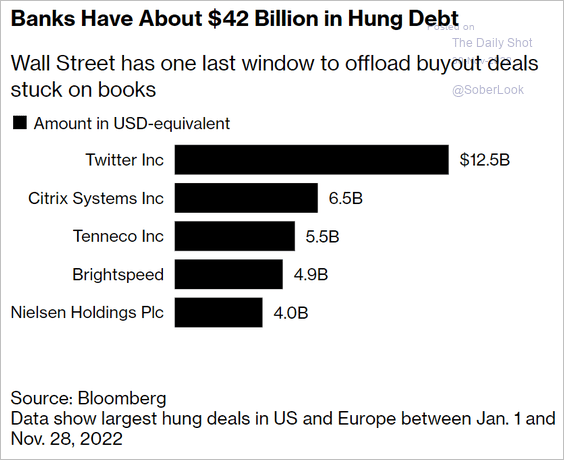 Source: @markets, @jillrshah, @claireruckin Read full article
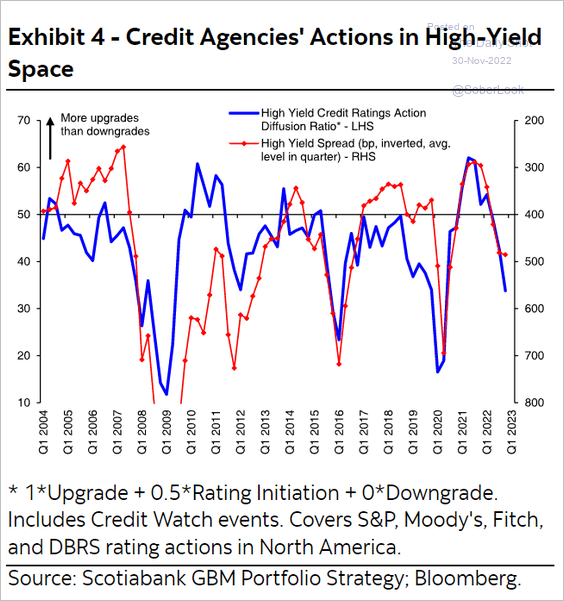
5. Downgrades continue to signal wider high-yield spreads.
 Source: Hugo Ste-Marie, Portfolio & Quantitative Strategy Global Equity Research, Scotia Capital
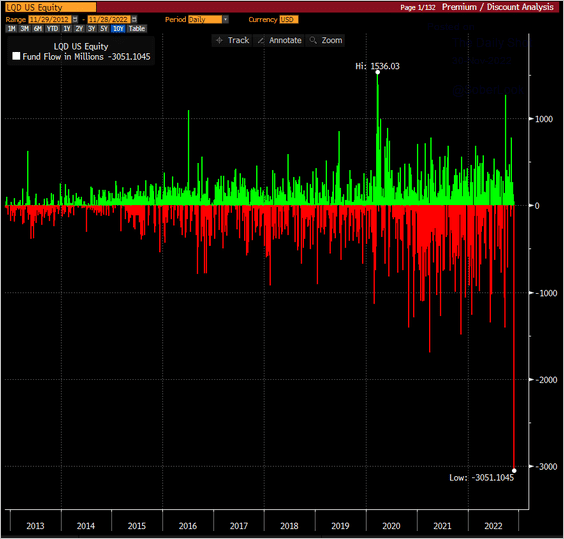
6. The largest IG debt ETF (LQD) saw substantial outflows this week.
 Source: @kgreifeld
Back to Index
Rates
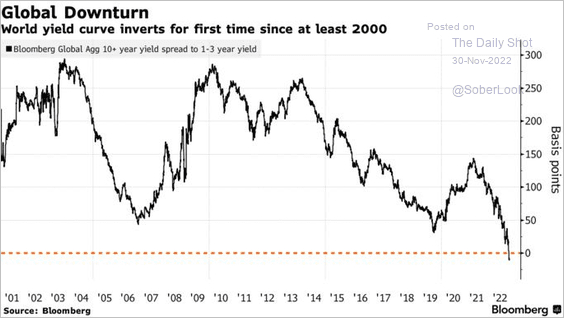
1. The aggregate global yield curve has inverted.
 Source: @markets, @GarfieldR1966 Read full article
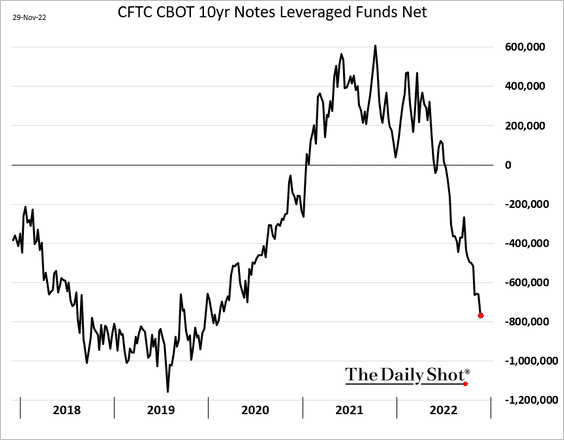
2. Hedge funds have been boosting their bets against Treasuries.
Back to Index
Global Developments
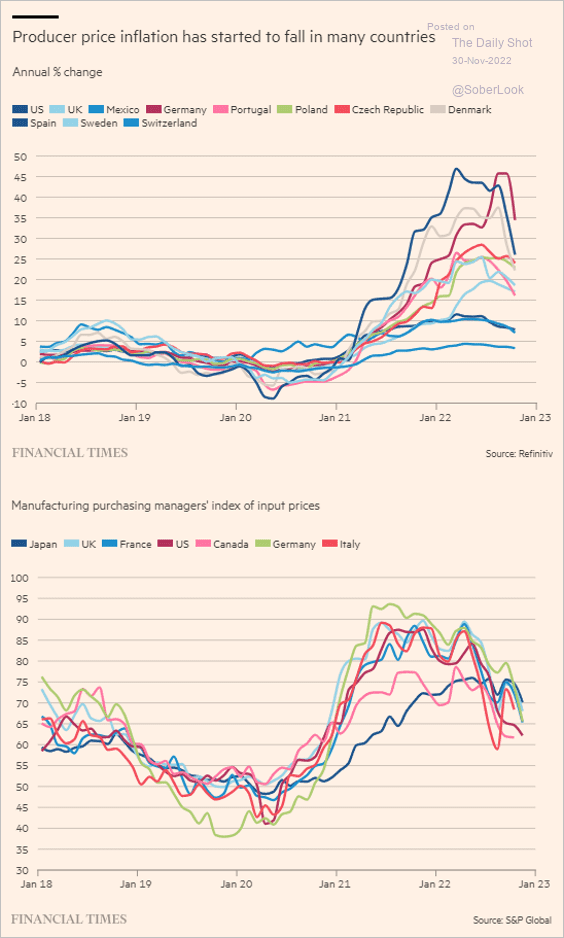
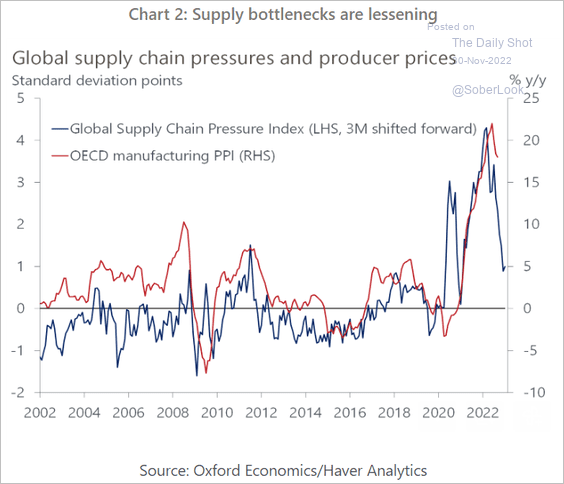
1. Corporate price pressures have been moderating, …
 Source: @financialtimes Read full article
… as supply bottlenecks ease.
 Source: Oxford Economics
——————–
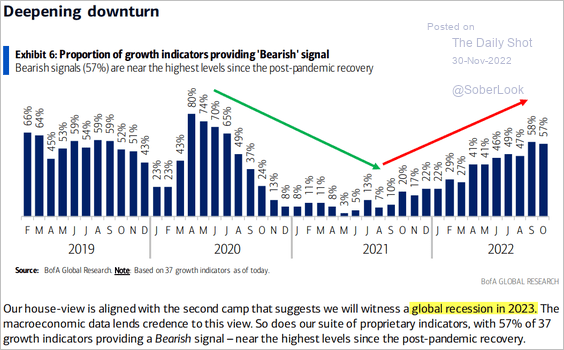
2. Growth indicators are pointing to an economic downturn ahead.
 Source: BofA Global Research
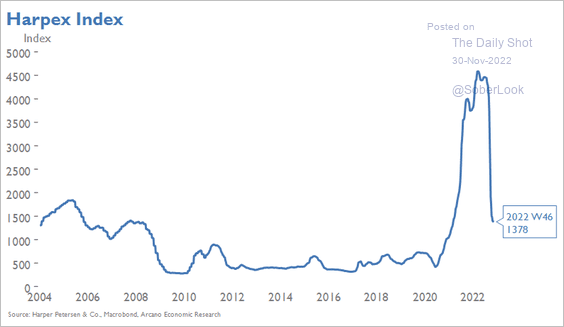
3. Charter pricing for container ships continues to moderate.
 Source: Arcano Economics
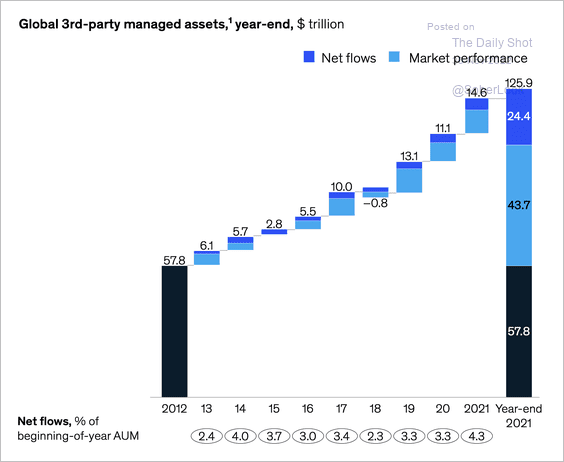
4. The asset management industry entered this year in a strong position.
 Source: McKinsey & Company Read full article
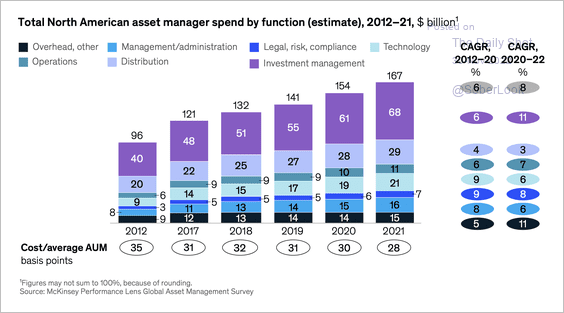
• Industry costs have been increasing, especially as a broader range of products requires skilled employees.
 Source: McKinsey & Company Read full article
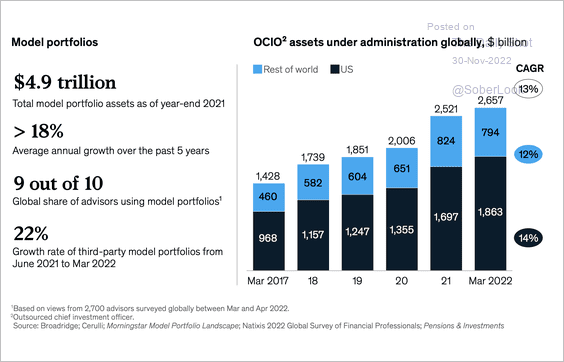
• Portfolio-level solutions continue to gain traction.
 Source: McKinsey & Company Read full article
——————–
Food for Thought
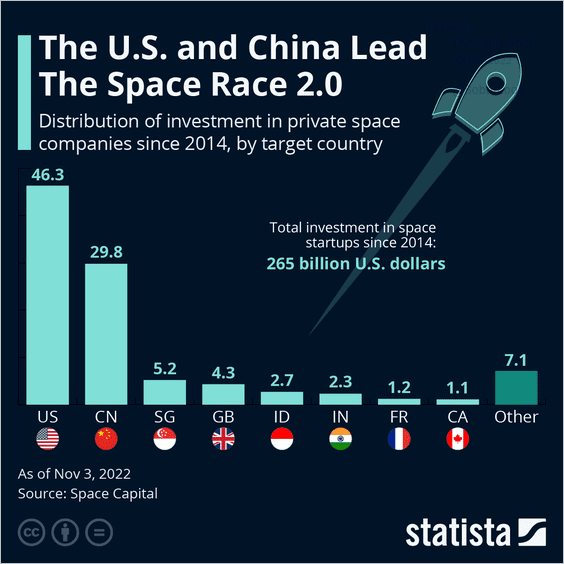
1. Investment in space companies:
 Source: Statista
2. STEM jobs in the US:
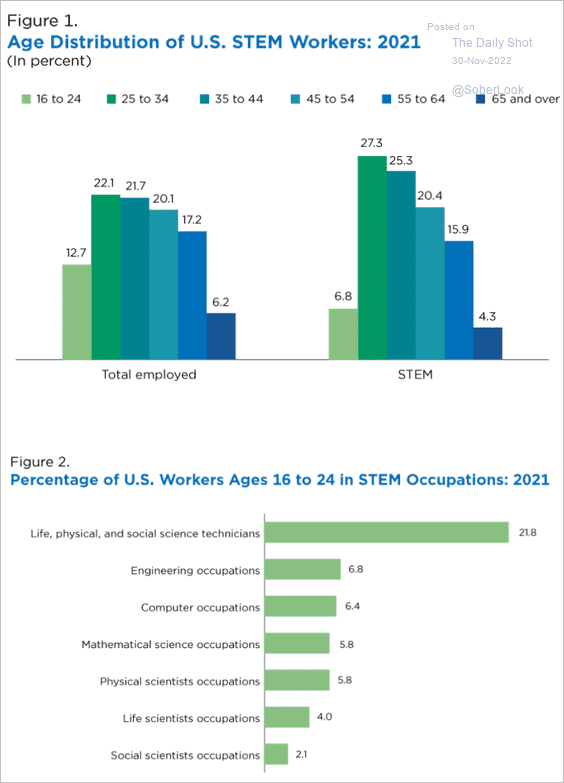 Source: U.S. Census Bureau Read full article
3. Public-sector employees’ compensation growth:
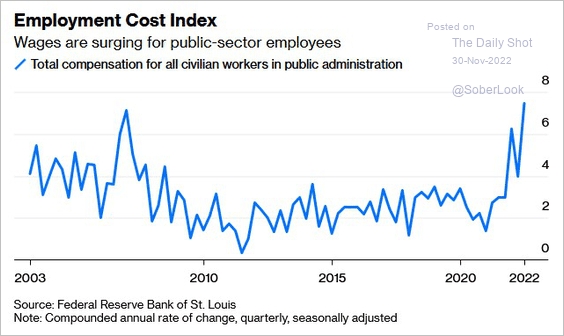 Source: @jessefelder, @conorsen Read full article
4. The federal minimum wage:
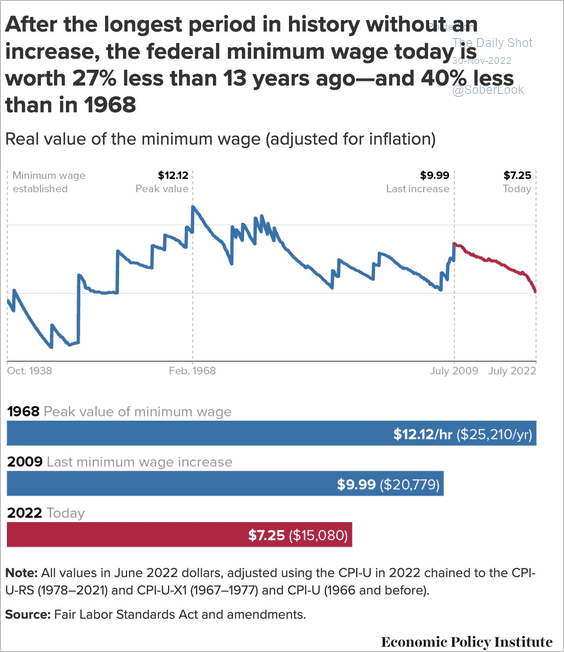 Source: @EconomicPolicy
5. People barred from voting due to a felony conviction:
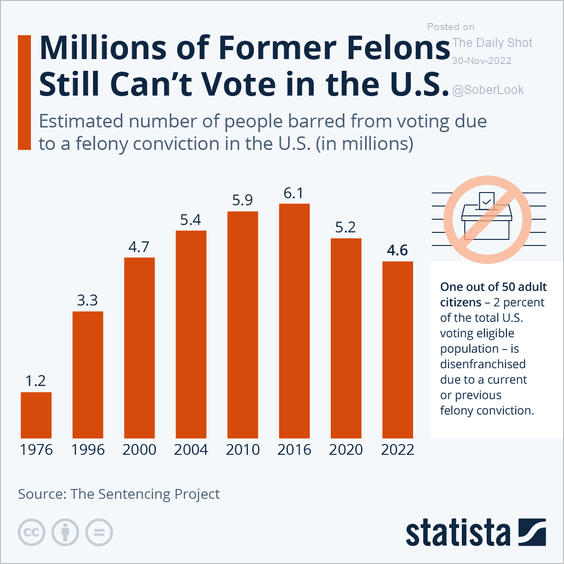 Source: Statista
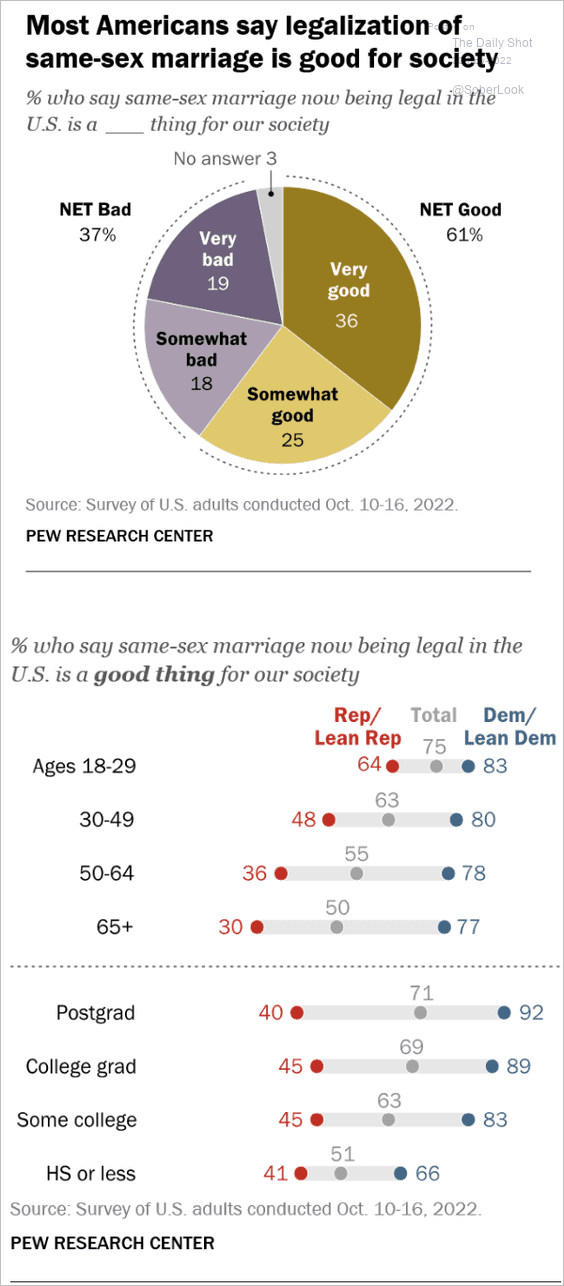
6. Views on the legalization of same-sex marriage:
 Source: Pew Research Center Read full article
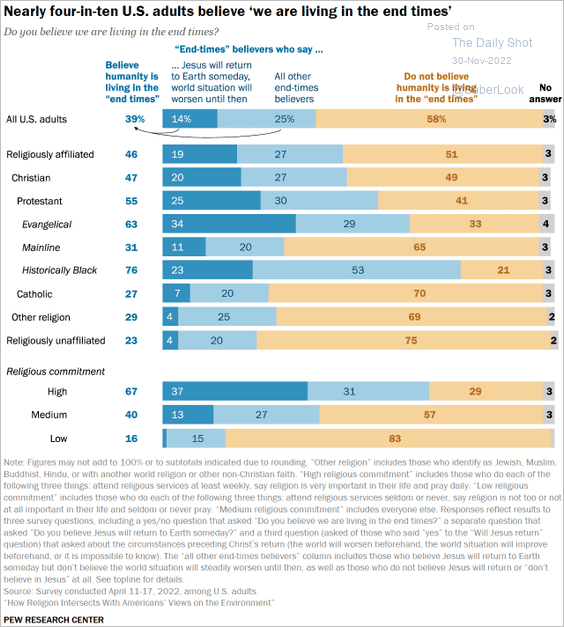
7. Living in the “end times”:
 Source: @conradhackett, Pew Research Center Read full article
——————–
Back to Index
