
The Daily Shot: 05-Dec-22
• The United States
• Canada
• The United Kingdom
• The Eurozone
• Europe
• China
• Emerging Markets
• Commodities
• Energy
• Equities
• Credit
• Rates
• Global Developments
• Food for Thought
The United States
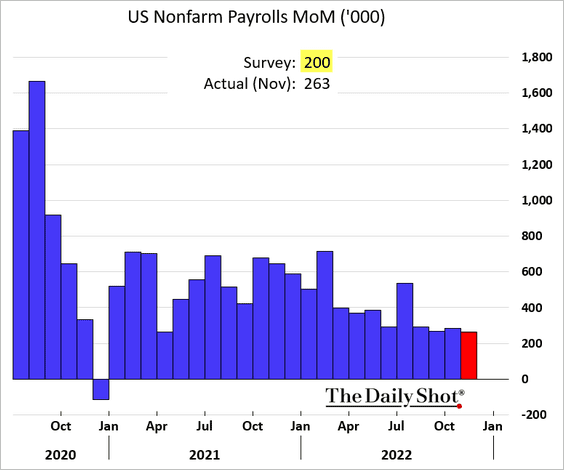
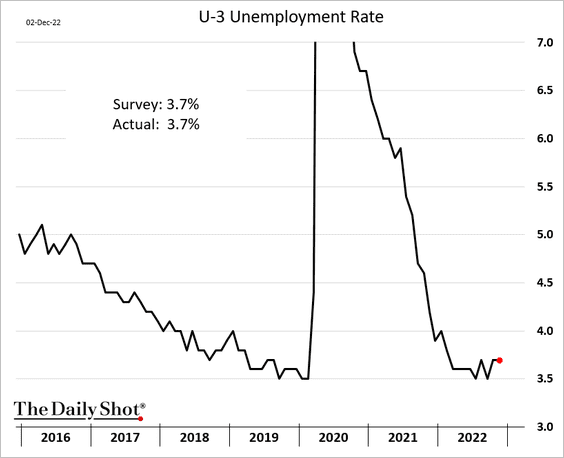
1. Let’s begin with the November payrolls report.
• Job gains and wage growth topped expectations.
Below are the drivers of the employment changes last month (2 charts).
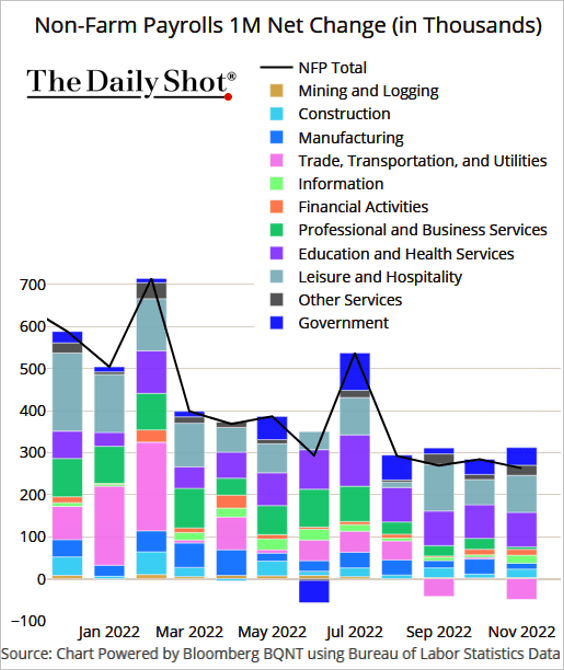 Source: @TheTerminal, Bloomberg Finance L.P.
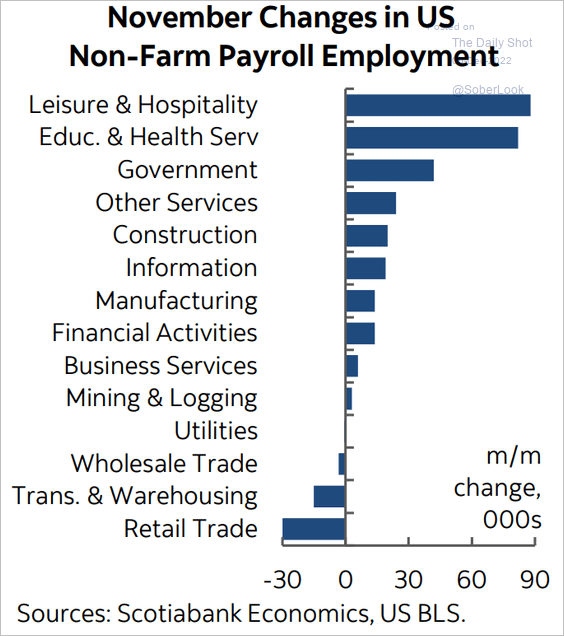 Source: Scotiabank Economics
And here is the total payrolls index.
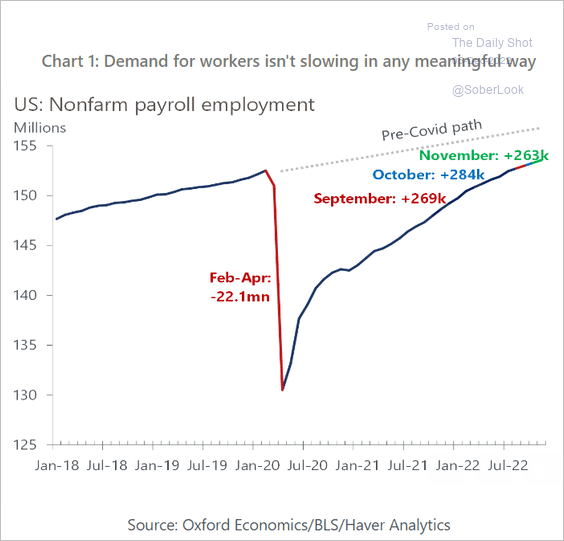 Source: Oxford Economics
• The unemployment rate held steady.
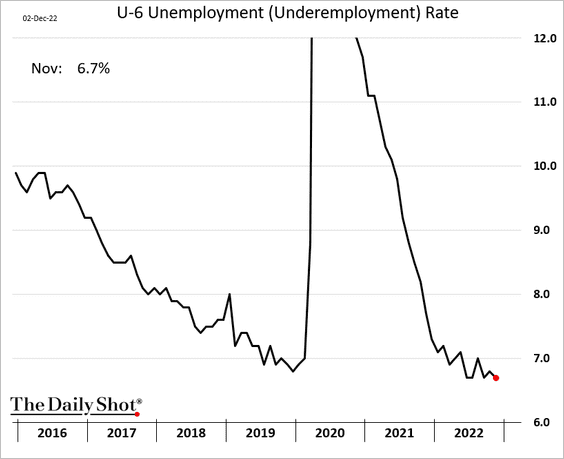
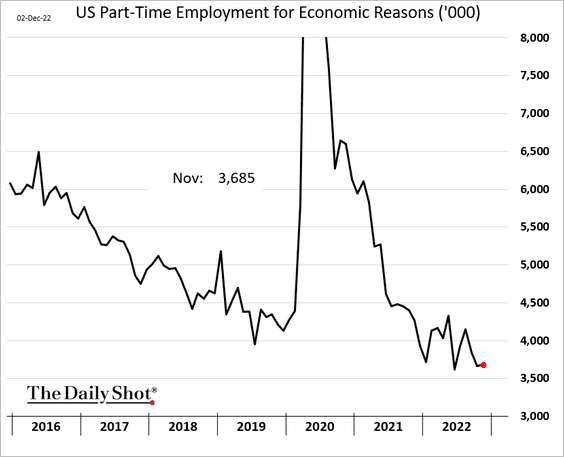
• Underemployment continues to trend lower – a sign of tighter labor markets (2 charts).
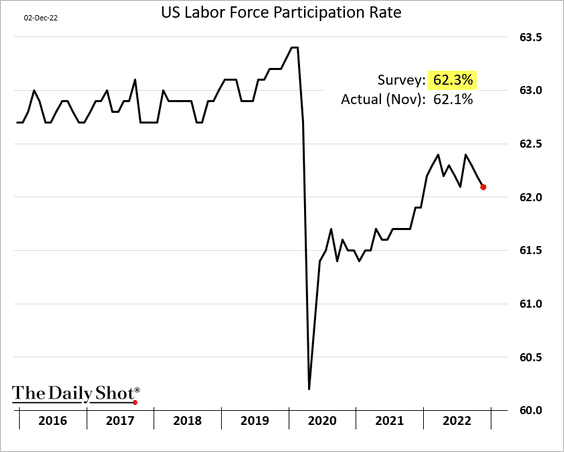
• Labor force participation declined again (including prime-age workers), which could contribute to faster wage growth. This is not the trend the Fed wants to see.
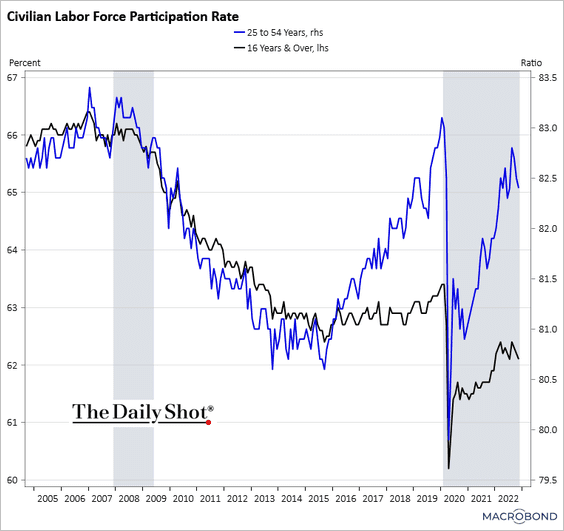 Source: Chart and data provided by Macrobond
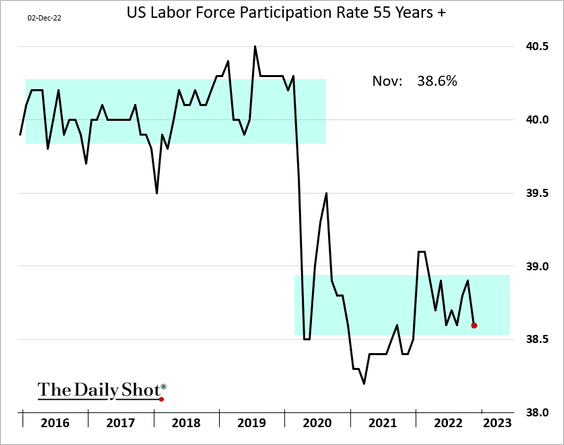
– Older Americans are not returning to work.
– The labor market “shortfall” is about 3.5 million.
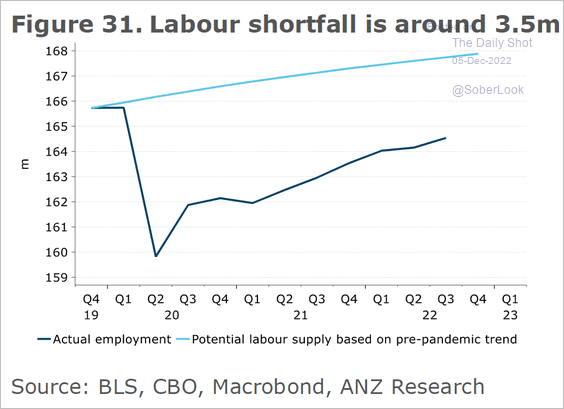 Source: @ANZ_Research
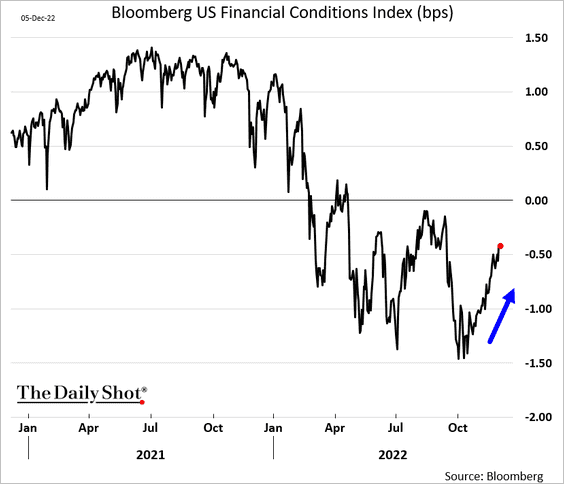
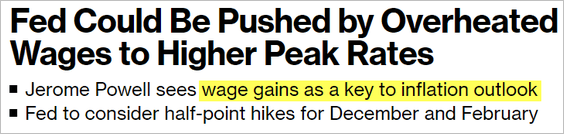
• November wage gains were double the forecasted figures.

Given the recent improvement in US financial conditions, we could see the Fed’s terminal rate move higher.
 Source: @business, @SteveMatthews12 Read full article
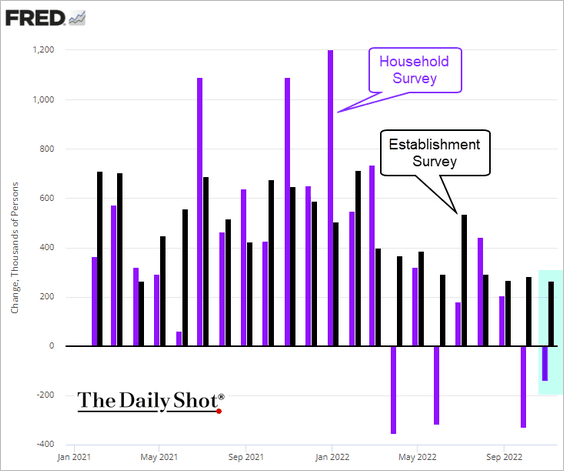
• Unlike the Establishment Survey (above), the Household Survey showed another decline last month.
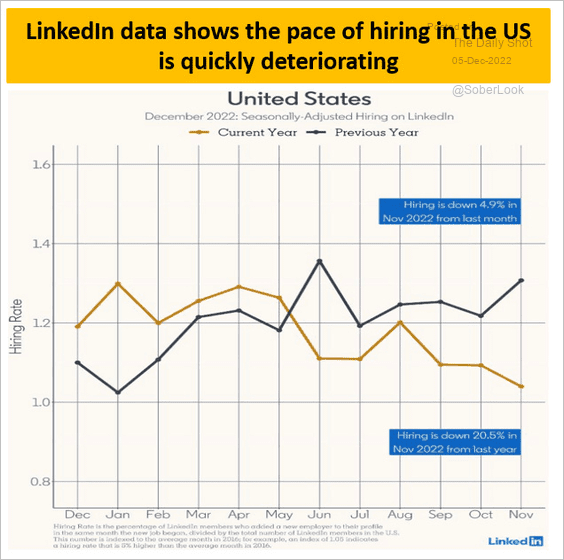
– Data from LinkedIn also shows softer hiring.
 Source: @MacroAlf
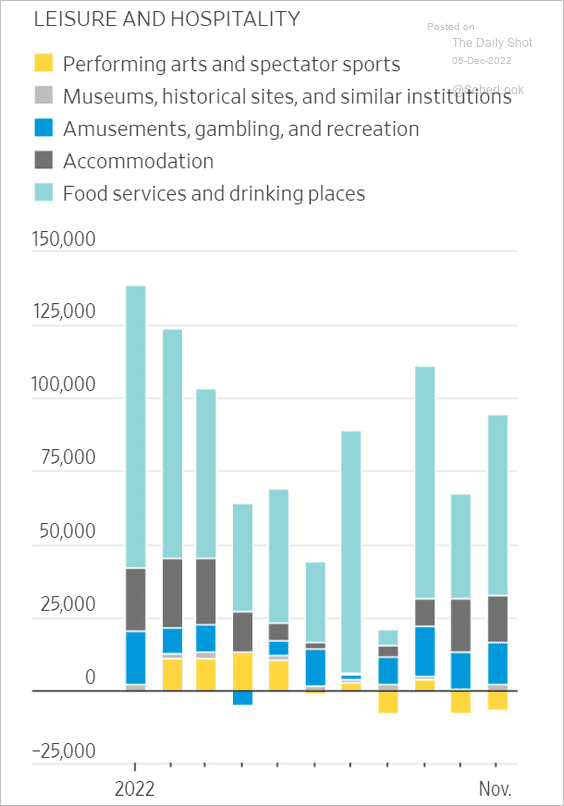
• Next, we have some additional data on the US employment situation.
– Casinos, hotels, restaurants, and bars continue to hire.
 Source: @WSJ Read full article
– Industries with higher wages and more operating leverage are shedding workers quickly.
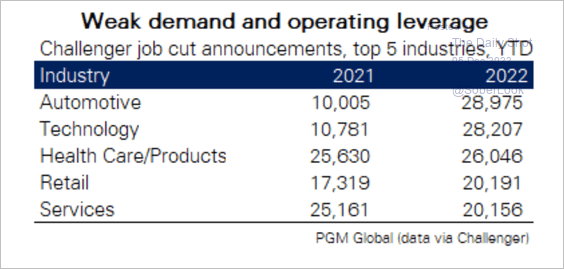 Source: PGM Global
– The number of Americans holding more than one job continues to recover.
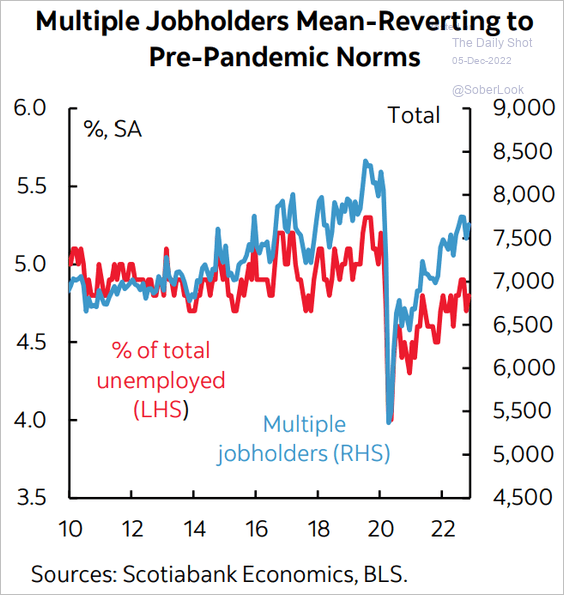 Source: Scotiabank Economics
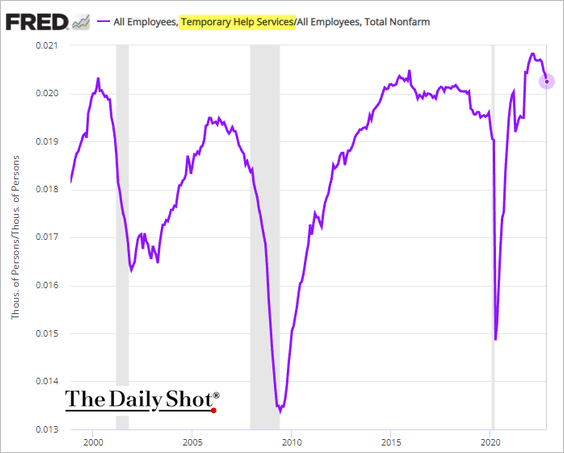
– Temp employment appears to have peaked.
– Firms have cut jobs this year due to closures, cost-cutting, and weaker economic conditions.
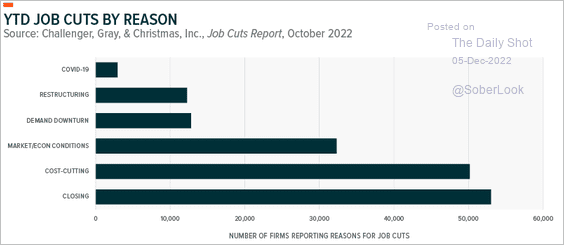 Source: Global X ETFs Read full article
– News stories of job cuts, layoffs, and firings have exceeded 2020 levels (some of which is hype).
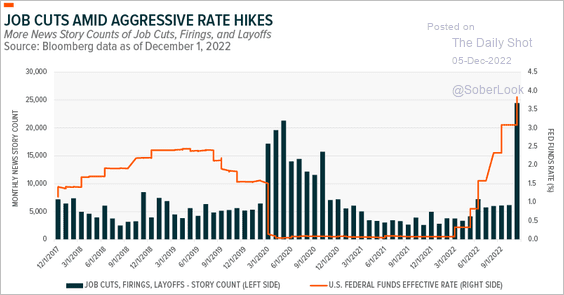 Source: Global X ETFs Read full article
– Here are the hiring “leaders and laggards.”
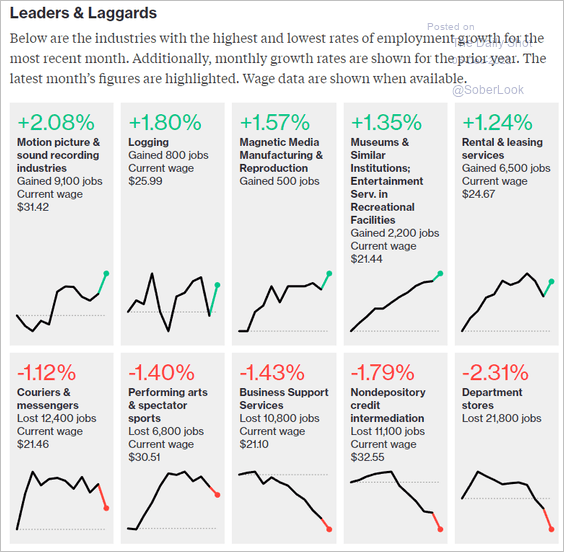 Source: @bbgvisualdata Read full article
– Higher wage costs will lower profit margins.
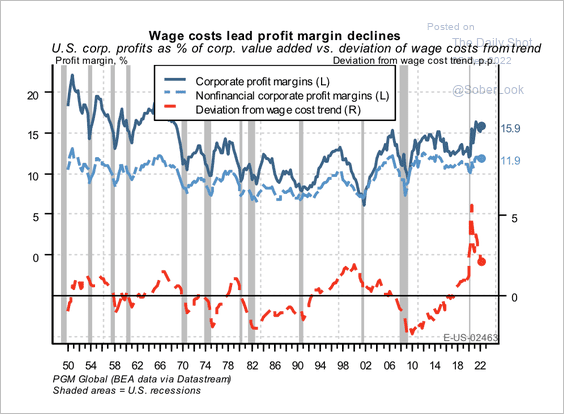 Source: PGM Global
– The employment survey response rate has been unusually low.
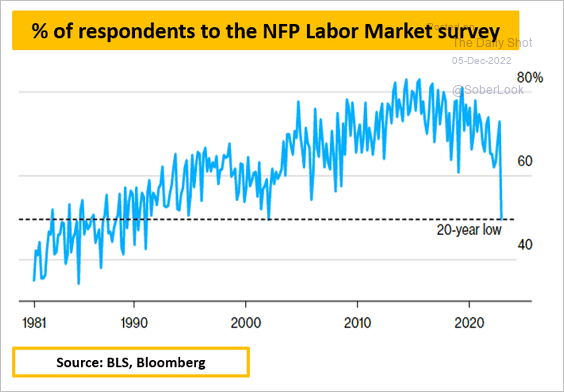 Source: @MacroAlf
– The ISM PMI index is signaling slower job gains ahead.
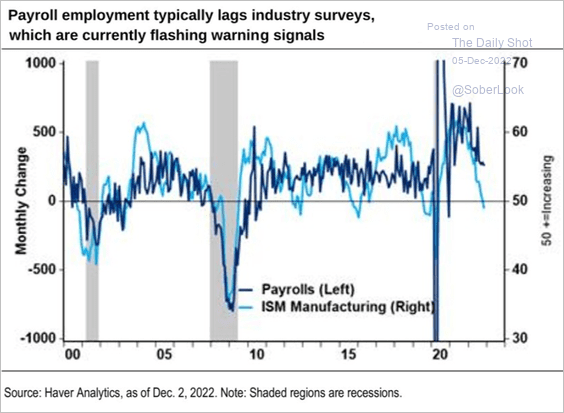 Source: Citi Private Bank
——————–
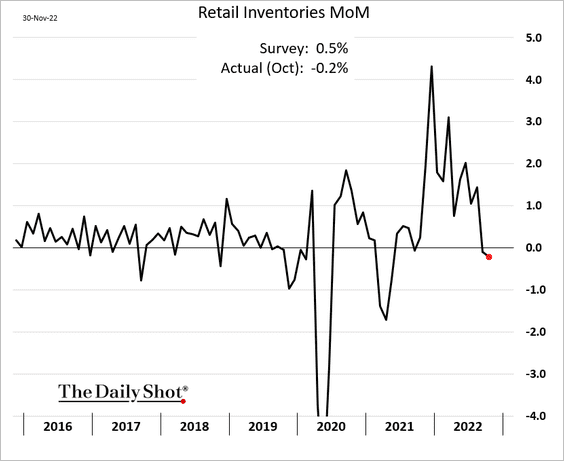
2. Nominal retail inventories have stopped growing.
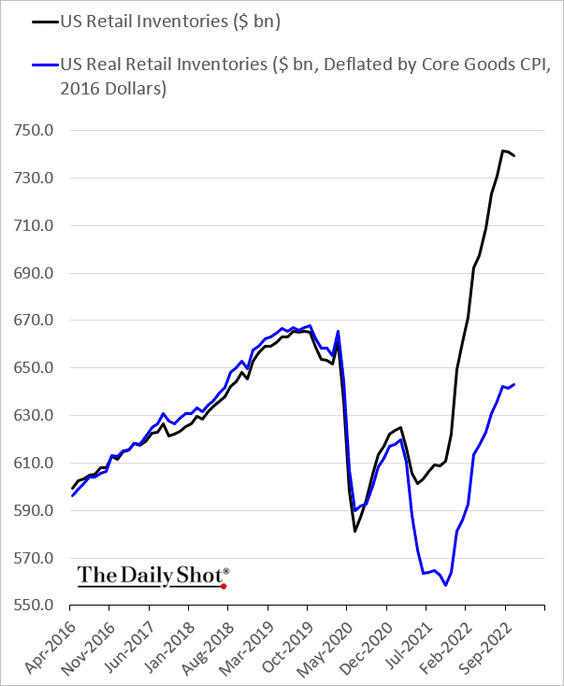
Here are the nominal and real retail inventory levels.
——————–
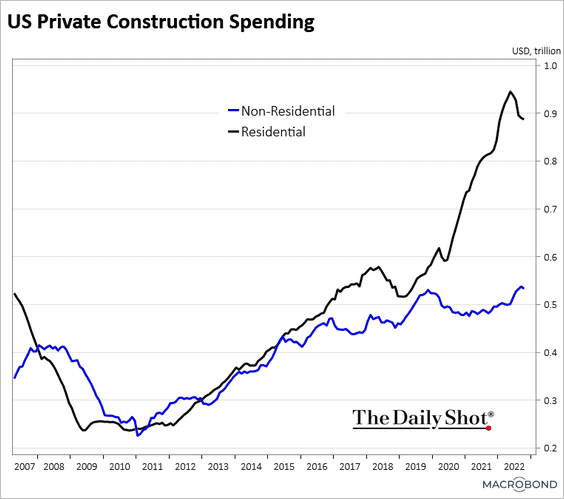
3. Construction spending declined in October.
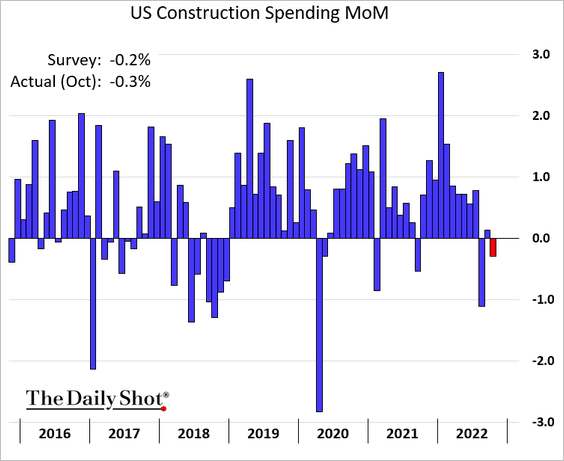
• This chart shows private residential and non-residential construction spending levels.
• Architecture billings are now contracting.
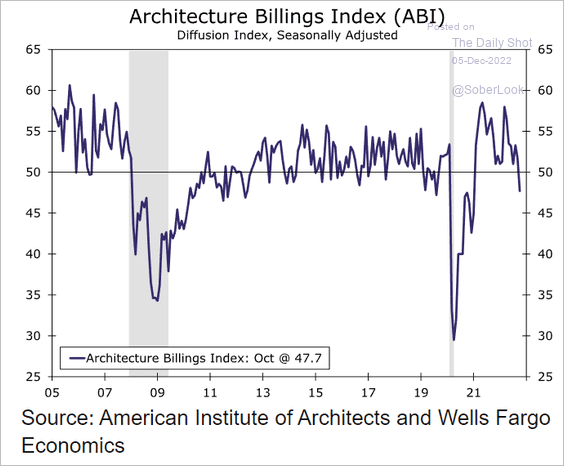 Source: Wells Fargo Securities
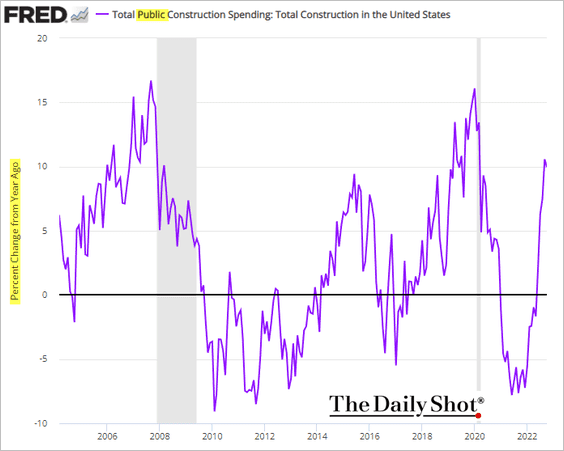
• Growth in public construction spending has been rebounding.
——————–
4. Vehicle sales declined last month.
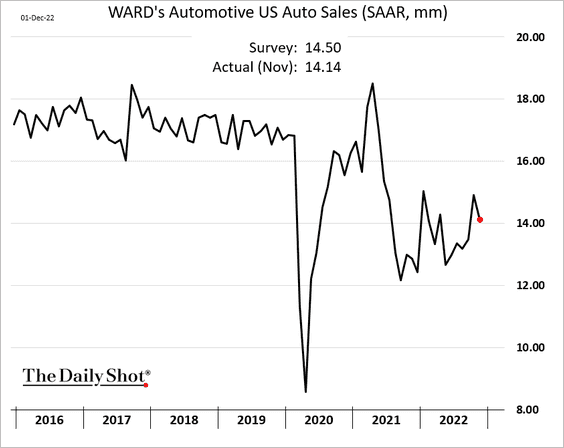
Vehicle sales are expected to recover gradually over the next few quarters but remain below pre-COVID levels.
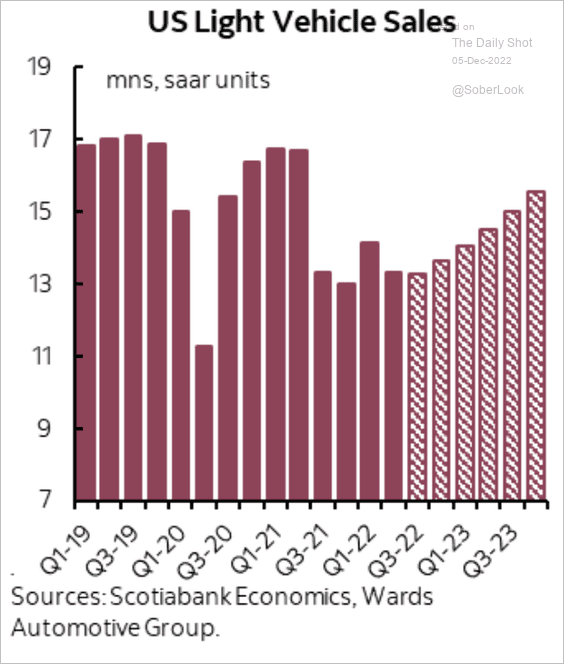 Source: Scotiabank Economics
——————–
5. The trade gap in goods widened in October.
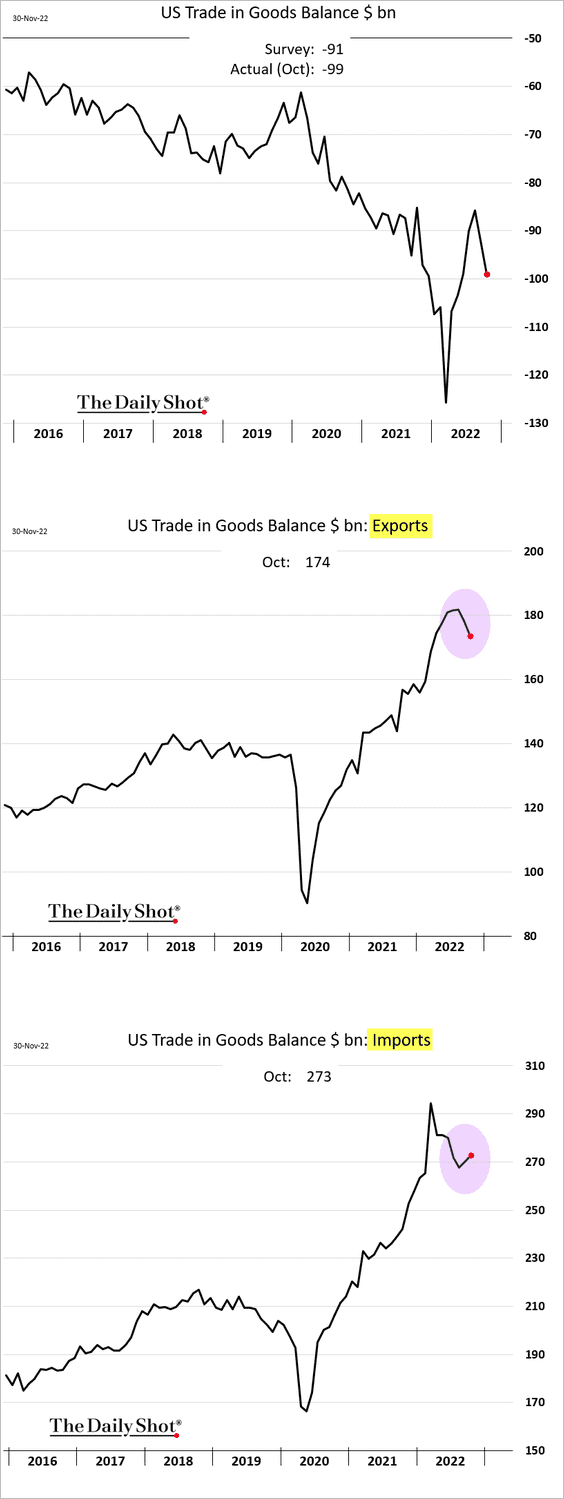
The US terms of trade improved substantially, driven by the higher value of energy exports.
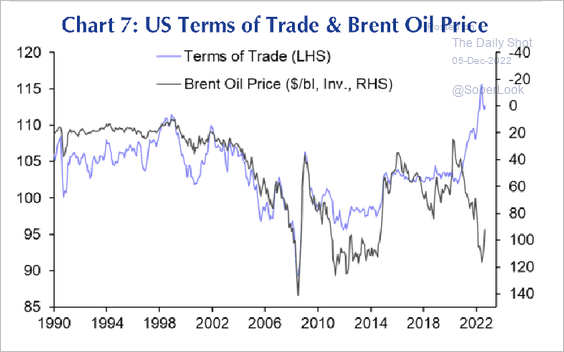 Source: Capital Economics
——————–
6. The Penta-CivicScience index of consumer sentiment has been edging higher in recent weeks.
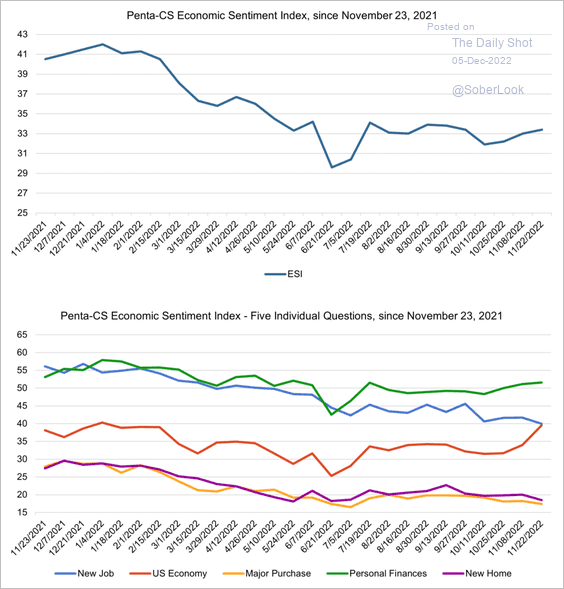 Source: @CS_Penta, @Pentagrp, @CivicScience
7. The 10-year – 3-month Treasury spread reached a multi-decade low last week as the curve inversion hits extreme levels.
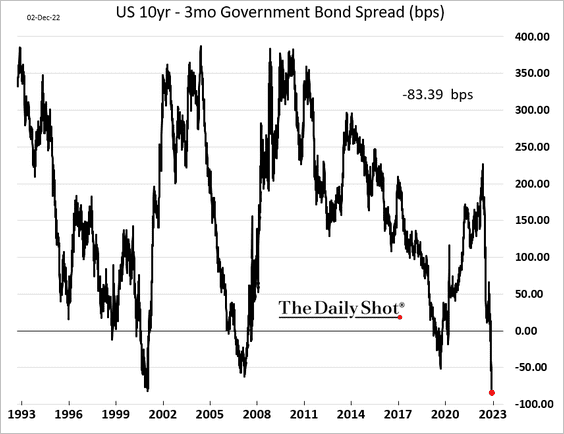
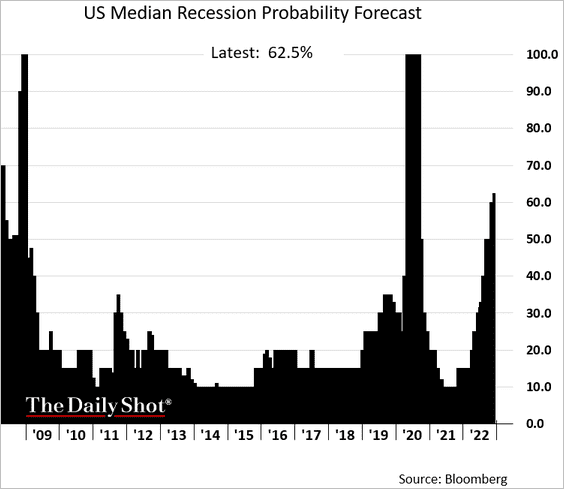
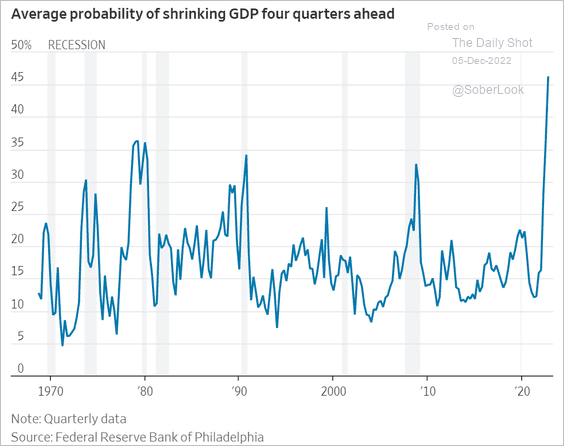
Forecasters are quite certain that a recession is coming. Given the strength in wage growth (above), the Fed is increasingly likely to push the economy into a recession to dampen demand.
 Source: @WSJ Read full article
Back to Index
Canada
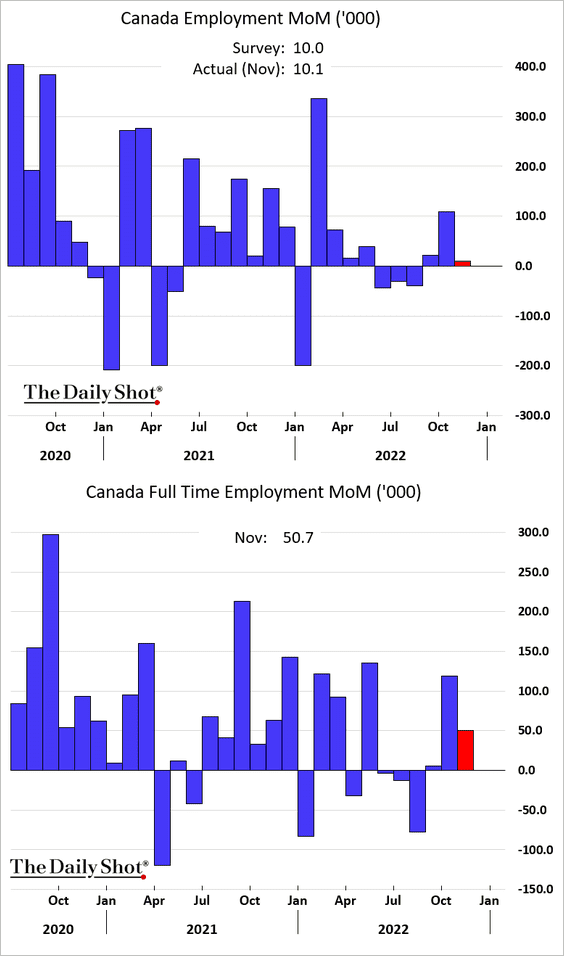
1. The November employment report was in line with expectations.
• Here is the November breakdown split between the goods and services sectors.
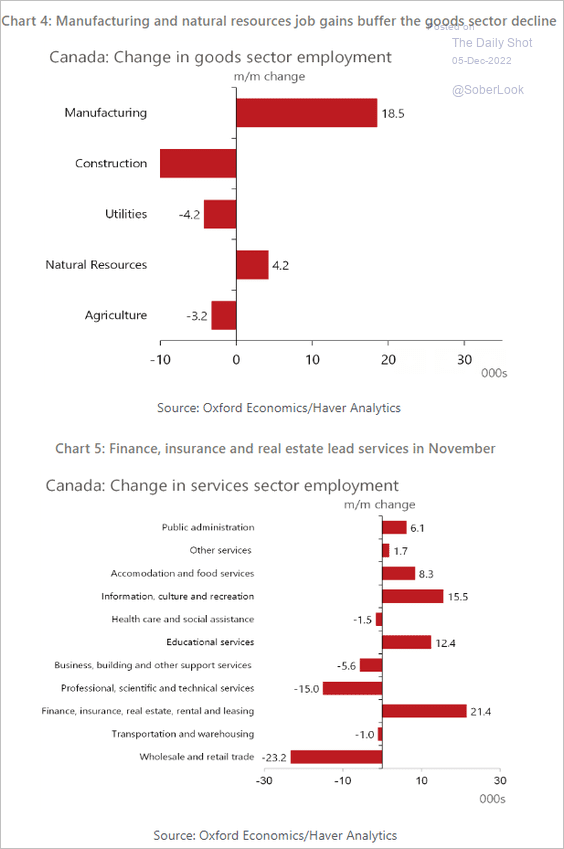 Source: Oxford Economics
• Employment remains well above pre-COVID levels.
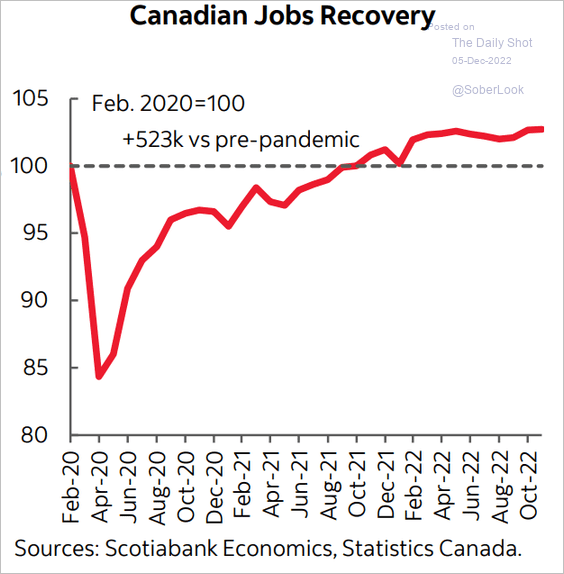 Source: Scotiabank Economics
• The unemployment rate was below forecasts.
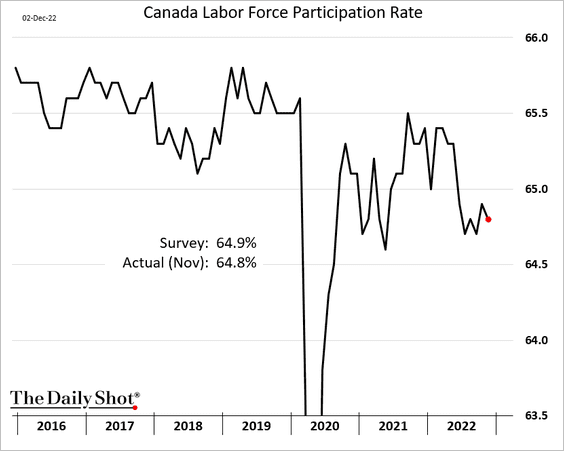
• Labor-force participation edged lower.
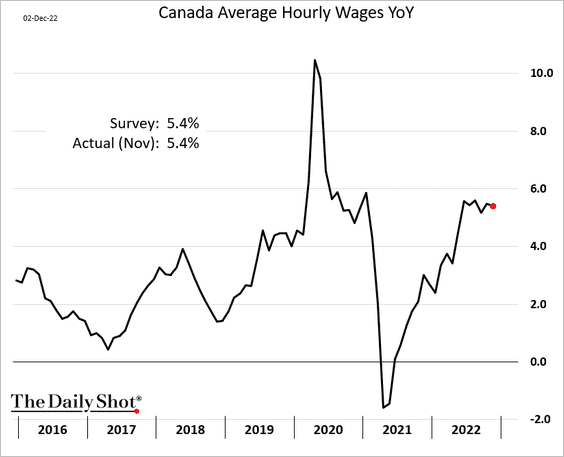
• Wage growth is holding at elevated levels.
——————–
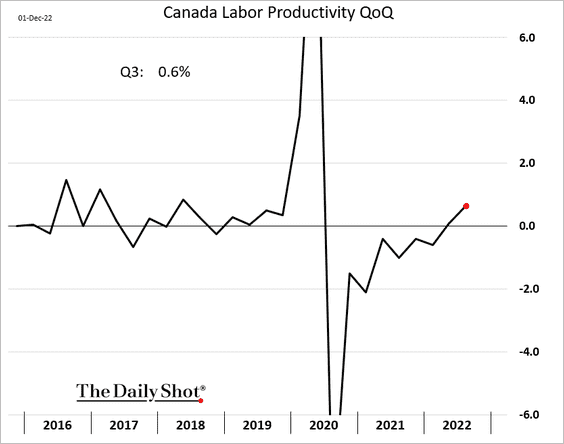
2. Labor productivity growth has finally returned to growth.
3. The yield curve hasn’t been this inverted in recent decades.
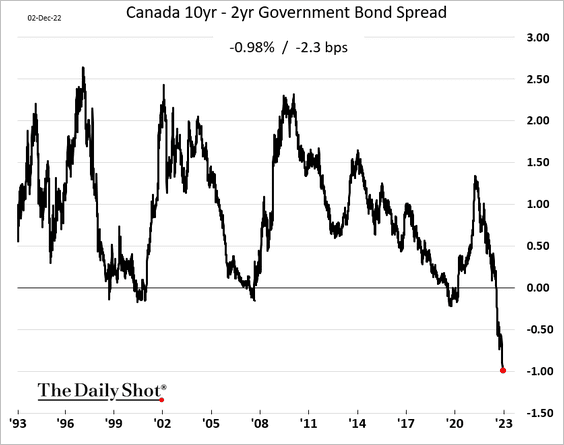
 Source: Reuters Read full article
——————–
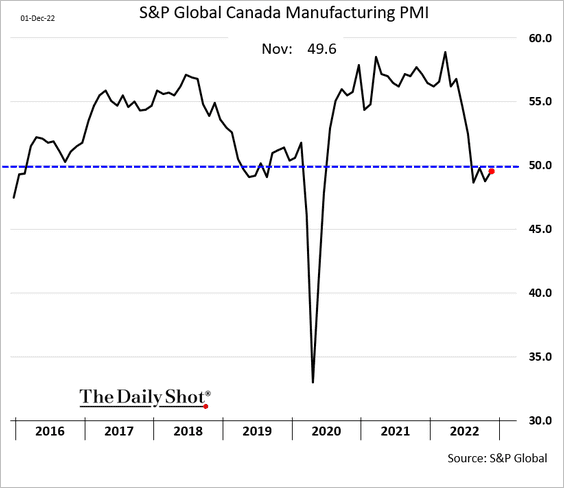
4. Manufacturing activity is relatively stable (PMI close to 50).
Back to Index
The United Kingdom
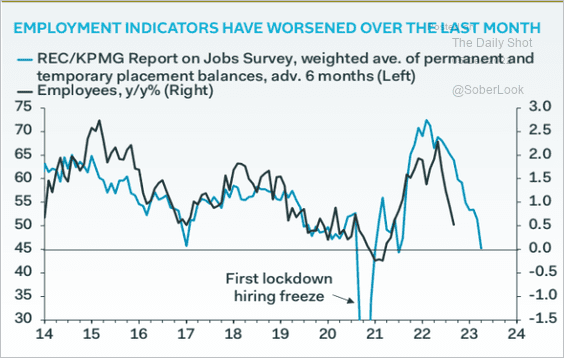
1. The labor market is likely to face some headwinds.
 Source: Pantheon Macroeconomics
2. This chart shows the CPI components.
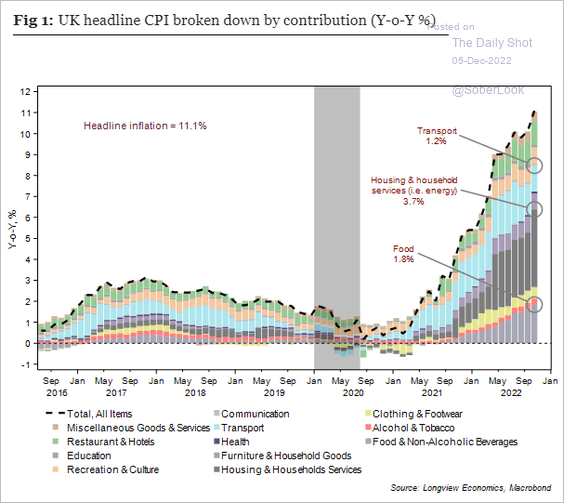 Source: Longview Economics
Housing and household services inflation has been surging.
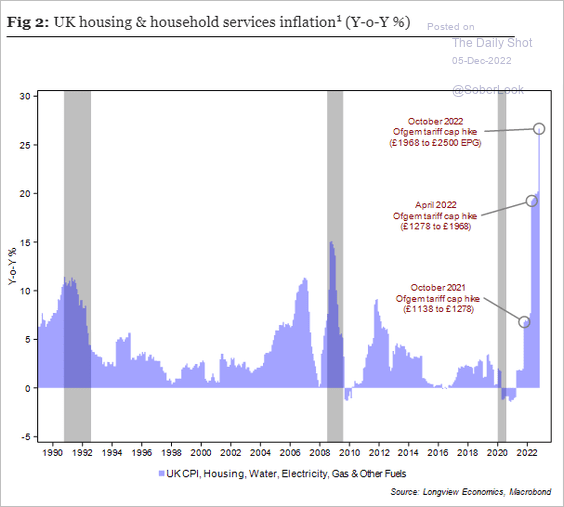 Source: Longview Economics
——————–
3. UK growth is lagging European peers.
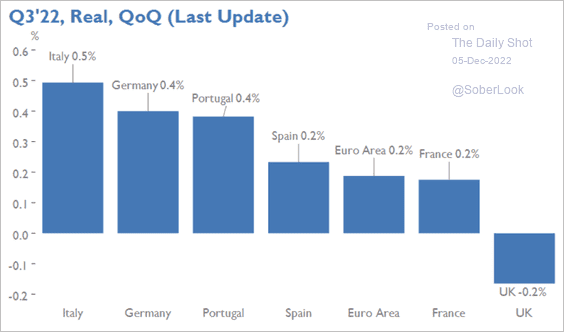 Source: Arcano Economics
Back to Index
The Eurozone
1. The PPI is off the highs.
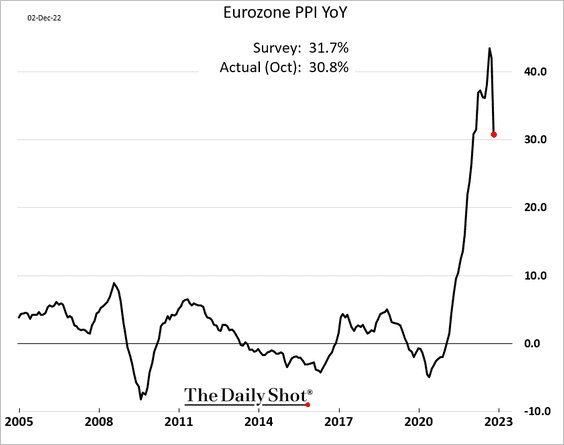
Despite signs of inflation peaking, the expected ECB terminal rate appears to be too low to tame inflation.
 Source: Nordea Markets
——————–
2. The labor market remains tight.
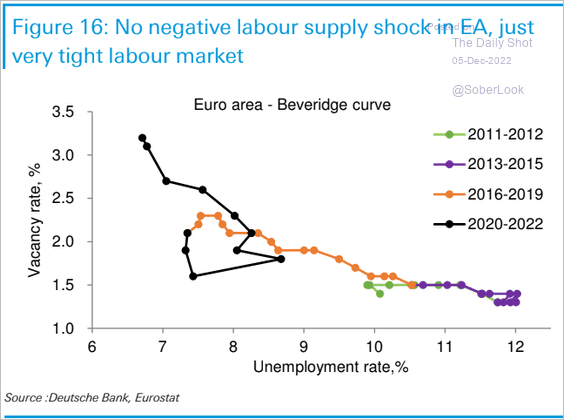 Source: Deutsche Bank Research
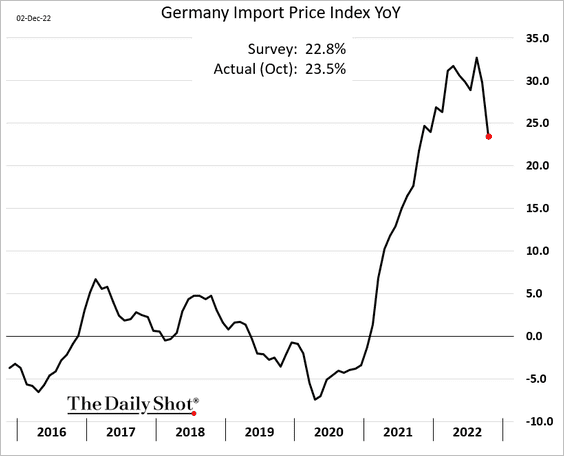
3. Germany’s trade surplus bounced from the lows in October.
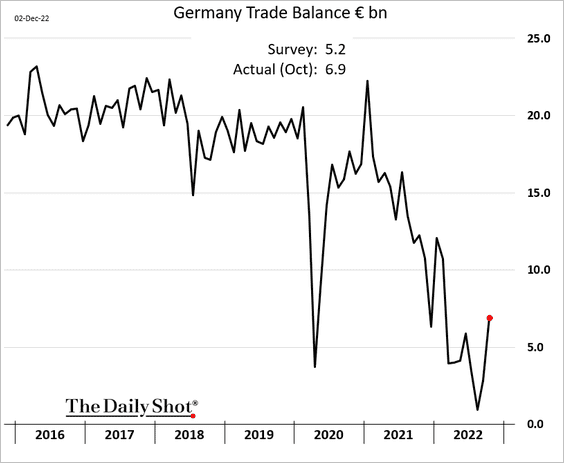
Import price inflation is moderating.
——————–
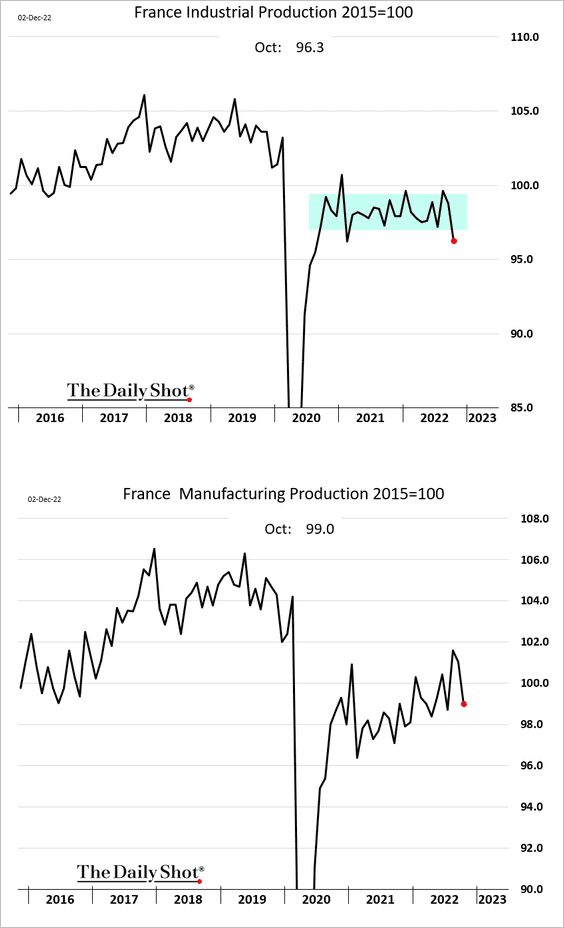
4. French industrial production declined in October.
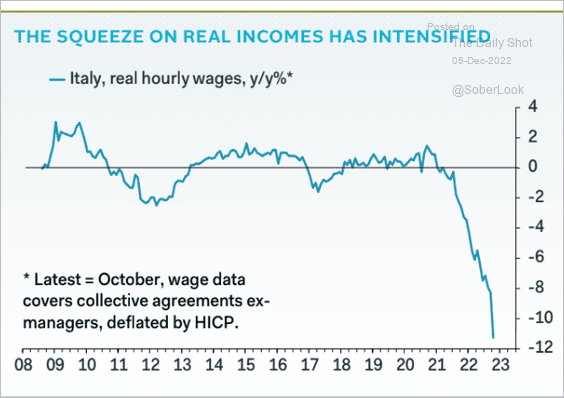
5. Italian real wages are crashing.
 Source: Pantheon Macroeconomics
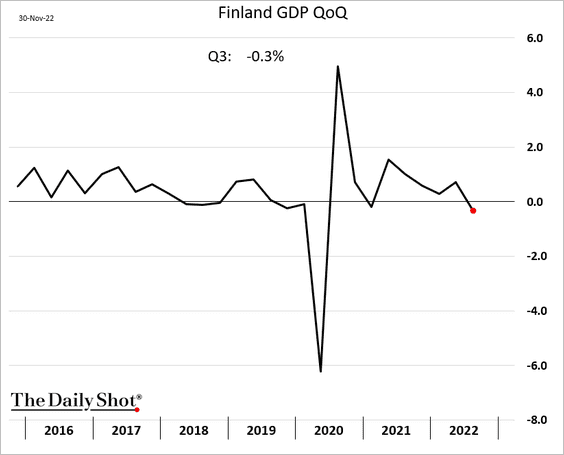
6. Finland’s GDP contracted last quarter.
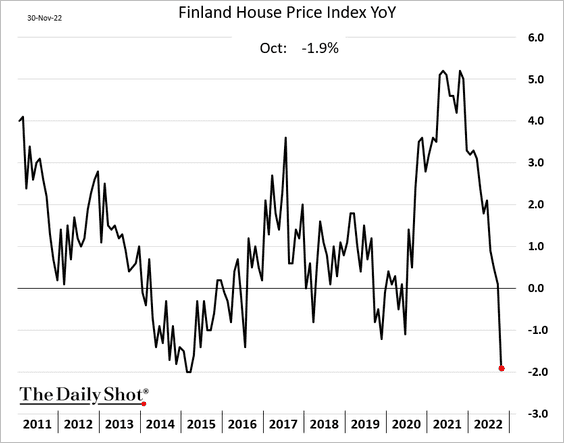
Home prices are falling.
Back to Index
Europe
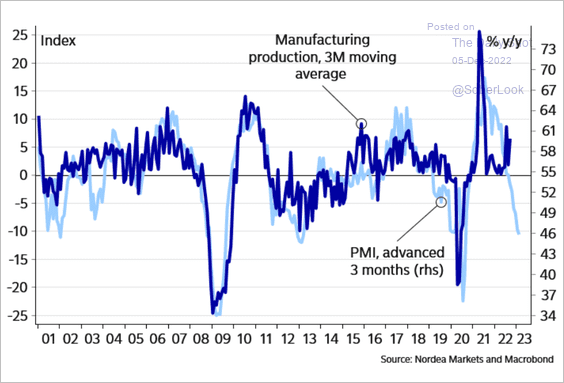
1. Sweden’s manufacturing sector appears to be in recession.
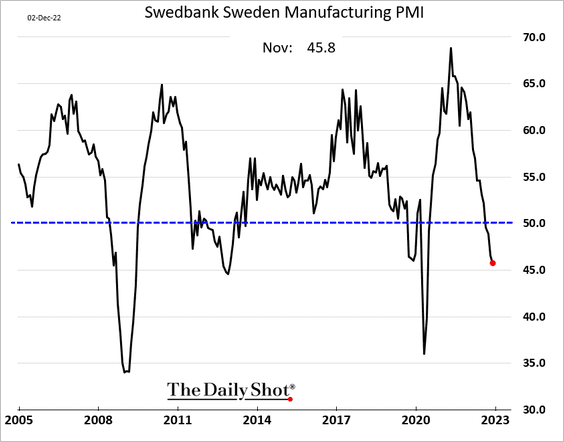
Manufacturing output is expected to follow the PMI into negative territory.
Source: Nordea Markets
——————–
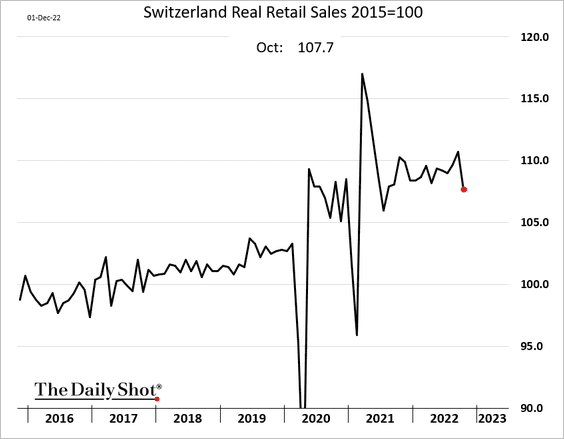
2. Swiss core inflation remains elevated (for Switzerland).
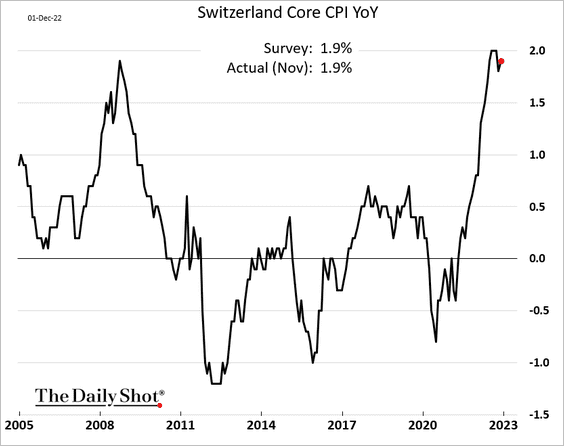
Retail sales took a hit in October.
——————–
3. Poland’s inflation appears to be peaking.
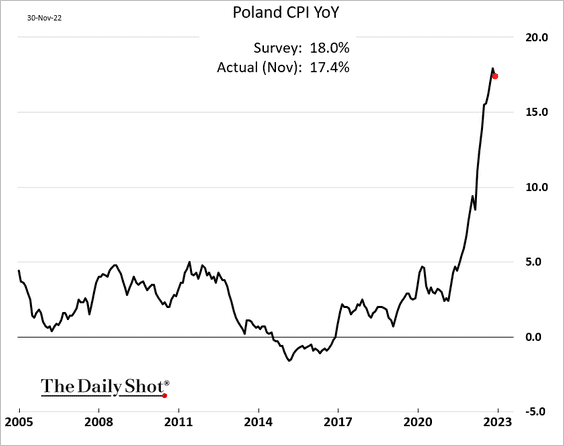
Factory activity continues to contract.
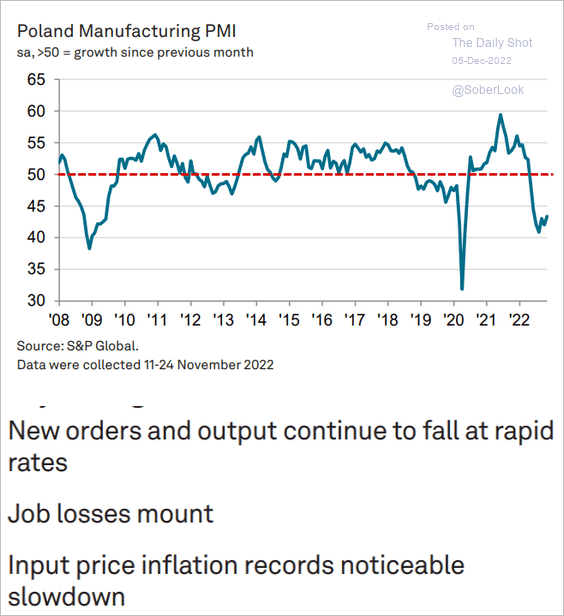 Source: S&P Global PMI
——————–
4. The Czech manufacturing sector is also in recession.
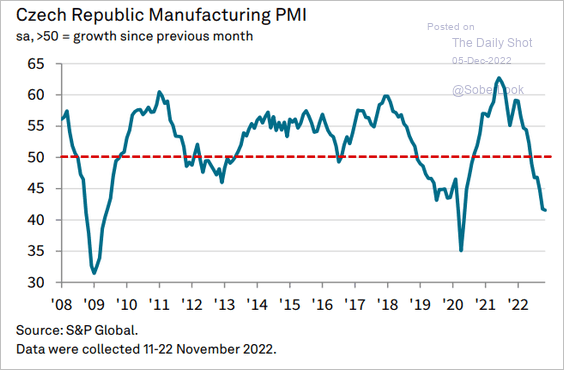 Source: S&P Global PMI
5. Here are the debt-to-GDP ratios across the EU.
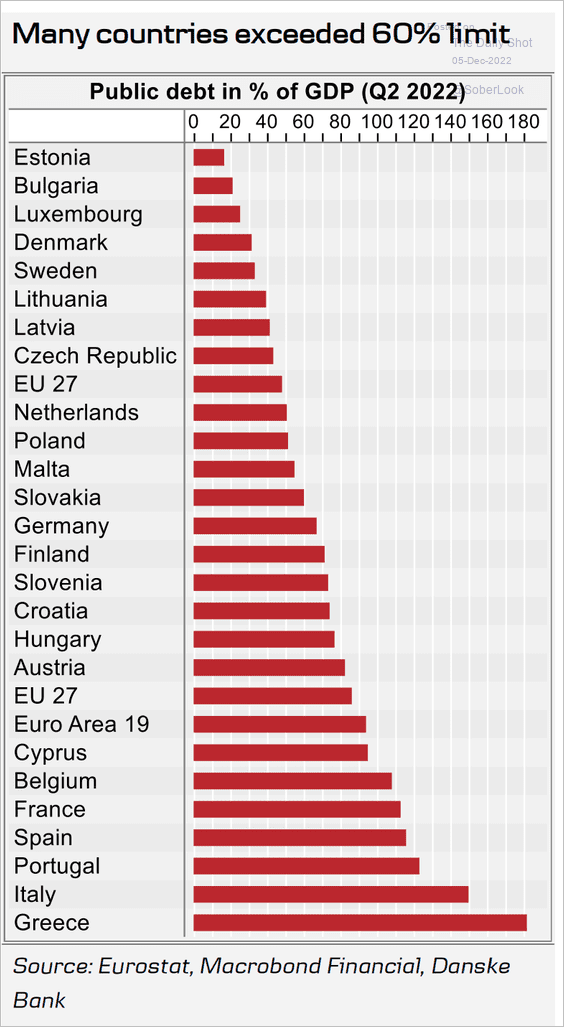 Source: Danske Bank
6. This chart shows agricultural output growth by country.
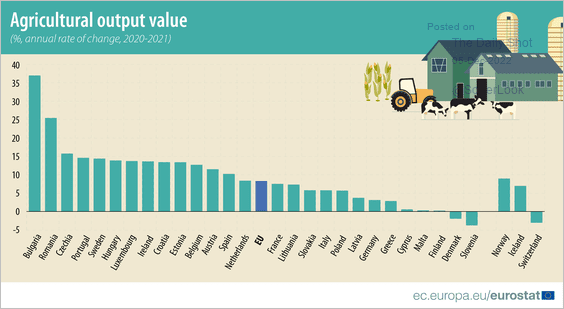 Source: Eurostat Read full article
7. Europe needs more LNG terminals.
 Source: Statista
8. Finally, this map shows migrant routes into the EU.
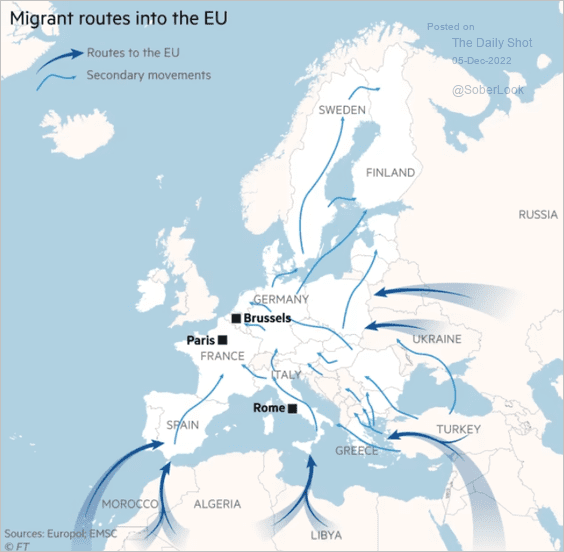 Source: @financialtimes Read full article
Back to Index
China
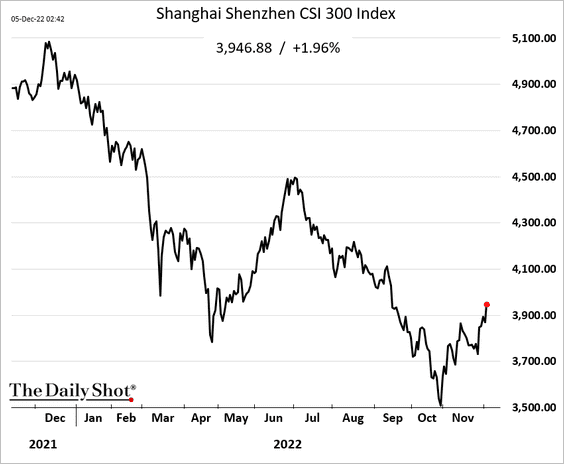
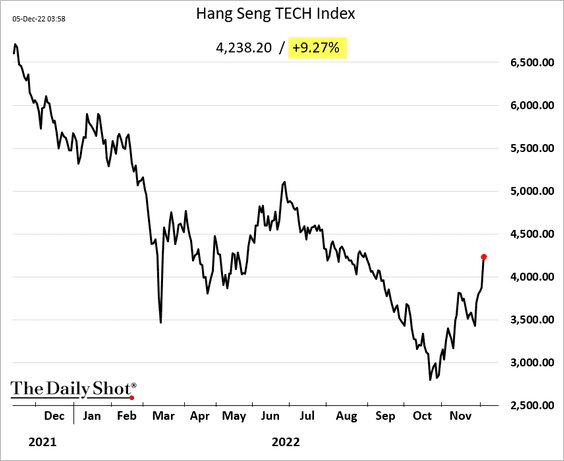
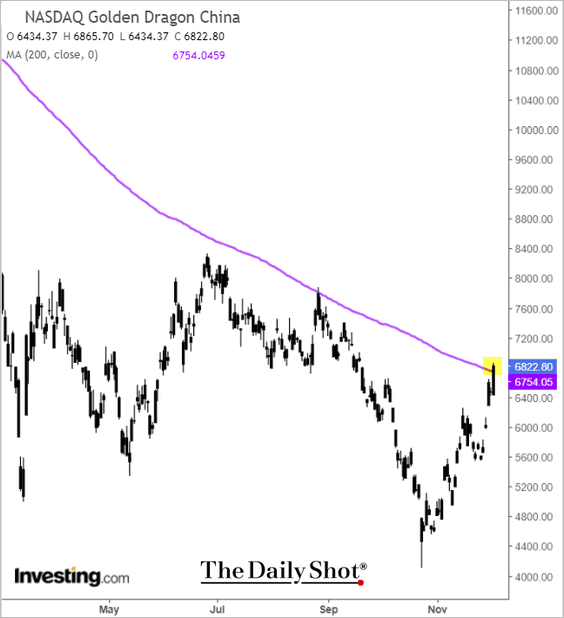
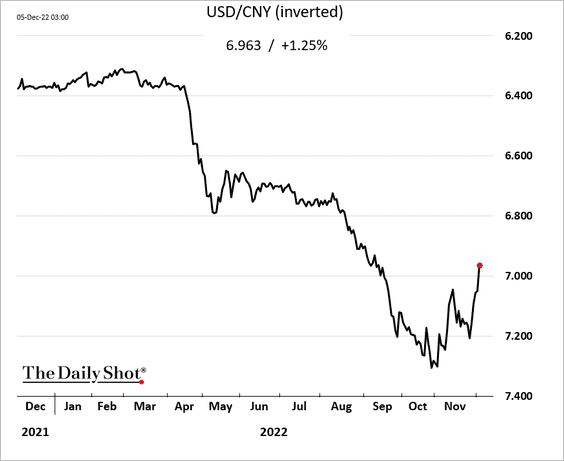
1. Stocks are surging as foreign capital returns – driven by easing lockdowns.
 Source: Sky News Read full article
The index of US-listed stocks is testing resistance at the 200-day moving average.
The renminbi is sharply higher as well.
——————–
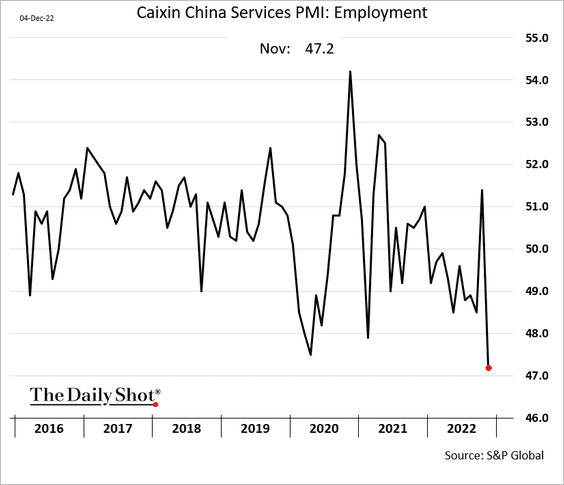
2. The S&P Global PMI report showed service firms struggling amid lockdowns.
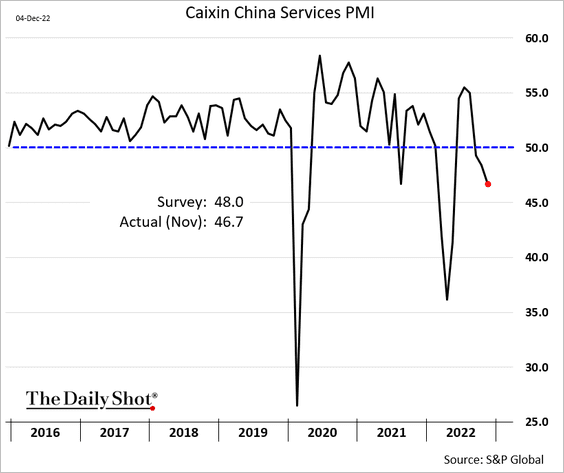
The employment index declined sharply.
——————–
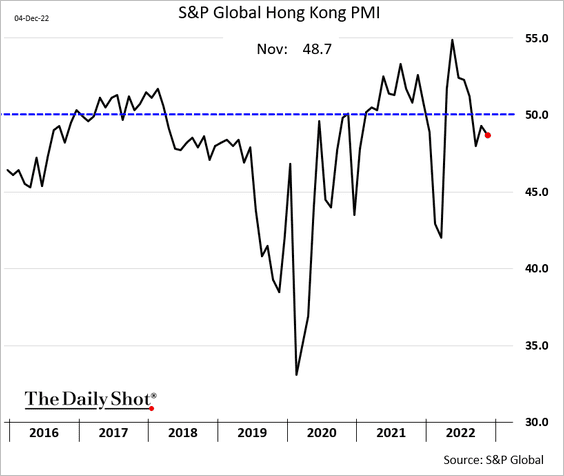
3. Hong Kong’s business sector activity remains in contraction territory.
4. Gavekal expects a modest improvement in construction starts next year.
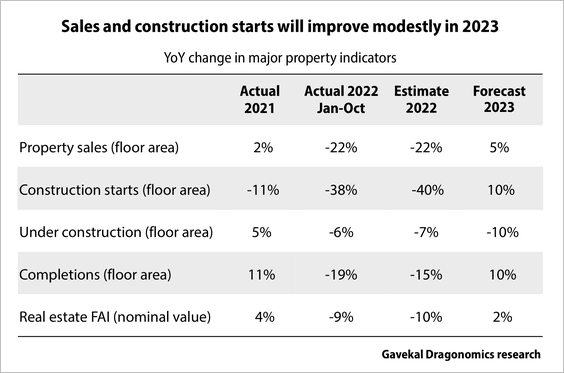 Source: Gavekal Research
5. Exports are expected to slow.
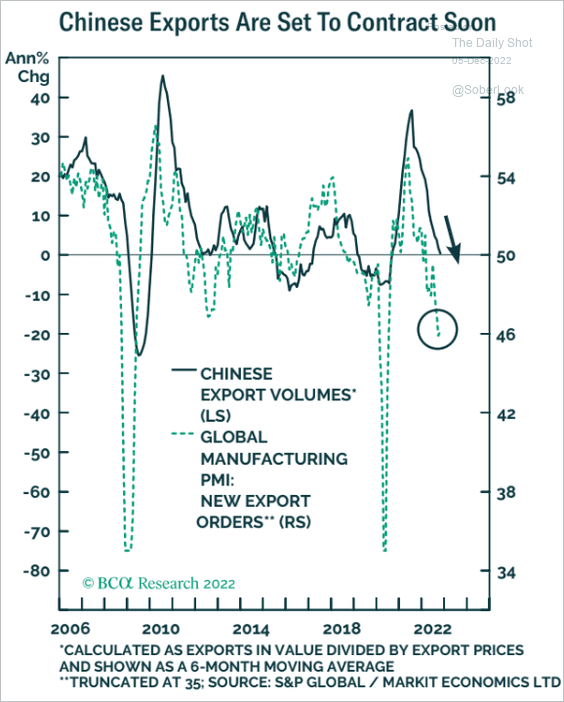 Source: BCA Research
Back to Index
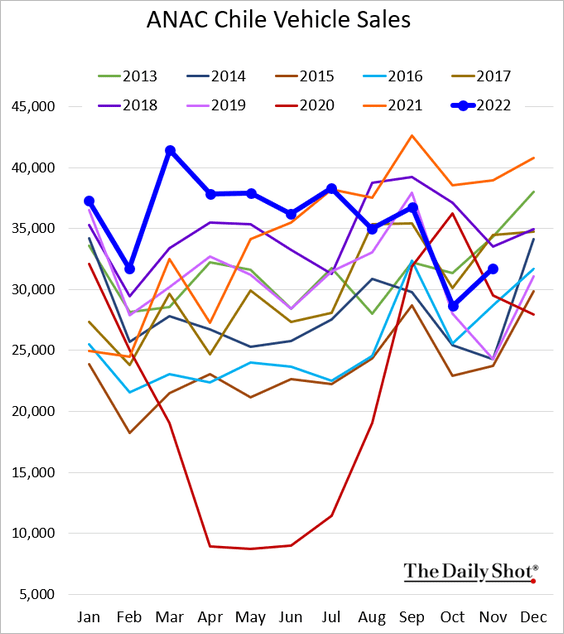
Emerging Markets
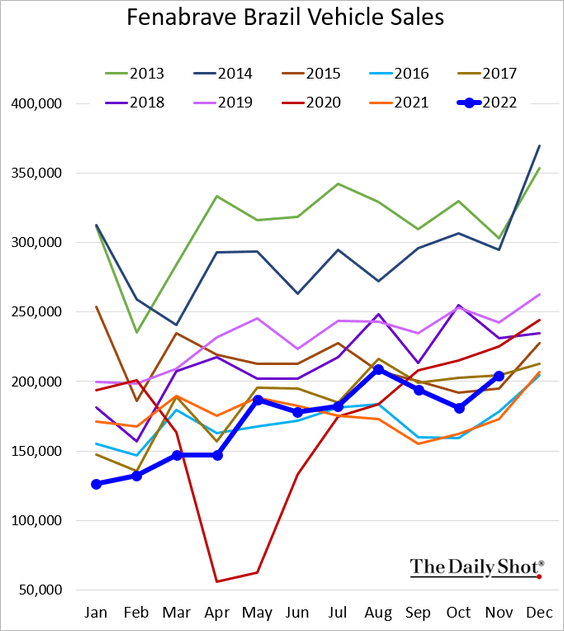
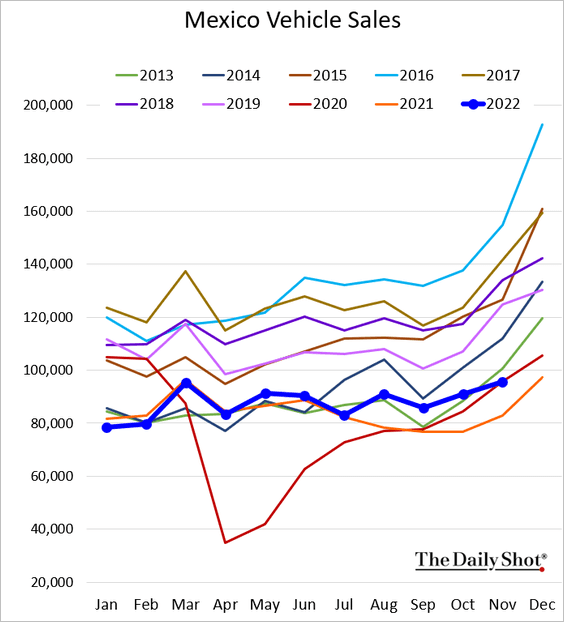
1. Let’s begin with LatAm vehicle sales.
• Brazil (some improvement):
• Mexico (back at 2020 levels):
• Chile (some gains):
——————–
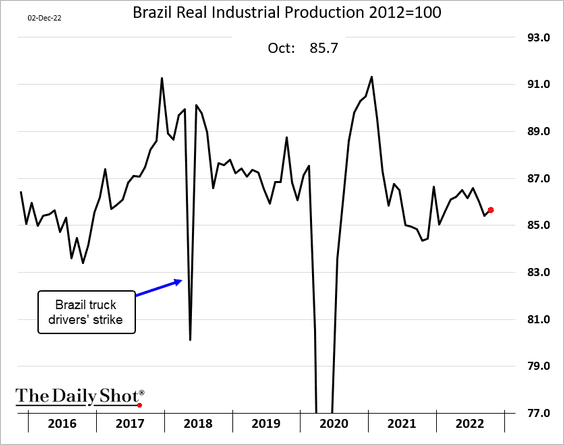
2. Brazil’s industrial production edged higher in October.
3. India has increasingly become a lender to other countries.
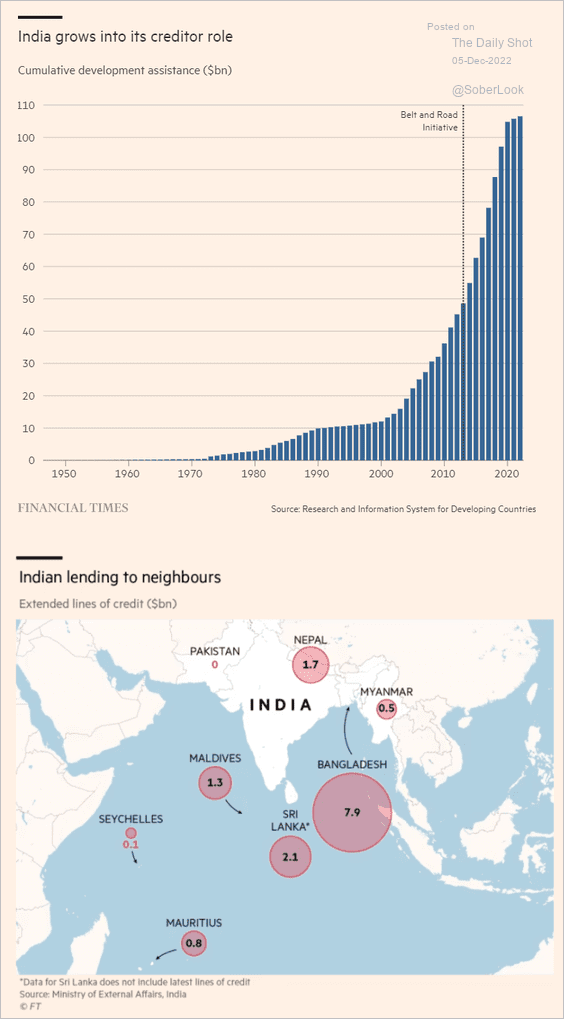 Source: @financialtimes Read full article
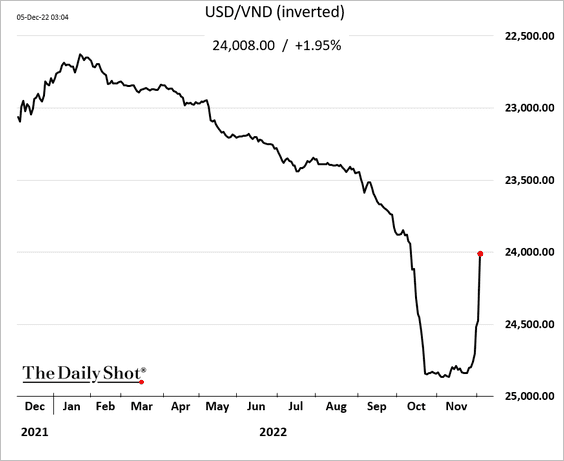
4. The Vietnamese dong is rebounding with the renminbi.
5. EM equity markets’ return dispersion has blown out.
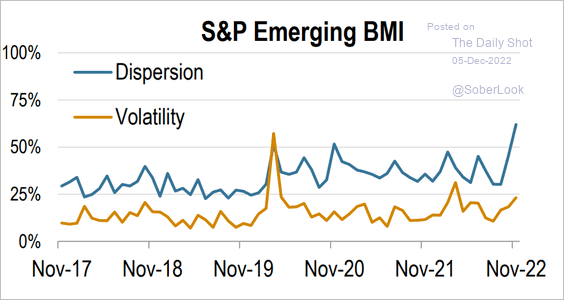 Source: S&P Dow Jones Indices
Back to Index
Commodities
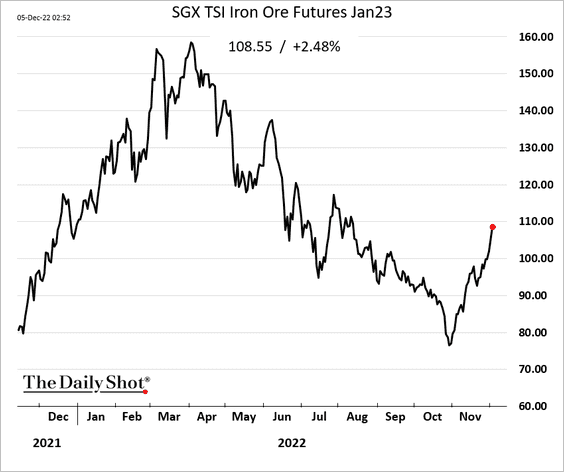
1. Iron ore and other industrial commodities are rebounding on “China reopening” expectations.
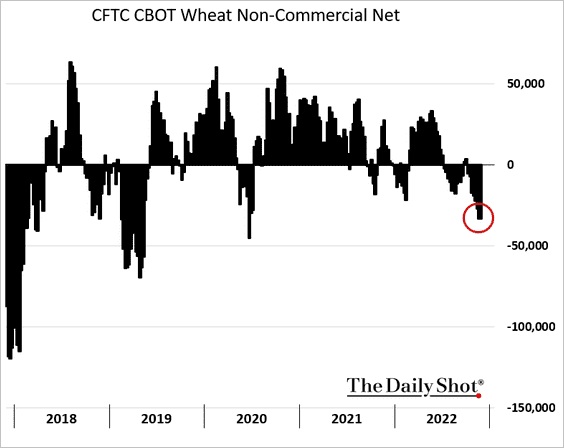
2. Traders are betting against US wheat futures.
Back to Index
Energy
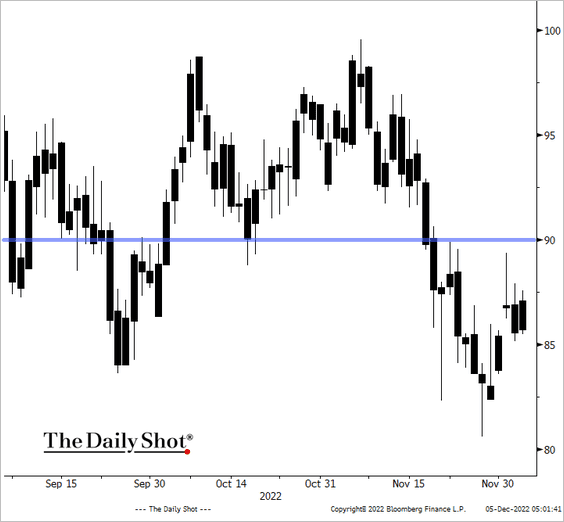
1. OPEC+ held policy steady after a massive cut last month.
 Source: Reuters Read full article
Brent is likely to test the $90/bbl level again.
 Source: @TheTerminal, Bloomberg Finance L.P.
——————–
2. Demand for tankers to move Russian crude has been rising (building the “shadow” tanker fleet).
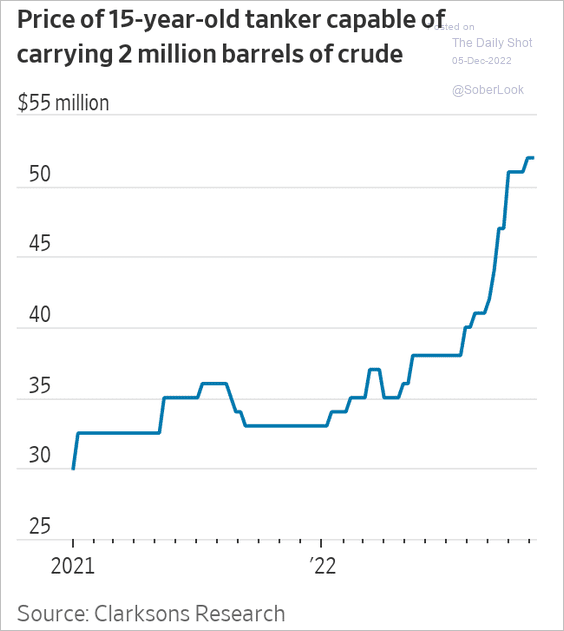 Source: @WSJ Read full article
The Urals spread has tightened some in recent months.
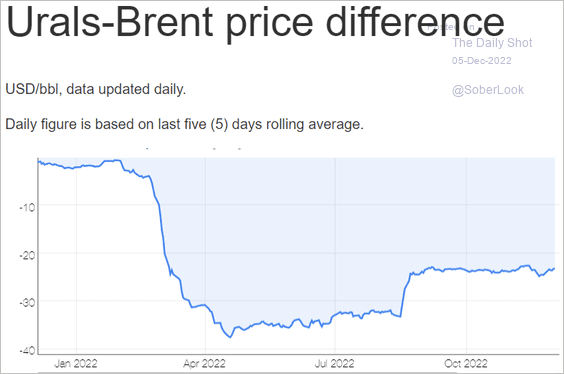 Source: Neste
——————–
3. The US Department of Energy has been downgrading its forecast for the nation’s crude oil output next year.
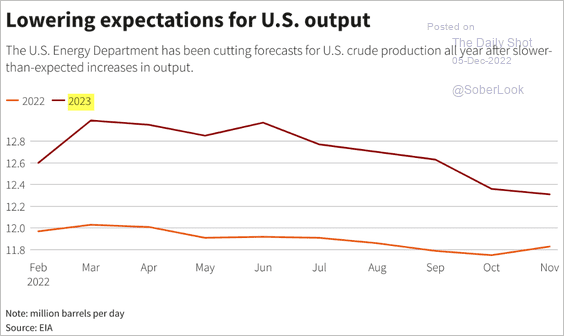 Source: Reuters Read full article
4. The OECD’s energy spending hasn’t been this high in decades.
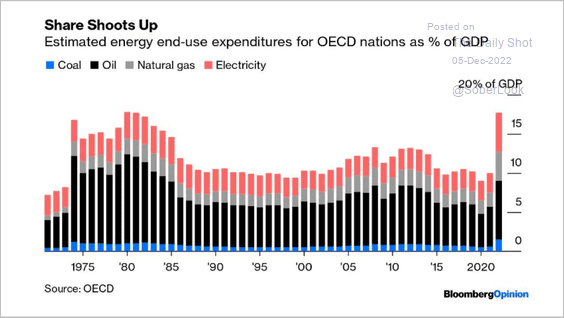 Source: Javier Blas; Bloomberg Read full article
5. The spread between US diesel and gasoline prices has blown out (on diesel shortages).
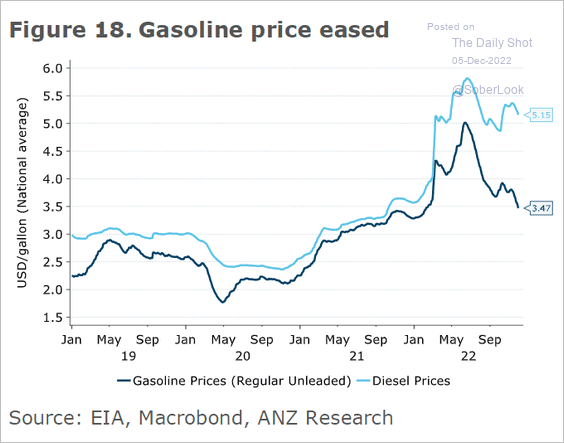 Source: @ANZ_Research
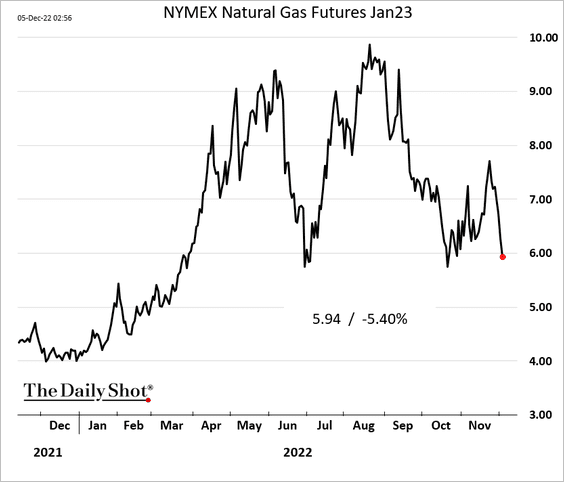
6. US natural gas futures tumbled over the past few days as inventories declined less than expected.
Back to Index
Equities
1. The Dow’s outperformance vs. the S&P 500 hasn’t been this large since the 1930s.
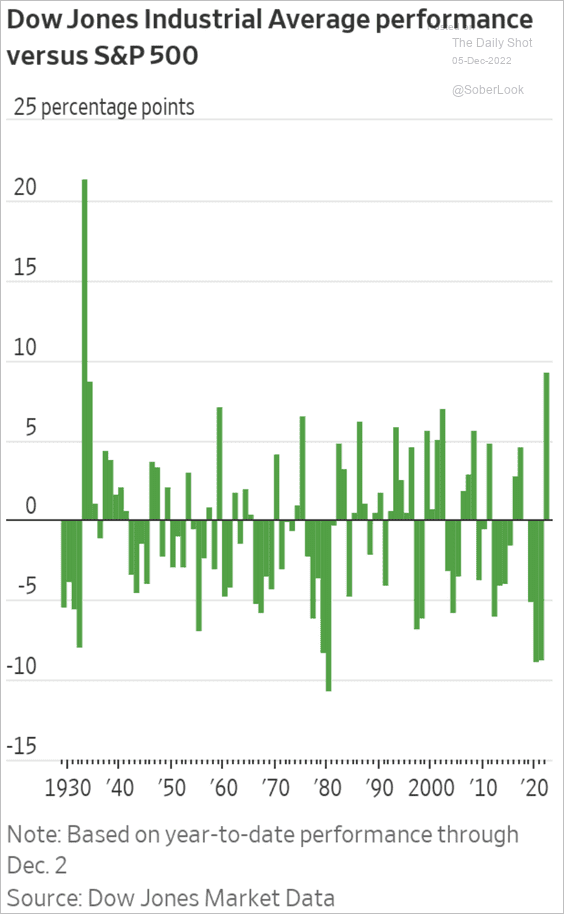 Source: @WSJ Read full article
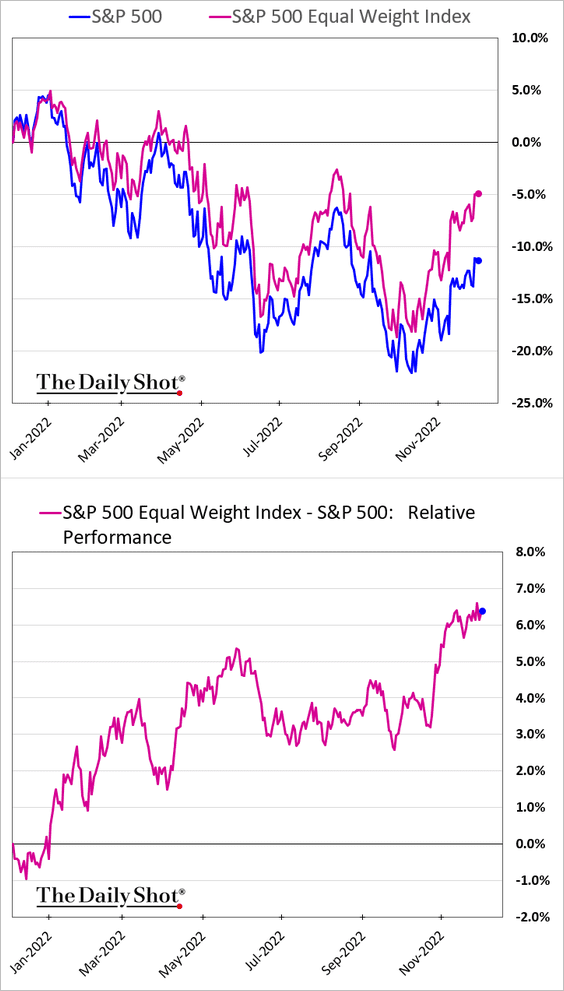
2. The S&P 500 equal-weight index continues to outperform.
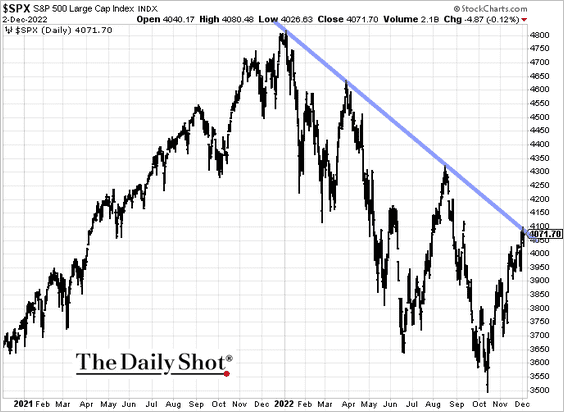
3. The S&P 500 is holding its downtrend resistance.
4. Positioning remains cautious, according to Deutsche Bank’s consolidated positioning indicator.
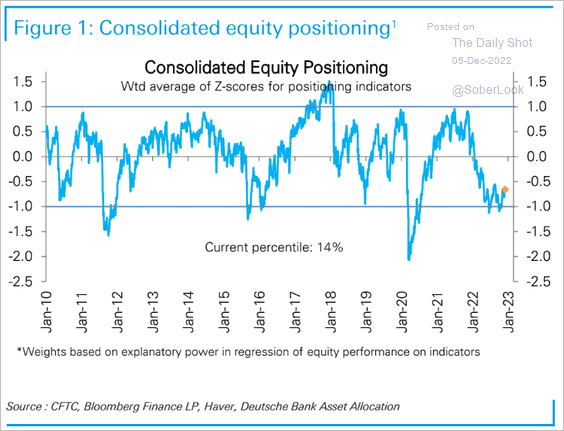 Source: Deutsche Bank Research
But equity futures positioning has moved into positive territory.
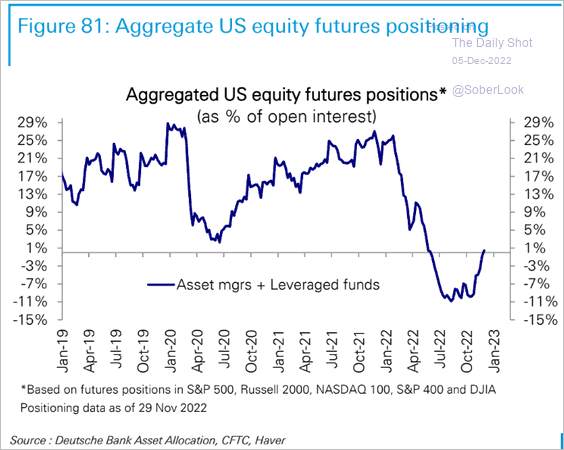 Source: Deutsche Bank Research
——————–
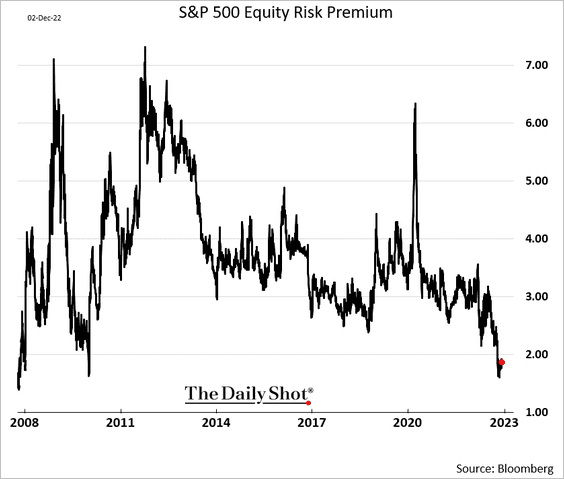
5. Equity risk premium remains near extreme lows.
6. ETF flows have been robust this year despite the market rout.
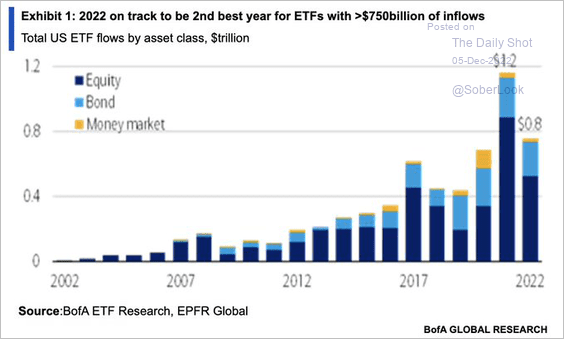 Source: BofA Global Research; @SamRo
Equity fund flows have decoupled from global business activity.
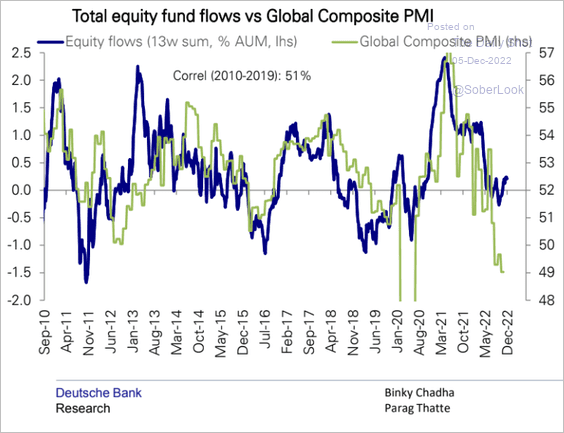 Source: Deutsche Bank Research
——————–
7. Finally, let’s take a look at what’s driving the S&P 500 implied volatility term structure.
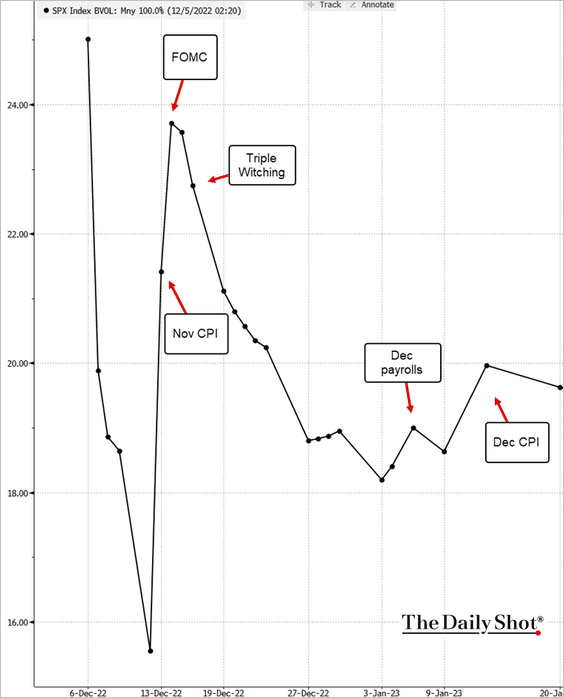 Source: @TheTerminal, Bloomberg Finance L.P.
Back to Index
Credit
1. Higher funding costs are putting pressure on LBO valuations.
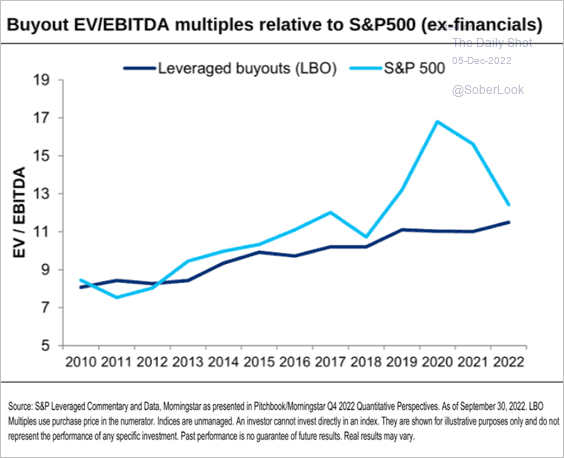 Source: Citi Private Bank
2. BofA private clients have been getting out of leveraged loans.
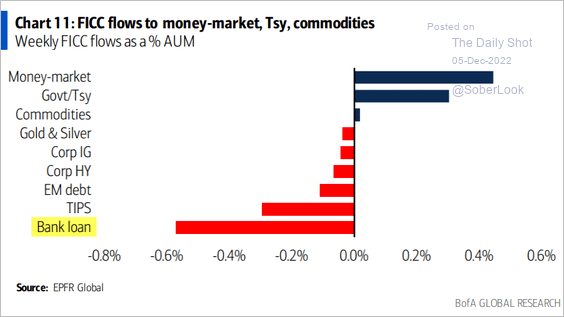 Source: BofA Global Research
3. Business development company (BDCs) assets have doubled since 2020, but remain vulnerable to an economic contraction.
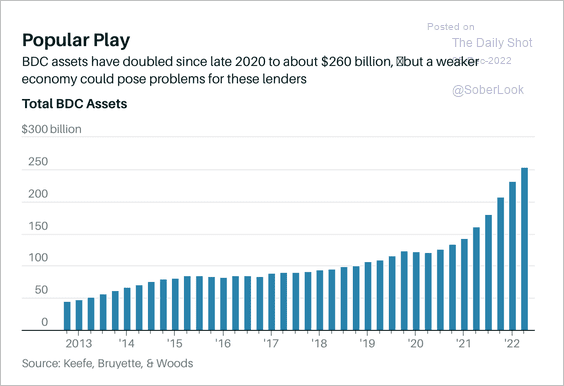 Source: Barron’s Read full article
4. The special servicing rate (percentage of commercial real estate loans that have defaulted) is ticking higher among retail and office loans.
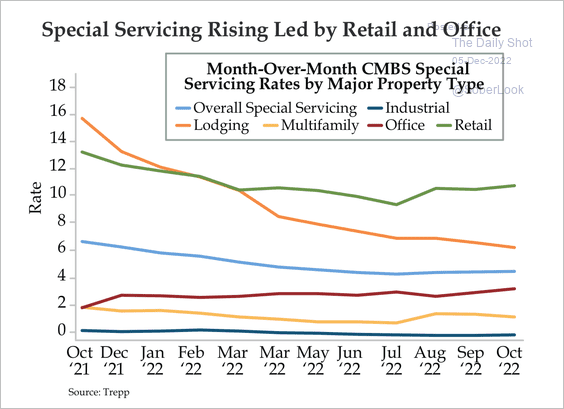 Source: Quill Intelligence
Back to Index
Rates
1. The iShares 20+ Year Treasury Bond ETF (TLT) got some inflows last week.
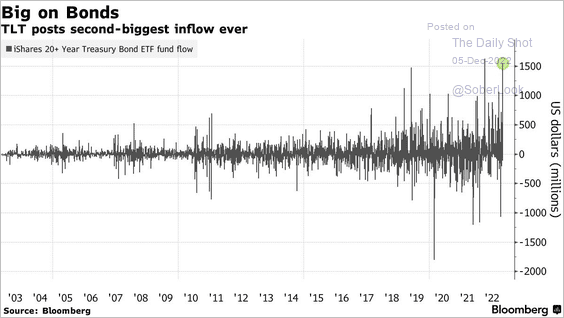 Source: @kgreifeld, @markets Read full article
2. Speculative accounts continue to hold large bets against Treasuries.
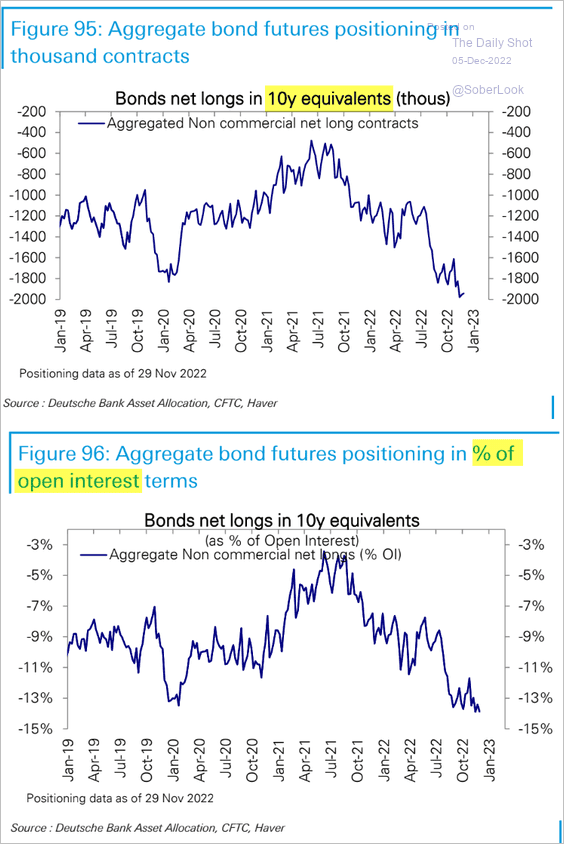 Source: Deutsche Bank Research
3. Higher private-sector repo rates make the Fed’s RRP program less attractive.
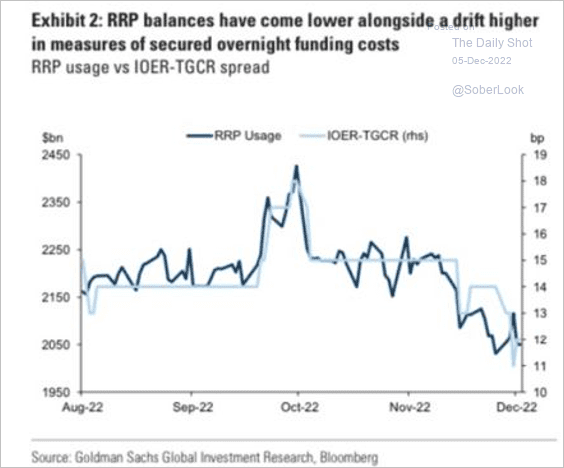 Source: Goldman Sachs
Back to Index
Global Developments
1. Speculative accounts continue to bet against the US dollar.
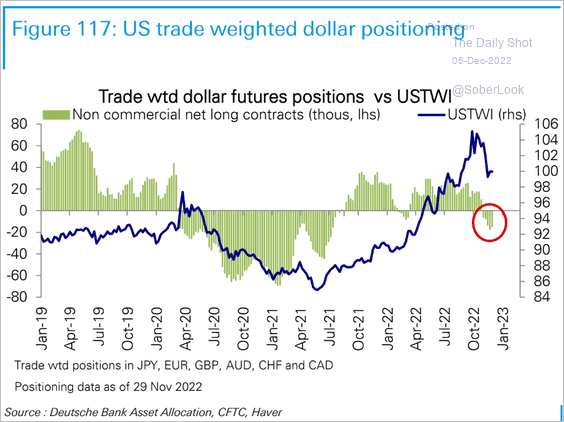 Source: Deutsche Bank Research
The dollar tends to weaken at the end of the year.
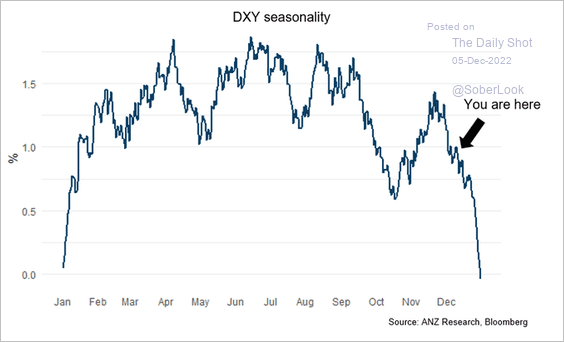 Source: @macroJB
——————–
2. Here is a forecast for global goods trade from Oxford Economics.
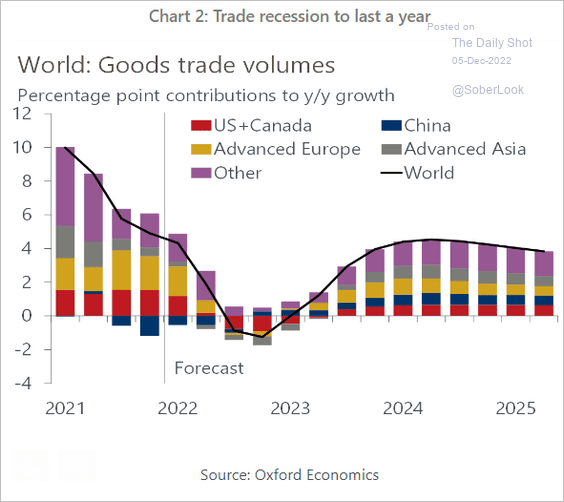 Source: Oxford Economics
3. The Rolex Price Index suggests that the luxury watch market may be bottoming.
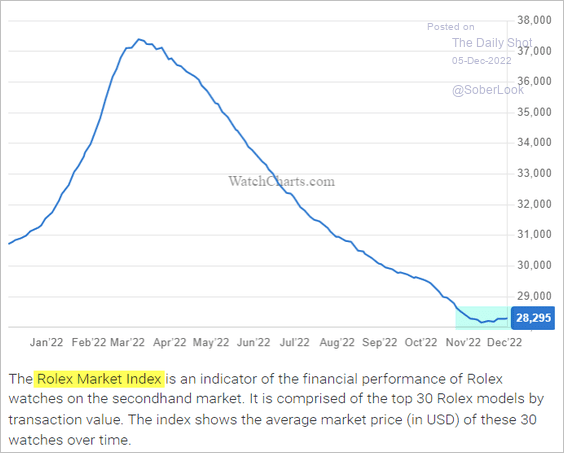 Source: WatchEnthusiasts
——————–
Food for Thought
1. Outpatient visits for respiratory illnesses that include fever and cough or sore throat:
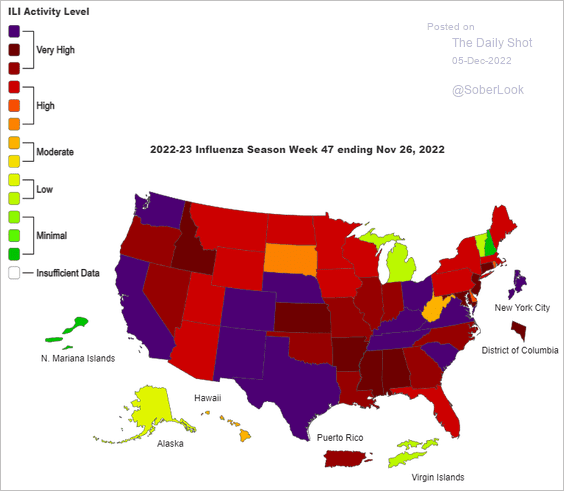 Source: CDC
2. How is your job impacting your mental health?
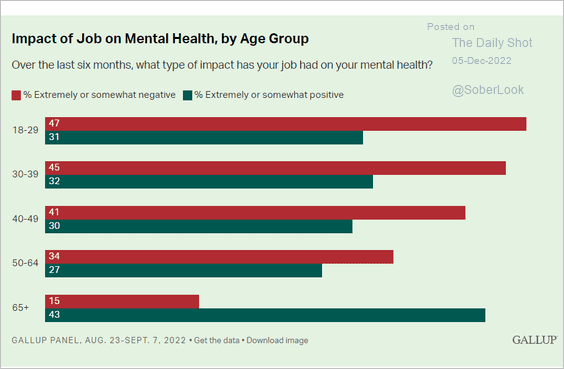 Source: Gallup Read full article
3. Ukraine’s crop exports:
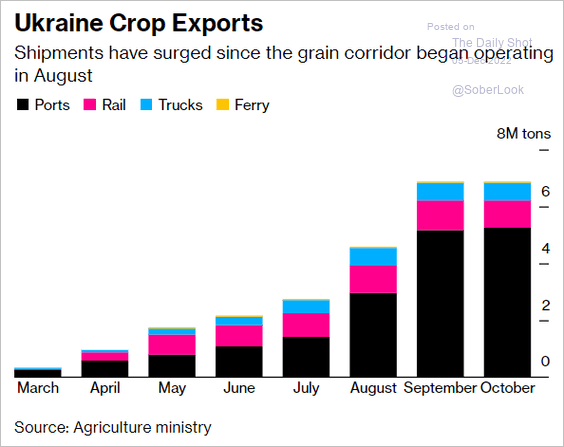 Source: @bpolitics Read full article
4. Balance of economic power:
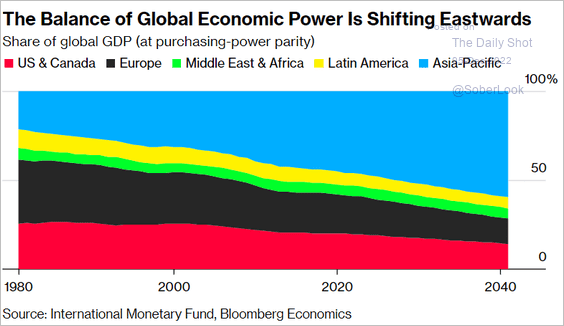 Source: @business Read full article
5. CO2 emissions per capita:
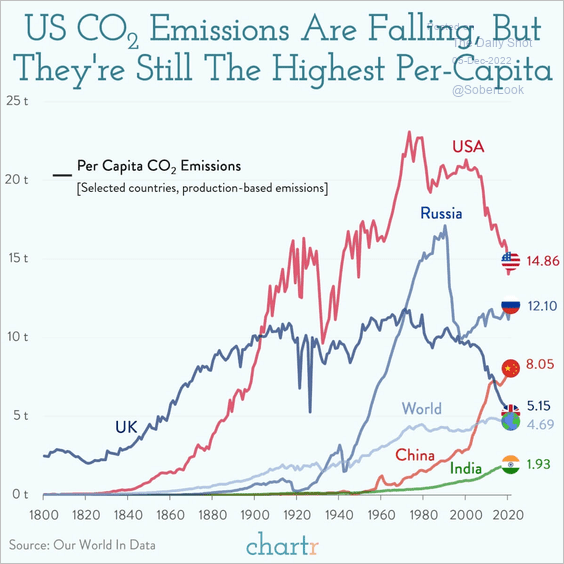 Source: @chartrdaily
6. Mismanaged plastic waste:
 Source: Visual Capitalist Read full article
7. US election spending:
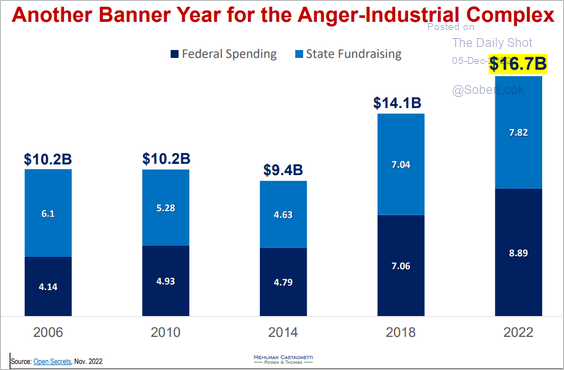 Source: Bruce Mehlman
8. Land usage:
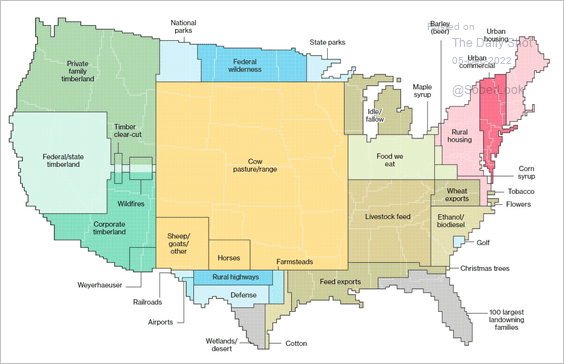 Source: @bbgvisualdata Read full article
——————–
Back to Index