
The Daily Shot: 02-Jan-23
• The United States
• Canada
• The Eurozone
• Europe
• Asia – Pacific
• China
• Emerging Markets
• Cryptocurrencies
• Commodities
• Energy
• Equities
• Credit
• Rates
• Global Developments
• Food for Thought
Happy New Year!
The United States
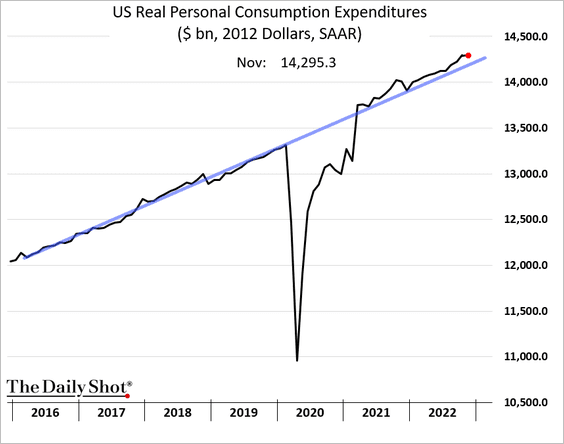
1. Real consumer spending was flat in November, but it remains on the pre-COVID trendline.
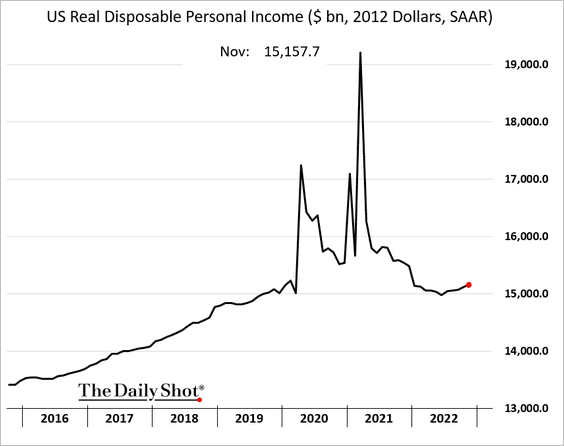
• Real disposable personal income has been recovering in recent months.
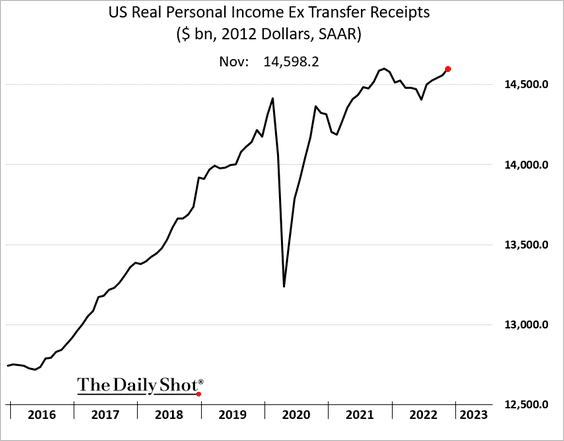
Here is personal income without government payments.
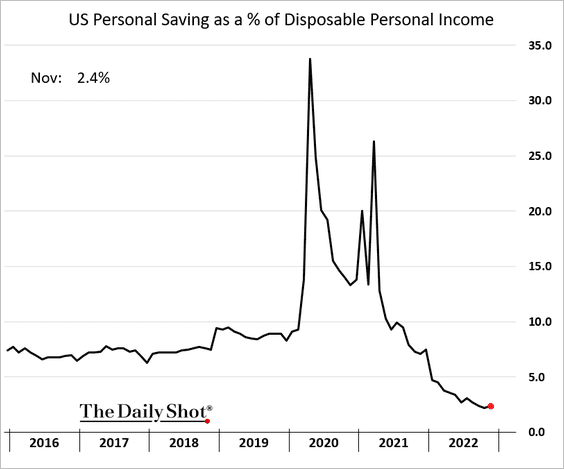
• Saving edged higher in November.
——————–
2. Durable goods orders declined sharply in November, with weakness driven by slower aircraft sales.
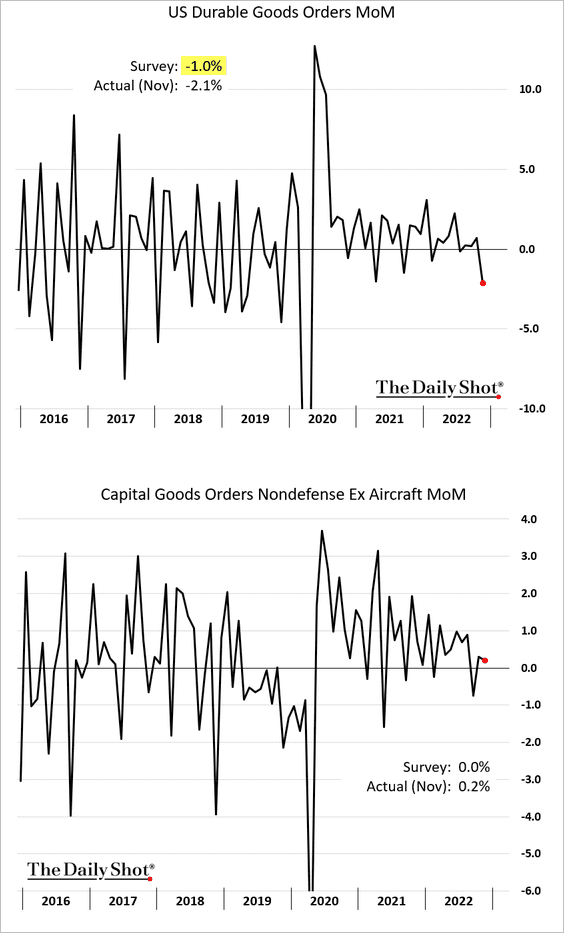
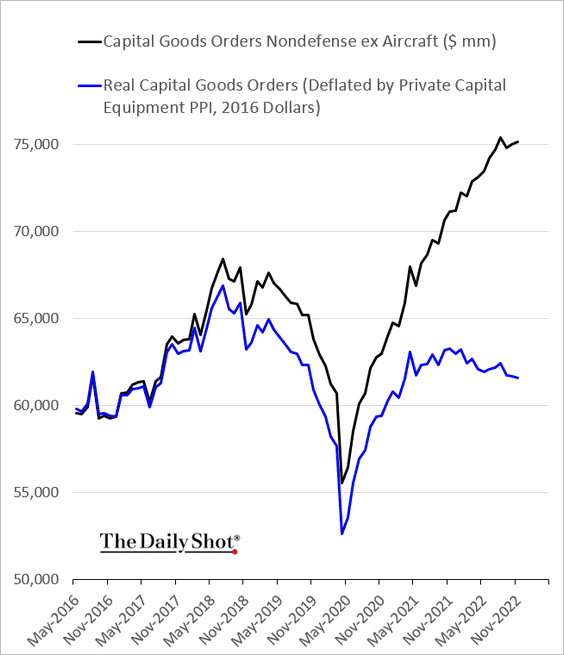
Real capital goods orders continue to roll over (blue line), signaling softer CapEx.
——————–
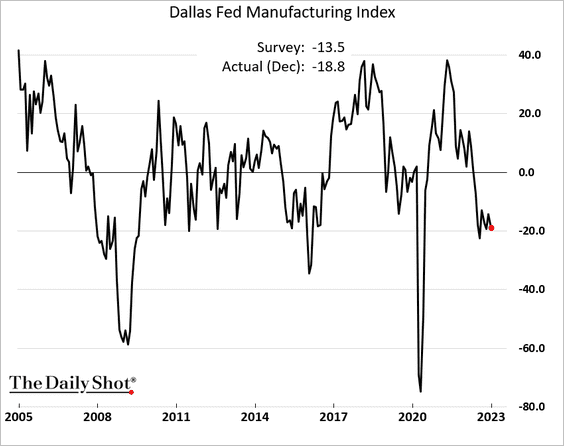
3. Next, let’s take a look at last week’s manufacturing reports.
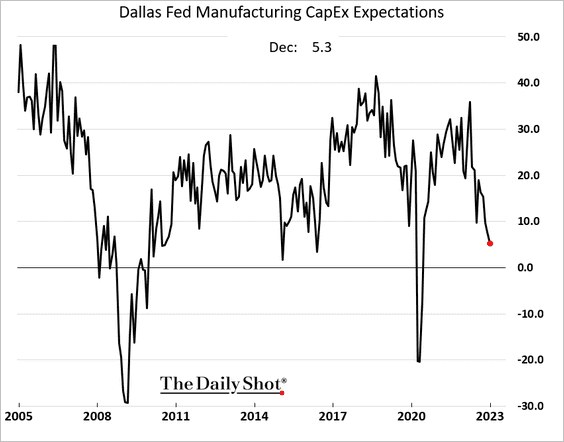
• The Dallas Fed’s manufacturing index shows persistent weakness.
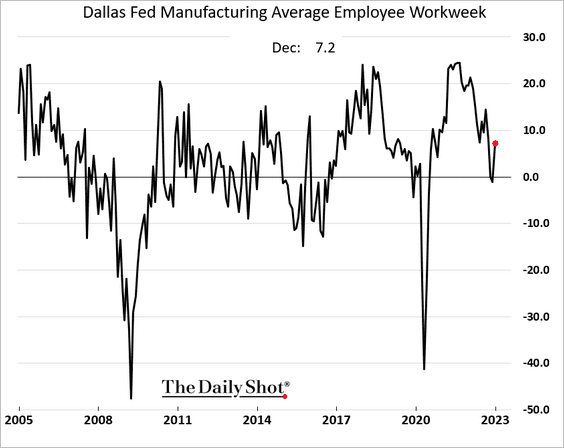
– The employment index bounced from the lows.
– CapEx expectations continue to ease.
——————–
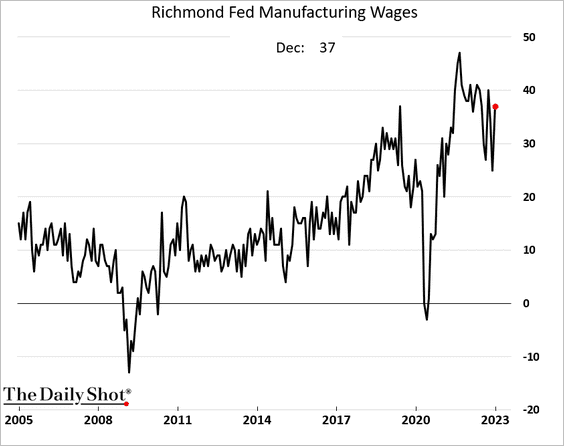
• The Richmond Fed’s manufacturing index is back in positive territory.
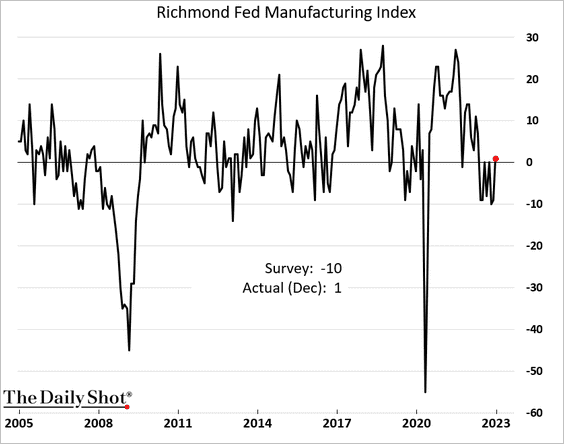
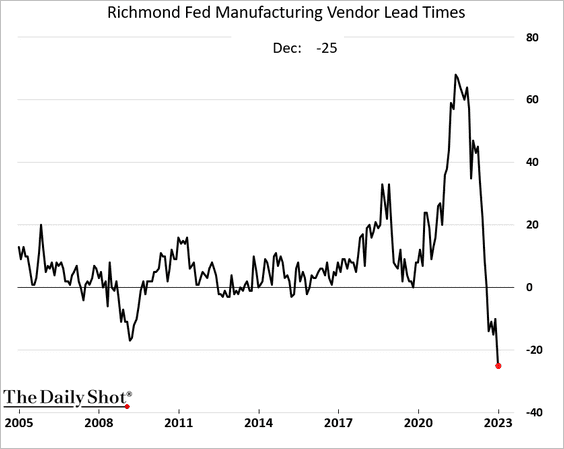
– Supplier delivery times are falling rapidly amid soft demand.
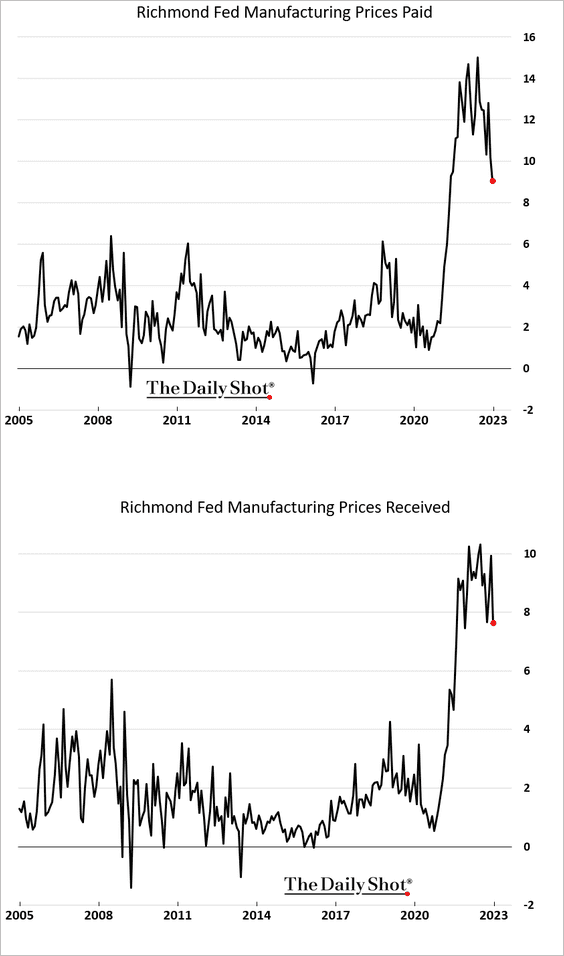
– Price indicators are still elevated.
– Wage growth has been persistently high.
——————–
• The MNI Chicago PMI bounced from the lows but is still in contraction territory.
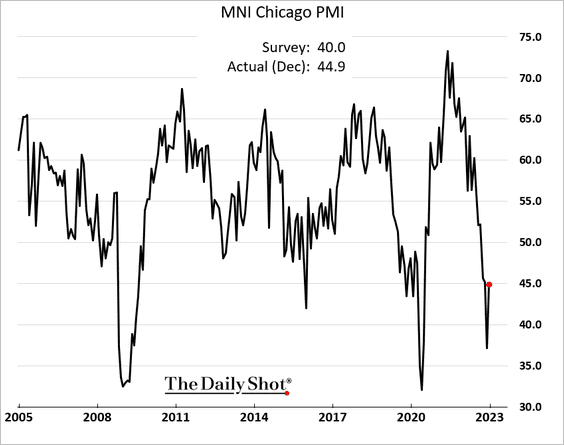
– Will we see further weakness in manufacturing at the national level (ISM)?
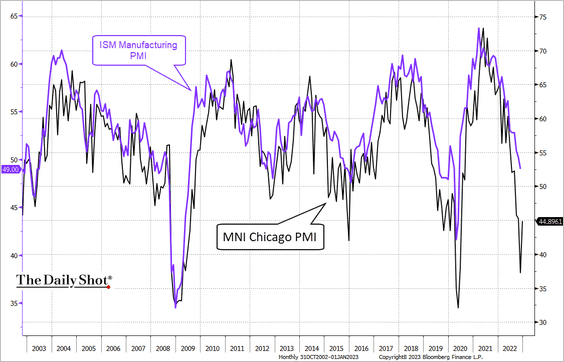 Source: @TheTerminal, Bloomberg Finance L.P.
——————–
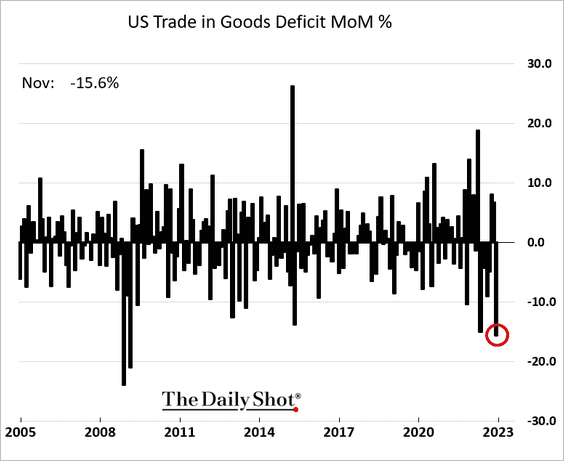
3. The goods trade gap narrowed sharply in November, …
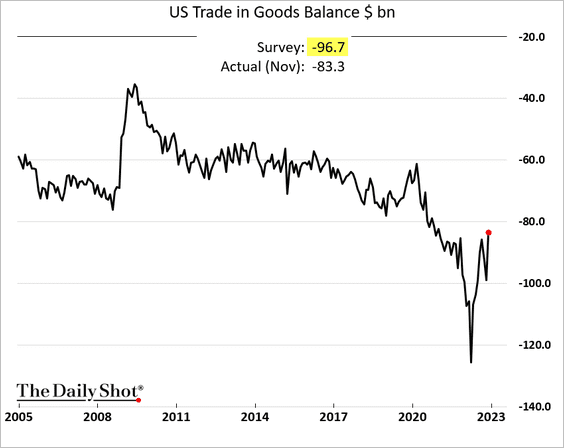
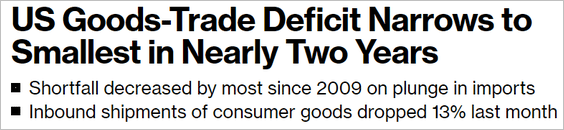 Source: @apgmonteiro, @business Read full article
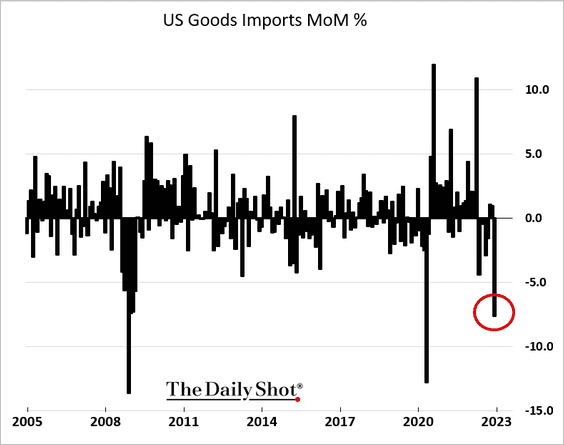
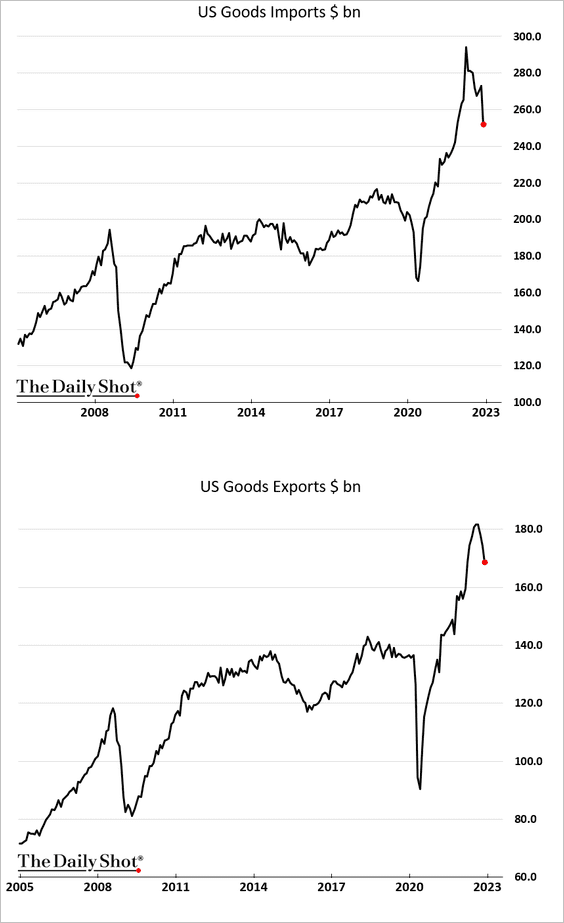
… as imports dropped faster than exports.
——————–
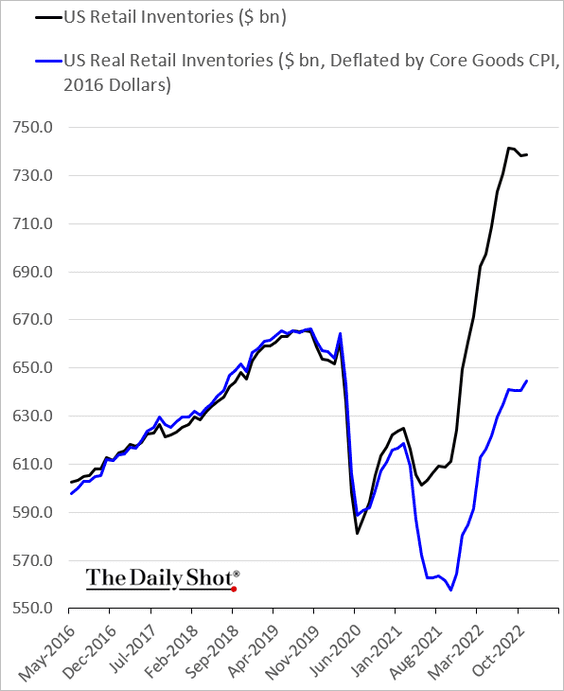
4. Real retail inventories continue to climb.
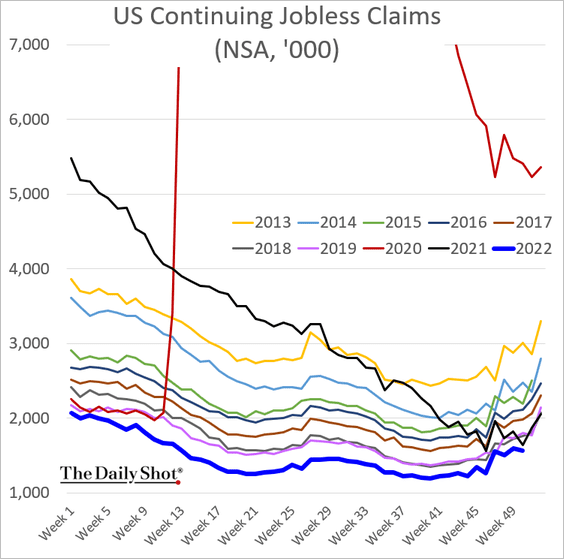
5. Unemployment benefits applications remain very low for this time of the year.
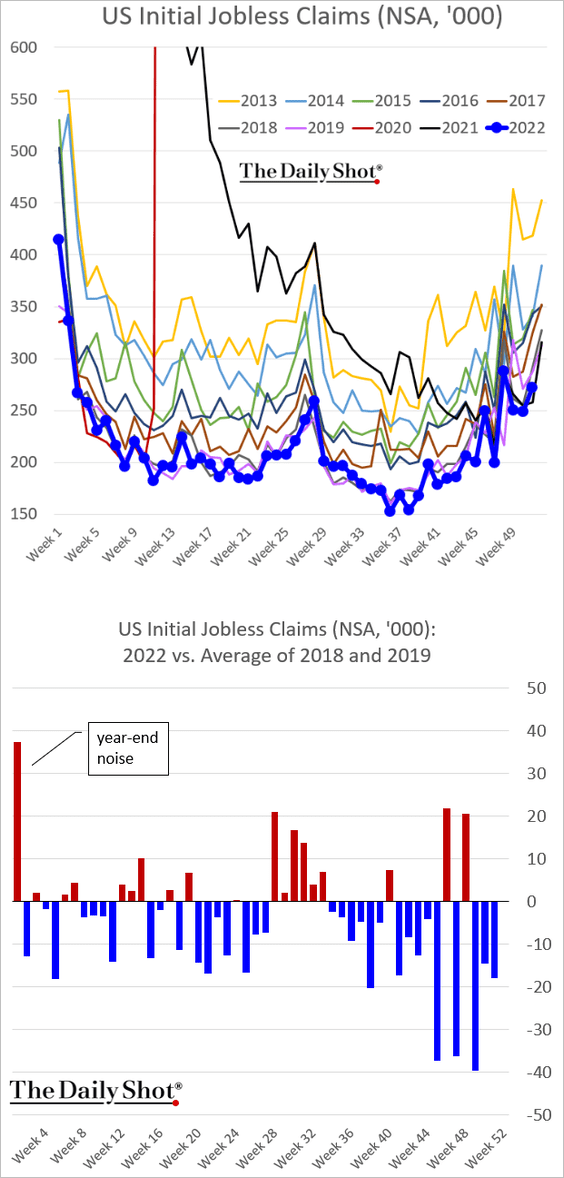
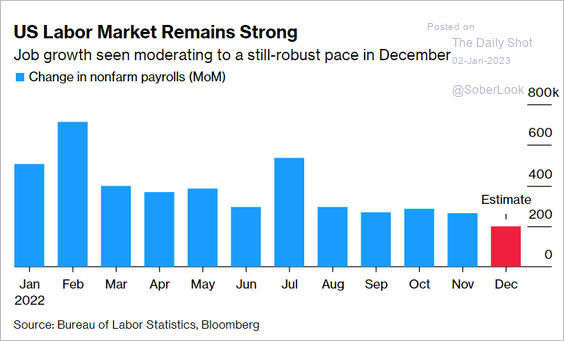
The labor market is still robust, with estimates showing some 200k new jobs created in December.
 Source: @readep, @CraigStirling, @business Read full article
——————–
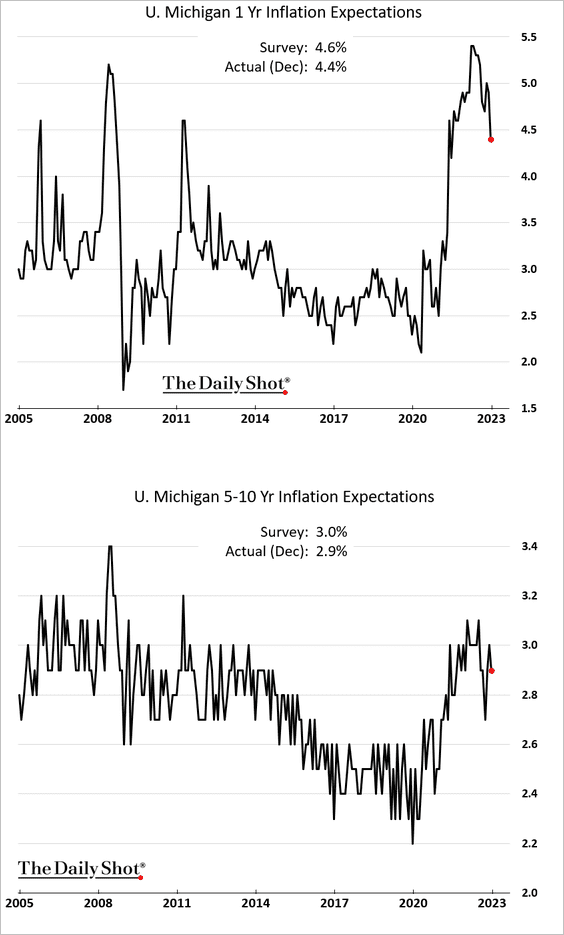
6. The updated December U. Michigan consumer sentiment report showed some improvement.
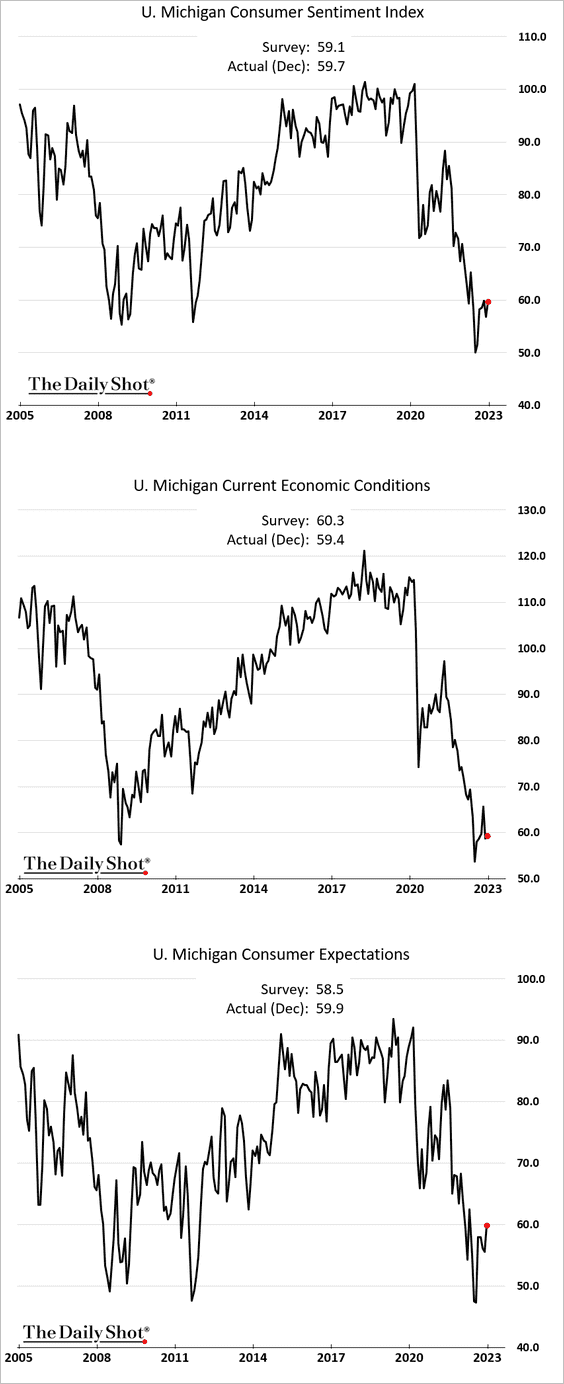
Inflation expectations eased.
• The Penta-CivicScience Economic Sentiment Index also continues to show improvement.
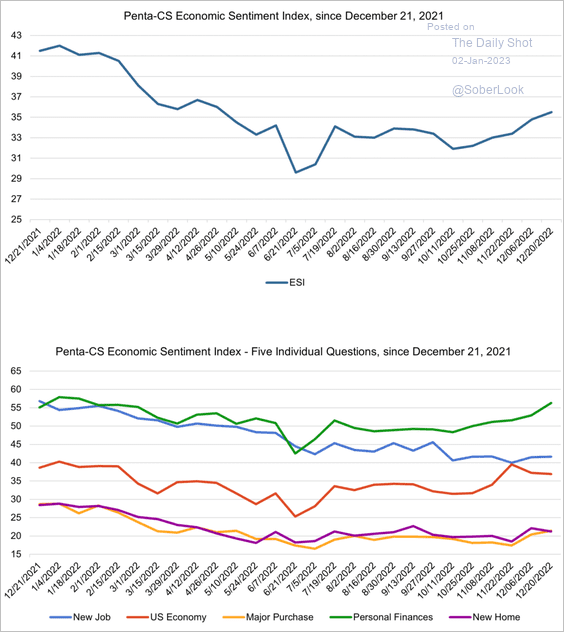 Source: @CivicScience
——————–
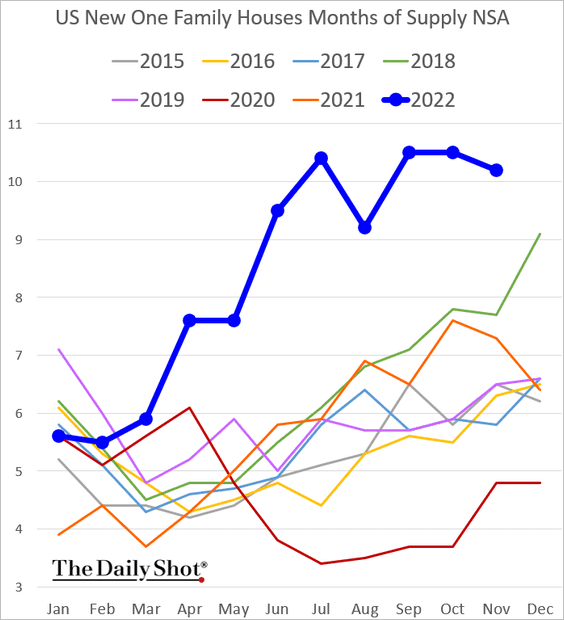
7. Next, we have some updates on the housing market.
• New home sales held up better than expected.
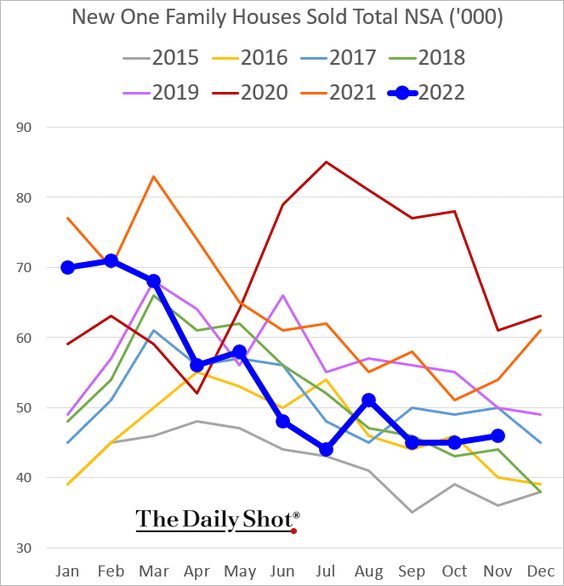
Inventories of new housing remain elevated.
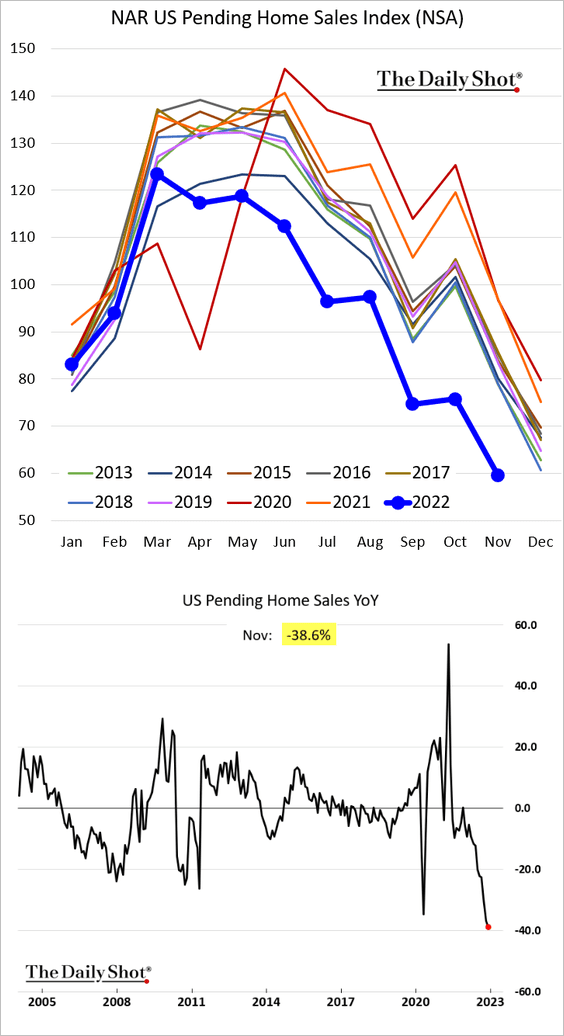
• Pending home sales were down almost 40% in November on a year-over-year basis.
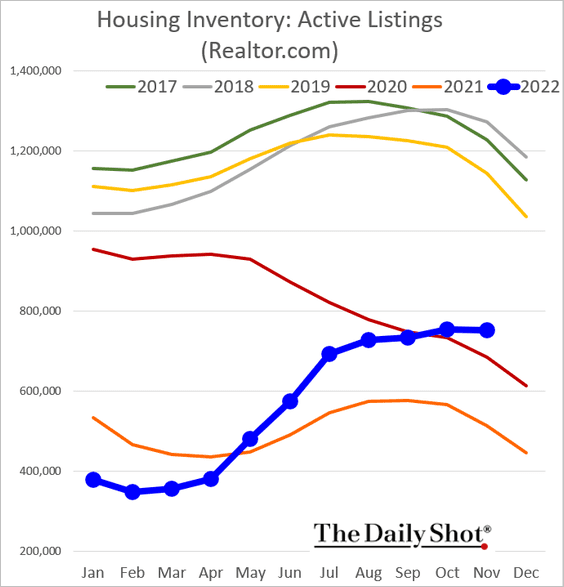
• Active listings have risen this year but remain well below 2019 levels.
This chart shows housing inventories by price tier.
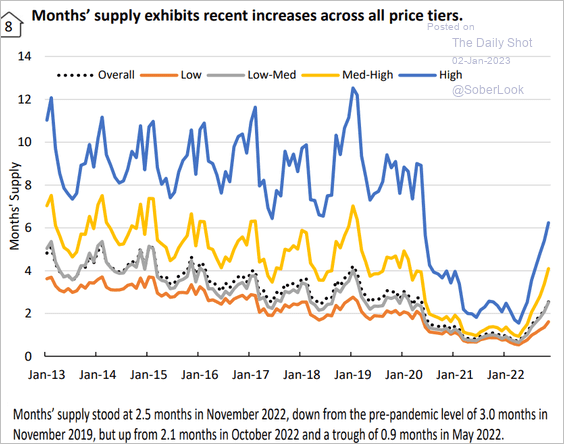 Source: AEI Housing Center
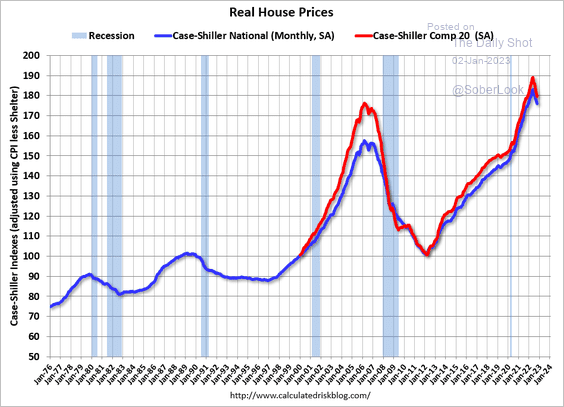
• Home prices declined less than expected in October, with sellers holding the line.
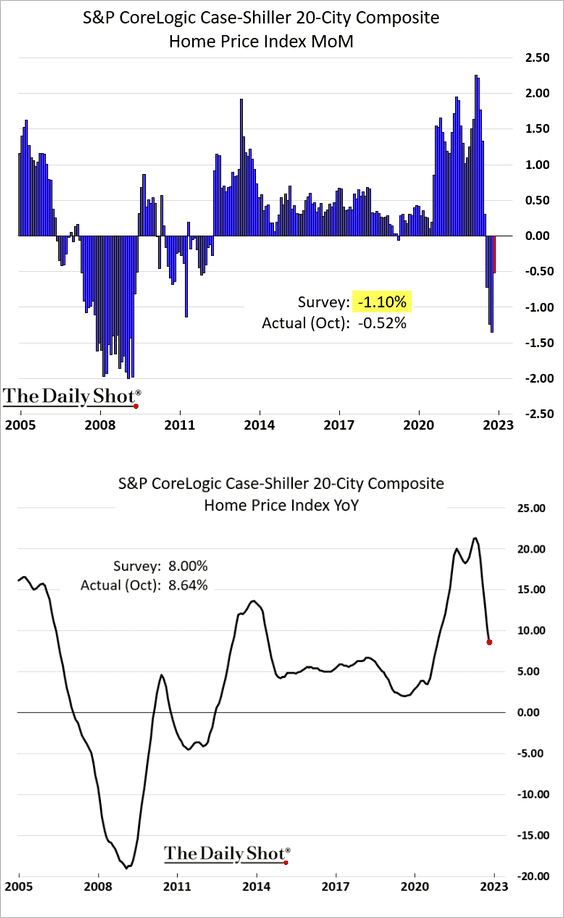
– This chart shows inflation-adjusted home prices.
 Source: Calculated Risk
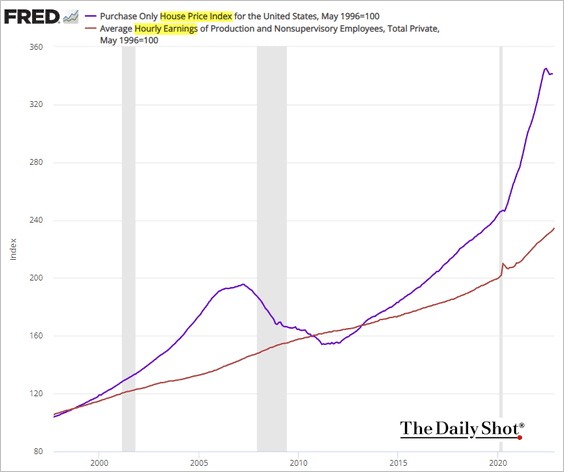
– The gap between wages and home prices remains wide.
Back to Index
Canada
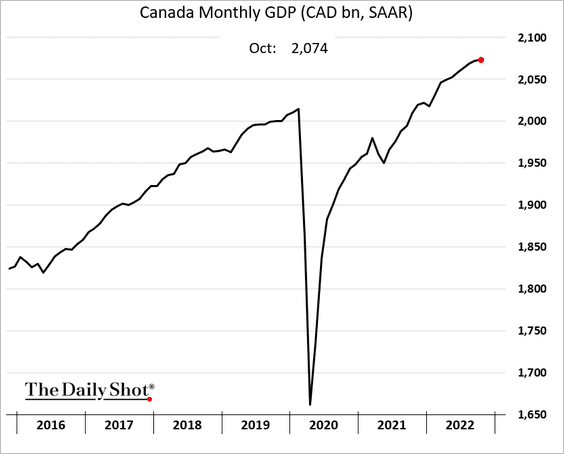
1. The economy continues to grow.
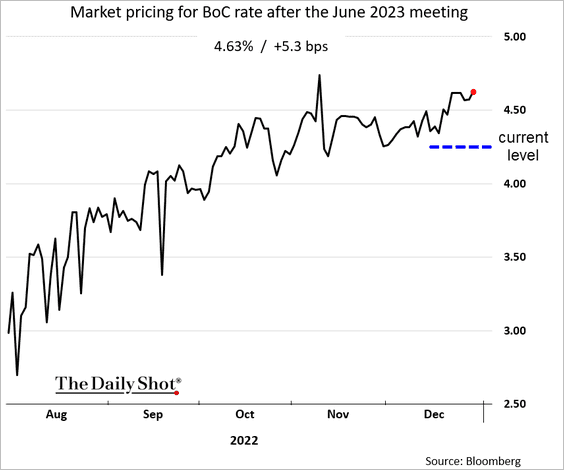
2. The market is pricing in about 38 bps of BoC rate hikes by June.
Back to Index
The Eurozone
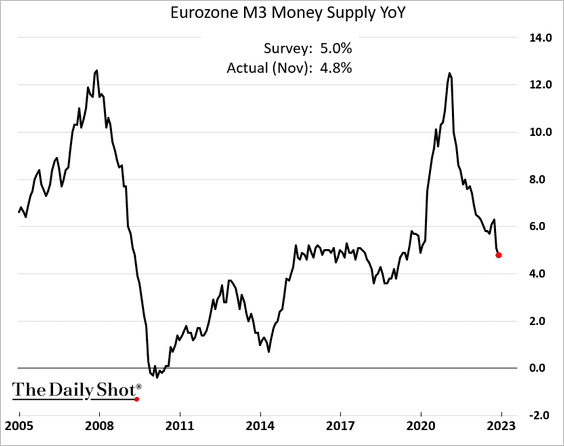
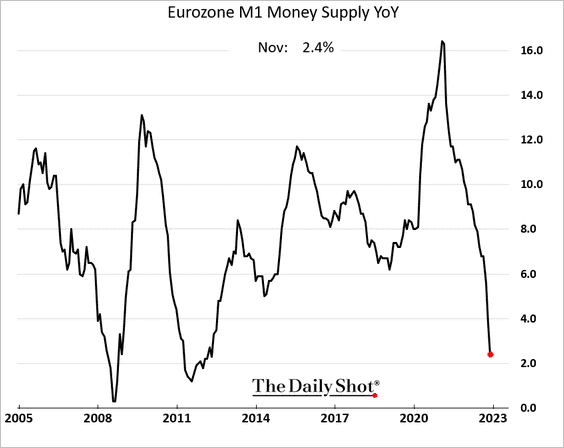
1. Growth in the money supply continues to slow.
• Broad:
• Narrow:
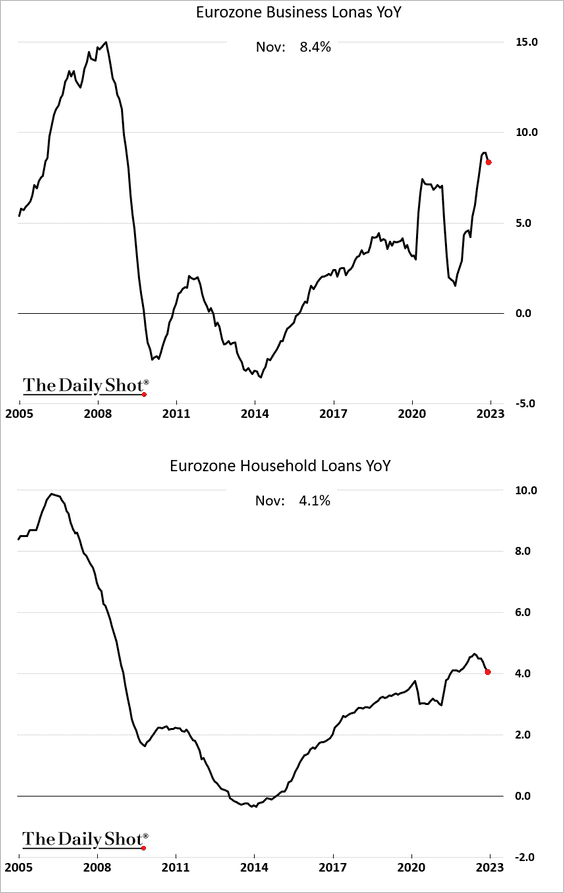
Loan growth is off the highs but still robust.
——————–
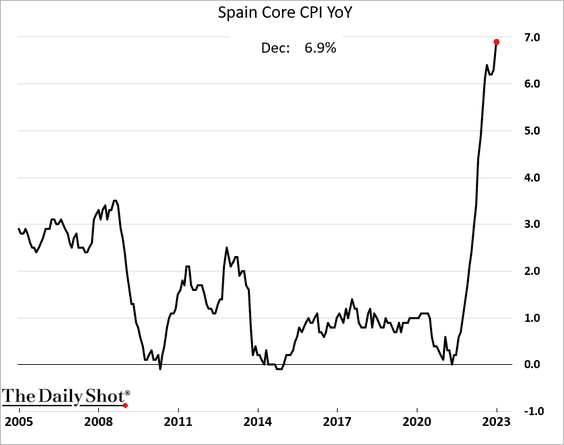
2. Spain’s CPI is moderating rapidly.
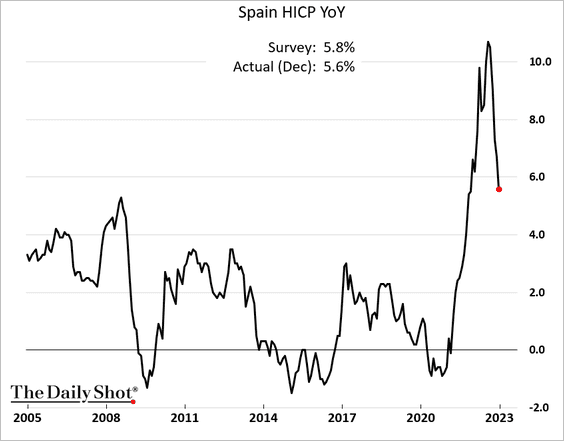
But the core (national) CPI is still climbing.
——————–
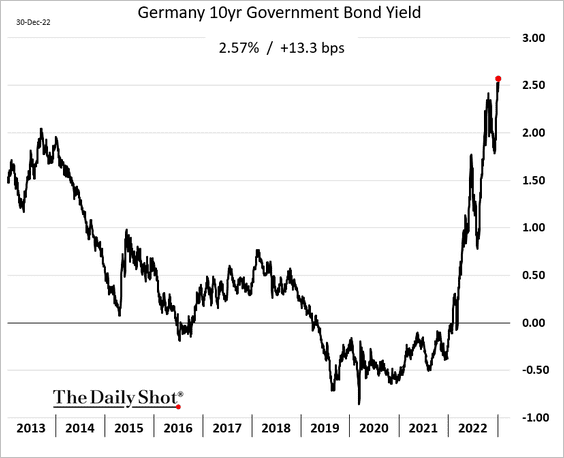
3. Bund yields continued to surge last week.
4. Italian yields have diverged from the euro.
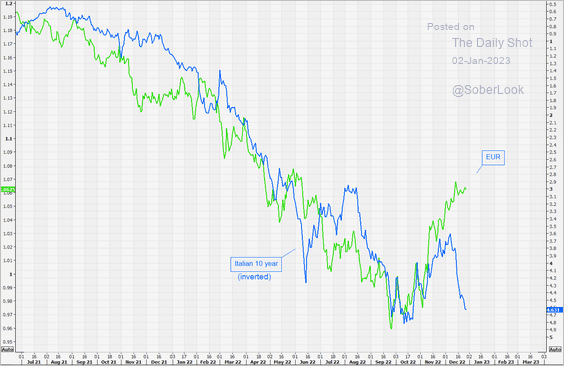 Source: @themarketear
Back to Index
Europe
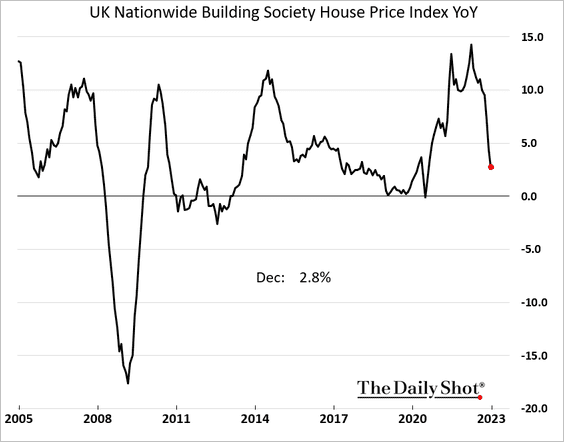
1. UK home price appreciation is tumbling.
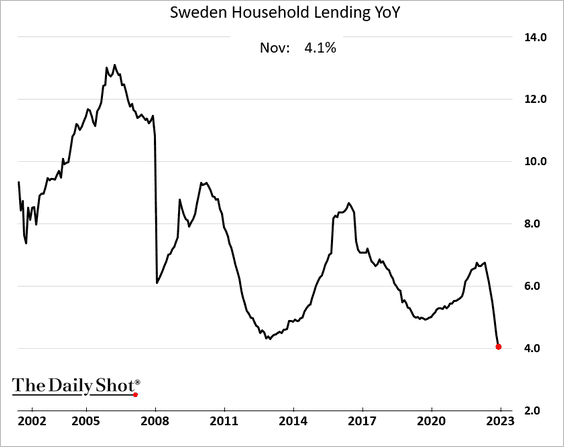
2. Sweden’s household credit growth has slowed sharply in recent months.
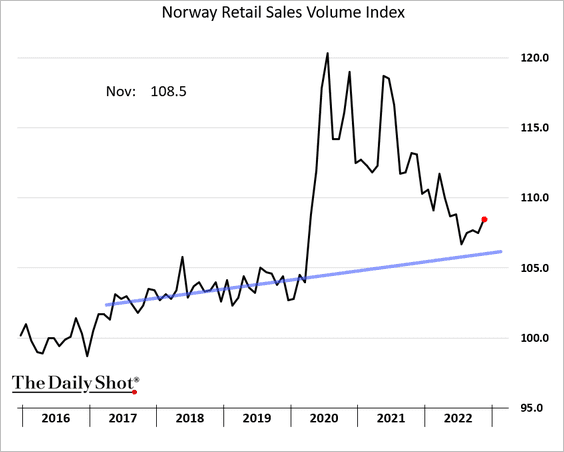
3. Norway’s retail sales remain robust.
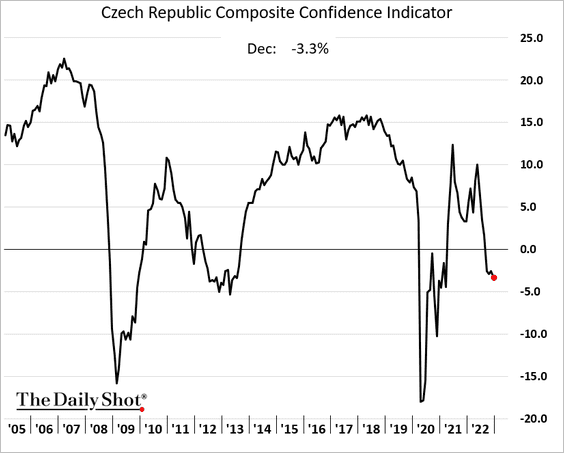
4. Here is the Czech Republic’s composite sentiment indicator.
Back to Index
Asia – Pacific
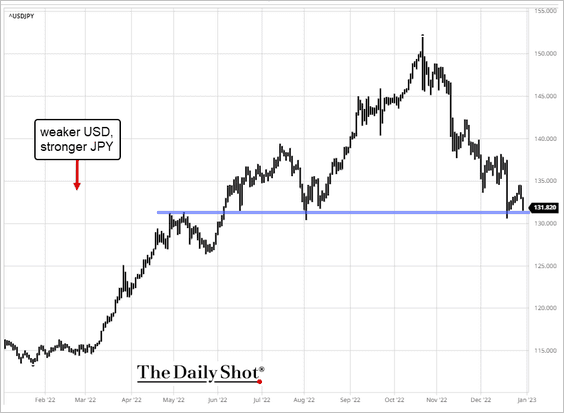
1. Let’s begin with Japan.
• Dollar-yen continues to test support.
• The BoJ accelerated JGB purchases even as it widened the 10-year trading band.
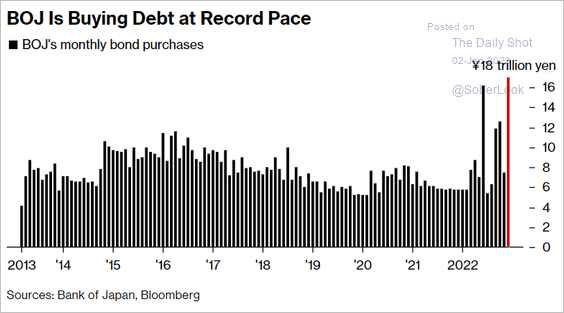 Source: @markets Read full article
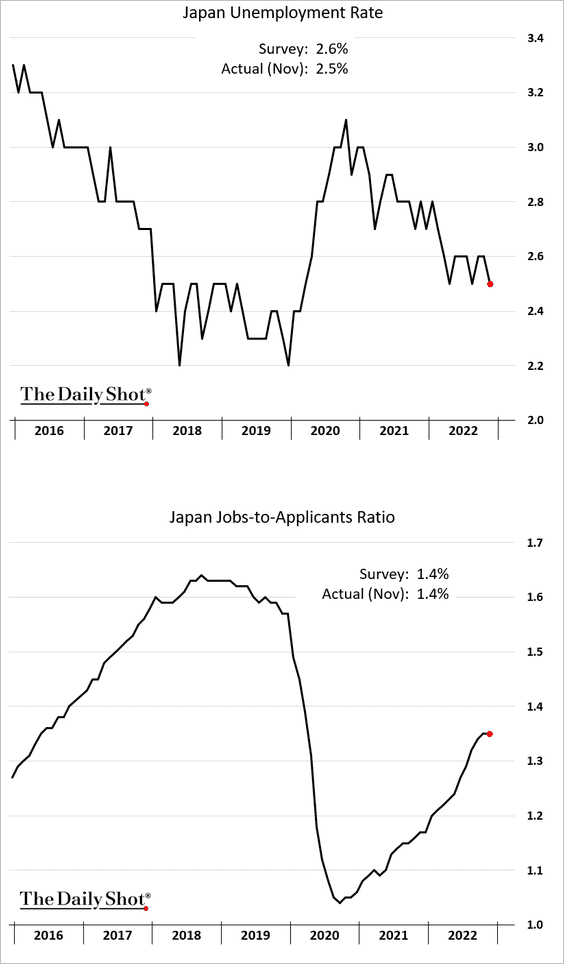
• Employment metrics have not returned to pre-COVID levels.
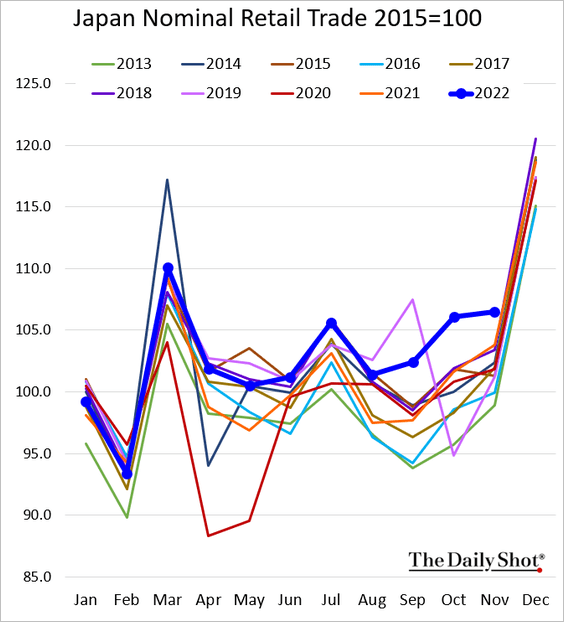
• Nominal retail sales remain well above last year’s levels.
——————–
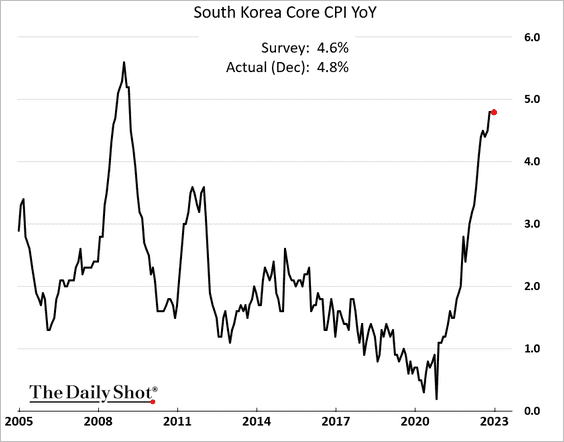
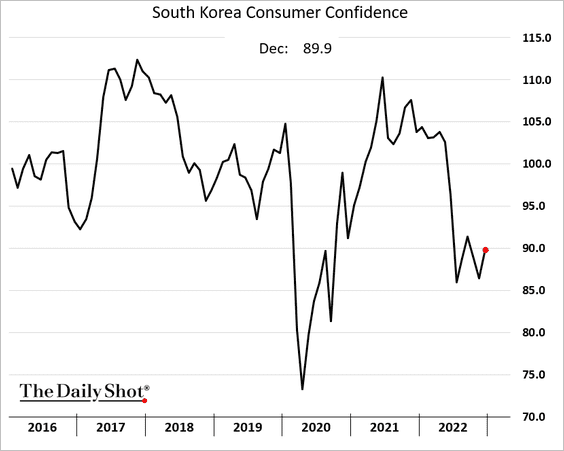
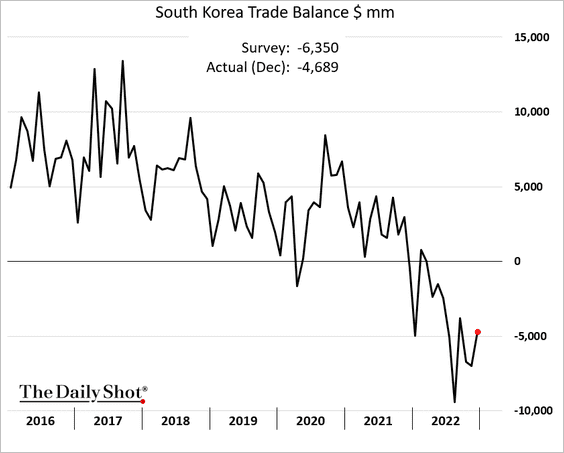
2. Next, we have some updates on South Korea.
• Manufacturing activity continues to contract.
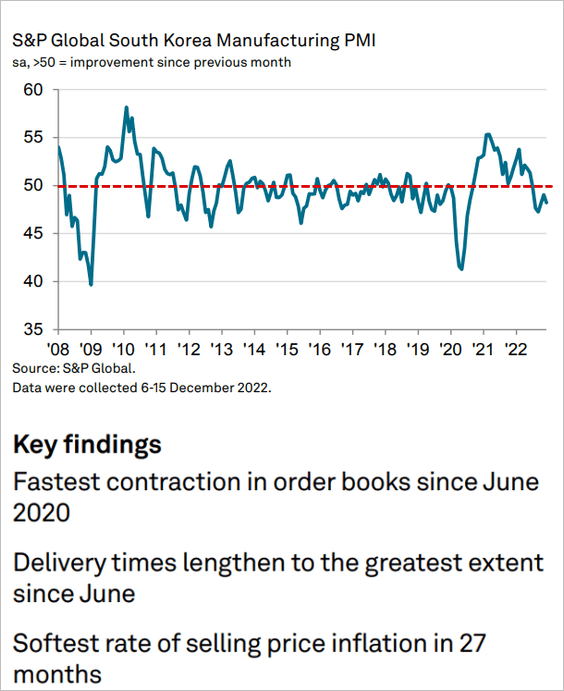 Source: S&P Global PMI
• The core CPI remains stubbornly high.
• Consumer confidence edged higher last month.
• The trade deficit narrowed.
Back to Index
China
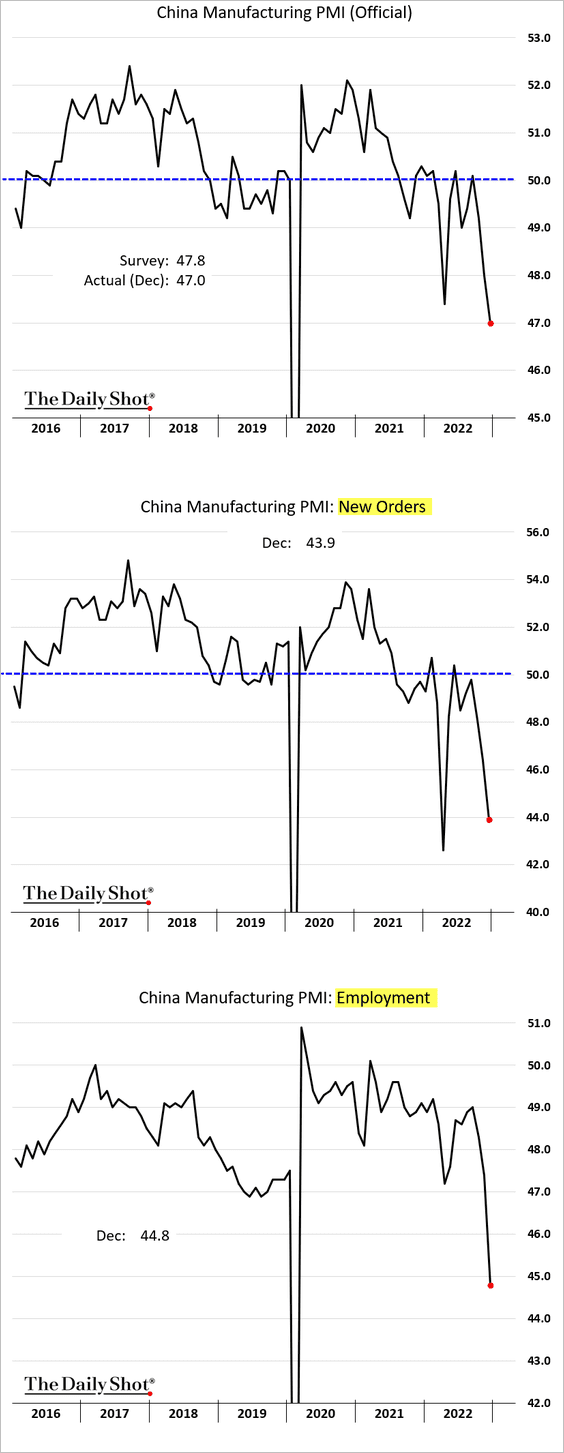
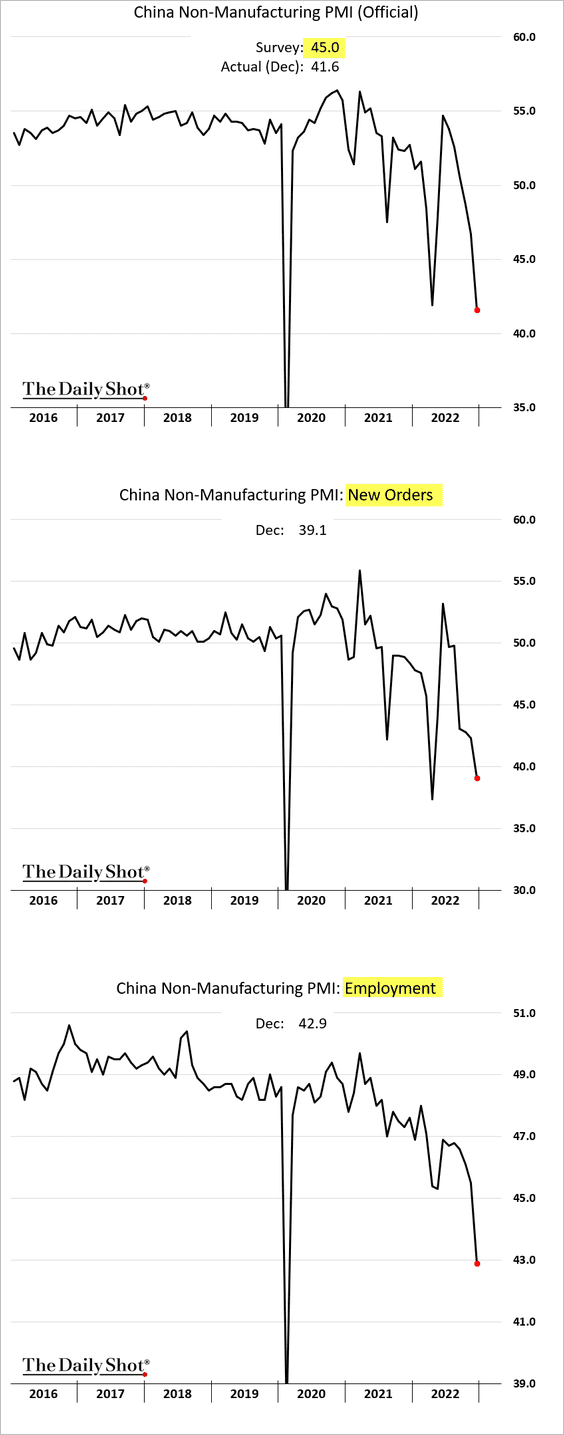
1. The official PMI report showed business activity contracting faster in December. Employment metrics are deteriorating rapidly.
• Manufacturing:
• Non-manufacturing:
——————–
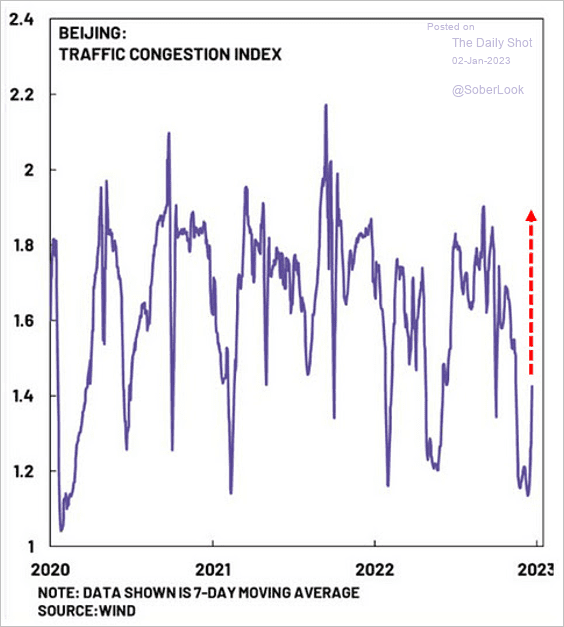
2. Mobility is improving as lockdowns end.
 Source: @MacroAlf
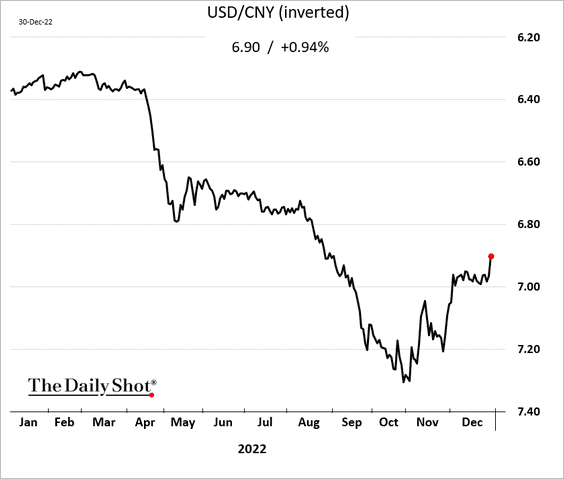
The renminbi is rebounding.
——————–
3. Infrastructure employment is expected to slow.
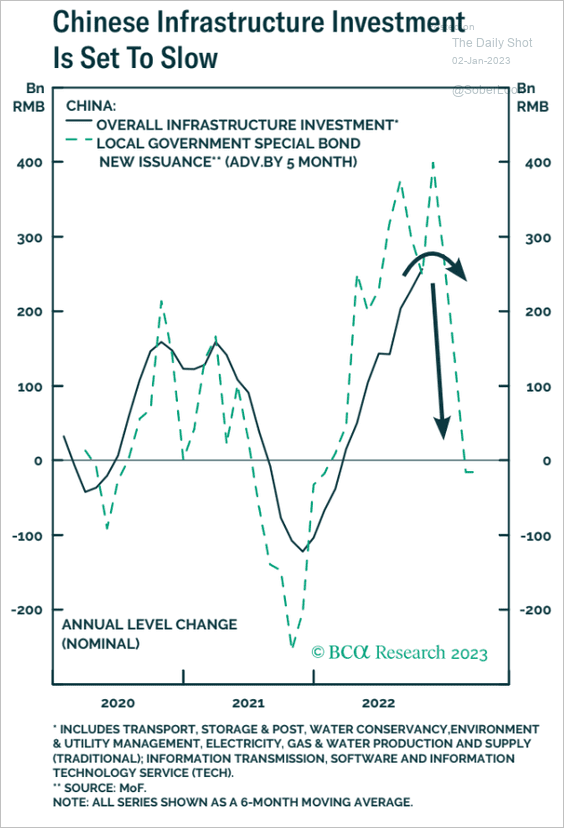 Source: BCA Research
Back to Index
Emerging Markets
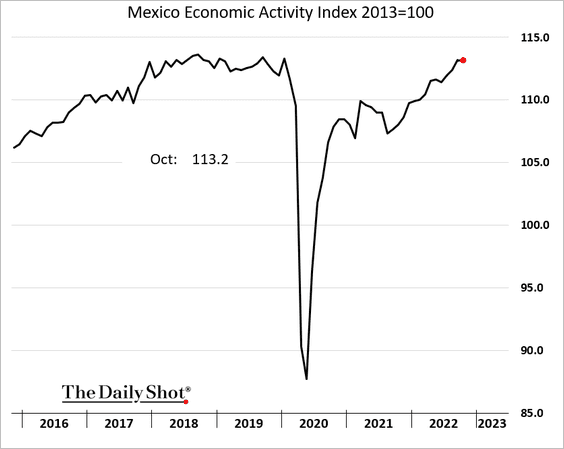
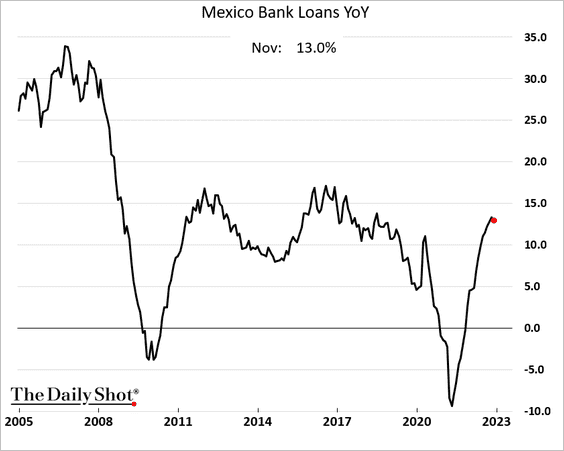
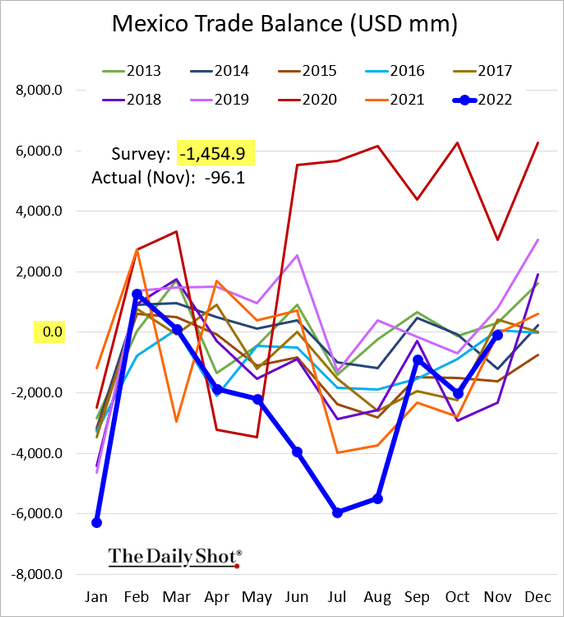
1. Let’s begin with Mexico.
• Economic activity:
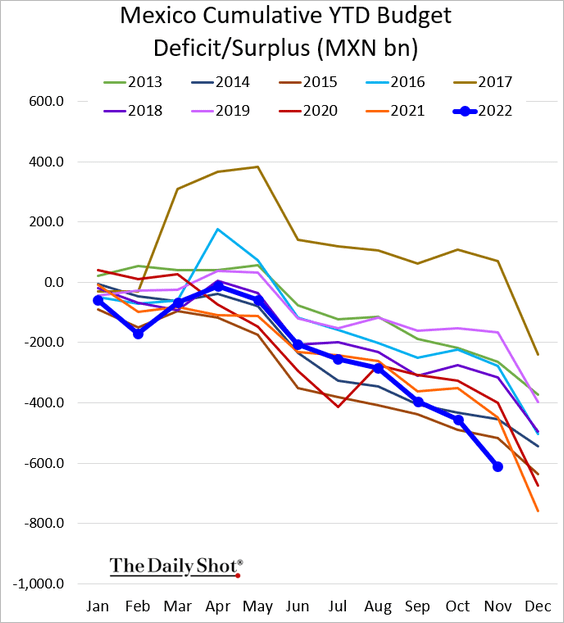
• Government budget:
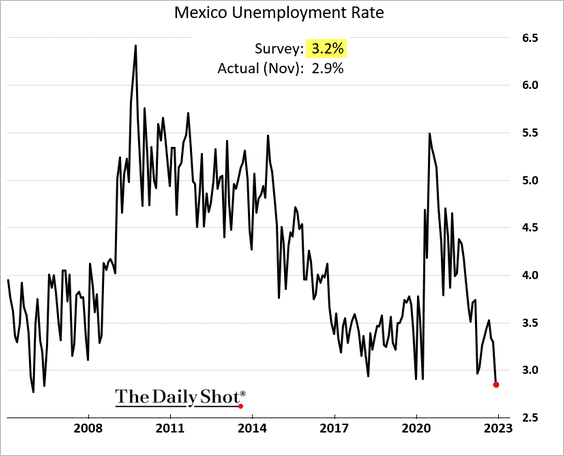
• The unemployment rate (lowest since 2006):
• Loan growth (peaking?):
• Trade balance:
——————–
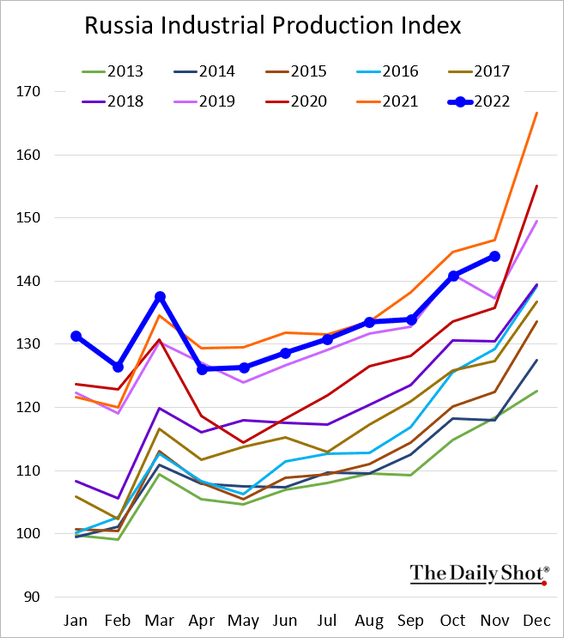
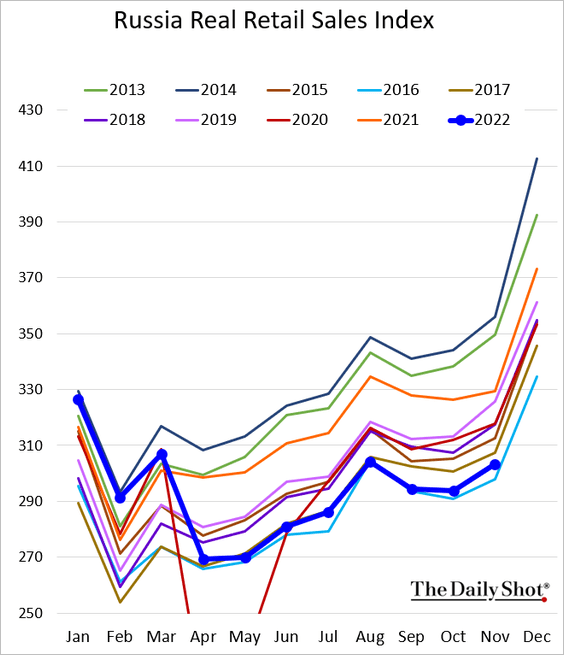
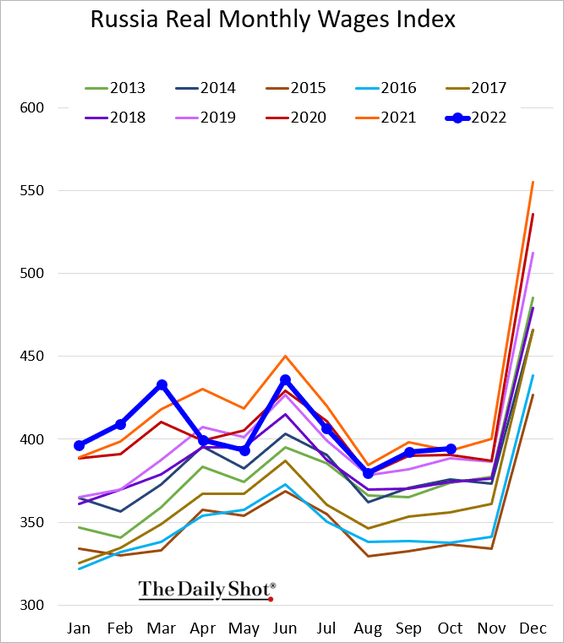
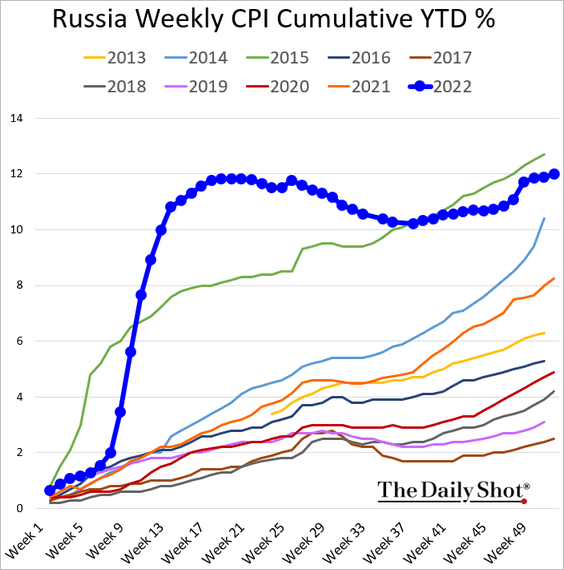
2. Next, we have some updates on Russia. Please note that the source here is the Russian government (data should be taken with a pinch of salt).
• Industrial production:
• Retail sales:
• Wages:
• Inflation:
Separately, here are the PMI trends.
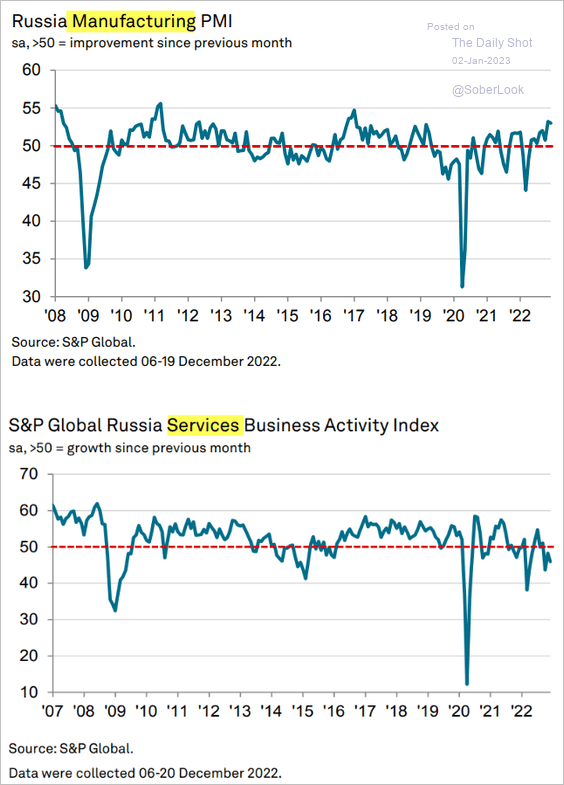 Source: S&P Global PMI
——————–
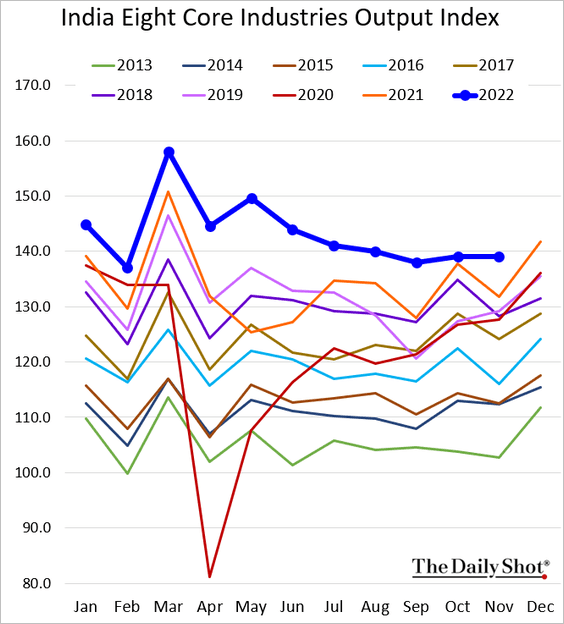
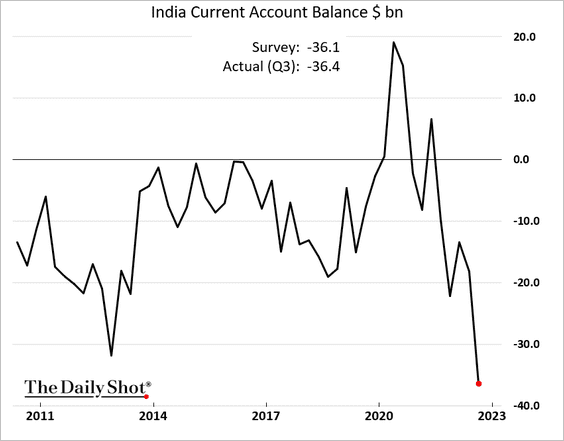
3. India’s industrial output remains robust.
• The current account deficit hit a record in Q3 as fuel costs surged.
• This chart compares India’s and China’s population projections.
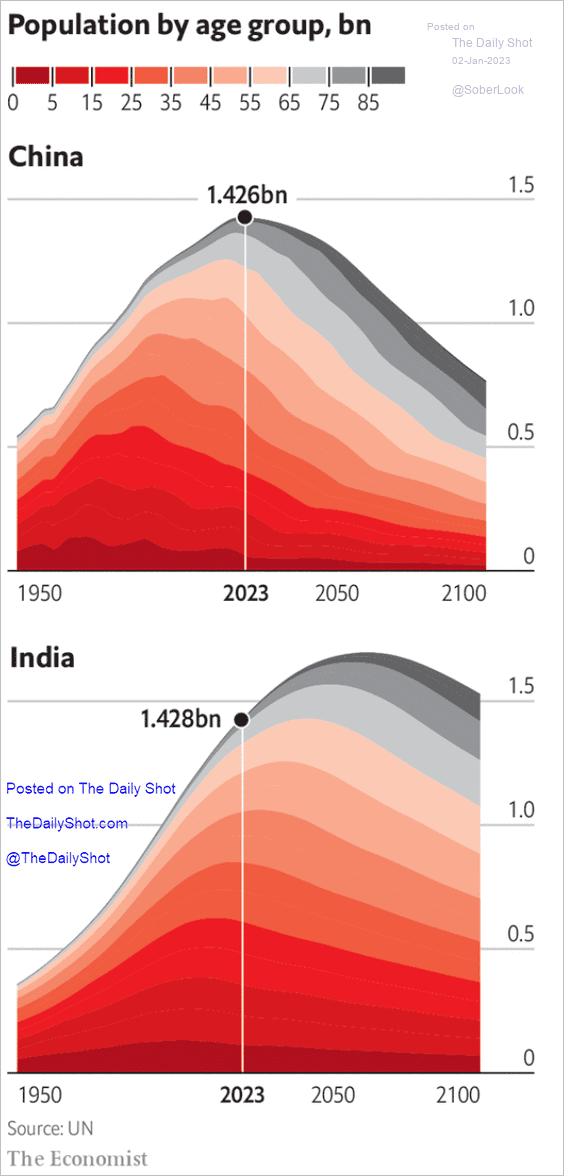 Source: The Economist Read full article
——————–
4. The Iranian rial hit a record low vs. USD last week.
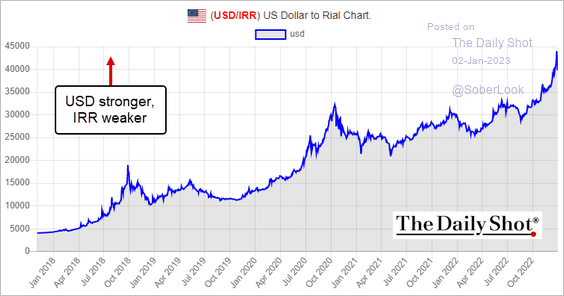 Source: bonbast.com
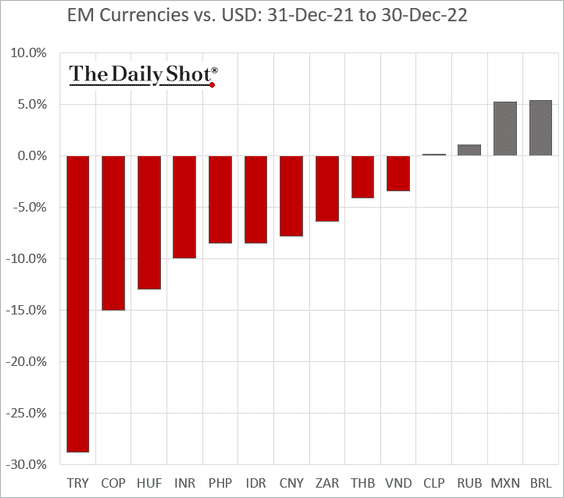
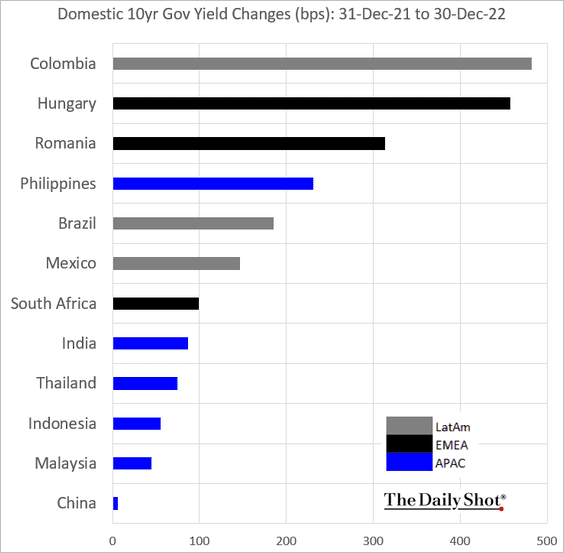
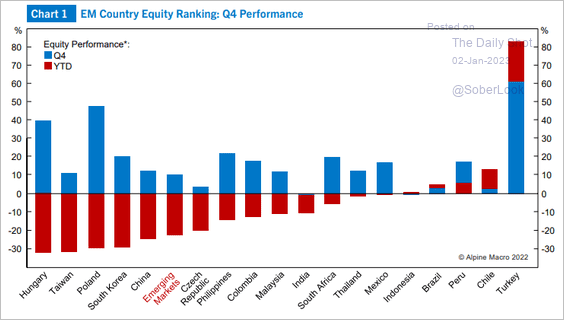
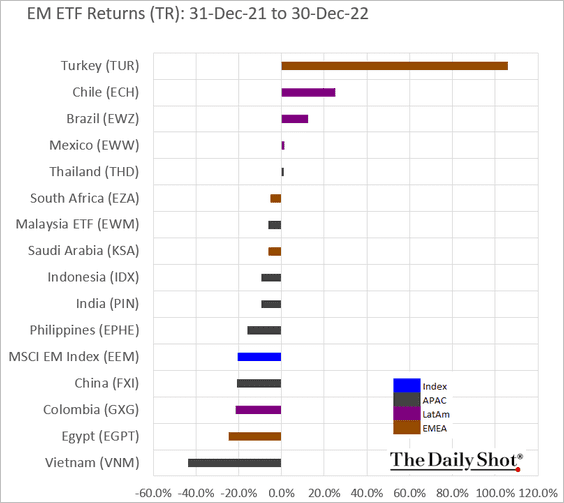
5. Next, we have some 2022 (full-year) performance data.
• Currencies:
• Bond yields:
• Equities and equity ETFs:
 Source: Alpine Macro
Back to Index
Cryptocurrencies
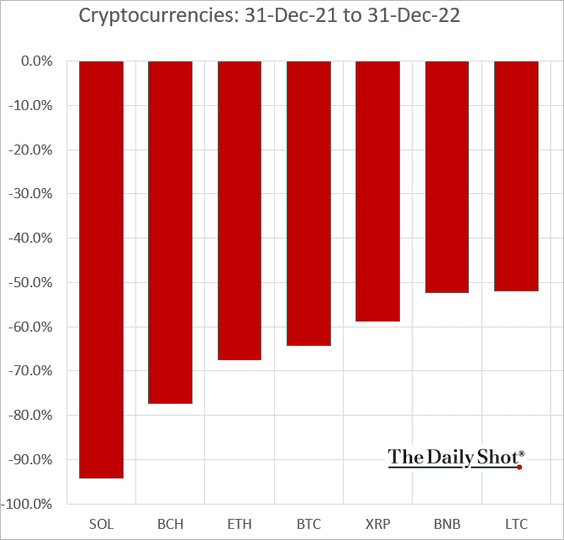
1. 2022 was a rough year for cryptos.
2. Where do institutional investors see digital asset prices over the next 12 months?
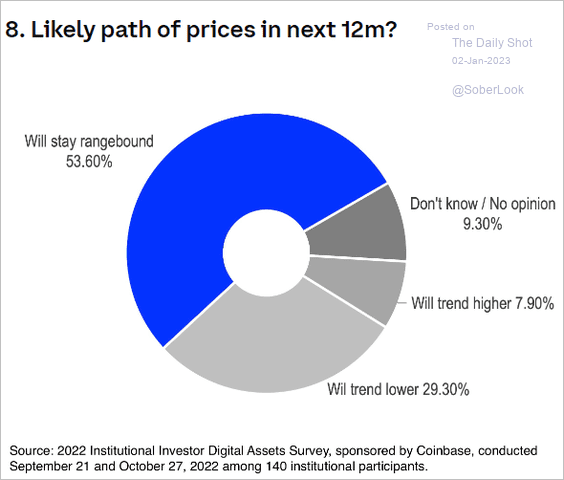 Source: Coinbase
3. How correlated are cryptos to other assets?
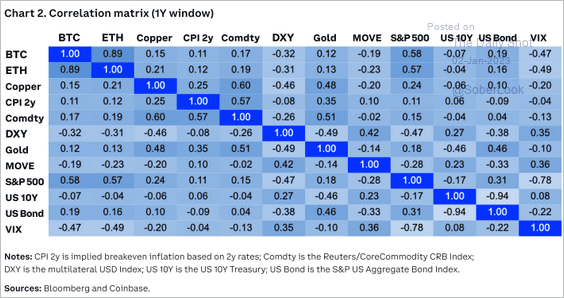 Source: Coinbase
4. Kazakhstan is using cheap domestic coal to mine bitcoin.
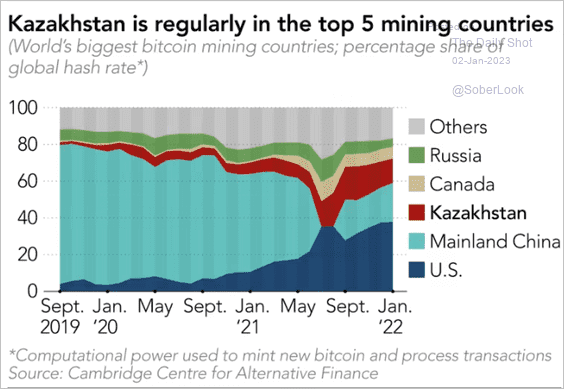 Source: @NikkeiAsia Read full article
Back to Index
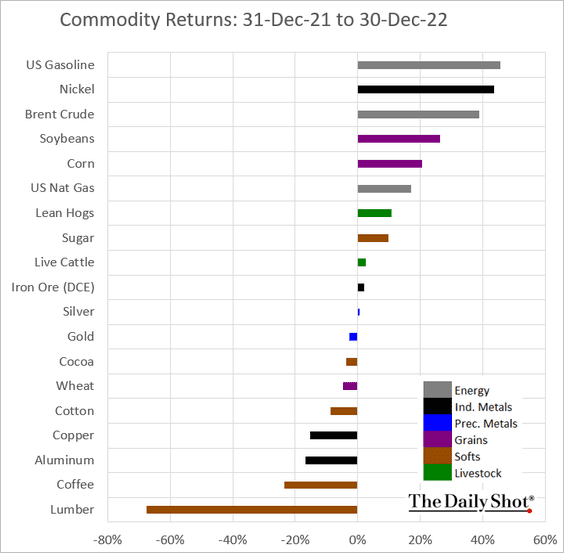
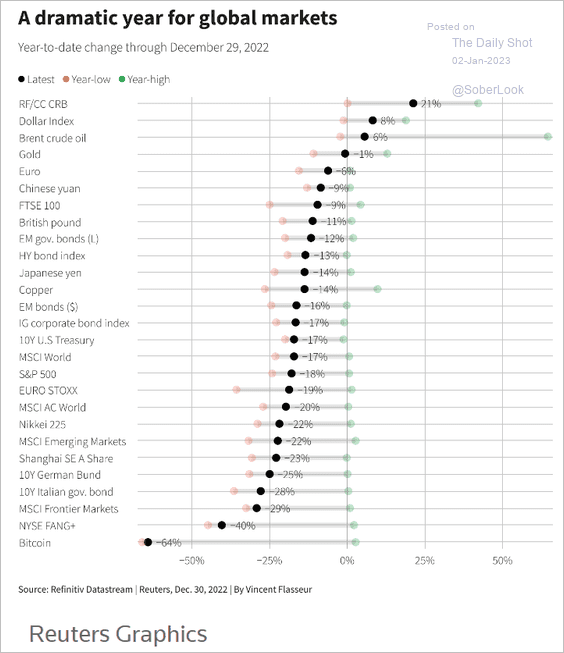
Commodities
How did key commodity markets perform in 2022?
Back to Index
Energy
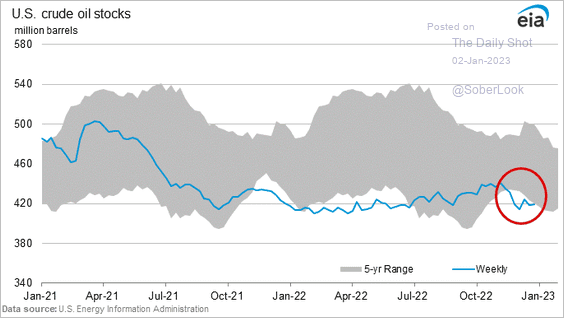
1. US oil inventories are nearing the 5-year range.
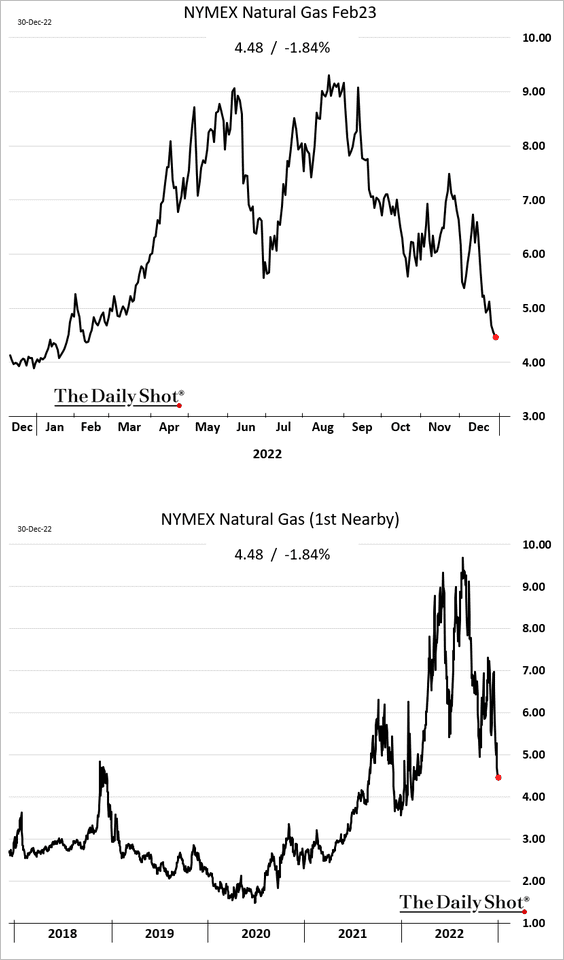
2. US natural gas prices have been tumbling.
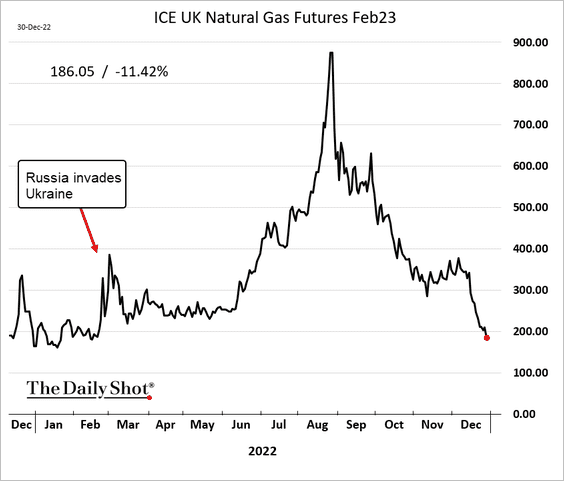
3. UK natural gas prices are at pre-war levels.
Back to Index
Equities
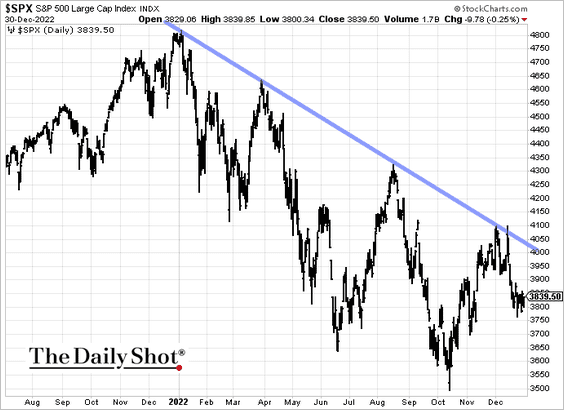
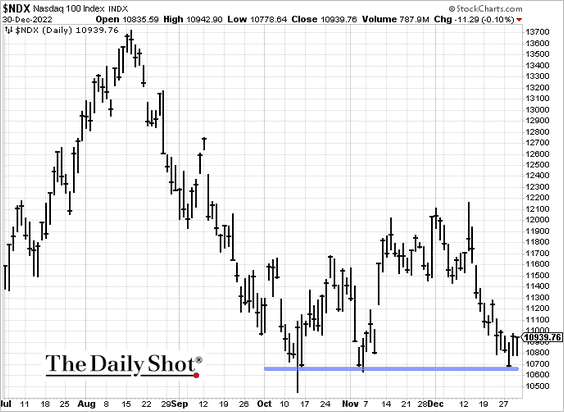
1. The S&P 500 downtrend resistance continues to hold.
The Nasdaq 100 again tested support near 10700.
——————–
2. Leading indicators continue to signal further deterioration in corporate earnings.
• Liquidity:
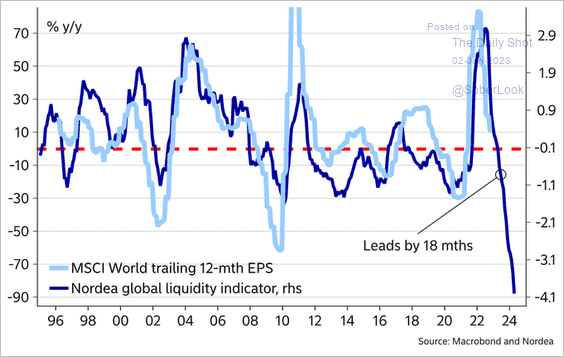 Source: @MikaelSarwe
• Credit impulse:
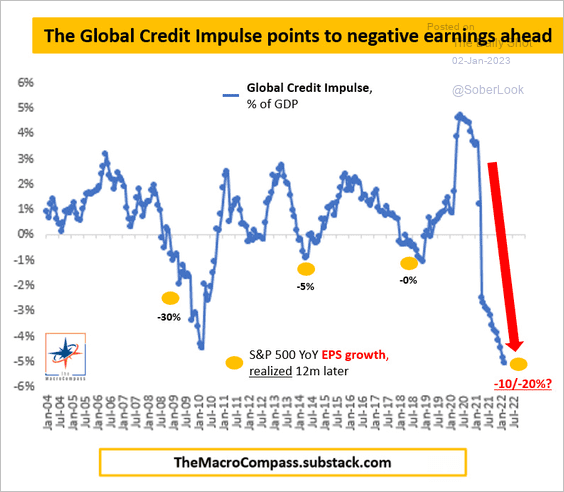 Source: @MacroAlf
• An aggregate leading index from Alpine Macro:
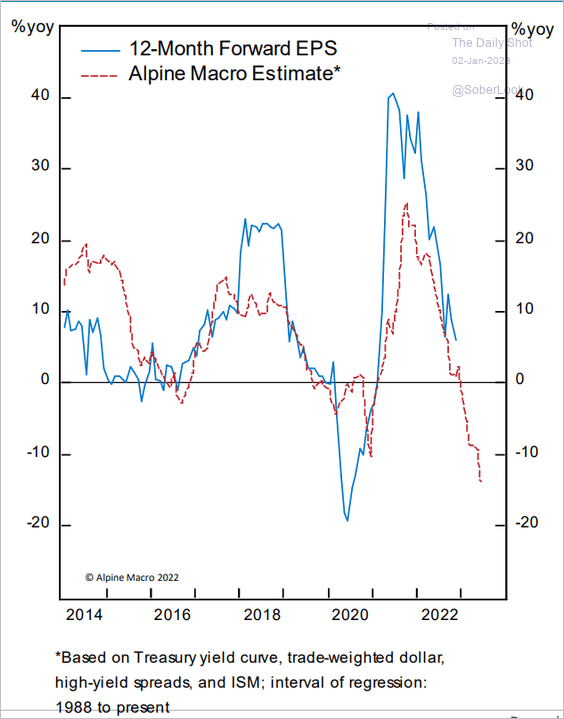 Source: Alpine Macro
——————–
3. Elevated real yields keep pressuring valuations.
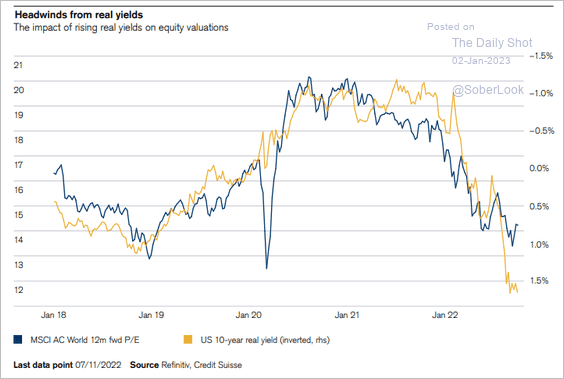 Source: Credit Suisse
4. Where do analysts see the S&P 500 at the end of 2023?
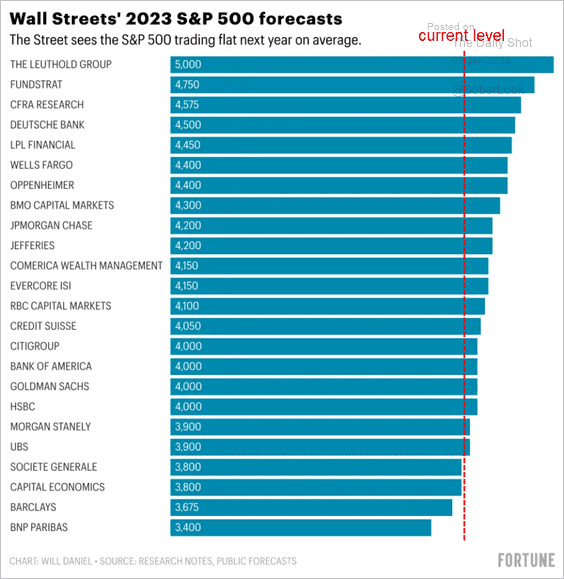 Source: Fortune Read full article
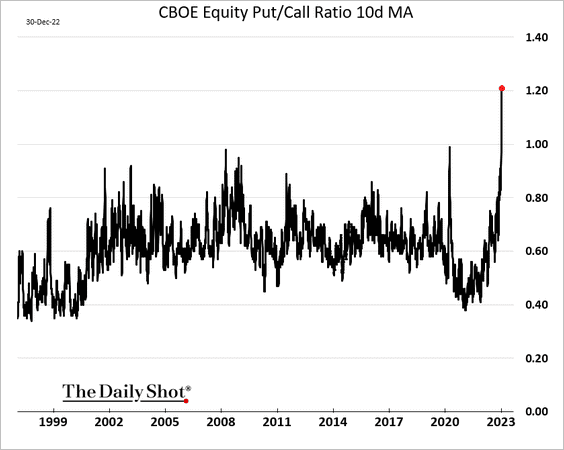
5. The put/call ratio’s 10-day moving average hit a record high last week amid increased risk aversion.
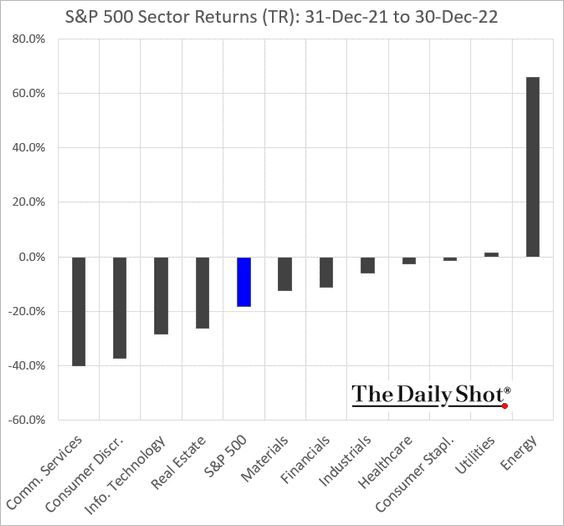
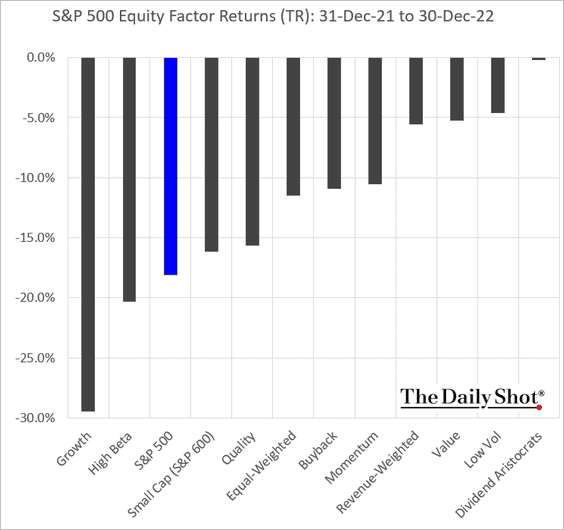
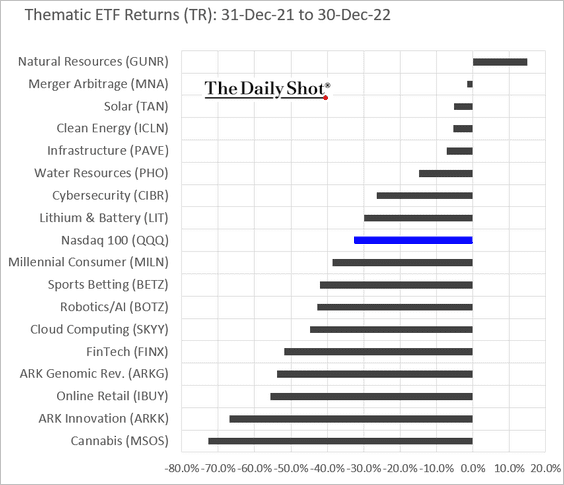
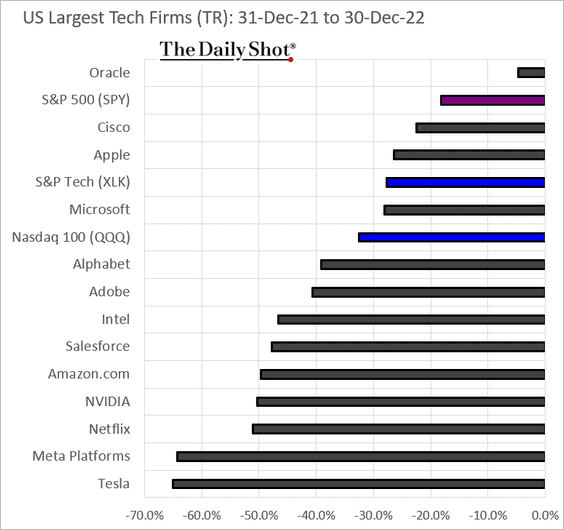
6. Next, we have some 2022 performance data.
• Sectors:
• Equity factors:
• Thematic ETFs:
• Largest US tech companies:
——————–
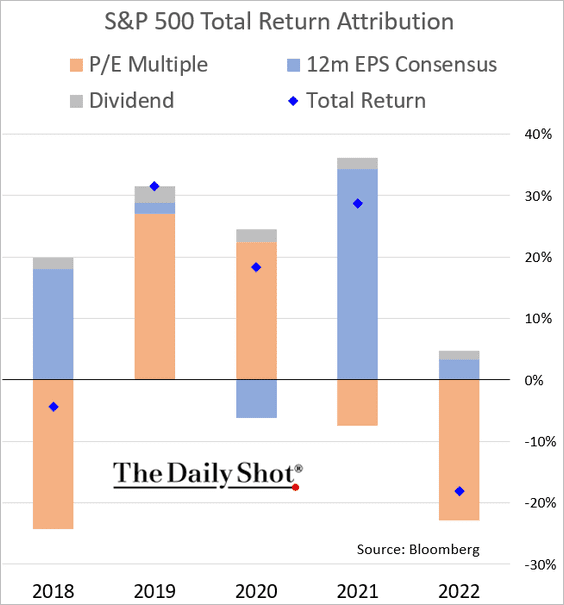
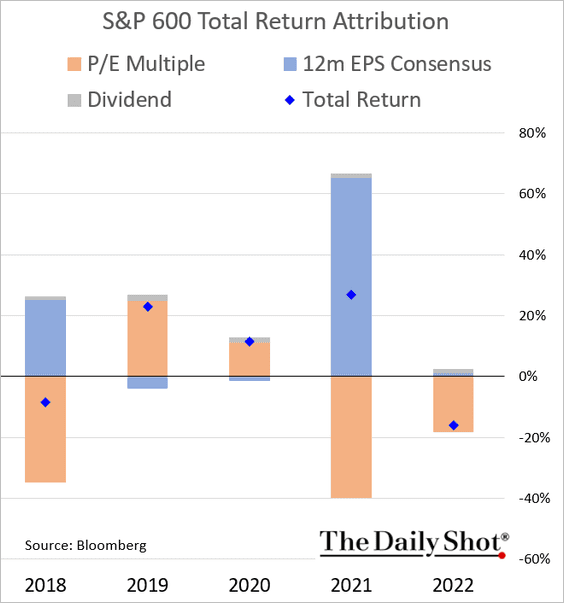
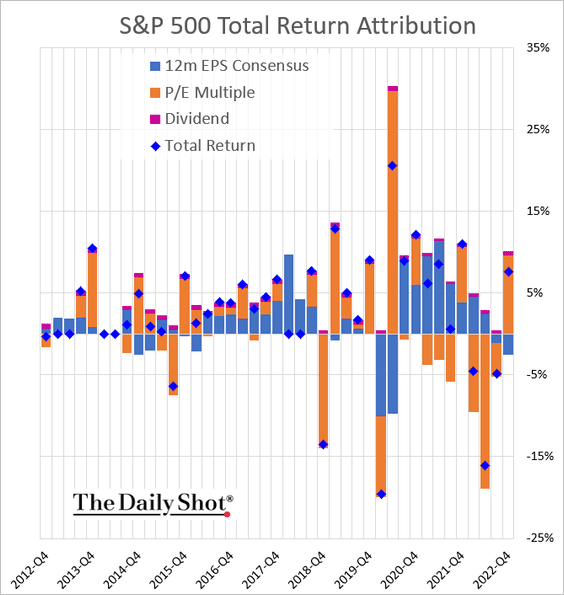
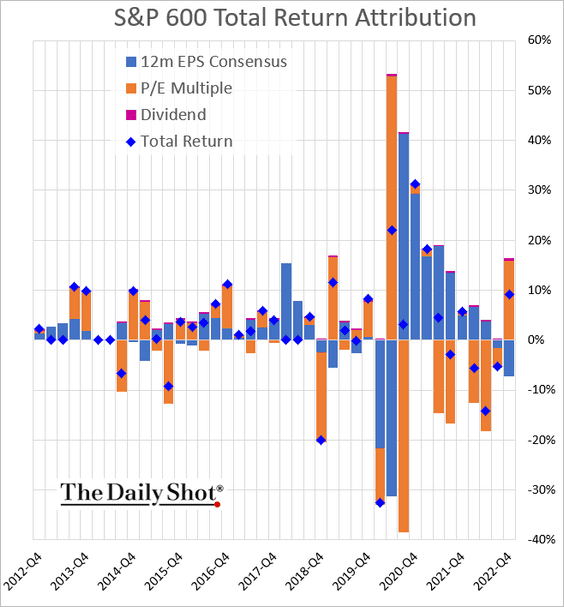
7. Finally, let’s take a look at some performance attribution data.
• Yearly:
– S&P 500:
– S&P 600 (small caps):
• Quarterly:
– S&P 500:
– S&P 600:
Back to Index
Credit
1. The corporate debt maturity wall looks manageable.
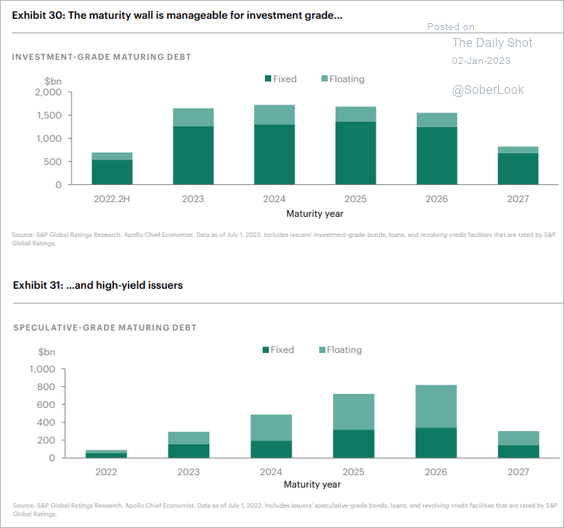 Source: Torsten Sløk, Apollo
2. Leveraged loan market quality has been deteriorating since the financial crisis (chart shows leverage distribution over time).
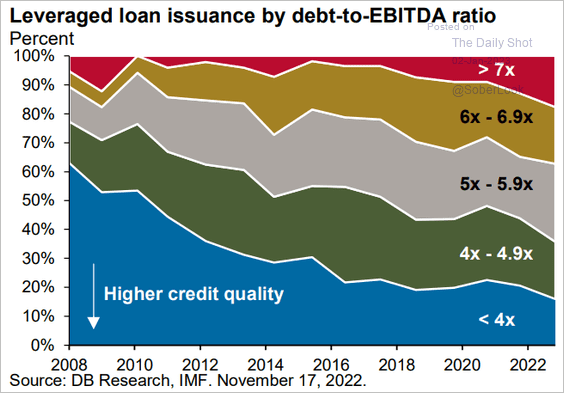 Source: J.P. Morgan Asset Management
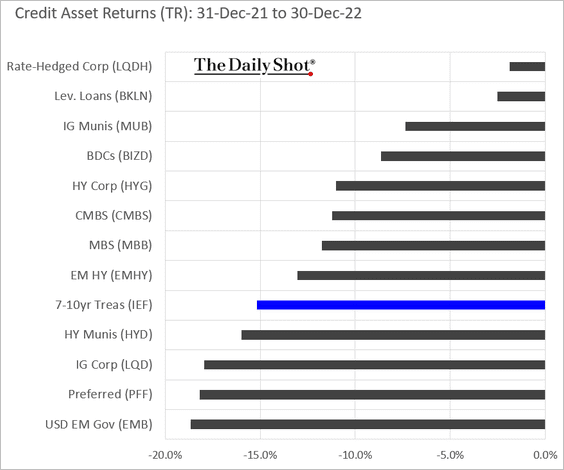
3. Here is the 2022 performance by asset class.
Back to Index
Rates
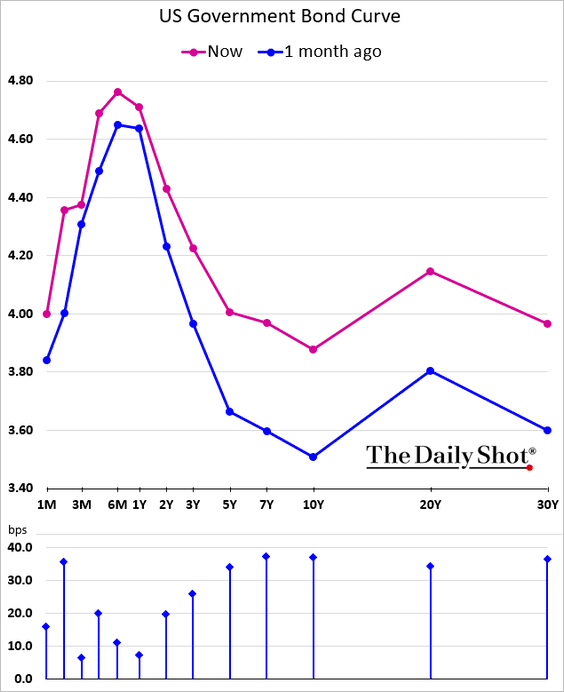
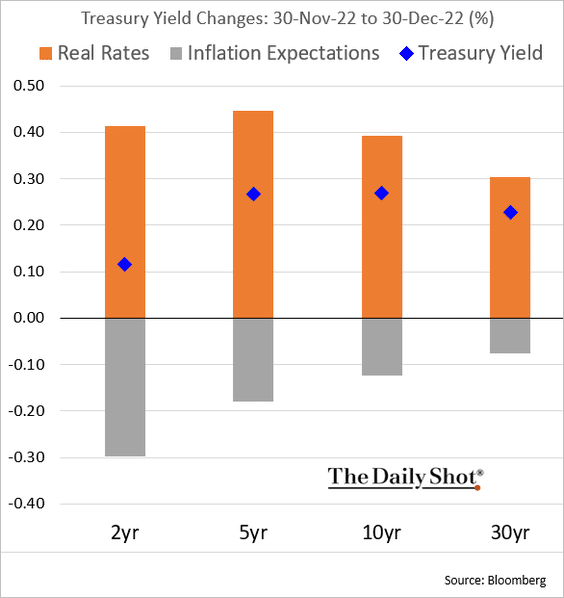
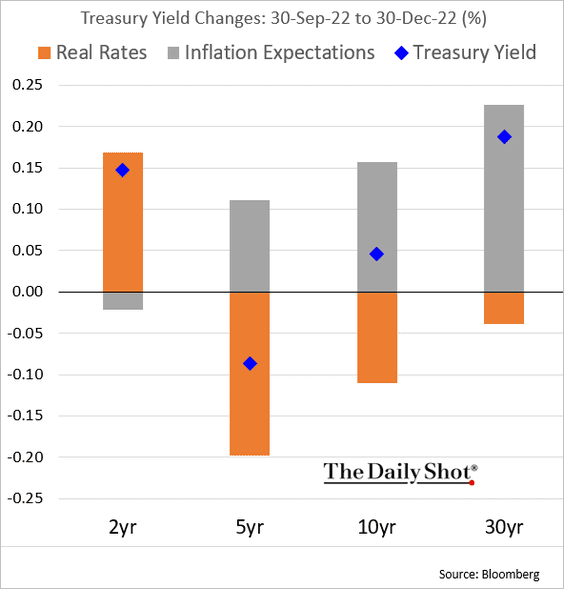
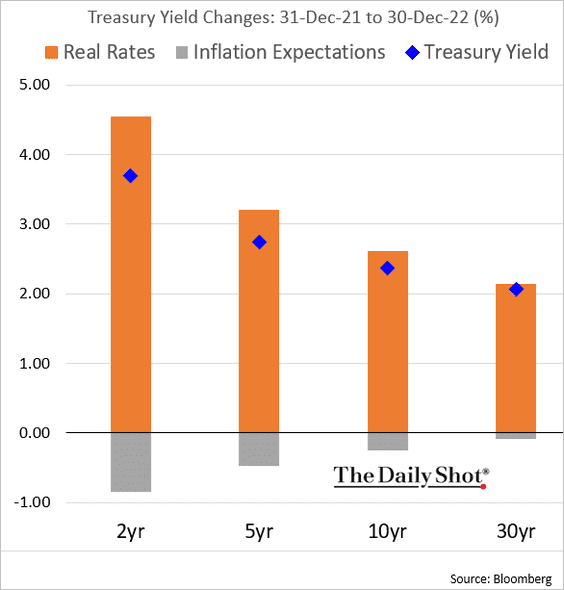
1. Treasury yields rose sharply in December.
Here is the attribution.
• December:
• Q4:
• 2022:
——————–
2. The Fed’s RRP (reverse repo) facility balance hit a record high at the end of the year, …
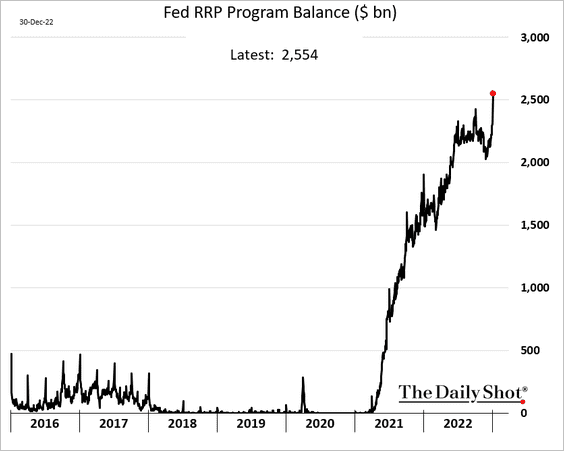
… as money market funds increasingly prefer RRP to T-Bills.
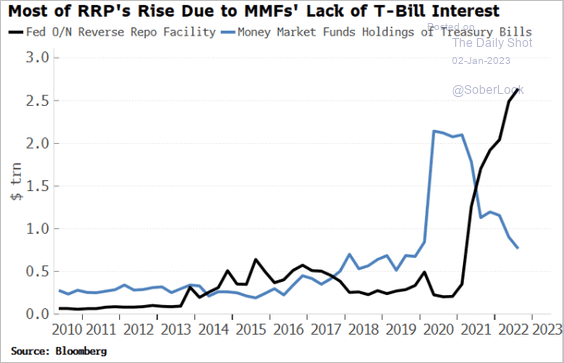 Source: Simon White, Bloomberg Markets Live Blog
 Source: Reuters Read full article
——————–
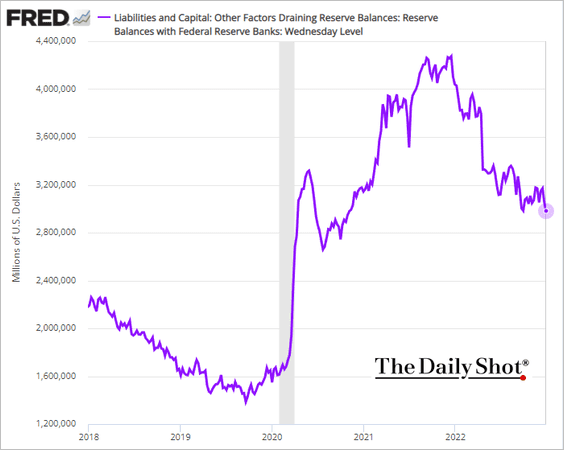
3. US reserves (bank liquidity held at the Fed) hit the lowest level since 2020 (due to QT).
4. Was 2022 a turning point for rates?
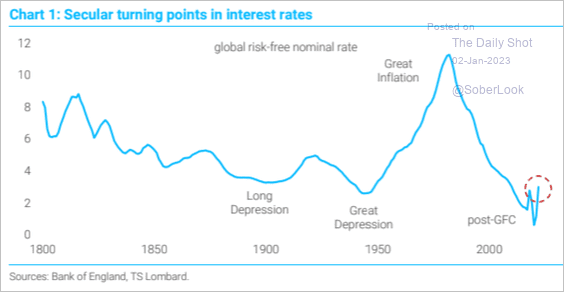 Source: TS Lombard
Back to Index
Global Developments
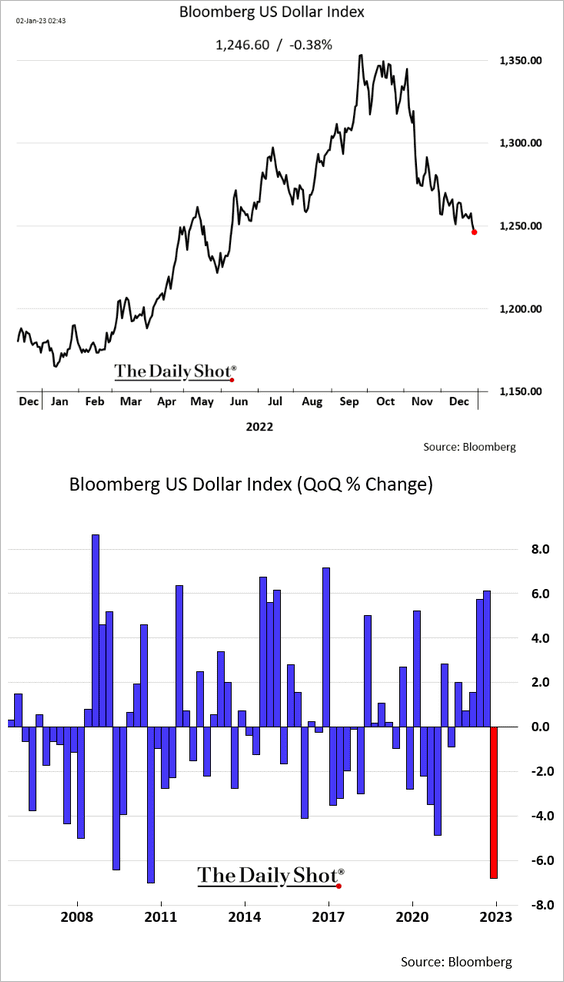
1. It’s been a rough couple of months for the US dollar.
2. Next, we have some 2022 performance data.
• An ugly year for global bonds (government and corporate debt):
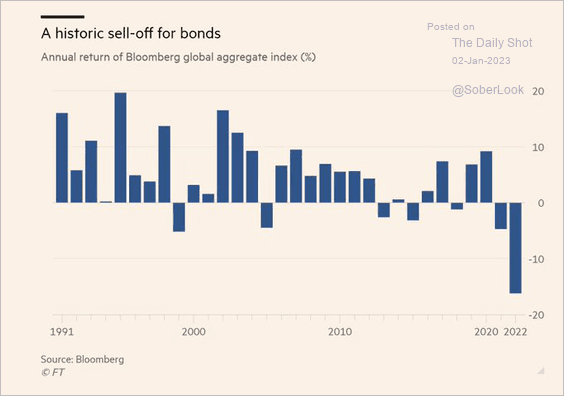 Source: @acemaxx, @FT Read full article
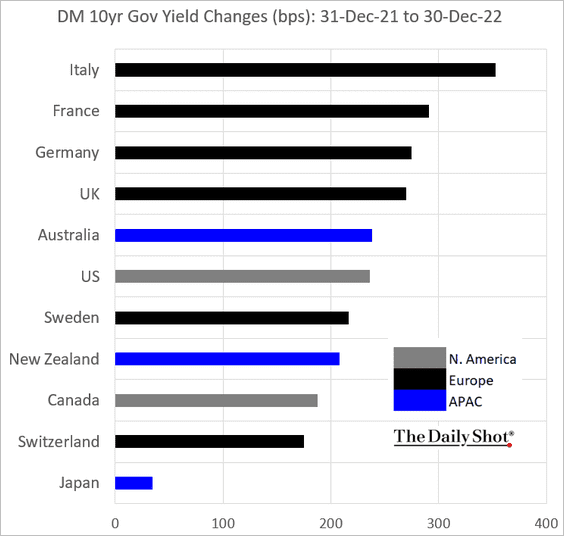
• DM yields:
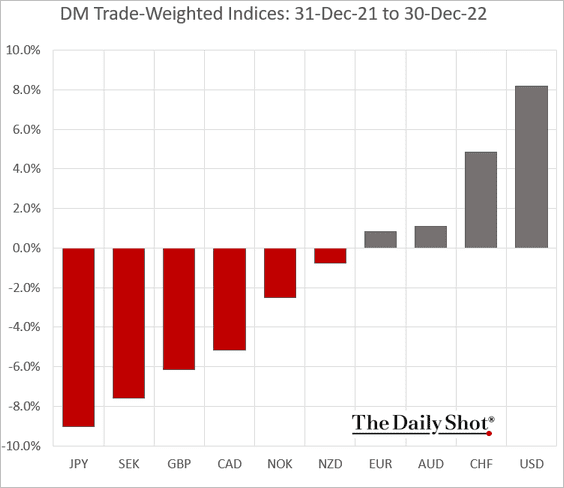
• Currencies:
– DM trade-weighted indices:
– Global currencies vs. USD:
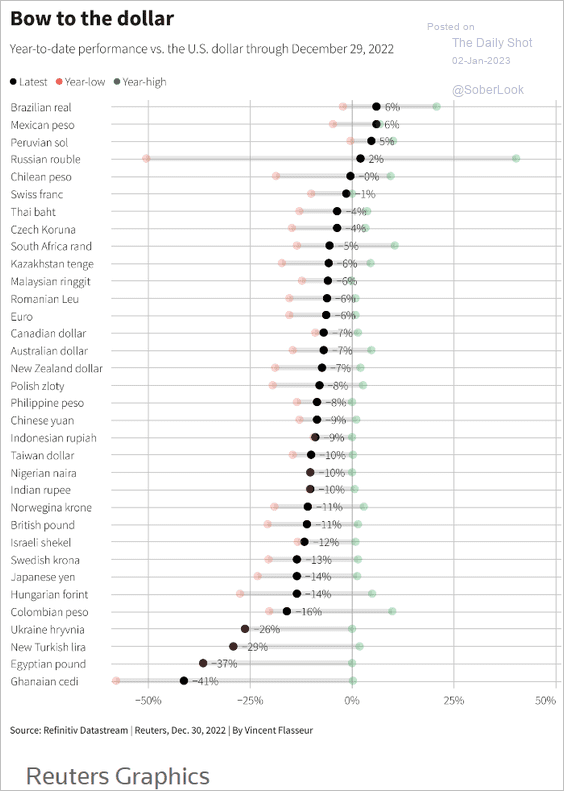 Source: Reuters Read full article
– Performance by asset class (2 charts):
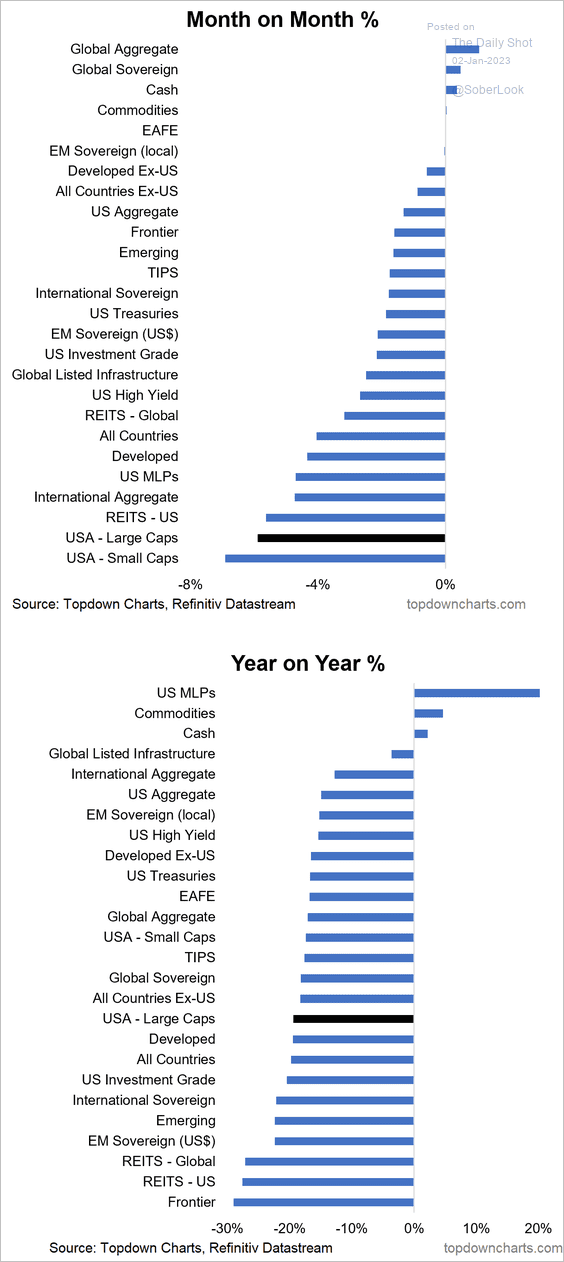 Source: @Callum_Thomas Read full article
 Source: Reuters Read full article
——————–
Food for Thought
1. Gen Z on social media:
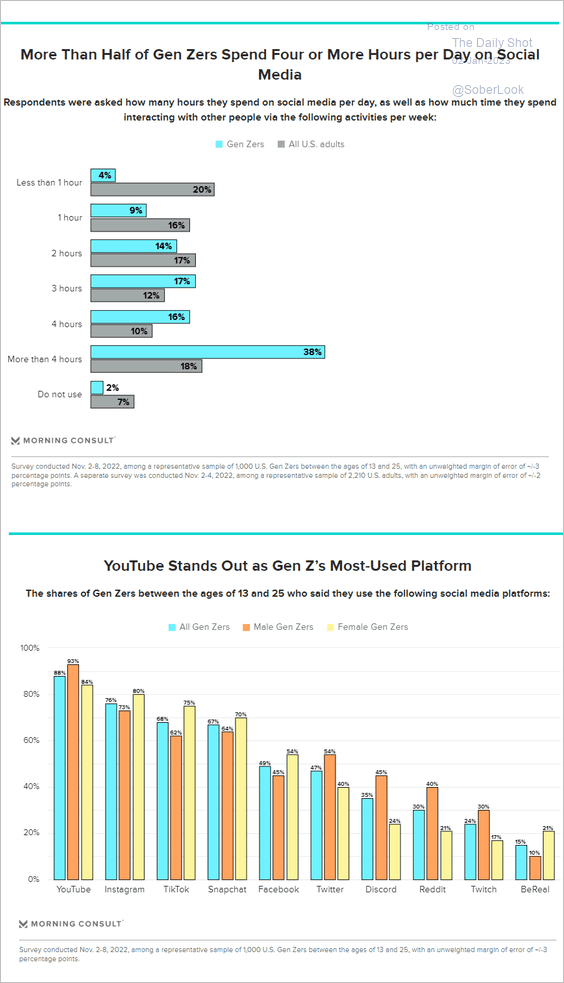 Source: Morning Consult Read full article
2. The largest IPOs:
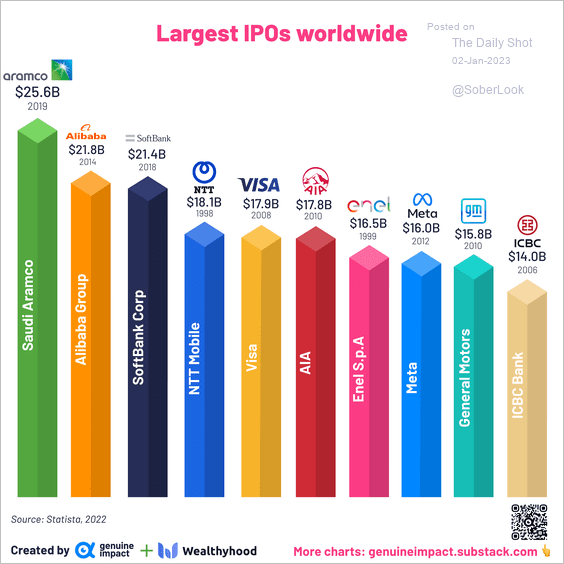 Source: @du_truman
3. Large arms-producing companies’ sales:
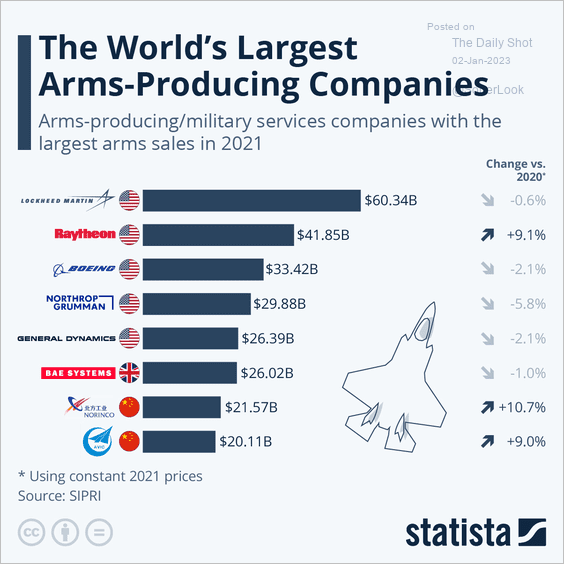 Source: Statista
4. Food inflation in select economies:
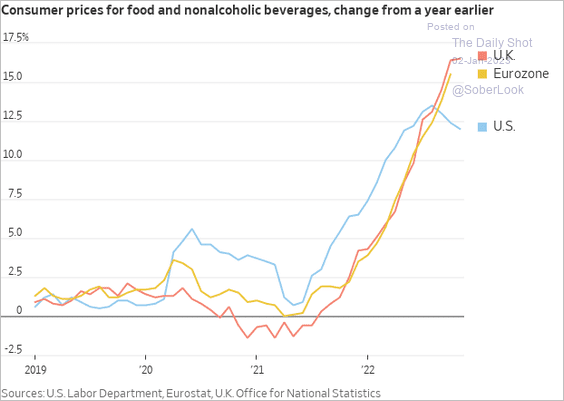 Source: @WSJ Read full article
5. GDP projections (levels):
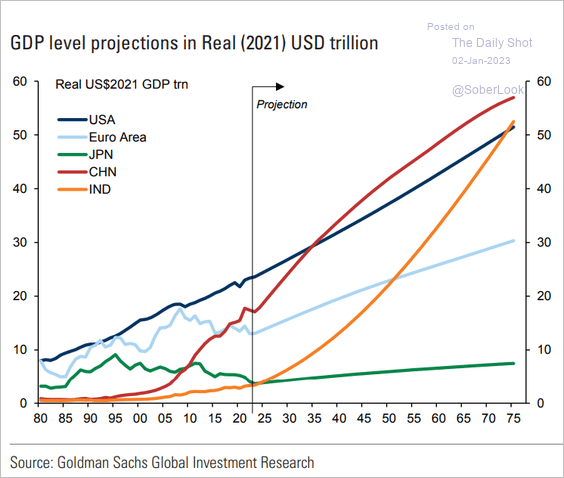 Source: Goldman Sachs
6. The global population distribution:
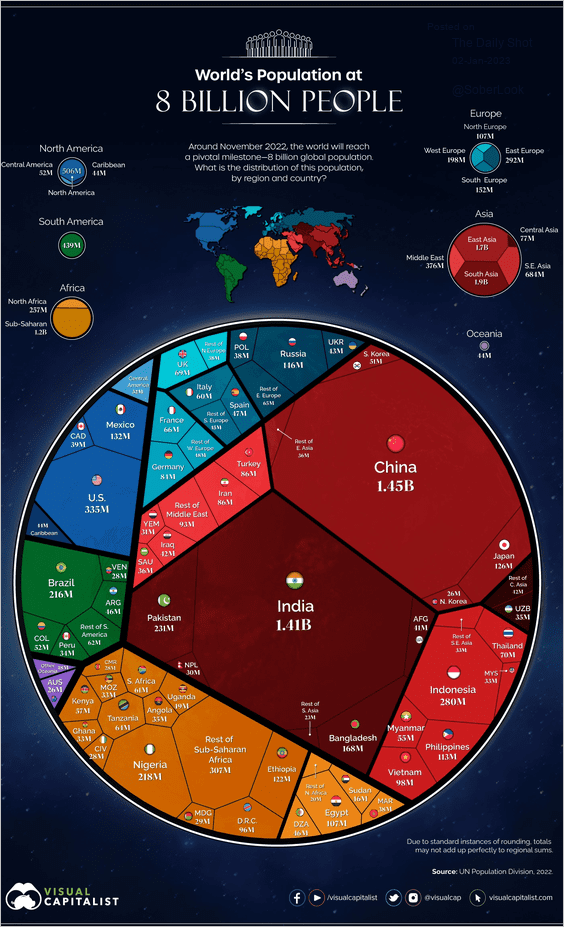 Source: Visual Capitalist Read full article
7. Support for rules to end plastic pollution:
 Source: Statista
8. Preferred US policy toward Ukraine:
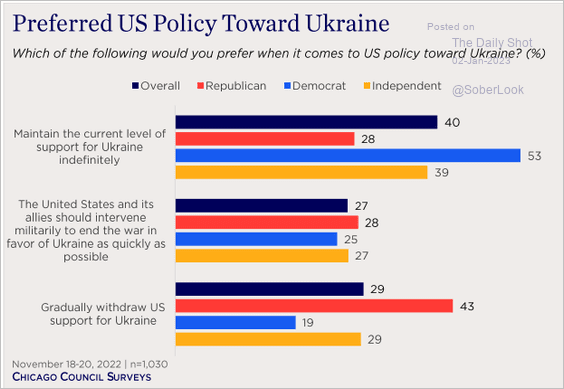 Source: Chicago Council on Global Affairs Read full article
9. Average home size by state:
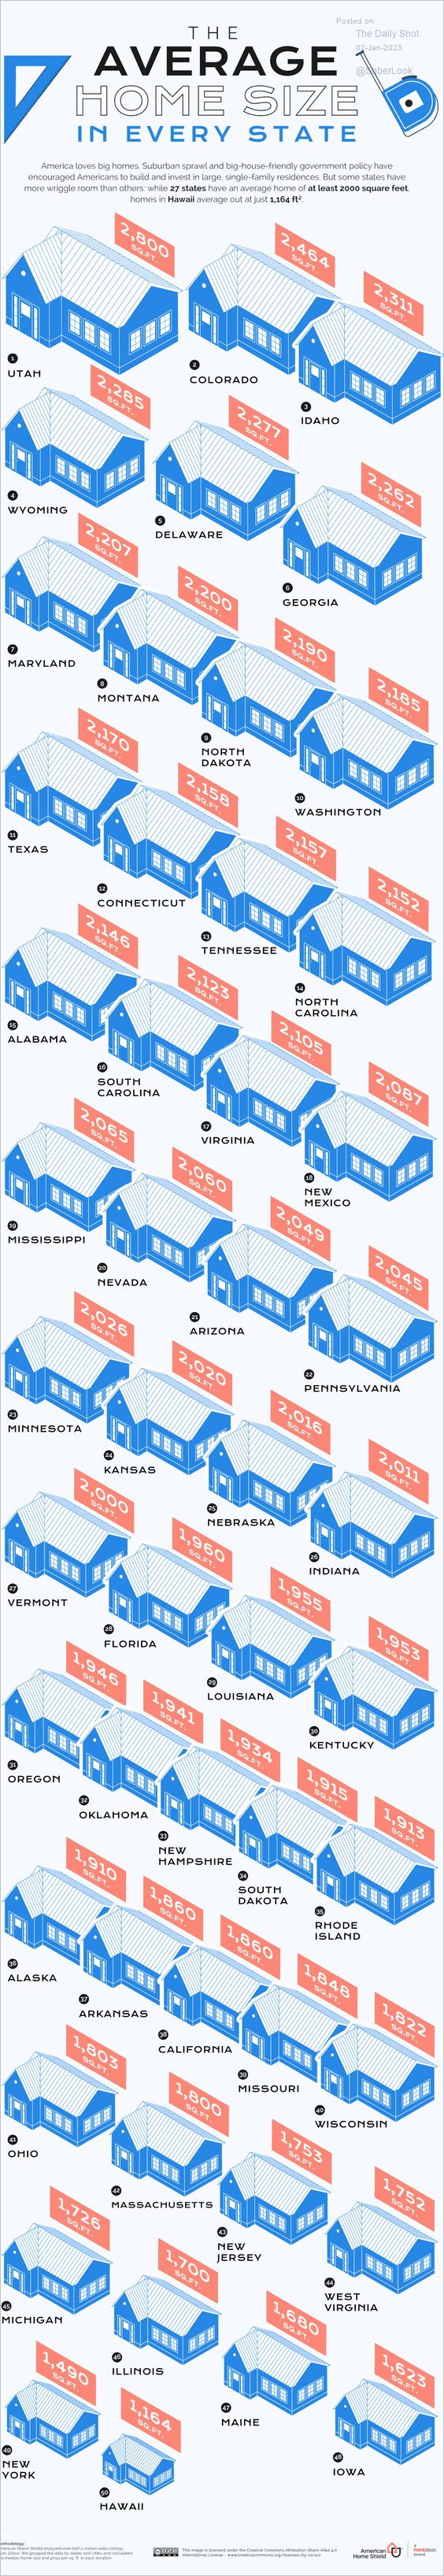 Source: Visual Capitalist Read full article
——————–
Back to Index