
The Daily Shot: 26-Jan-23
• The United States
• Canada
• The United Kingdom
• The Eurozone
• Japan
• Asia – Pacific
• China
• Emerging Markets
• Cryptocurrency
• Commodities
• Energy
• Equities
• Credit
• Global Developments
• Food for Thought
The United States
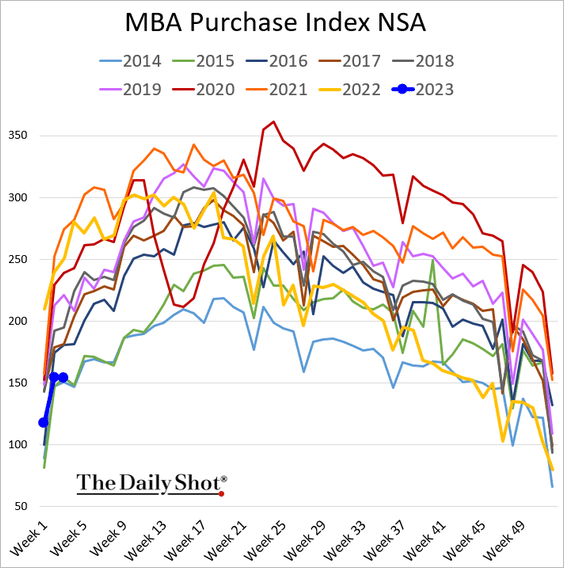
1. Let’s begin with the housing market.
• Mortgage applications are running at 2014/2015 levels.
Rate locks are also at multi-year lows.
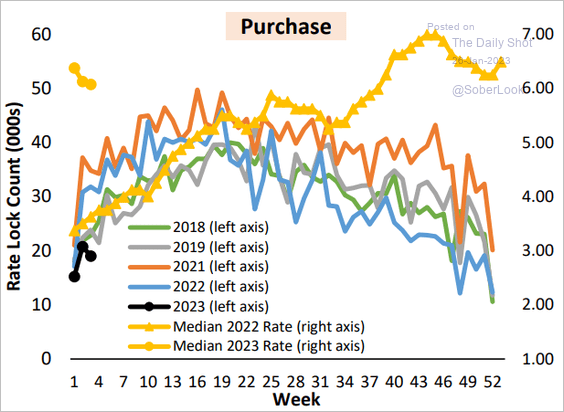 Source: AEI Housing Center
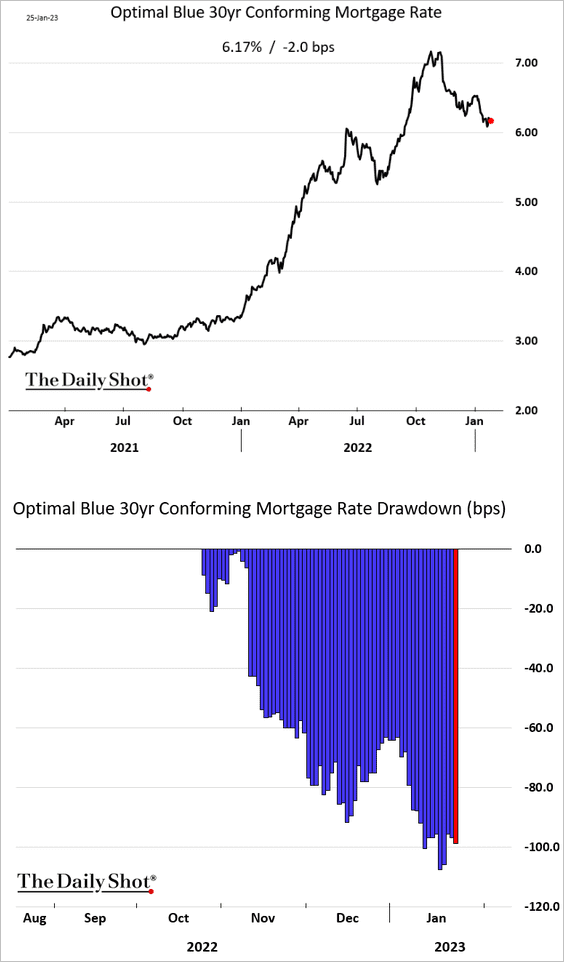
• Mortgage rates are down about 100 bps from the recent highs.
• Housing affordability is not returning to pre-2021 levels any time soon, according to Goldman.
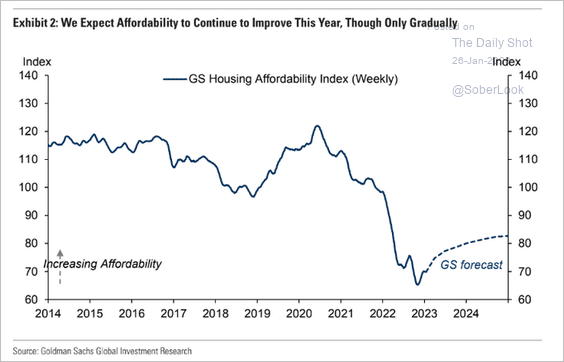 Source: Goldman Sachs; @MikeZaccardi
• The number of distressed home sales remains modest.
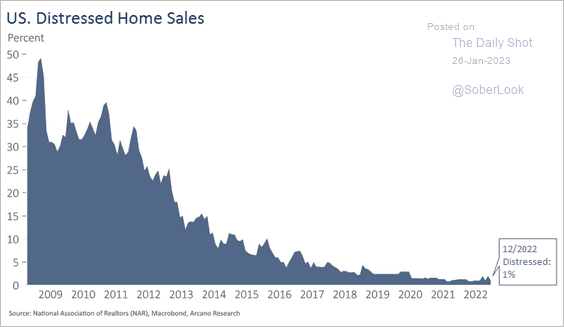 Source: Arcano Economics
——————–
2. Next, we have some updates on the labor market.
• Job gains have been concentrated in sectors with employment shortfalls.
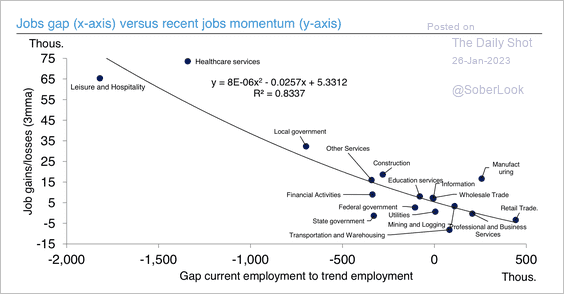 Source: Deutsche Bank Research
• The labor market supply/demand imbalance remains extreme, which will keep wage growth elevated (2 charts).
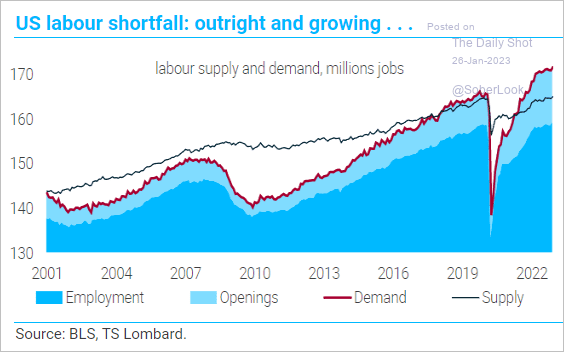 Source: TS Lombard
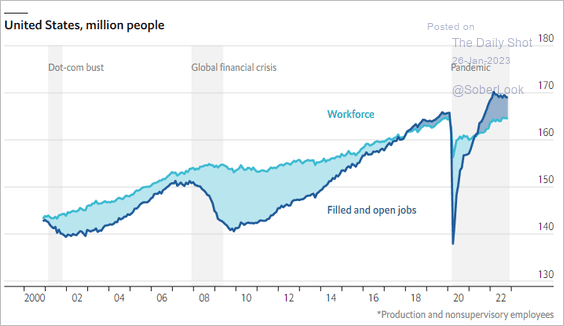 Source: The Economist Read full article
——————–
3. Next, let’s take a look at some trends in household finance.
• What drove the rise in excess savings?
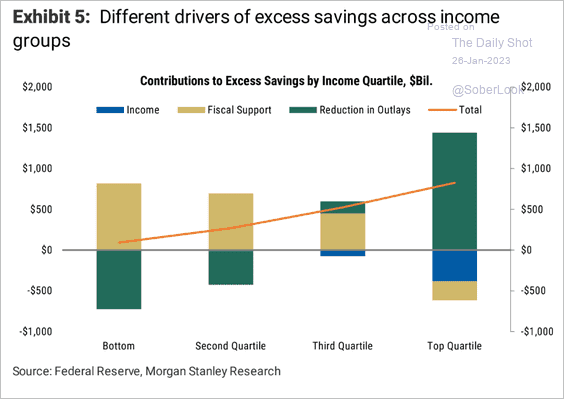 Source: Morgan Stanley Research
• Excess savings drawdown by income:
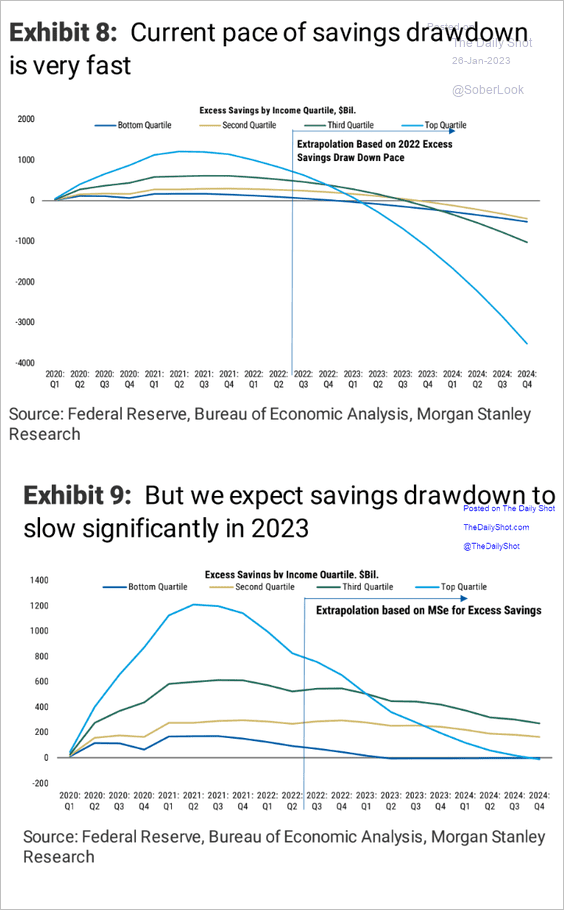 Source: Morgan Stanley Research
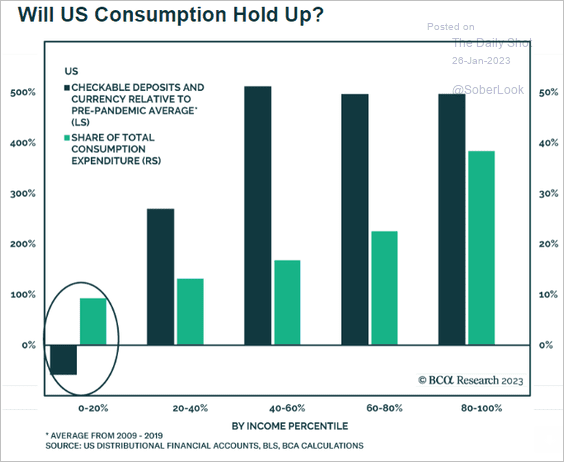
• Household cash balances (2 charts):
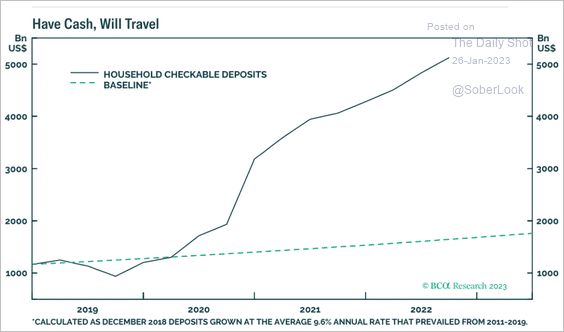 Source: BCA Research
 Source: BCA Research
• Deposits as a percent of consumer spending:
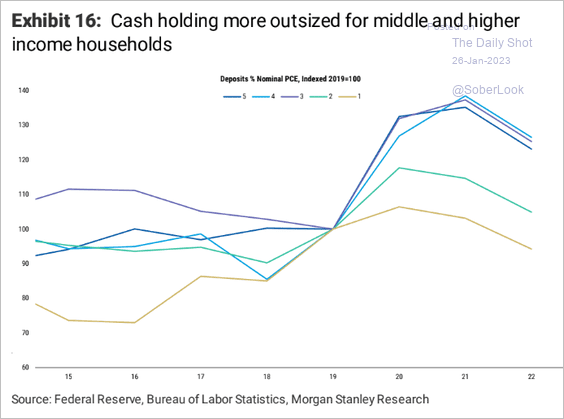 Source: Morgan Stanley Research
• Cash holdings relative to income:
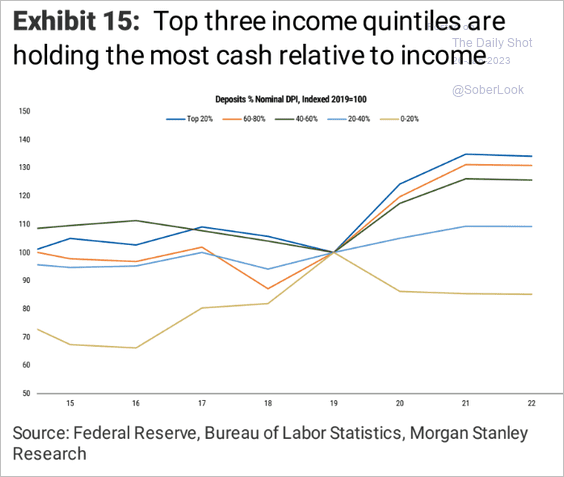 Source: Morgan Stanley Research
• Financial assets:
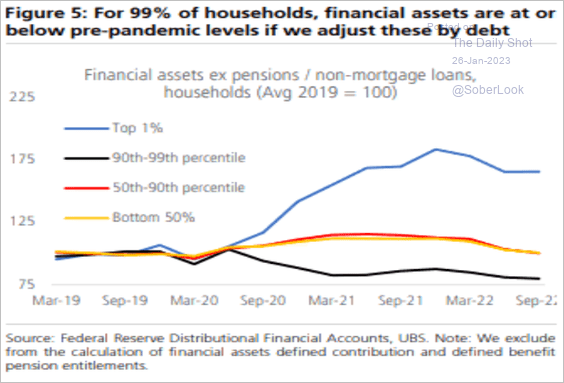 Source: UBS Research; III Capital Management
• Liquid assets by income:
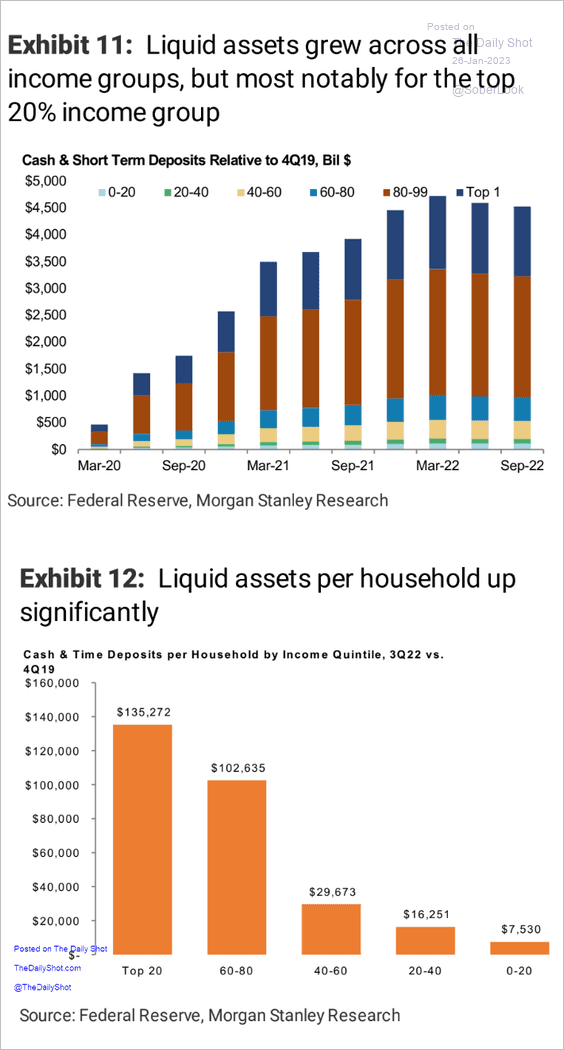 Source: Morgan Stanley Research
• Household debt service ratio (back to pre-COVID levels):
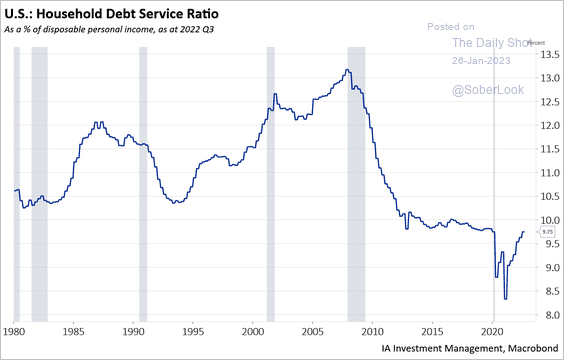 Source: Industrial Alliance Investment Management
• Household leverage relative to other advanced economies:
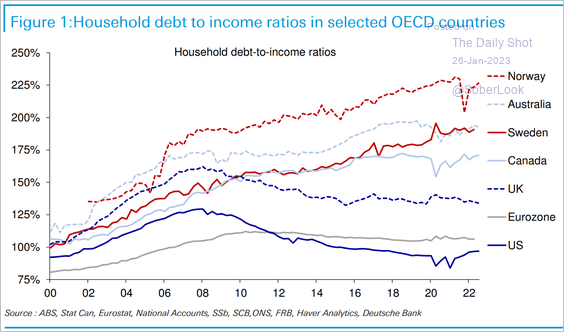 Source: Deutsche Bank Research
• Income expectations:
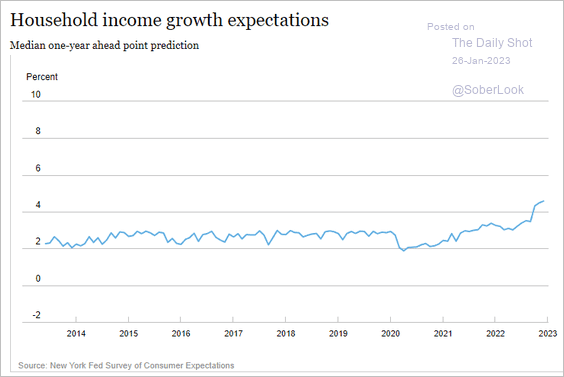 Source: Federal Reserve Bank of New York
• Hit to household net worth in this cycle (2 charts):
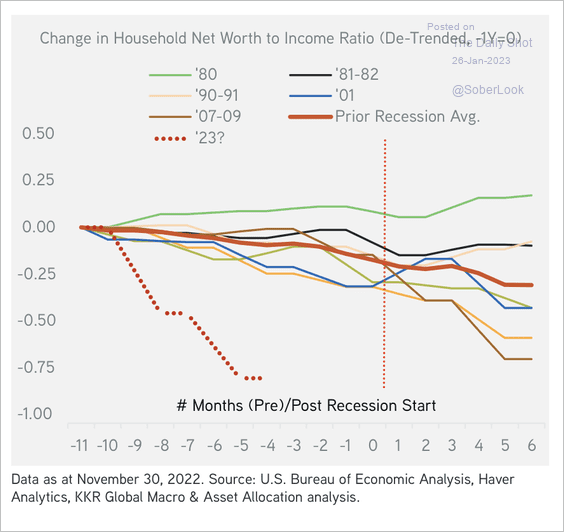 Source: KKR
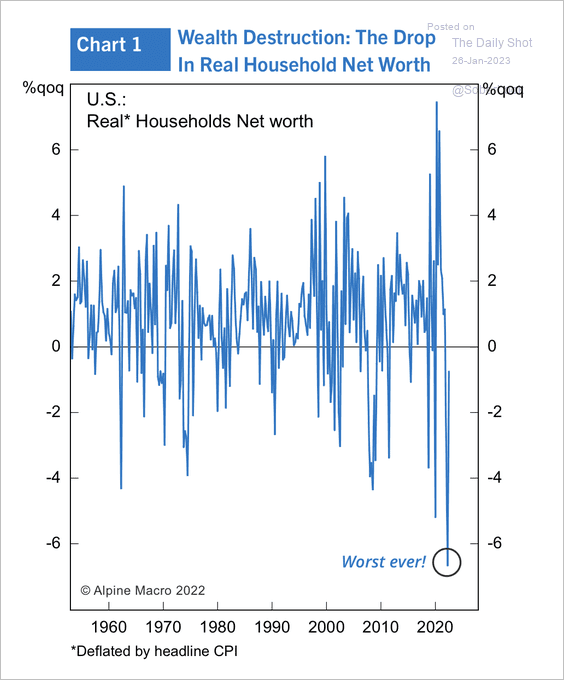 Source: Alpine Macro
• High-income Americans’ spending intentions:
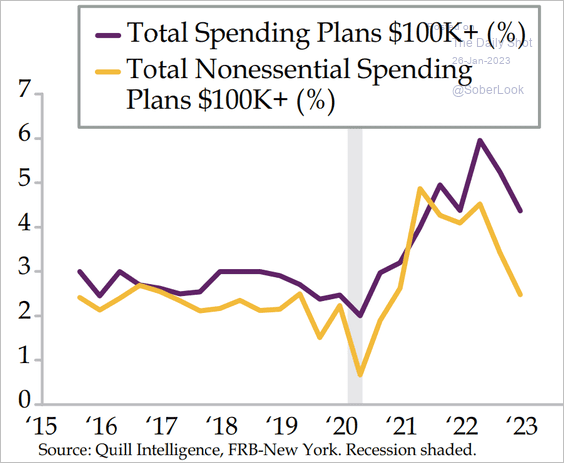 Source: Quill Intelligence
• Percent of adults with expenses that are higher than income:
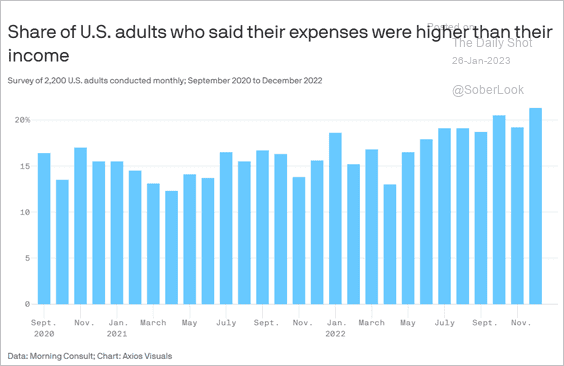 Source: @axios Read full article
Back to Index
Canada
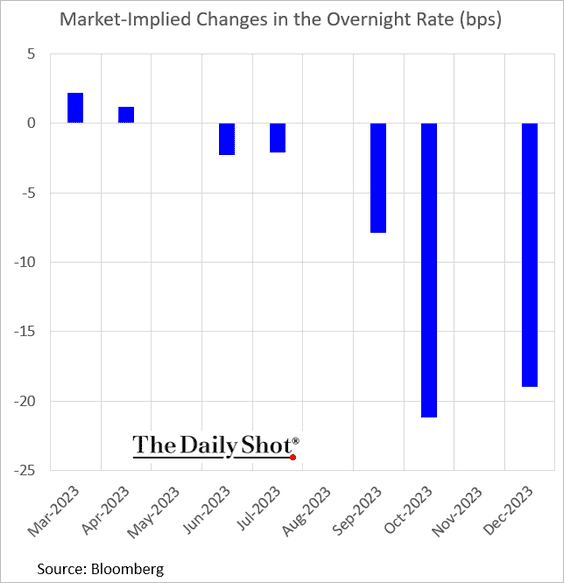
1. The BoC hiked rates by 25 bps (as expected) and signaled a pause.

The market doesn’t see any more rate increases in this cycle, with rate cuts kicking in later this year.
2. The central bank has been lowering inflation forecasts for 2023.
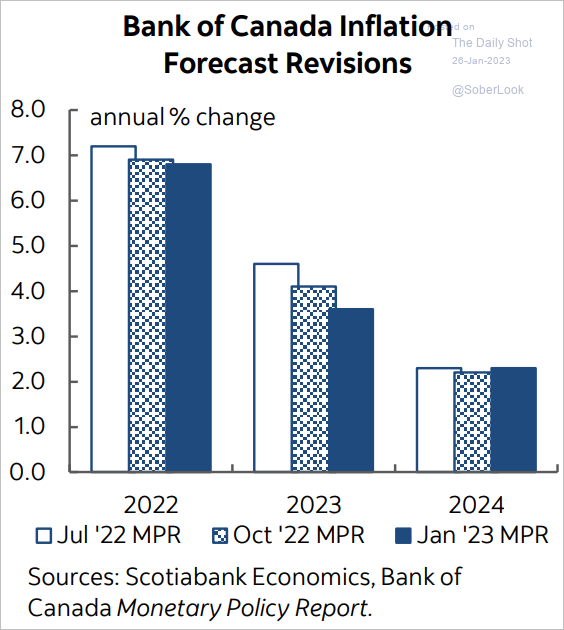 Source: Scotiabank Economics
3. This chart shows the distribution of core (trimmed mean) CPI components over time.
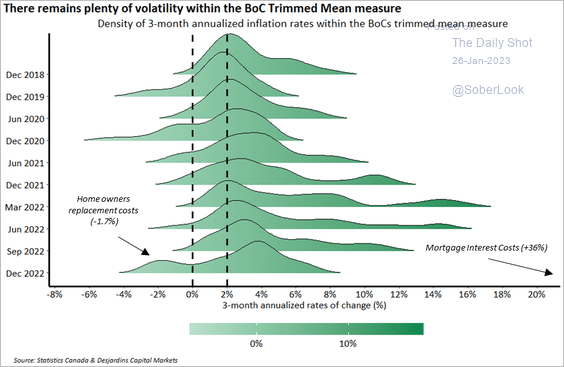 Source: Desjardins
4. The Canadian 2-year yield’s uptrend is losing momentum.
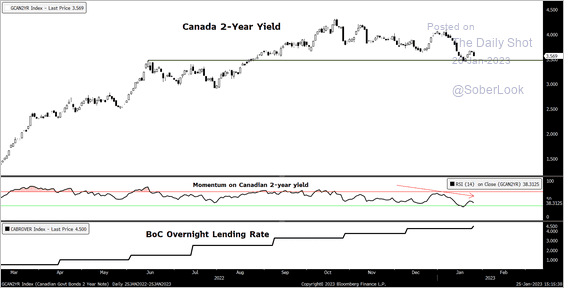 Source: Aazan Habib, Paradigm Capital
Back to Index
The United Kingdom
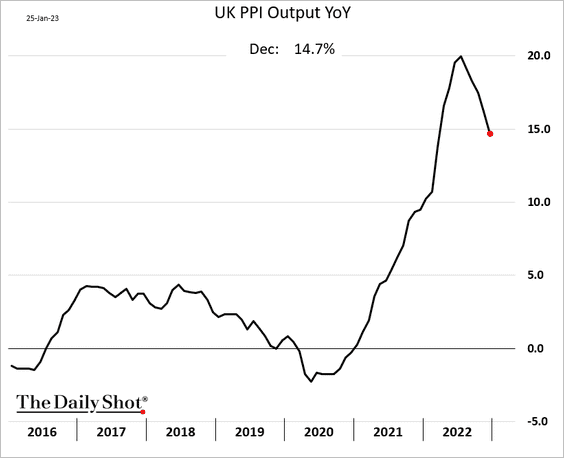
1. Producer price inflation continues to ease.
2. Demand for credit has slowed sharply.
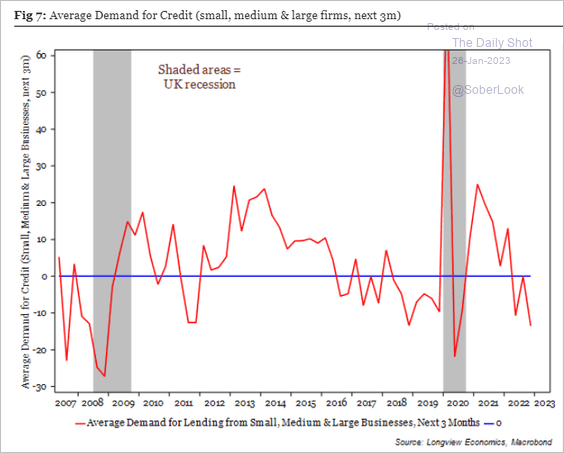 Source: Longview Economics
3. Energy-intensive services and consumer goods saw the highest rates of inflation.
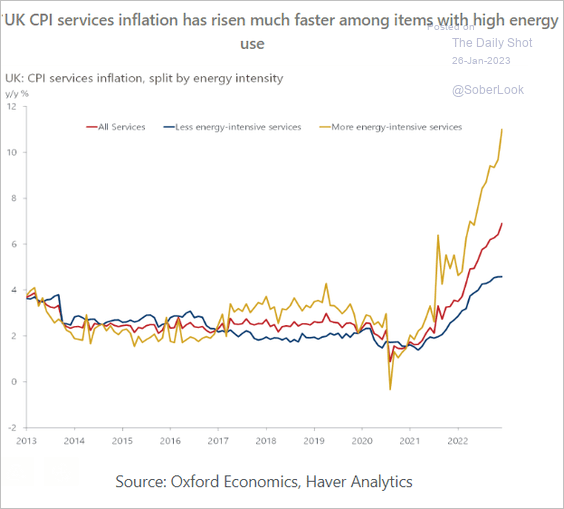 Source: Oxford Economics
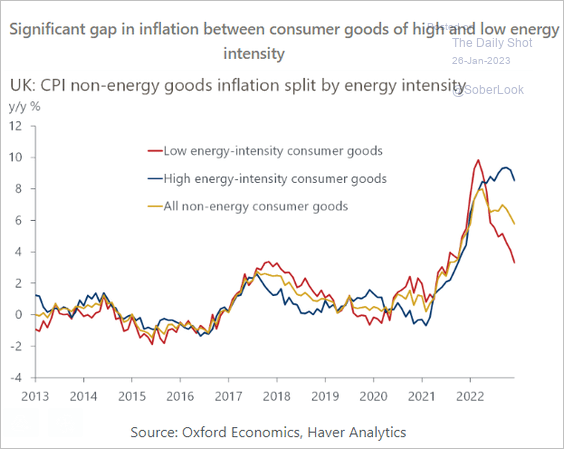 Source: Oxford Economics
Back to Index
The Eurozone
1. Germany’s business sentiment is rebounding rapidly.
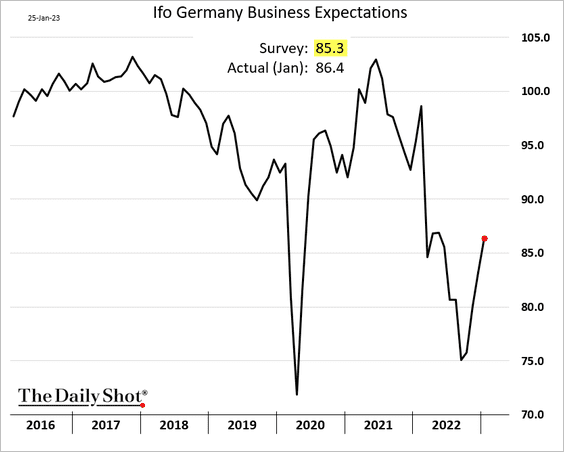
But construction is lagging (lower right).
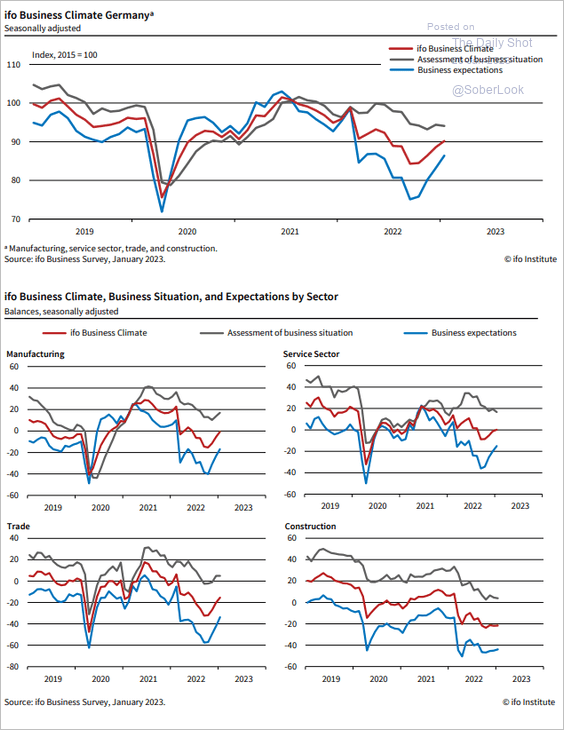 Source: ifo Institute
Building permits have been slowing.
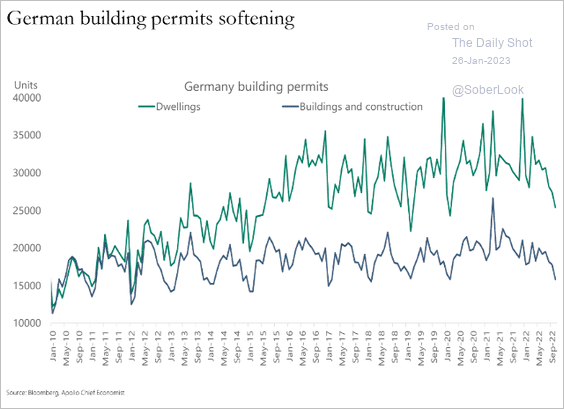 Source: Torsten Slok, Apollo
——————–
2. Italy’s tightening liquidity points to further deterioration in economic activity.
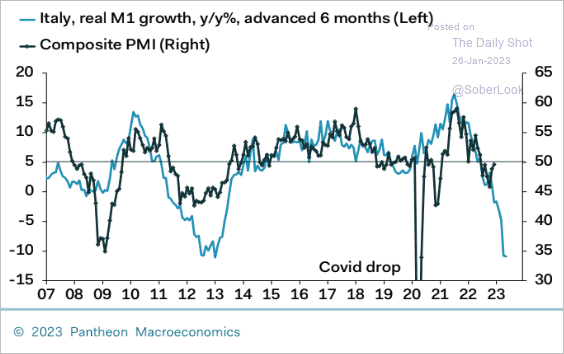 Source: Pantheon Macroeconomics
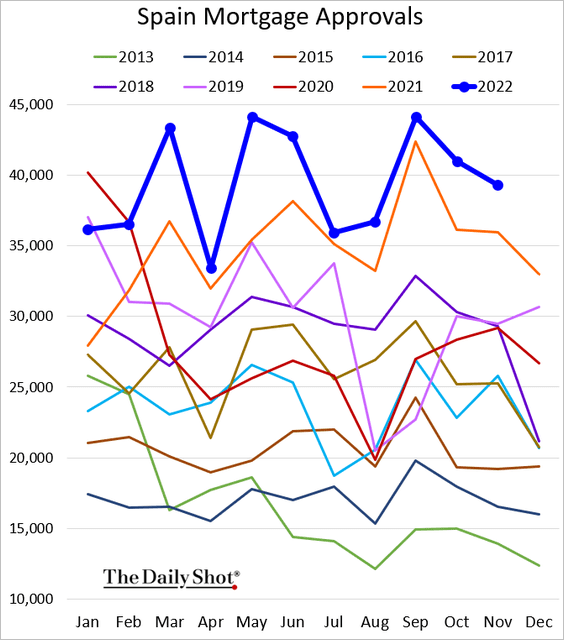
3. Next, let’s take a look at Spain’s housing market.
• Home sales:
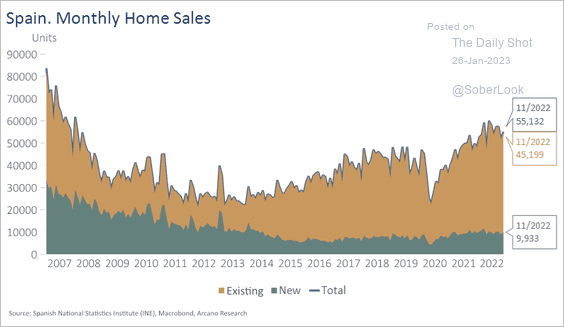 Source: Arcano Economics
• Mortgage approvals (multi-year highs):
• Building permits:
 Source: Torsten Slok, Apollo
——————–
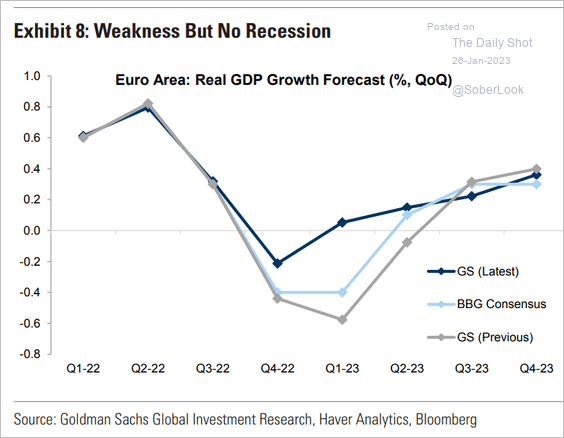
4. Goldman no longer expects a recession in the Eurozone.
 Source: Goldman Sachs
Back to Index
Japan
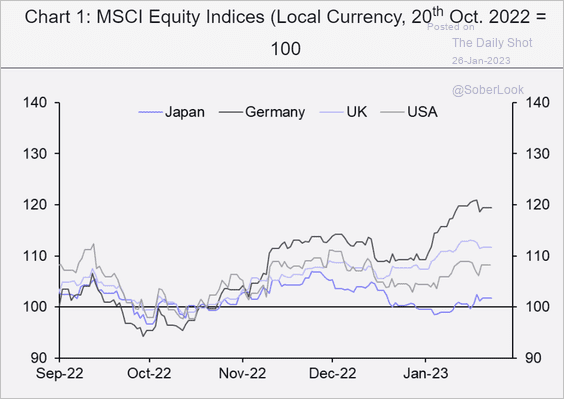
1. Japanese shares have been underperforming.
 Source: Capital Economics
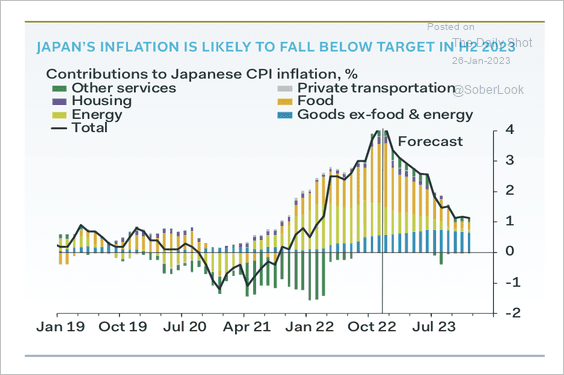
2. Inflation is expected to decline below target later this year. Softer economic growth could extend the timeline to achieve sustainable inflation, likely until 2024, according to Pantheon Macroeconomics.
 Source: Pantheon Macroeconomics
Back to Index
Asia – Pacific
1. South Korea’s GDP declined in Q4.
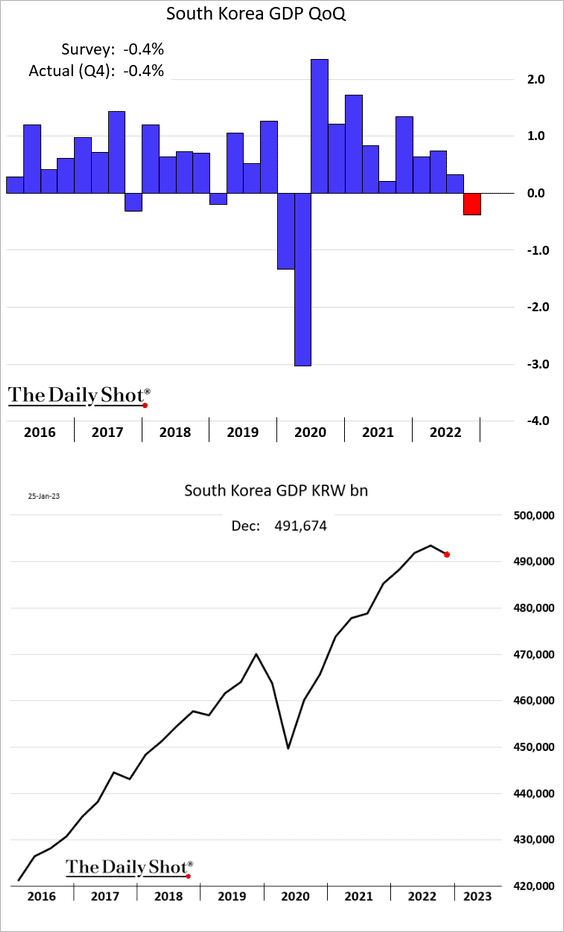
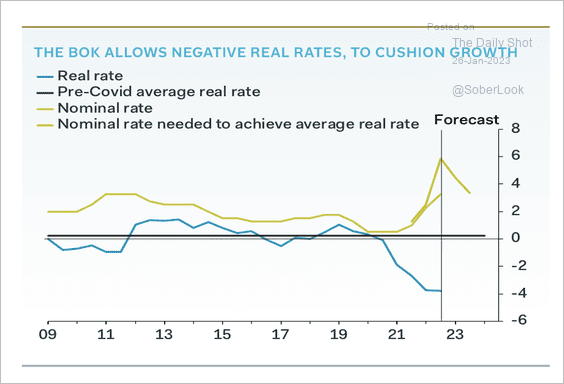
• Pantheon Macroeconomics expects the Bank of Korea to raise rates by another 25 basis points. Rate cuts could begin around Q4 2023.
 Source: Pantheon Macroeconomics
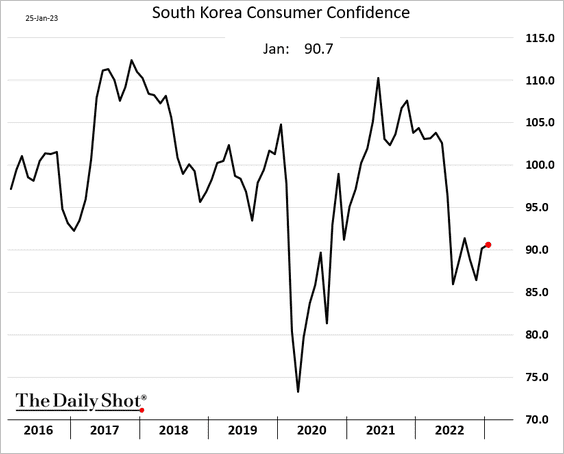
• Consumer confidence remains at depressed levels.
——————–
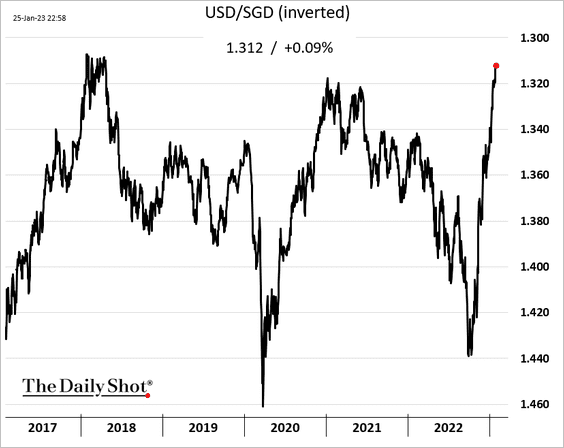
2. The Singapore dollar hit a multi-year high vs. USD.
3. New Zealand’s inflation remains elevated.
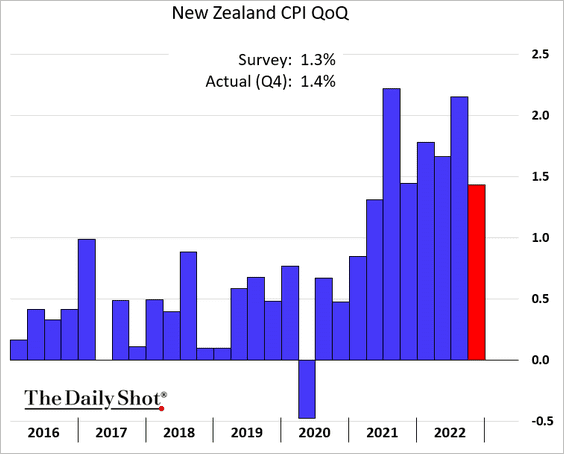
• The market expects a 50 bps RBNZ rate hike next month.
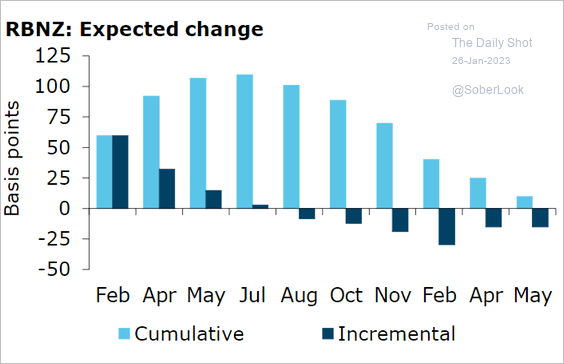 Source: @ANZ_Research
• The labor market could take a hit as employment intentions tumble.
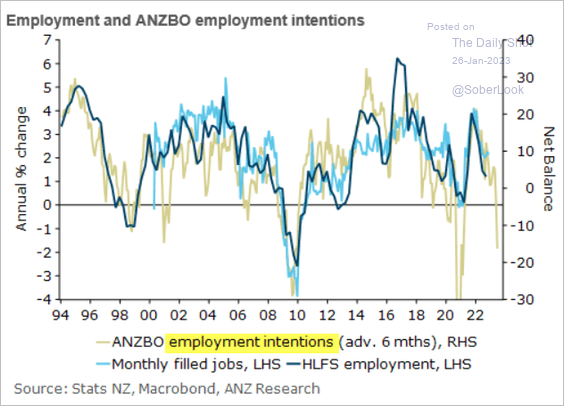 Source: @ANZ_Research
——————–
4. Here is the breakdown of Australia’s recent inflation changes.
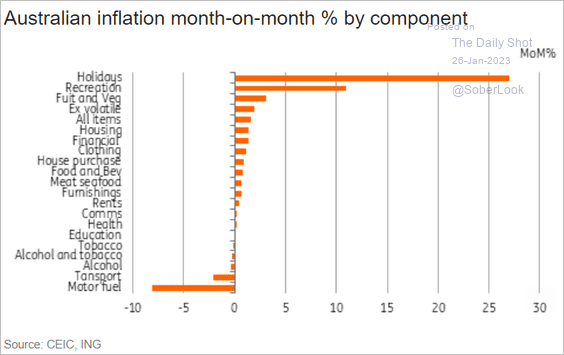 Source: ING
• The market expects a 25 bps RBA rate hike next month.
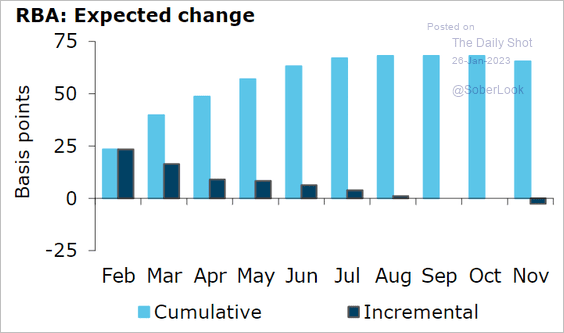 Source: @ANZ_Research
• Households’ economic expectations remain depressed.
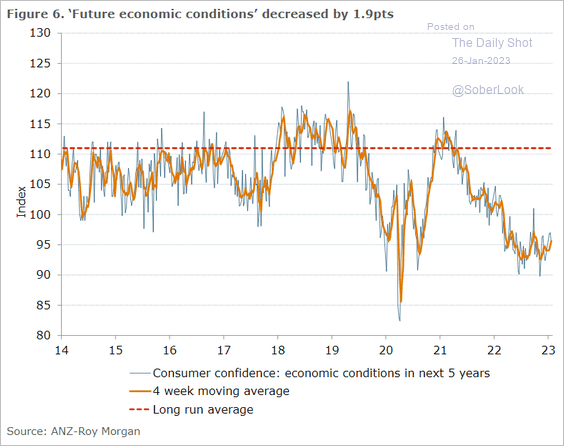 Source: @ANZ_Research
Back to Index
China
1. Local governments’ debt cost surged last year.
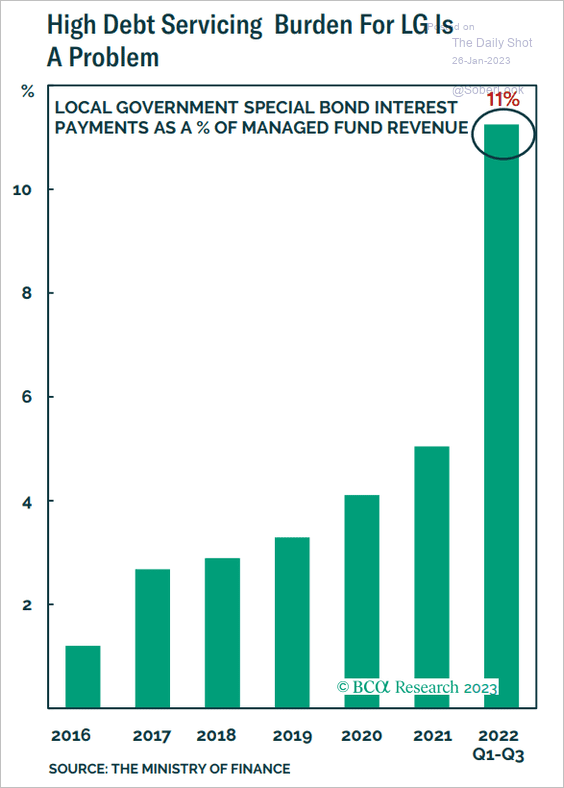 Source: BCA Research
A lot of local-government debt is maturing in 2023.
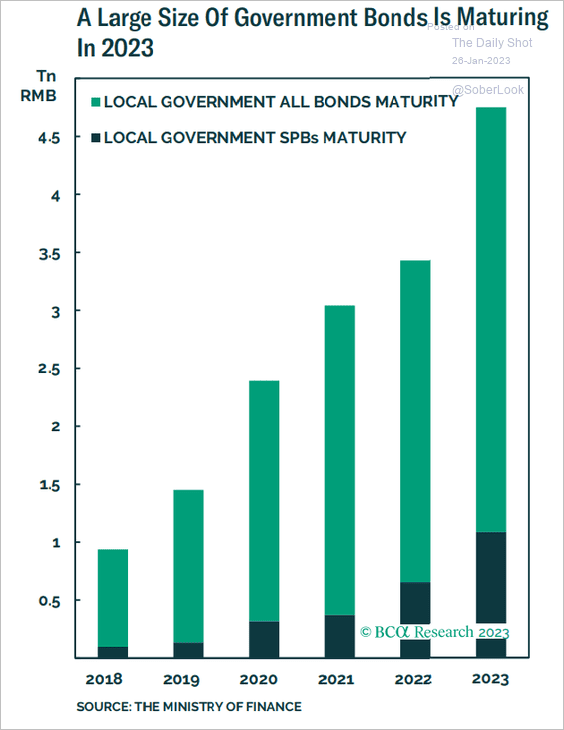 Source: BCA Research
——————–
2. Here is China’s system-wide leverage over time.
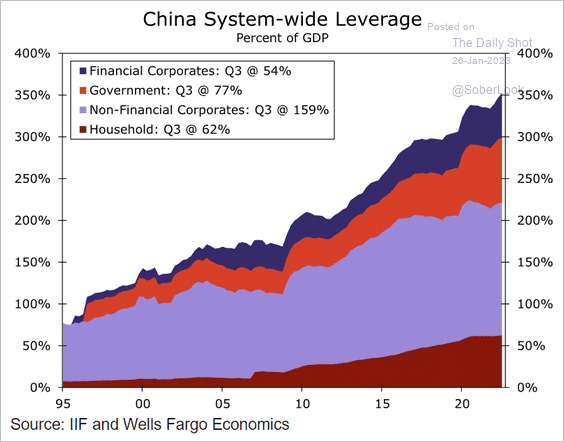 Source: Wells Fargo Securities
3. Northbound flows (via links) surged this year as Hong Kong and foreign capital moves into China’s stock market.
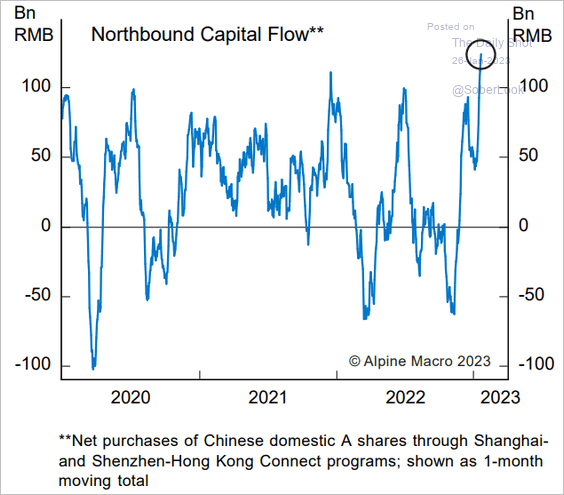 Source: Alpine Macro
Back to Index
Emerging Markets
1. Thailand’s central bank hiked rates again, …
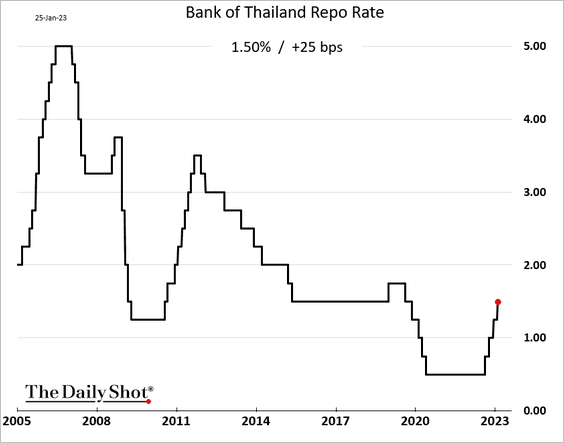
… but rate increases have not been in line with inflation levels.
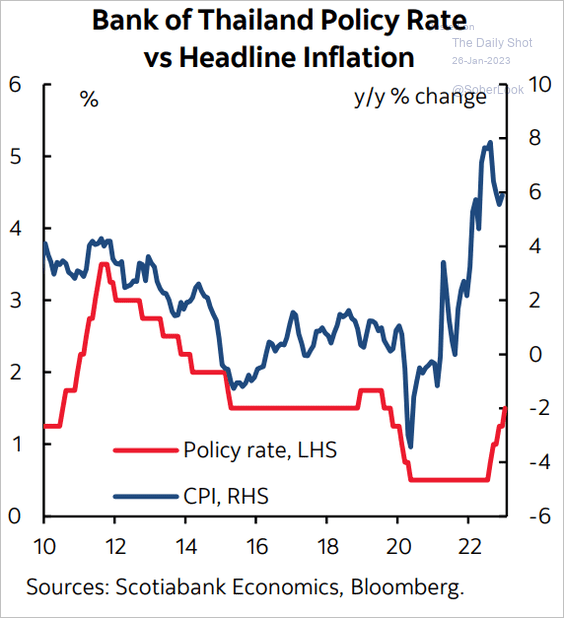 Source: Scotiabank Economics
——————–
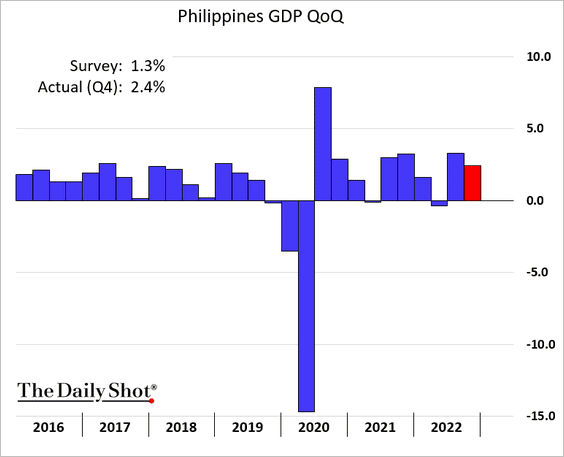
2. The Philippine GDP surprised to the upside.
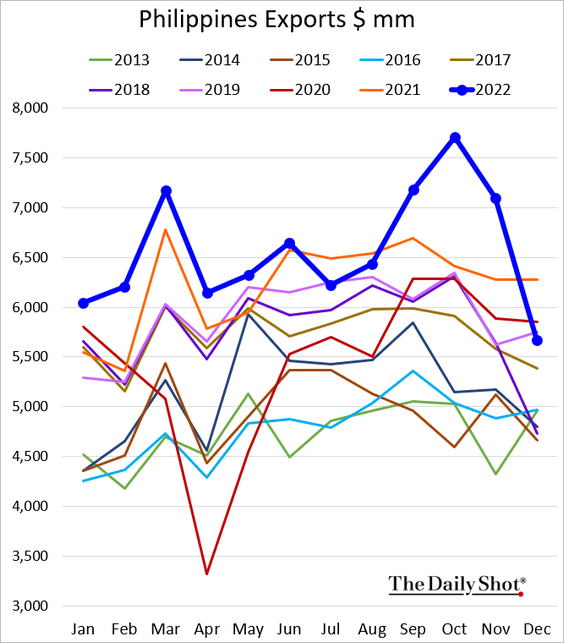
Exports tumbled from record highs at the end of last year.
——————–
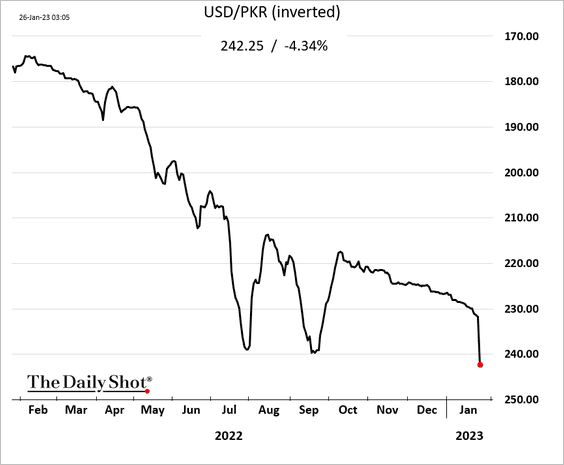
3. The Pakistani rupee dropped sharply.
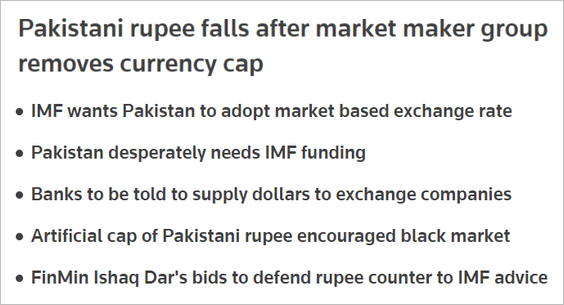 Source: Reuters Read full article
——————–
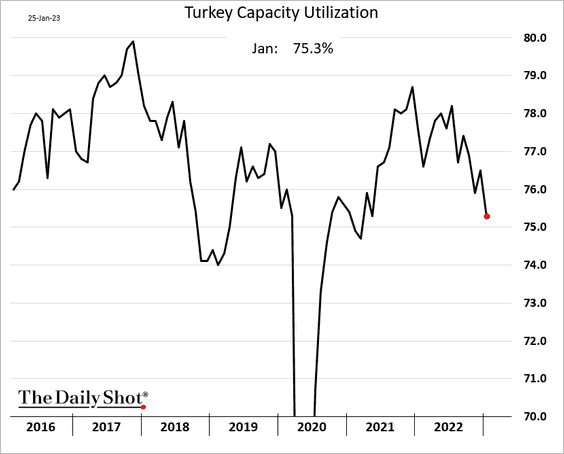
4. Turkey’s manufacturing confidence improved this month.
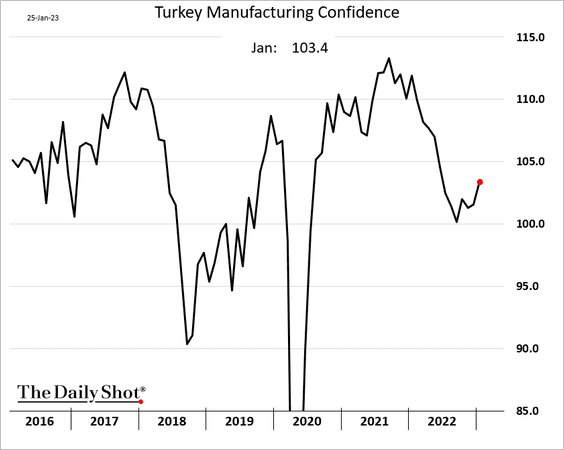
But capacity utilization continues to deteriorate.
——————–
5. Headline inflation has peaked in EM Asia, which means benchmark policy rates could turn positive in real terms.
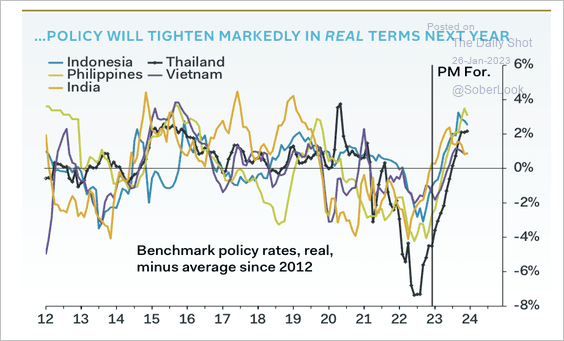 Source: Pantheon Macroeconomics
6. EM local currency sovereign bonds, particularly in LatAm, significantly outperformed despite a strong dollar and rising global inflation.
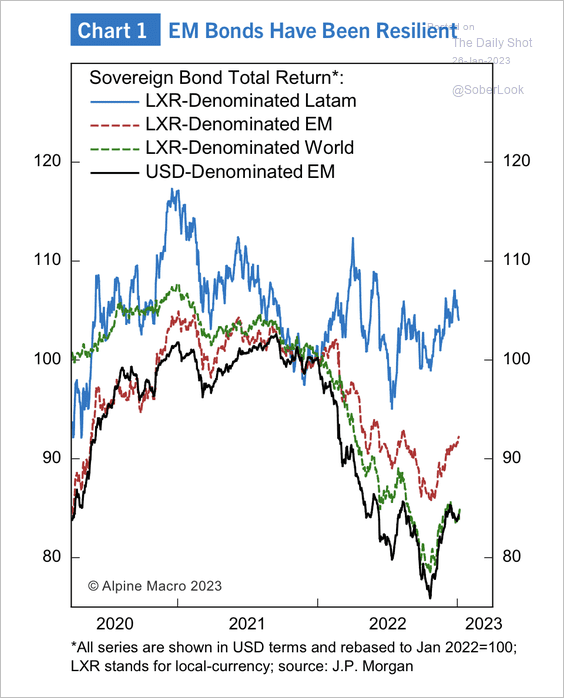 Source: Alpine Macro
EM sovereign bond spreads have narrowed as the dollar weakened. Meanwhile, the yield advantage of EM local currency bonds has widened to the highest level in over 20 years.
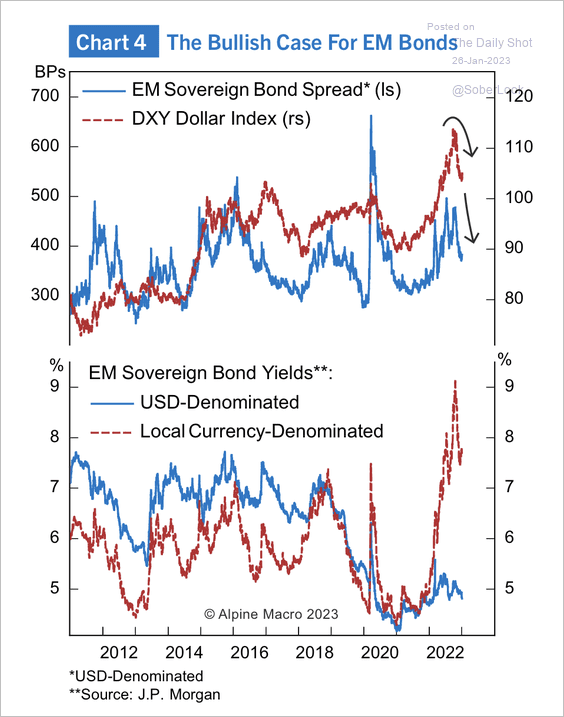 Source: Alpine Macro
Back to Index
Cryptocurrency
1. The Crypto Fear & Greed index rose to neutral as investor sentiment improved. Previous advances to neutral occurred before pullbacks in BTC’s downtrending price.
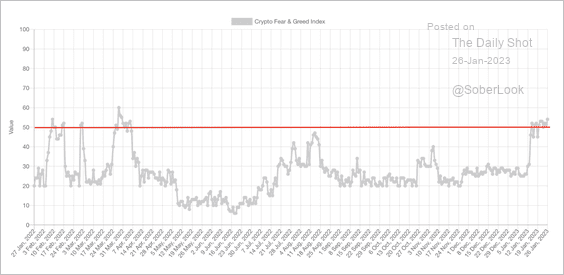 Source: Alternative.me
2. Exchange outflows, whales (holders of >1K BTC), and miners were main sources of distributed bitcoin supply last year.
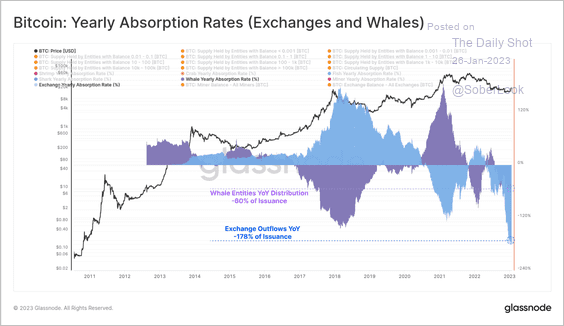 Source: @glassnode
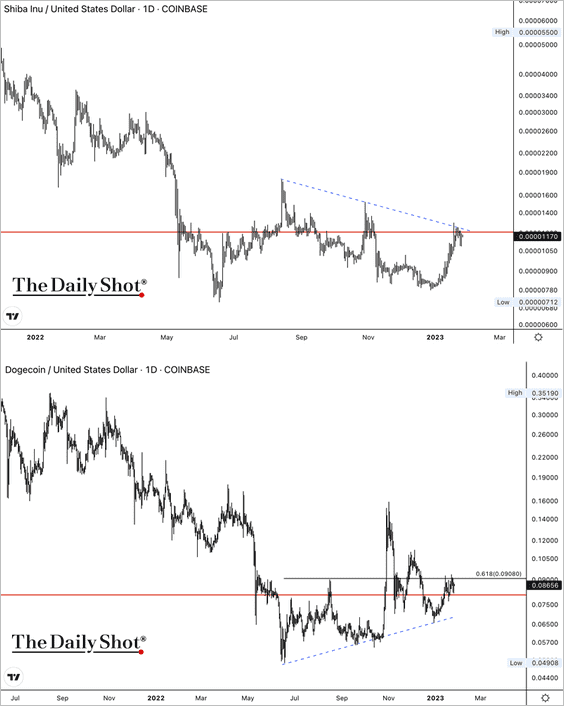
3. SHIB and DOGE, popular dog-themed memecoins, are testing resistance.
4. Next, we have some survey data.
• Views on crypto regulation relative to financial assets:
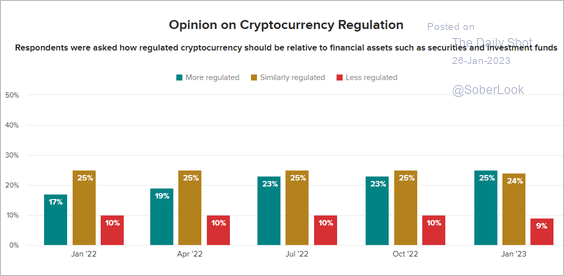 Source: Morning Consult Read full article
• Views on cryptos’ impact on society:
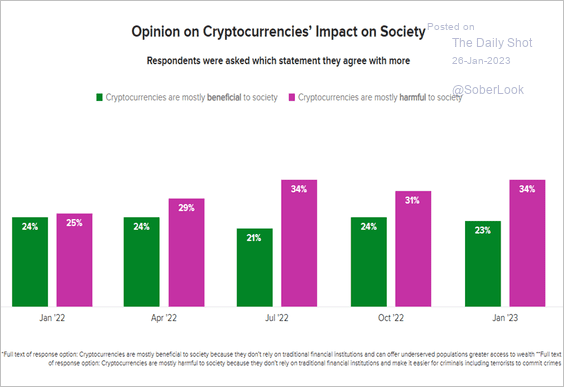 Source: Morning Consult Read full article
Back to Index
Commodities
1. Political troubles in Peru have been a tailwind for both copper and silver.
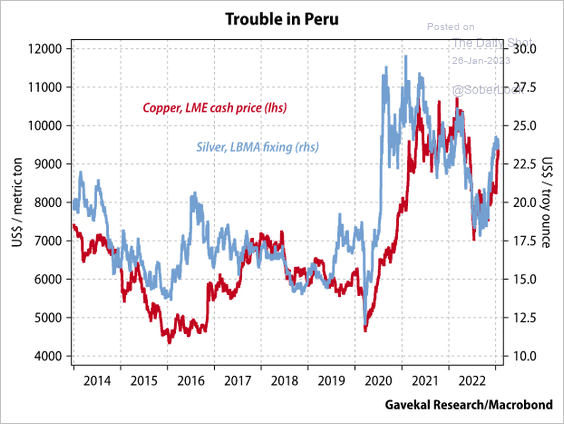 Source: Gavekal Research
2. Gold mining stocks are improving with strong breadth and relative performance.
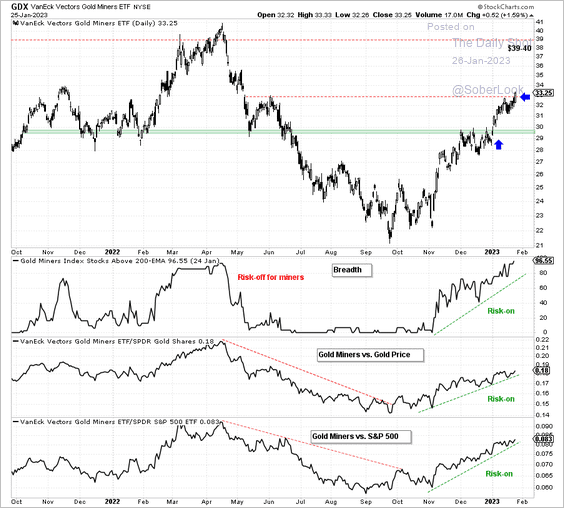 Source: Aazan Habib, Paradigm Capital
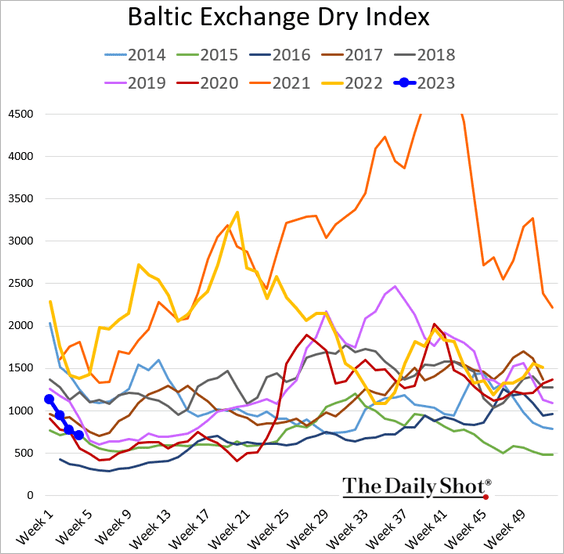
3. Dry bulk shipping costs are down almost 90% from the highs …
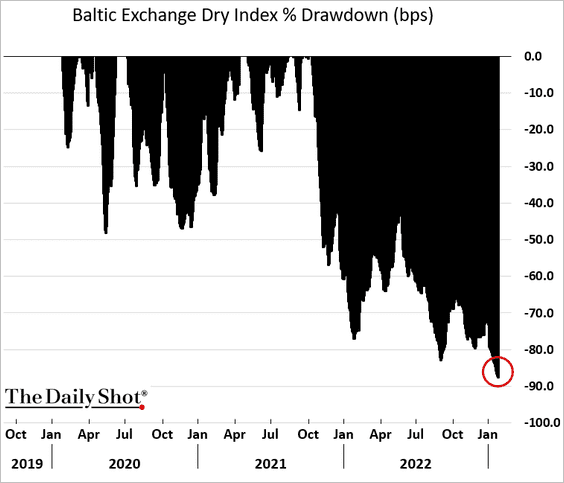
… and back to more typical levels for this time of the year.
Back to Index
Energy
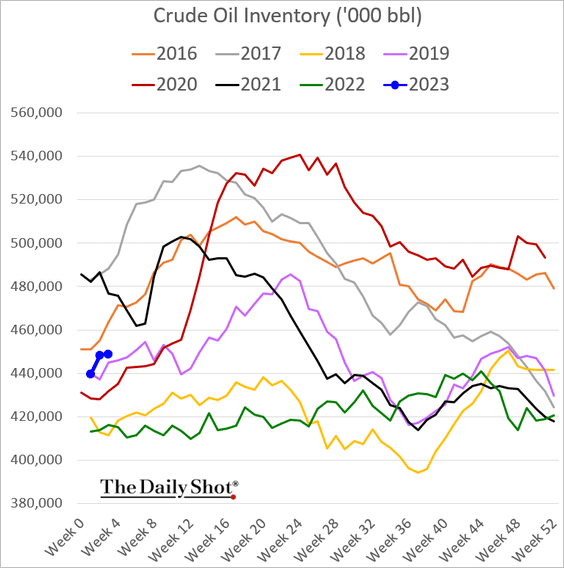
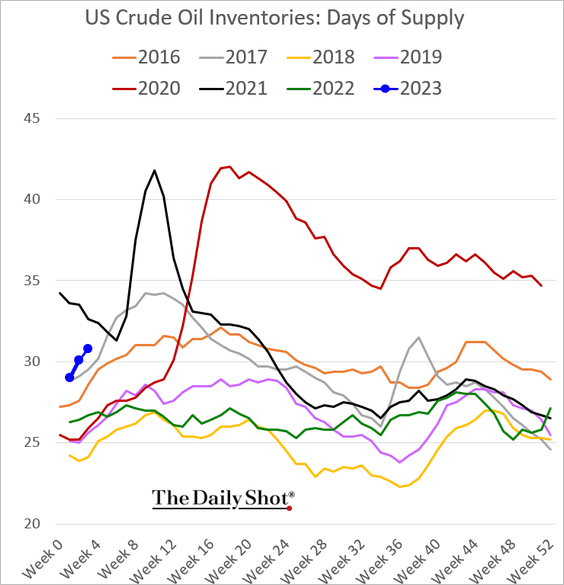
1. US oil inventories edged up last week, but the increase was lower than expected.
 Source: Reuters Read full article
• Barrels:
• Days of supply:
——————–
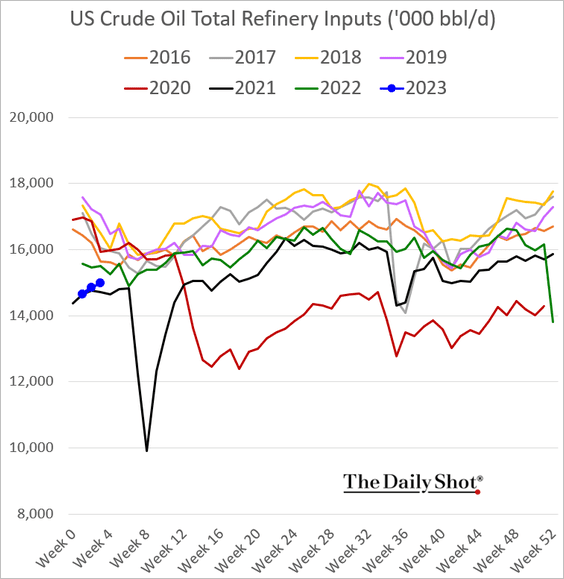
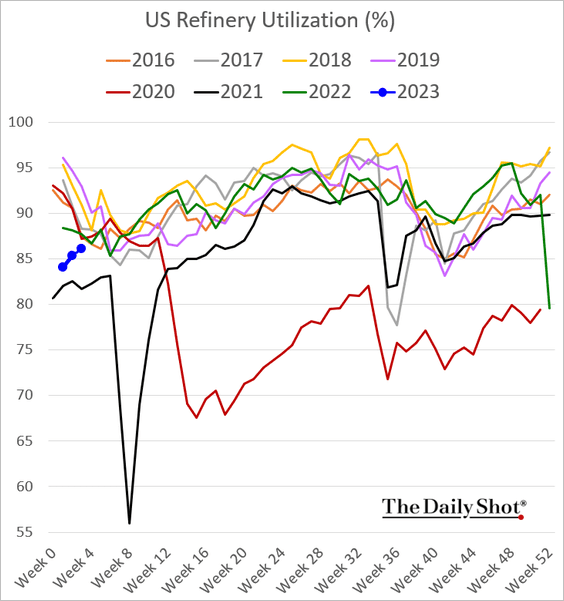
2. Refinery runs and utilization are still relatively low.
——————–
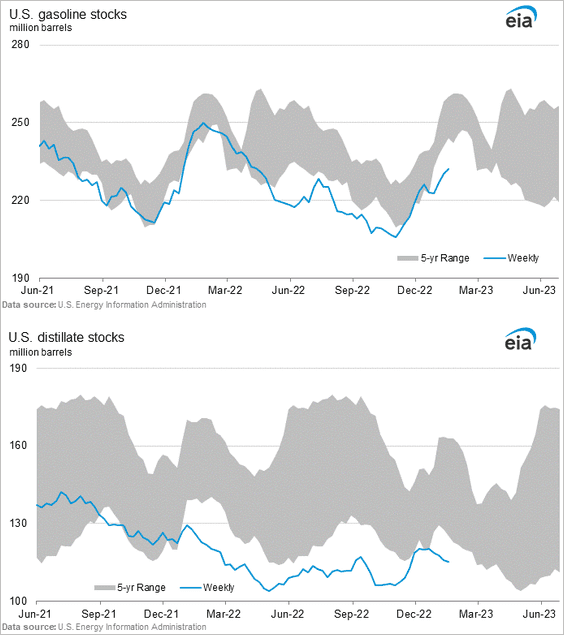
3. US refined product inventories remain depressed.
4. US oil production is expected to reach the pre-COVID peak next year.
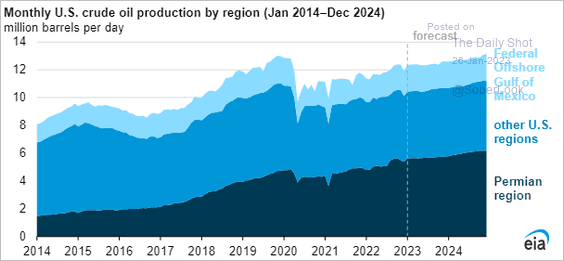 Source: @EIAgov Read full article
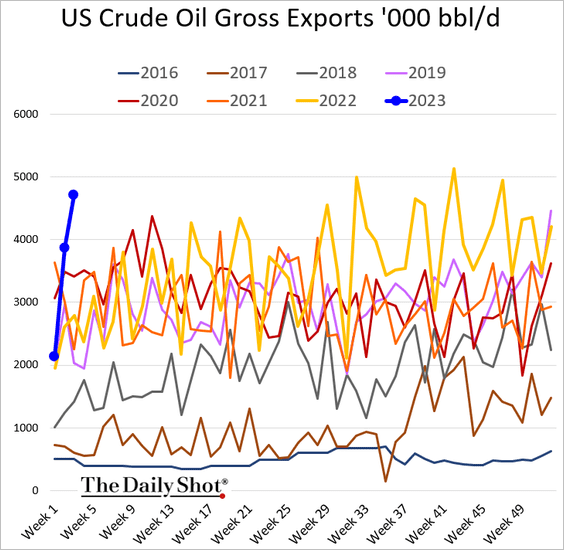
5. US crude oil exports hit a new high for this time of the year.
6. US natural gas futures dipped below $3.0/MMBtu.
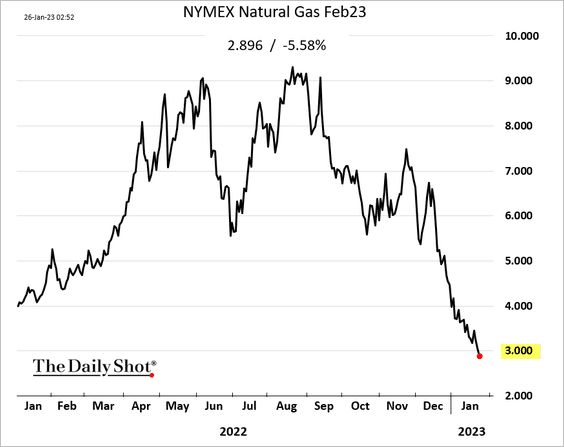
 Source: @gersonjr, @markets Read full article
——————–
7. In Texas, the buildout of battery facilities is starting to stabilize wind and solar power generation.
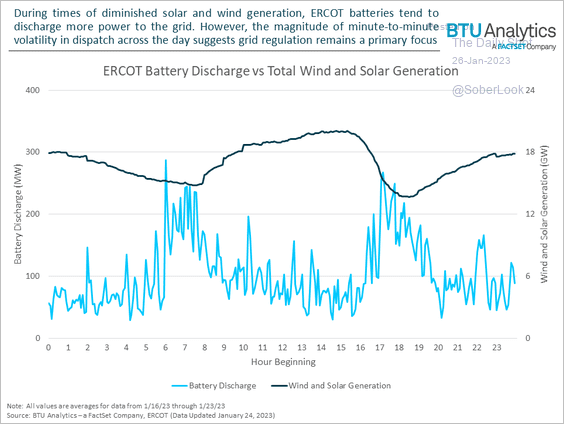 Source: @FactSet Read full article
Back to Index
Equities
1. The current rally has been broad, but few stocks posted big gains by historical standards, unlike in previous rebounds.
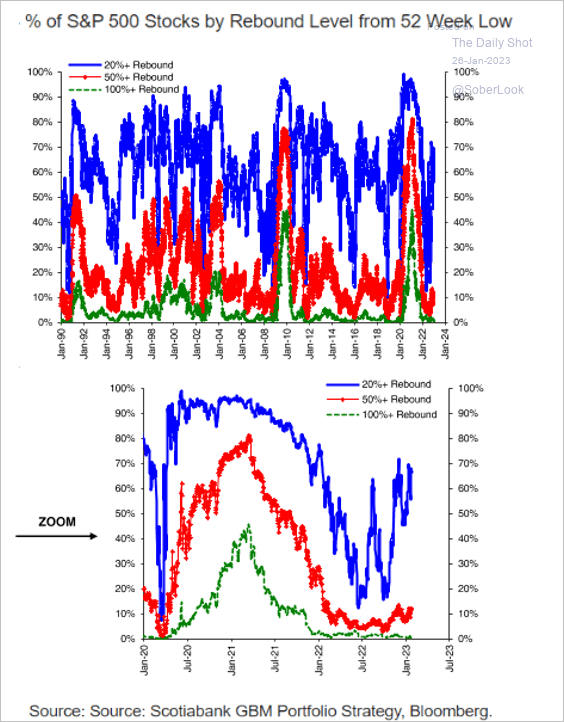 Source: Hugo Ste-Marie, Portfolio & Quantitative Strategy Global Equity Research, Scotia Capital
2. Will the economic cycle need to turn before we get a sustainable rally?
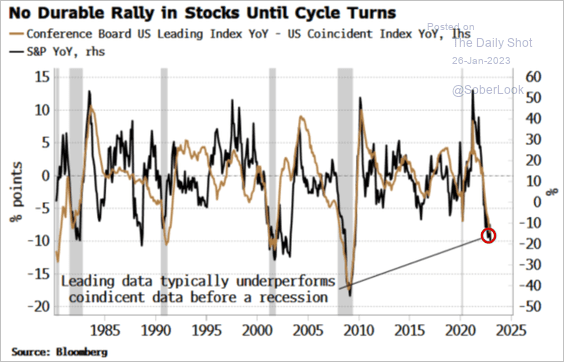 Source: Simon White, Bloomberg Markets Live Blog
3. This chart shows how much stocks have been moving on earnings.
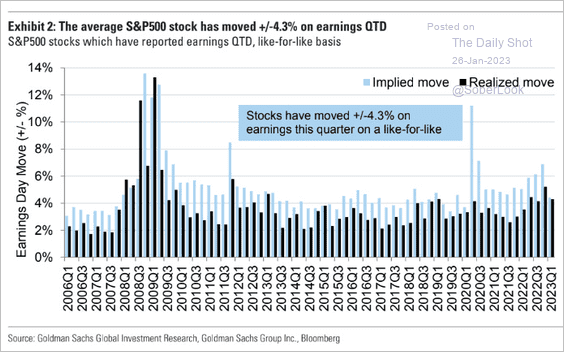 Source: Goldman Sachs; @MikeZaccardi
4. US small-cap discount is holding near extreme levels.
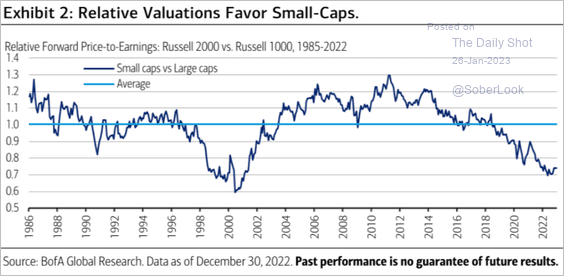 Source: BofA Global Research
5. Growth sectors’ valuation premium to value is at multi-year lows.
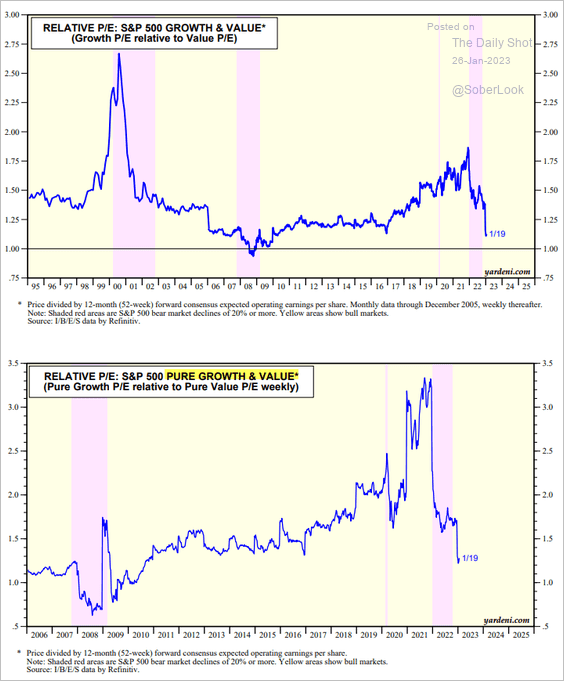 Source: Yardeni Research
6. Larger companies have wider operating margins.
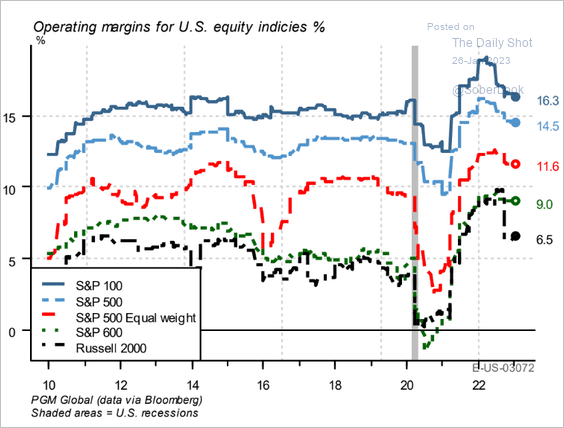 Source: PGM Global
7. This chart shows the evolution of earnings estimates for each year.
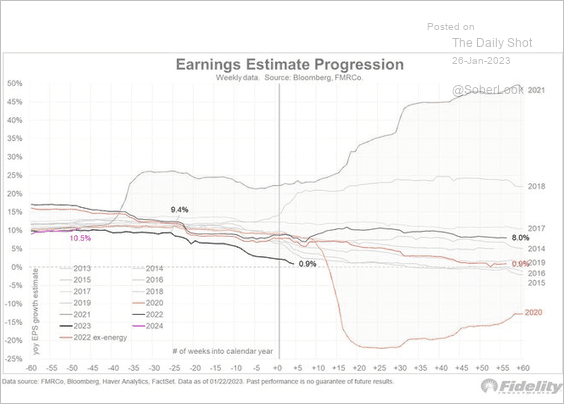 Source: @TimmerFidelity, h/t @dailychartbook
8. Activists’ campaigns picked up last year.
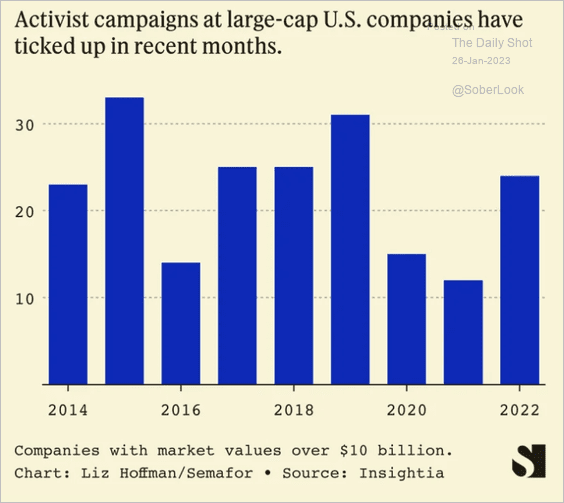 Source: Semafor Read full article
9. Who owns the US equity market?
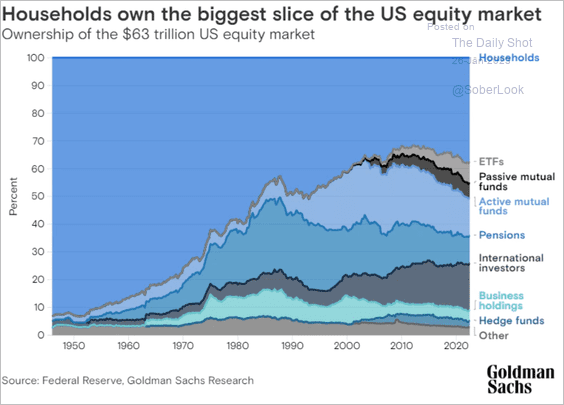 Source: Goldman Sachs
Back to Index
Credit
1. Moody’s expects an uptick in corporate defaults and nonperforming loans this year as recession risks rise.
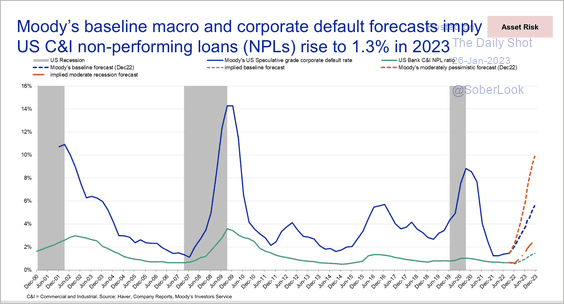 Source: Moody’s Investors Service
• History suggests US commercial and industrial loan net charge-offs will not peak until next year.
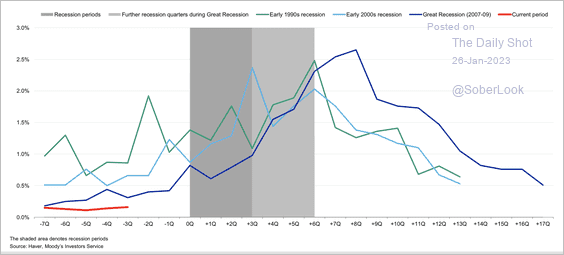 Source: Moody’s Investors Service
• Moody’s sees elevated commercial real estate (CRE) risks, although CRE concentration is not as high for large North American banks. This is more of a risk for US regional banks.
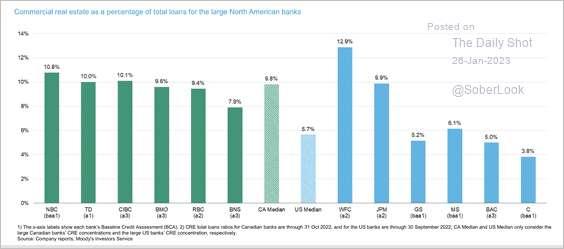 Source: Moody’s Investors Service
——————–
2. Fading bank reserves (due to QT) point to wider credit spreads ahead.
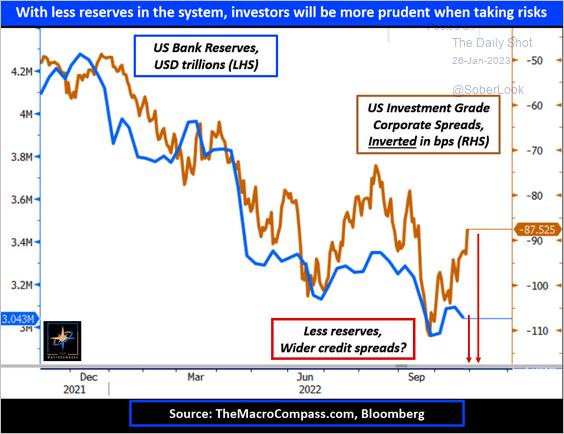 Source: @MacroAlf
Back to Index
Global Developments
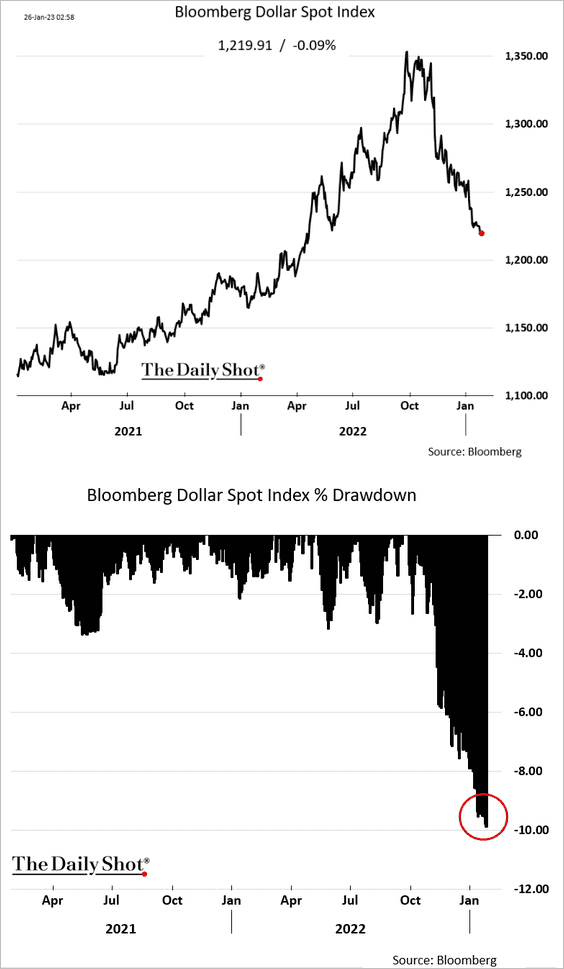
1. The US dollar is down about 10% from the recent high.
2. This chart shows Wells Fargo’s forecast for major DM central banks’ policy rates.
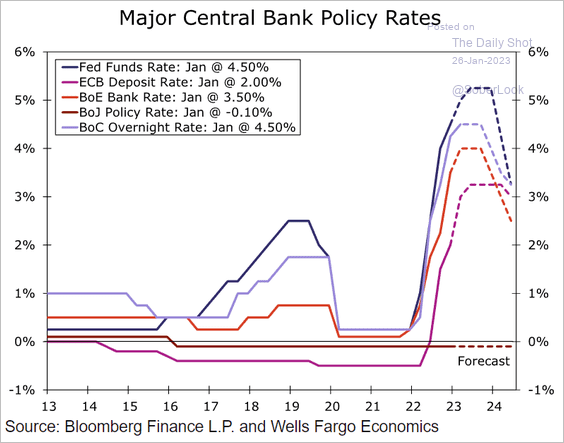 Source: Wells Fargo Securities
——————–
Food for Thought
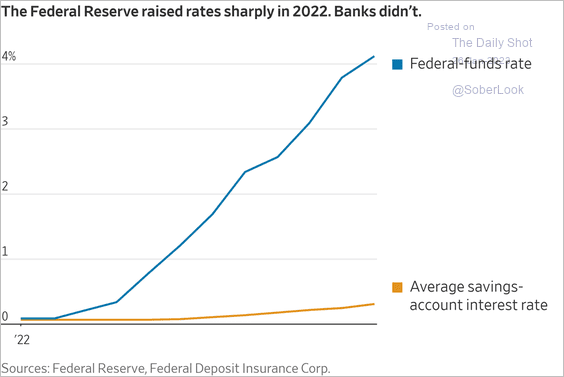
1. Fed rate hikes vs. savings-account rates:
 Source: @WSJ Read full article
2. Global shipping costs:
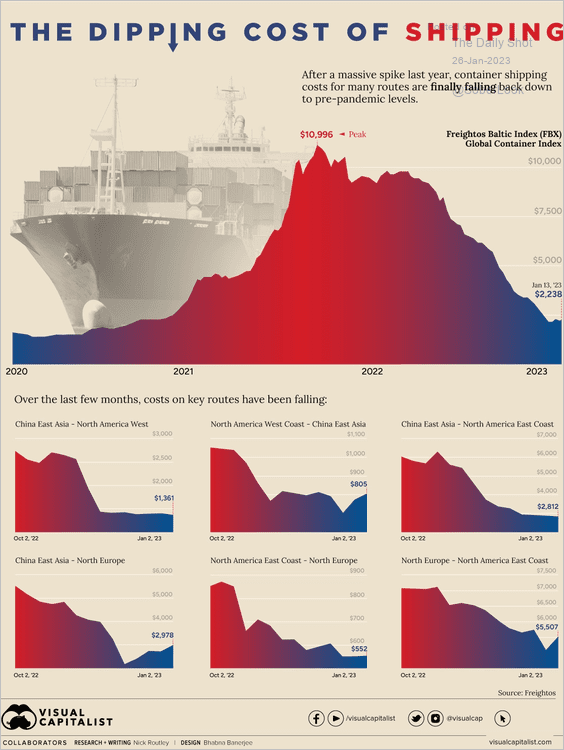 Source: Visual Capitalist, h/t Walter Read full article
3. The global GDP in 2022:
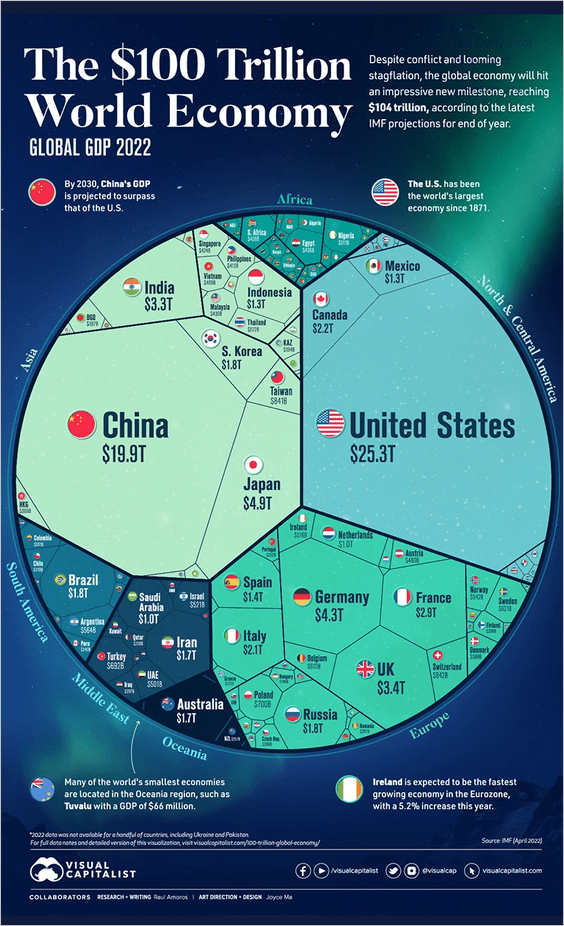 Source: Visual Capitalist Read full article
4. Online search activity for ChatGPT:
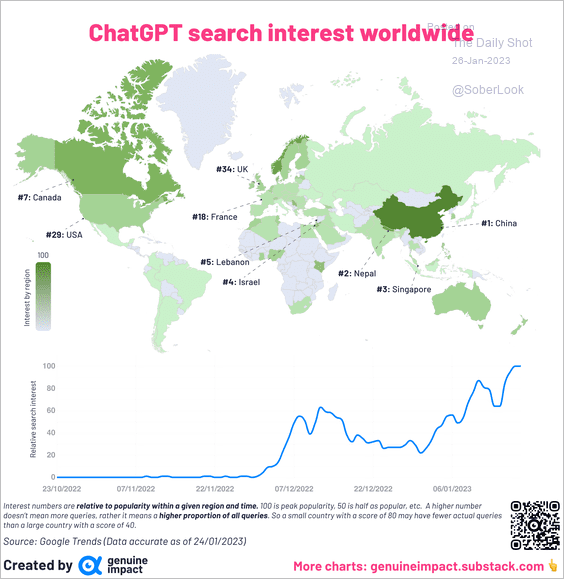 Source: @genuine_impact
5. Cloud computing sales growth:
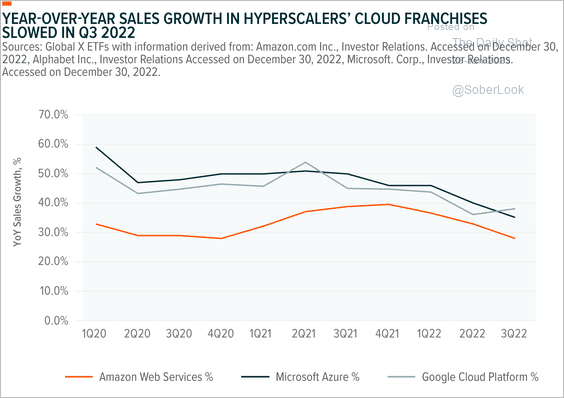 Source: Global X ETFs Read full article
6. The evolution of mobile phone market share (video):
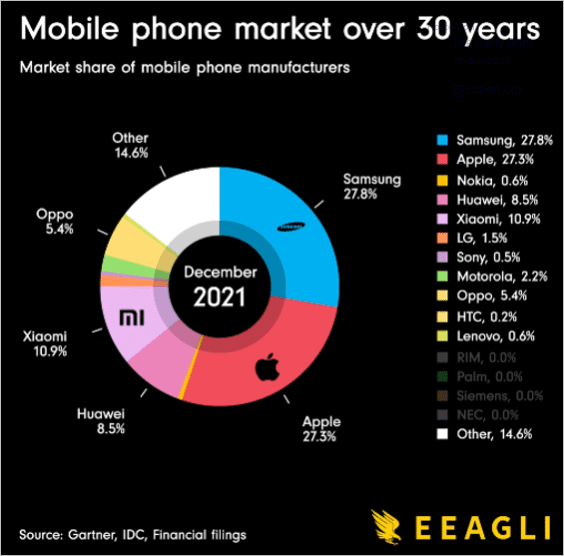 Source: Click here to play video
7. Disruptive science and technology papers and patents, over time:
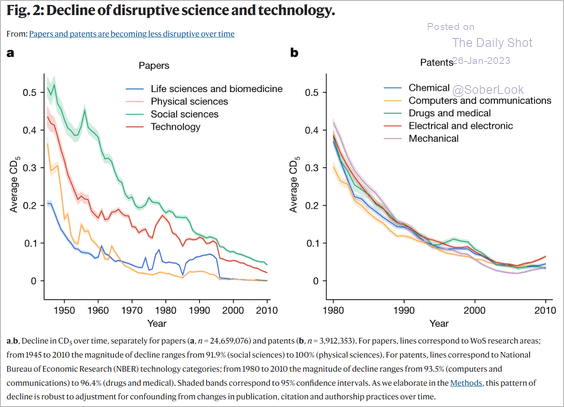 Source: Park, Leahey, Funk Read full article
8. The largest nuclear explosions:
![]() Source: Visual Capitalist Read full article
Source: Visual Capitalist Read full article
——————–
Back to Index