
The Daily Shot: 05-Jun-23
• The United States
• Canada
• The Eurozone
• Europe
• Asia-Pacific
• China
• Emerging Markets
• Cryptocurrency
• Commodities
• Energy
• Equities
• Credit
• Rates
• Global Developments
• Food for Thought
The United States
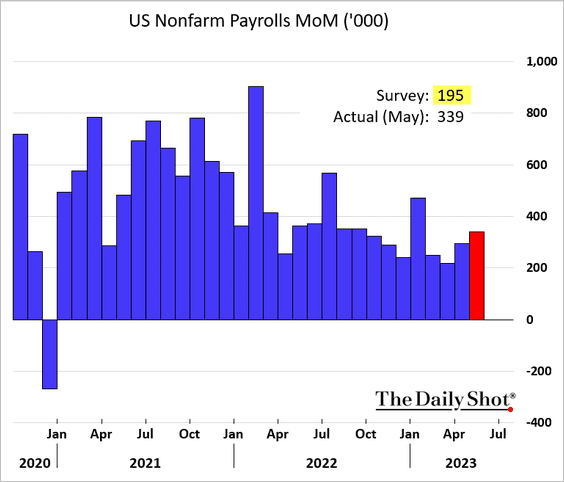
1. The May payrolls report topped expectations once again. Despite some dire predictions, hiring remains robust for now.
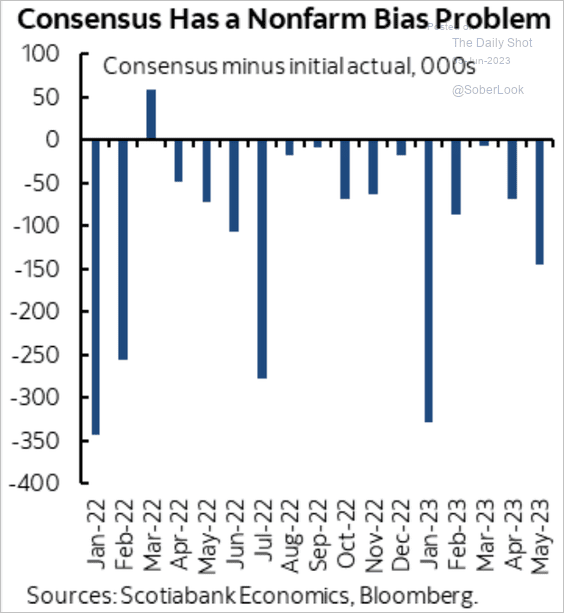
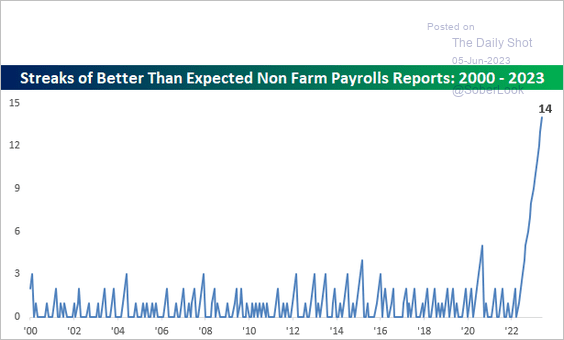
• Economists have consistently underestimated US employment gains (2 charts).
 Source: Scotiabank Economics
 Source: @bespokeinvest
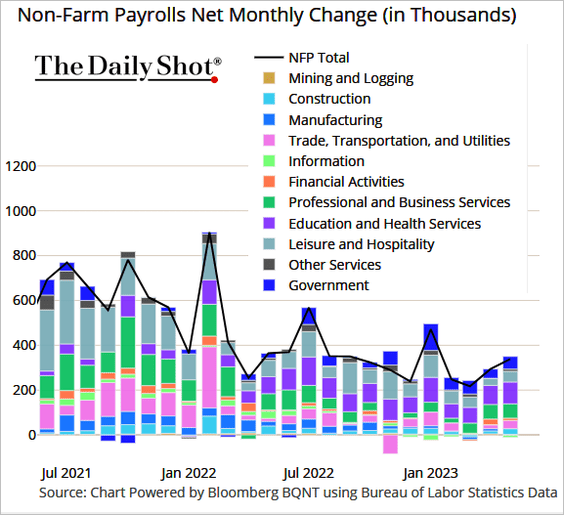
• Job creation was broad in May.
 Source: @TheTerminal, Bloomberg Finance L.P.
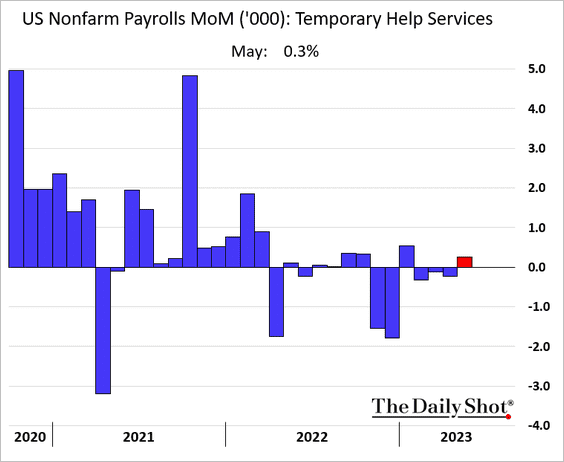
• After three months of declines, May saw an increase in temporary services employment, which often serves as a leading indicator.
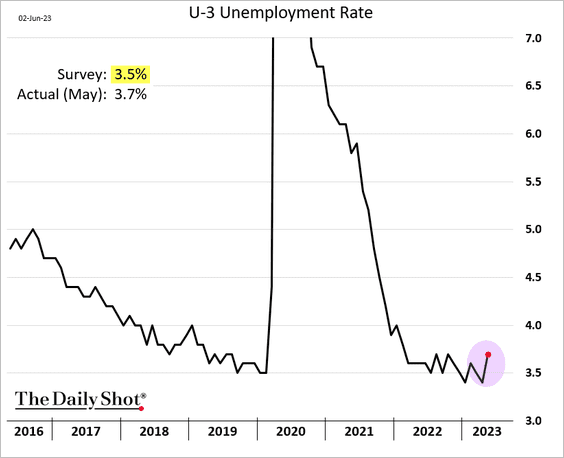
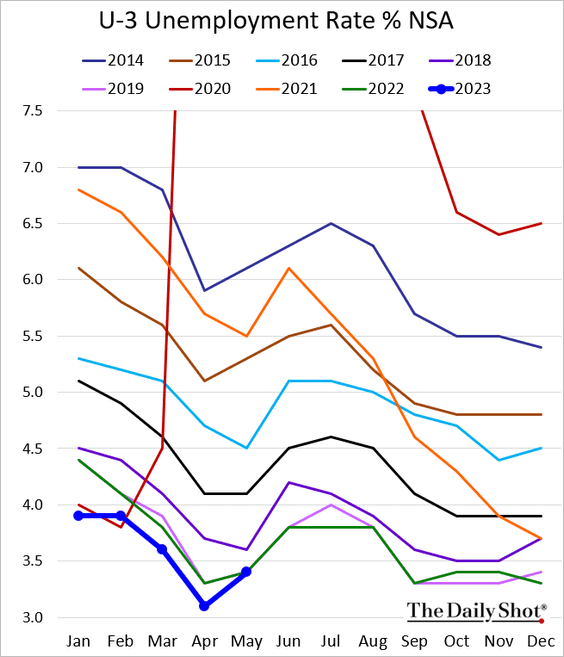
• However, the unemployment rate jumped last month (2 charts). This could be a sign of a looser labor market.
Removing the seasonal adjustments, the unemployment rate is back at 2022 levels.
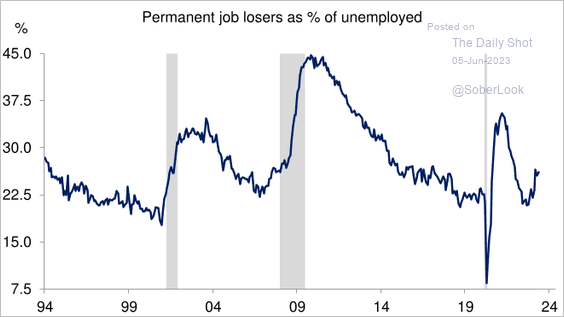
• Permanent employee share of job losses has been climbing.
 Source: Deutsche Bank Research
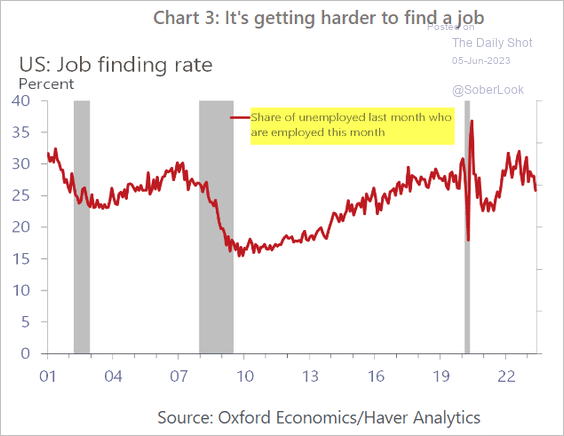
– The job finding rate has been rolling over.
 Source: Oxford Economics
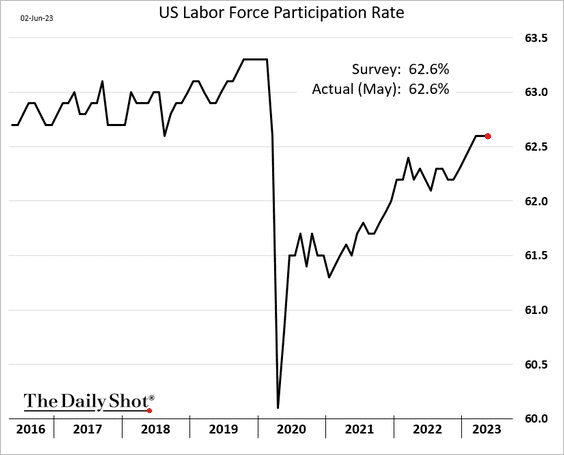
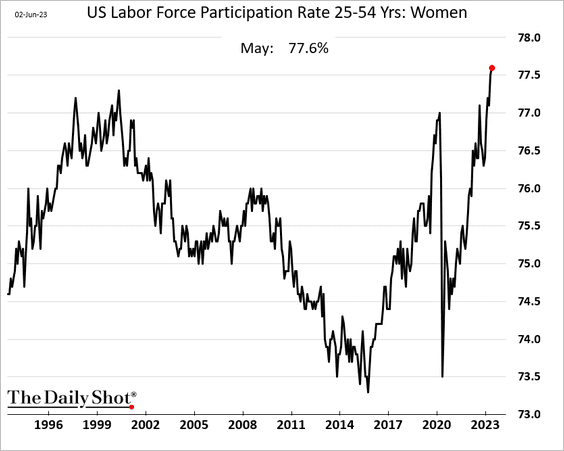
• Labor force participation was flat in May.
– But prime-age participation was the highest since January 2007.
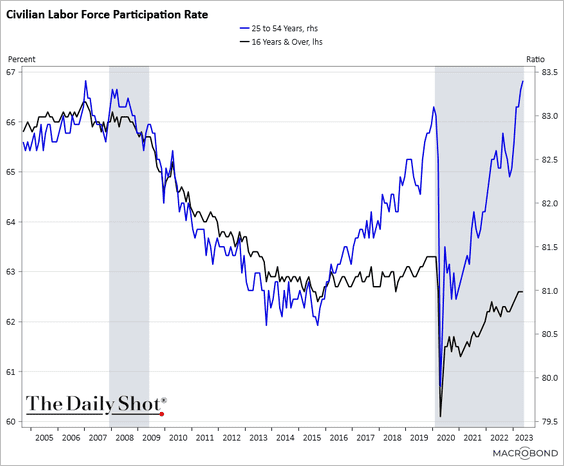
– Labor force participation among prime-age women hit a record high.
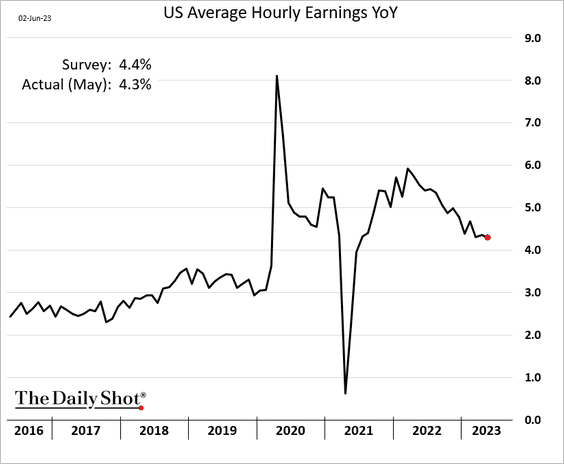
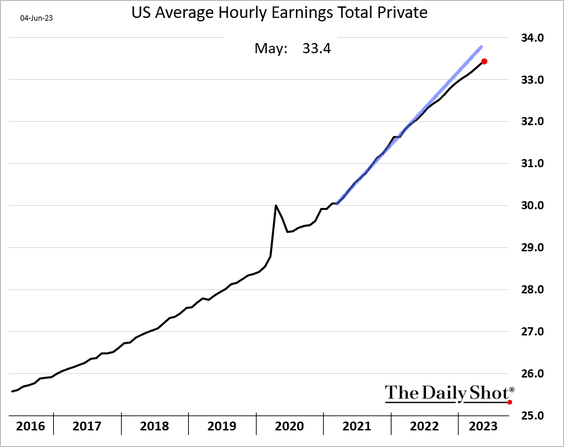
• Wage growth edged lower, further extending the ongoing downtrend.
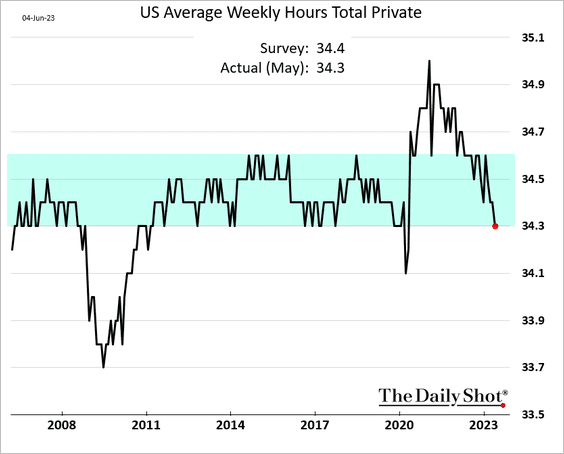
• Hours worked reached the low end of the pre-COVID range. This is another indication of easing labor market imbalances.
• The Household Survey revealed a decline in job numbers during the month of May (2 charts). Note that the Household Survey is an alternative measure to the Establishment Survey that provides the official employment figures.
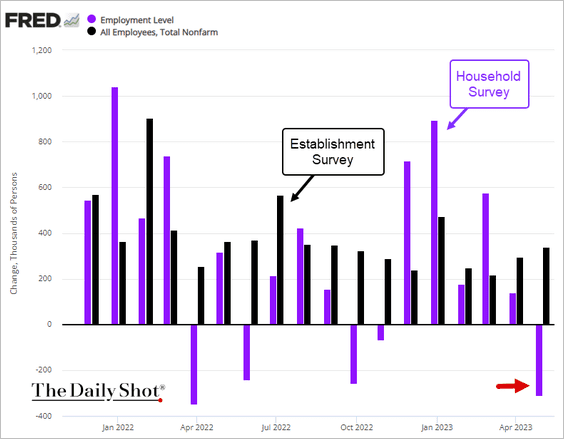
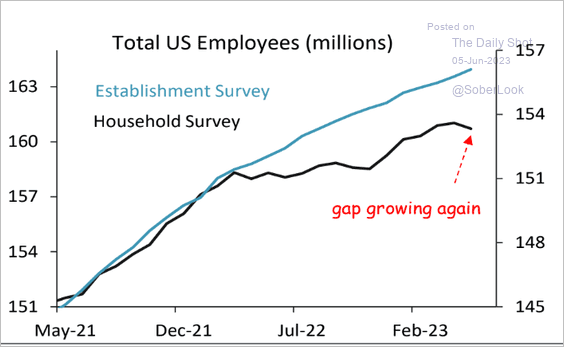 Source: Piper Sandler
The primary factor contributing to this discrepancy was the inclusion of self-employed workers, who were not captured in the Establishment Survey.
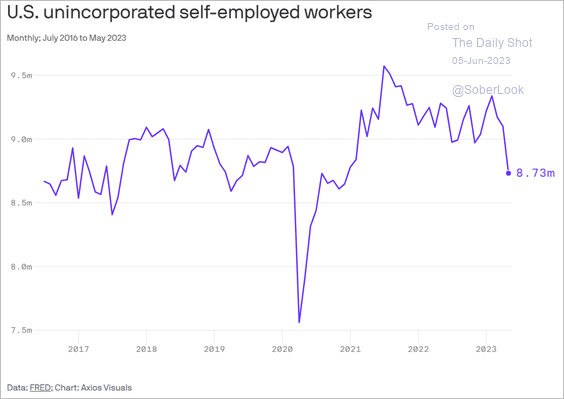 Source: @axios Read full article
——————–
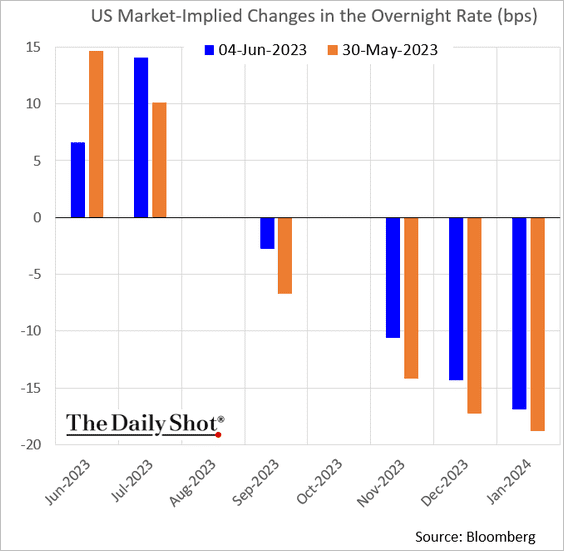
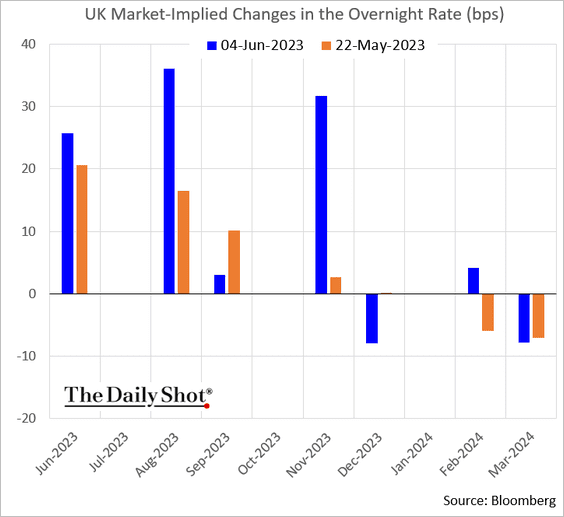
2. There were enough signals in the employment report to give the Fed cover to forego a rate hike in June. Market-based rate hike expectations are being pushed into July.
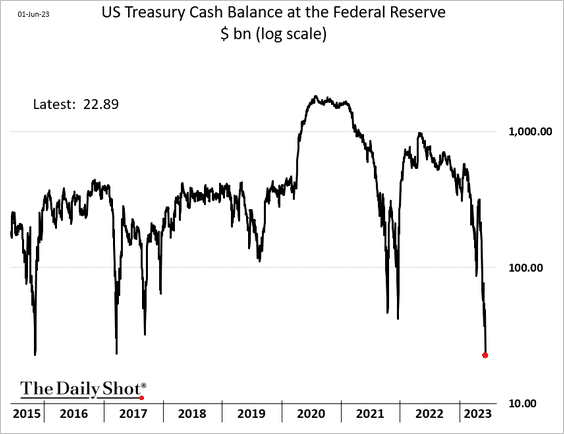
3. The debt ceiling increase arrived at a pivotal moment, with the US Treasury’s cash balances hitting their lowest level since 2015 last week.
Back to Index
Canada
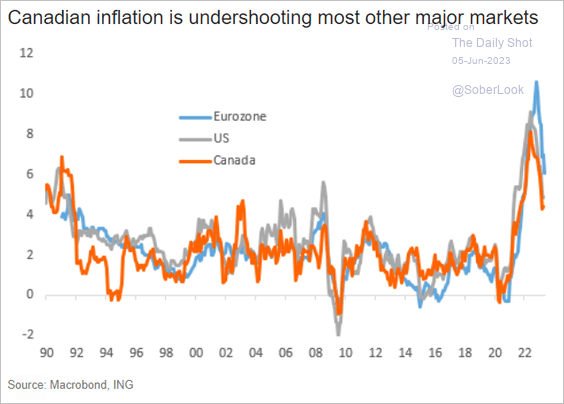
1. Canada’s inflation is running below that of the US and the Eurozone.
 Source: ING
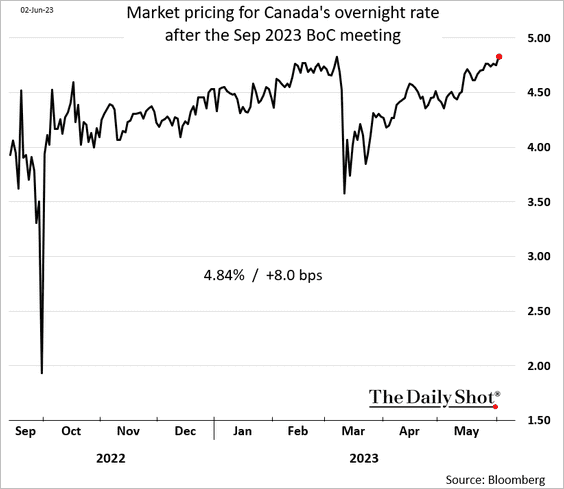
2. The market expects the overnight rate to hit 4.84% in September, a new high.
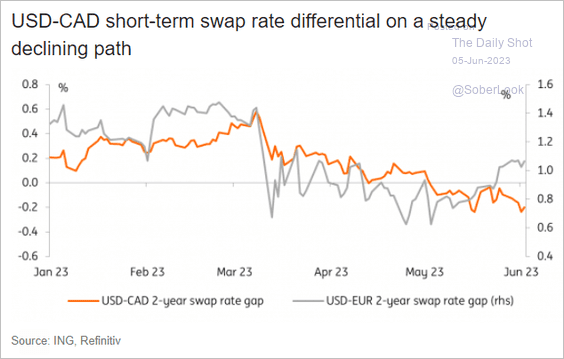
3. The US-Canada 2-year rate differential has been trending lower.
 Source: ING
Back to Index
The Eurozone
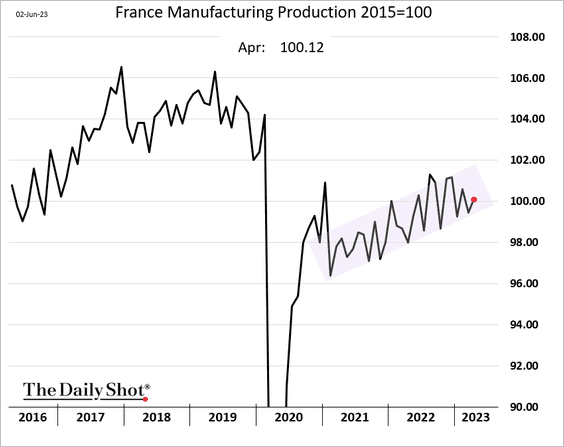
1. French manufacturing output continues to trend higher.
2. Economic indicators in the Eurozone point to a supportive backdrop for bonds.
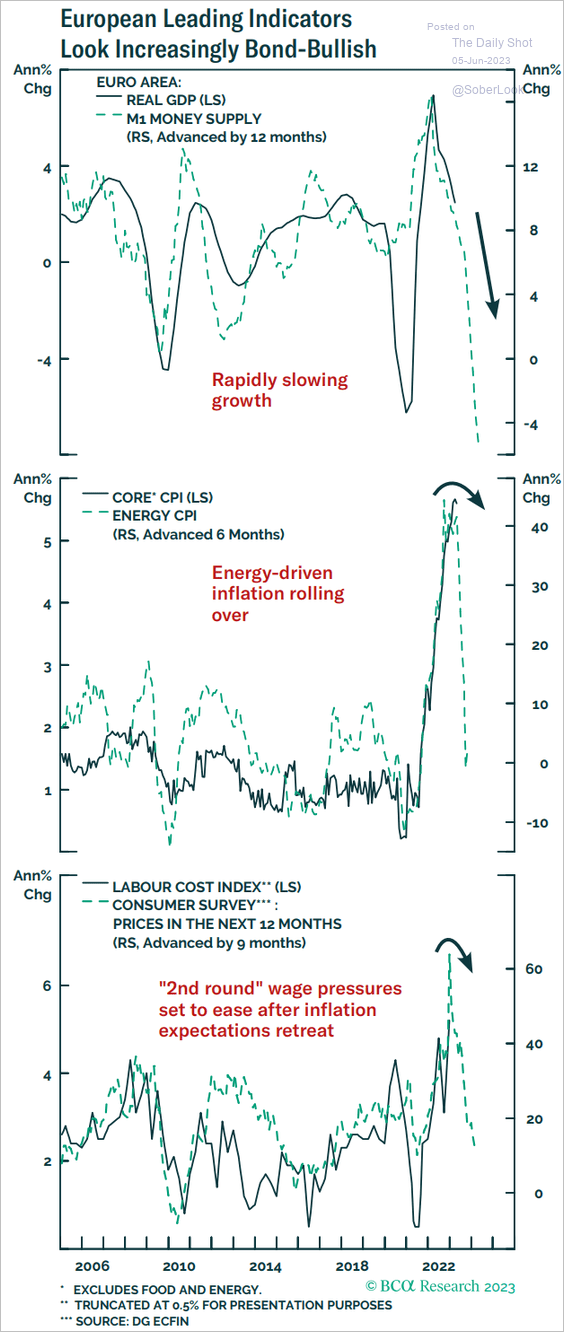 Source: BCA Research
3. Eurozone firms have higher levels of short-term debt (as % of total debt) than their US counterparts.
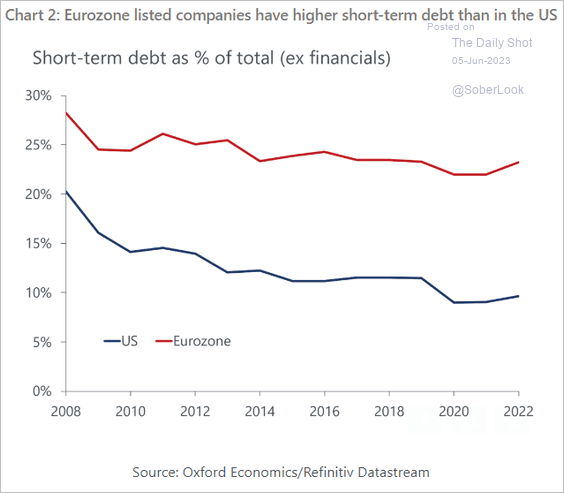 Source: Oxford Economics
Back to Index
Europe
1. The market continues to price at least three more BoE rate hikes in this cycle.
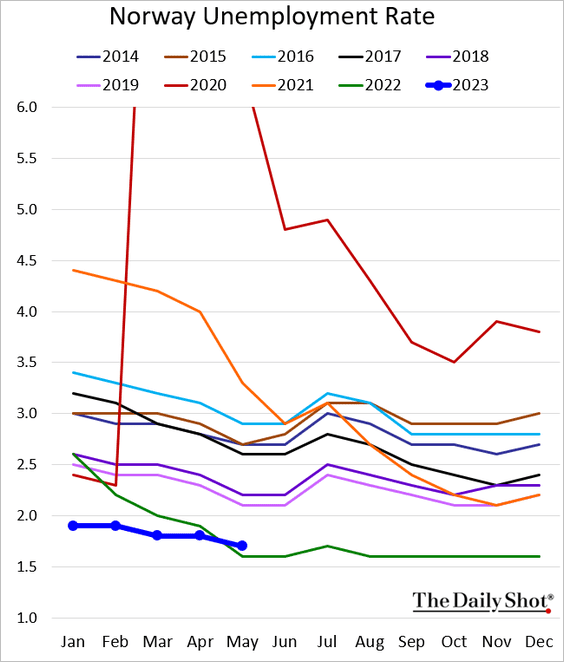
2. Norway’s unemployment rate remains very low, but it moved above last year’s level in May.
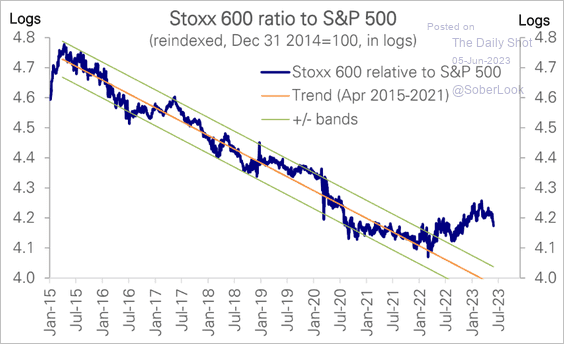
3. The Stoxx 600 outperformance vs. the S&P 500 is fading.
 Source: Deutsche Bank Research
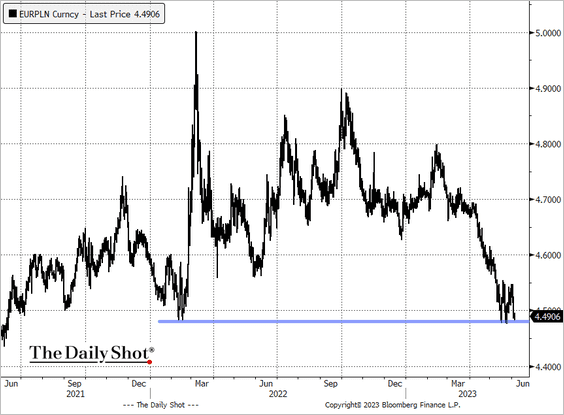
4. EUR/PLN (Polish zloty) is at support (chart shows weaker euro; stronger zloty).
 Source: @TheTerminal, Bloomberg Finance L.P.
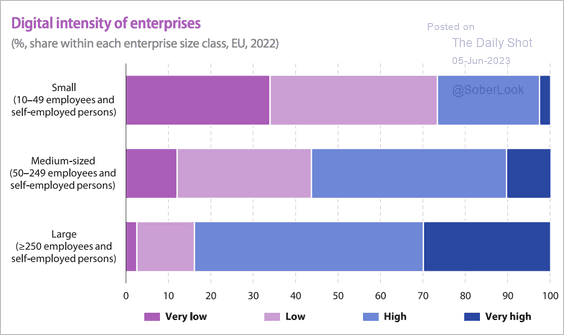
5. Finally, we have business digital intensity in the EU.
 Source: Eurostat Read full article
Back to Index
Asia-Pacific
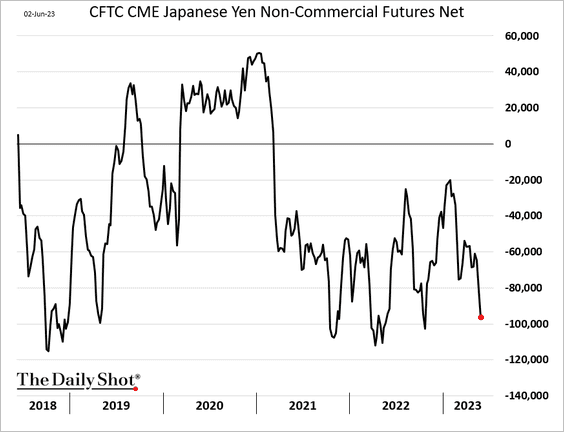
1. Speculative accounts have been boosting their bets against the yen.
2. This chart shows ING’s CPI forecast for South Korea.
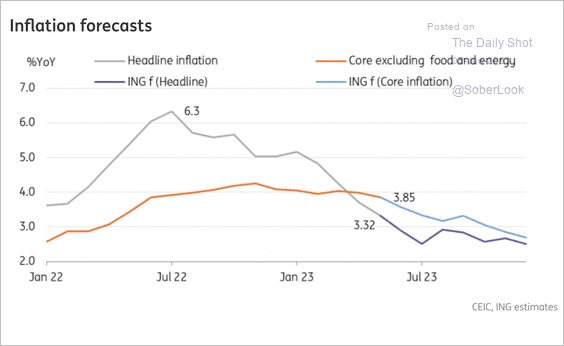 Source: ING
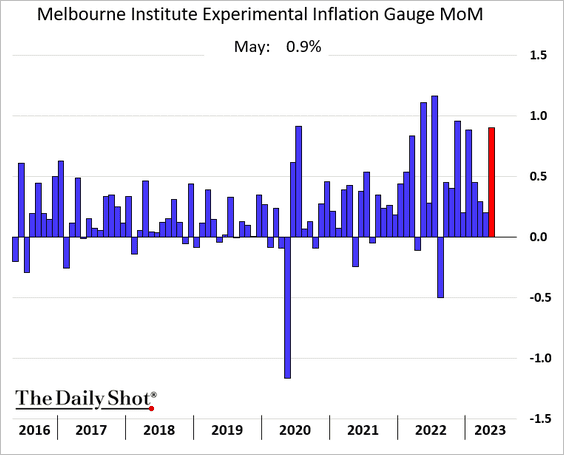
3. Australia’s inflation indicator rose sharply in May.
Back to Index
China
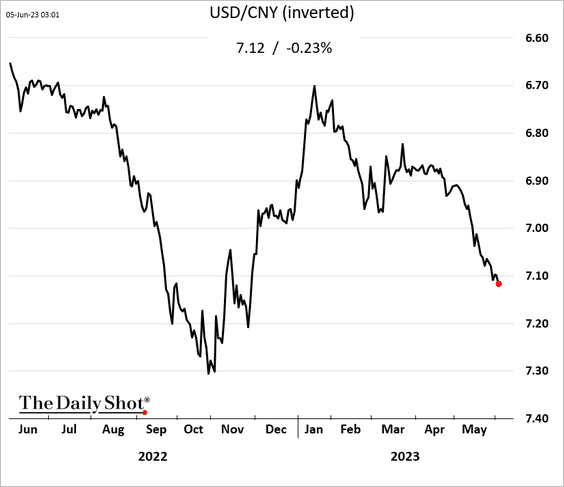
1. The renminbi continues to weaken vs. USD.
2. Economic growth has fallen short of expectations.
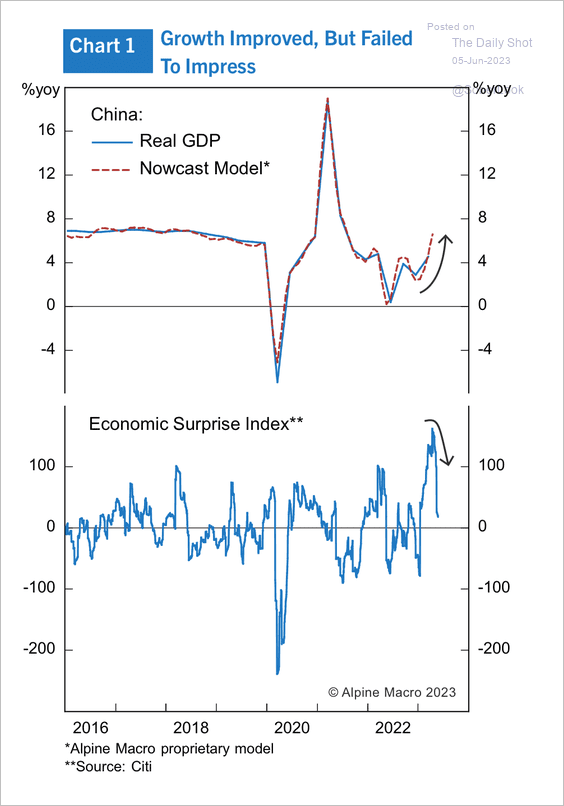 Source: Alpine Macro
3. Survey data point to improving earnings.
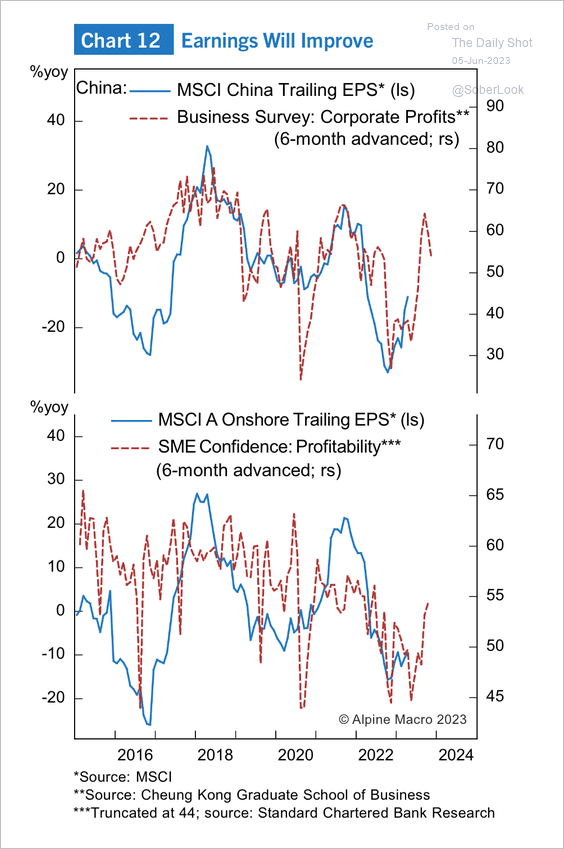 Source: Alpine Macro
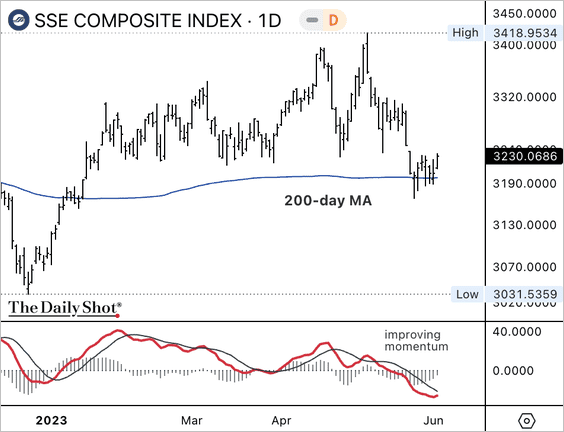
4. The Shanghai Composite held support at its 200-day moving average.
5. Hong Kong’s business activity growth is stalling.
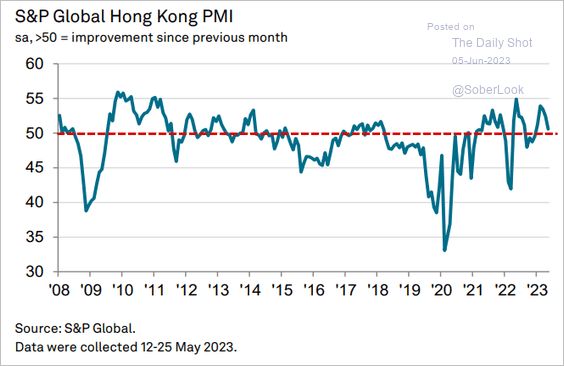 Source: S&P Global PMI
Back to Index
Emerging Markets
1. The Turkish lira continues to tumble, breaching 21 to the dollar.
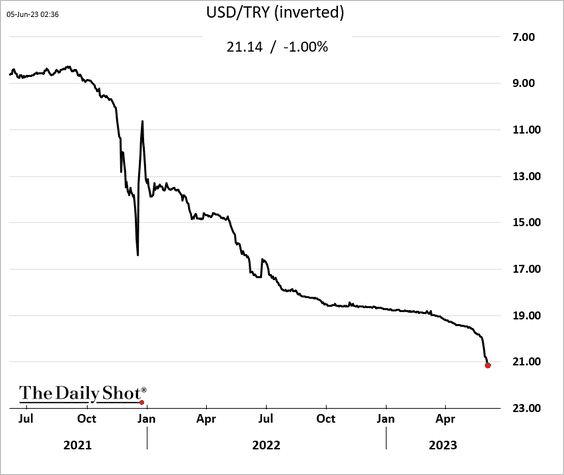
• Simsek is back, but will he have the autonomy to implement “sane” policies for Turkey’s economy?
 Source: Reuters Read full article
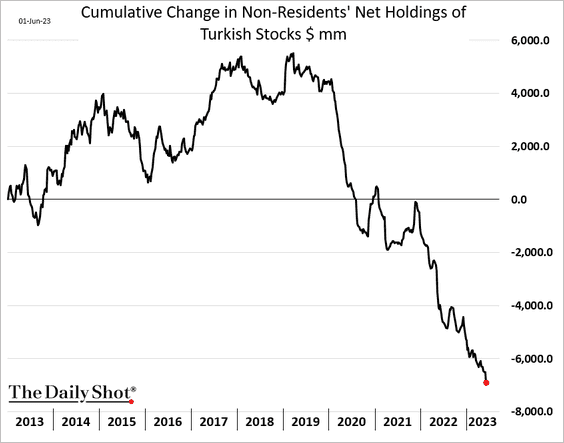
• Foreigners continue to dump Turkish stocks.
——————–
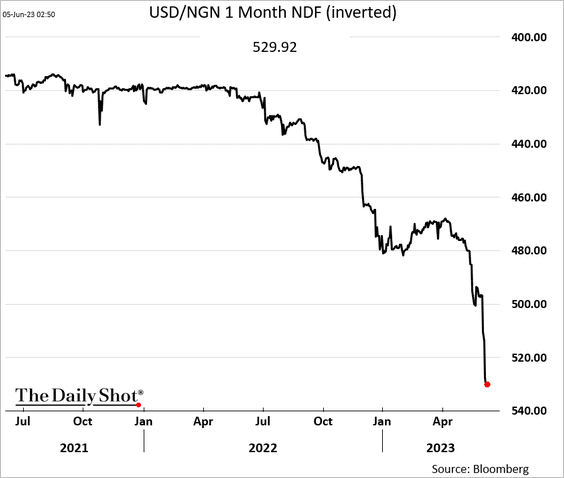
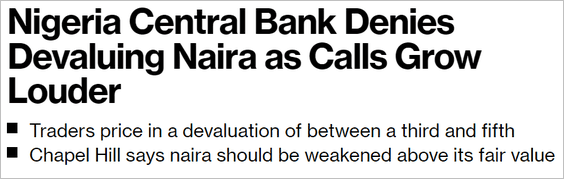
2. The market is pricing in a sharp devaluation in the Nigerian naira. Here is the one-month forward contract.
 Source: @Emeleonu, @markets Read full article
——————–
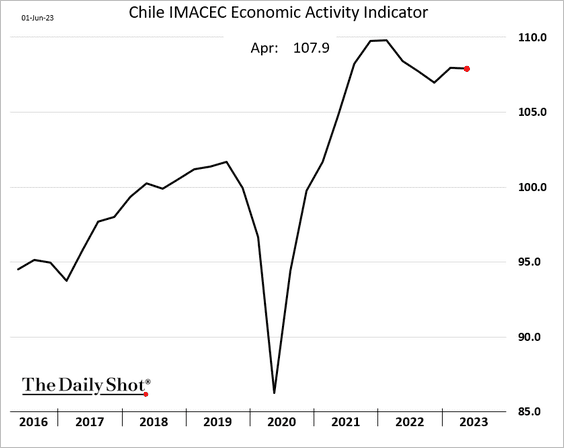
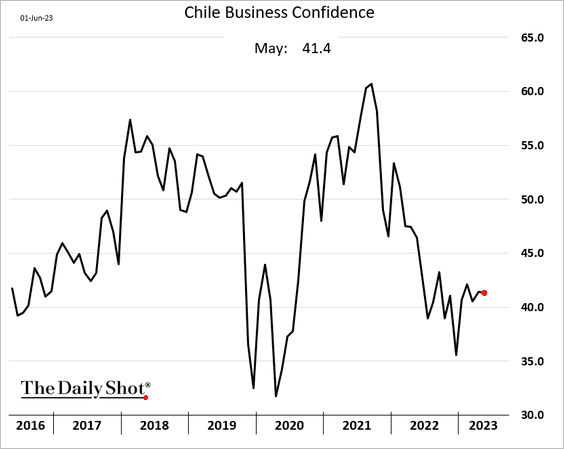
3. Next, we have some updates on Chile.
• Economic activity (steady in April):
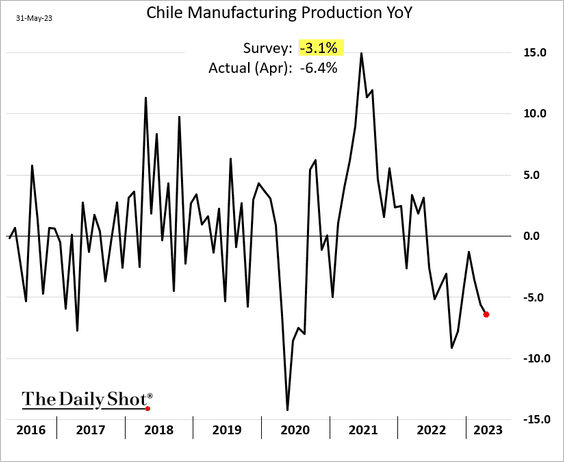
• Industrial production (below forecasts):
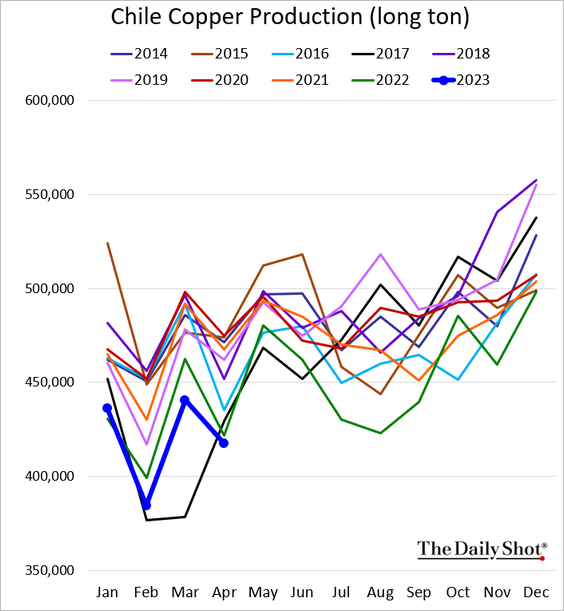
• Copper production (multi-year lows):
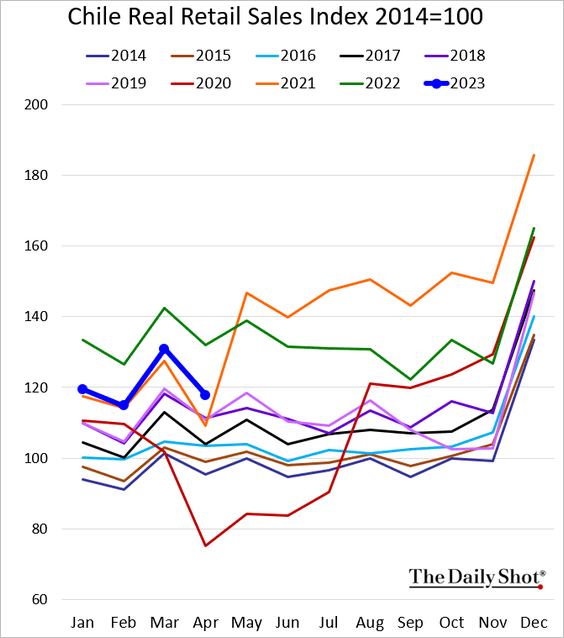
• Retail sales (well below last year’s levels):
• Business confidence:
——————–
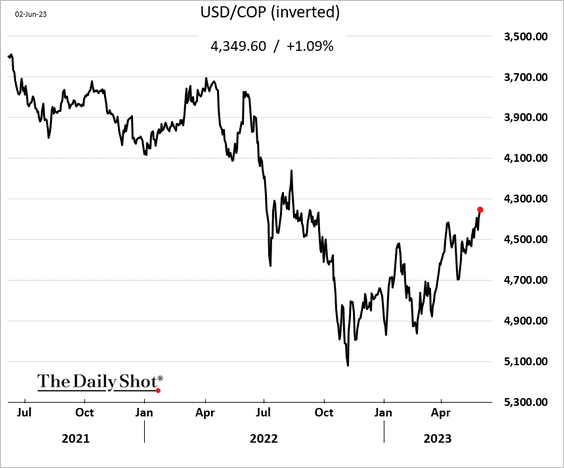
4. The Colombian peso has been rebounding.
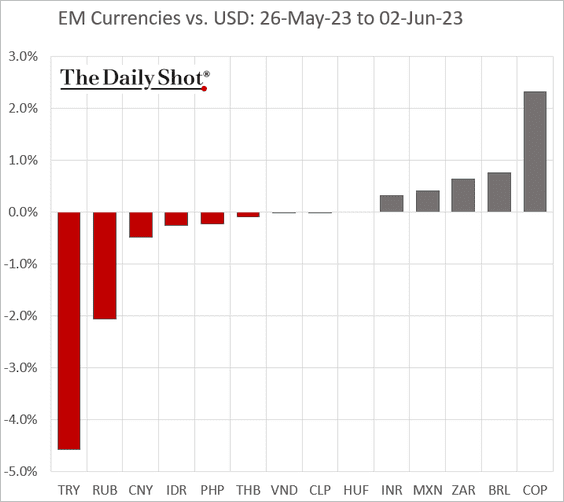
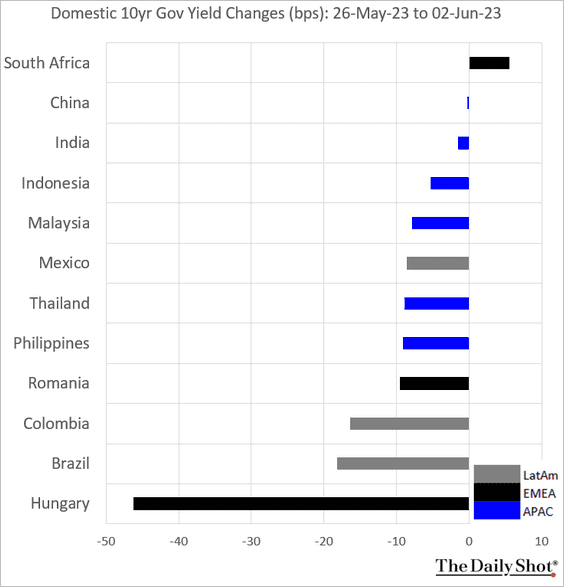
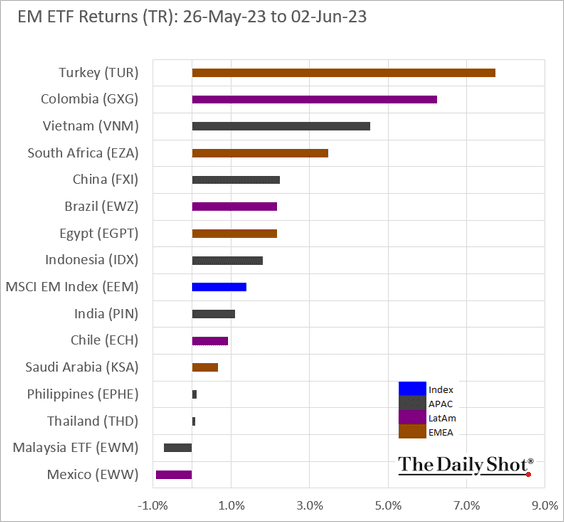
5. Next, we have some performance data from last week.
• Currencies:
• Bond yields:
• Equity ETFs:
Back to Index
Cryptocurrency
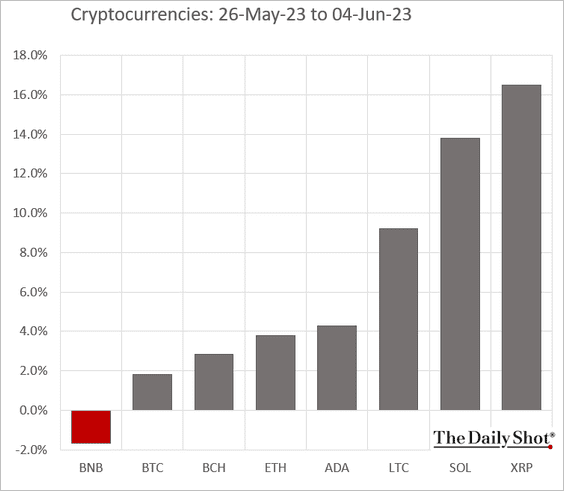
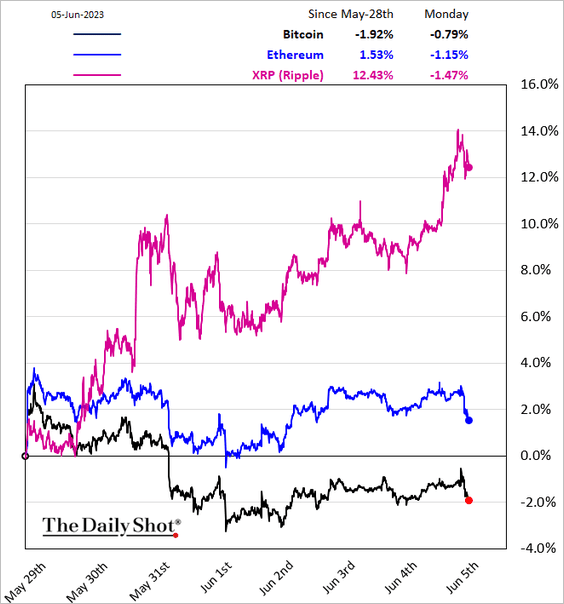
1. XRP outperformed sharply last week.
——————–
2. Decentralized finance (DeFi) tokens outperformed over the past week, while the digitization sector underperformed.
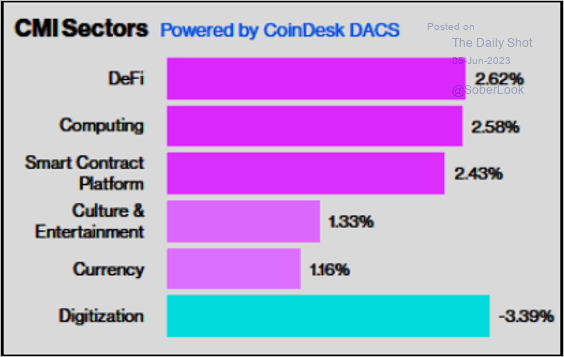 Source: CoinDesk Read full article
3. Exchange inflows among major cryptos are near cycle lows, possibly indicating less intention to sell tokens among traders (moving from wallet storage to exchanges).
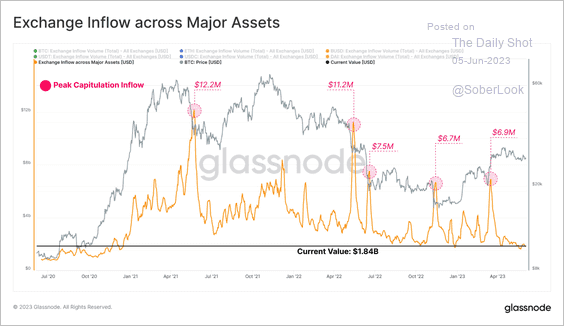 Source: @glassnode
4. While BTC and ETH exhibit the highest correlations, lesser-known tokens have varying correlations, which could assist with crypto portfolio diversification.
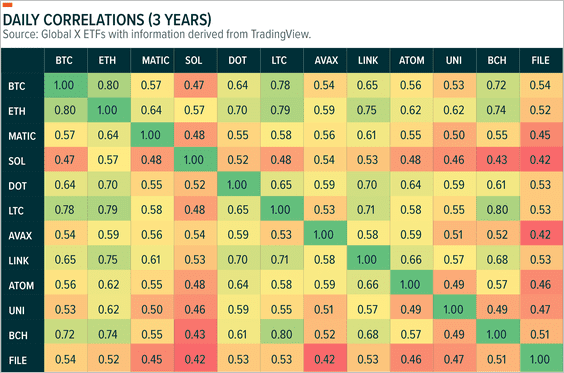 Source: Global X ETFs Read full article
The crypto market is subject to rotations in performance leadership.
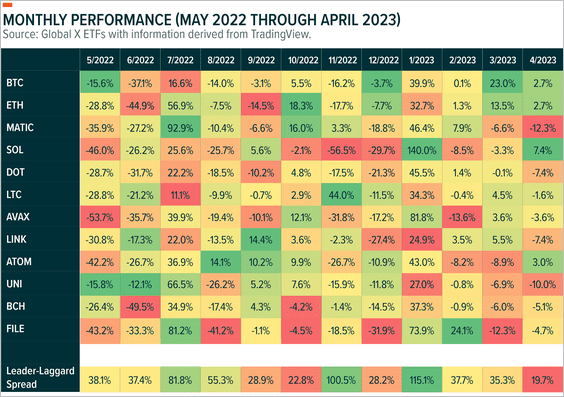 Source: Global X ETFs Read full article
——————–
5. Bitcoin’s liquidity has been running below last year’s levels.
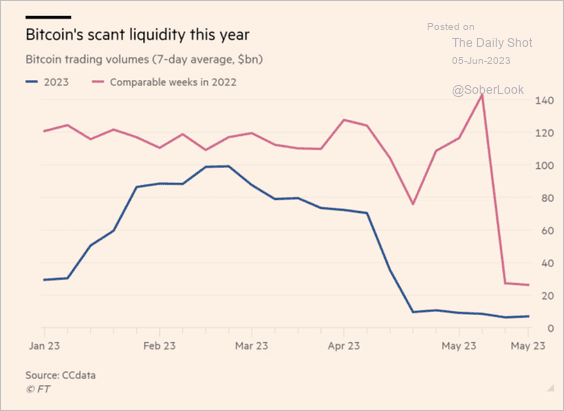 Source: @financialtimes Read full article
6. Binance’s share of the crypto market has been falling.
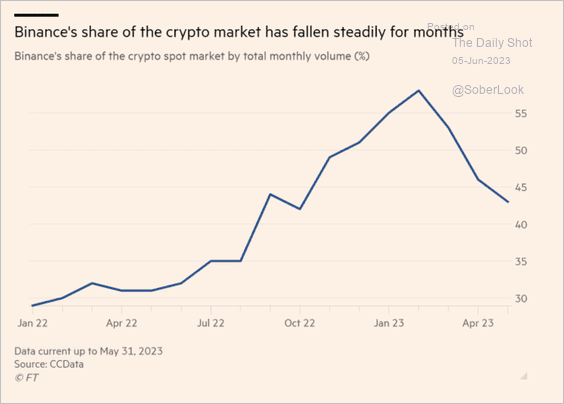 Source: @financialtimes Read full article
Back to Index
Commodities
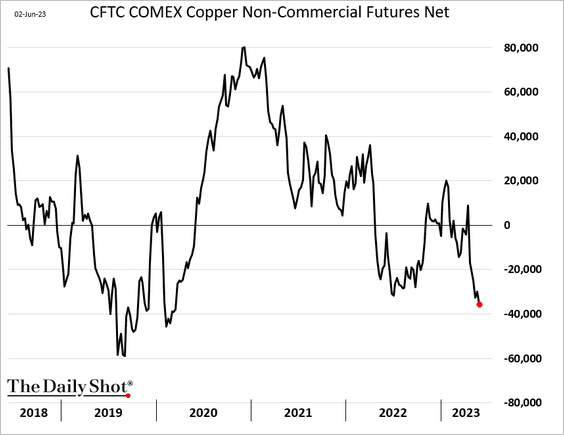
1. Speculative accounts continue to boost their bets against copper.
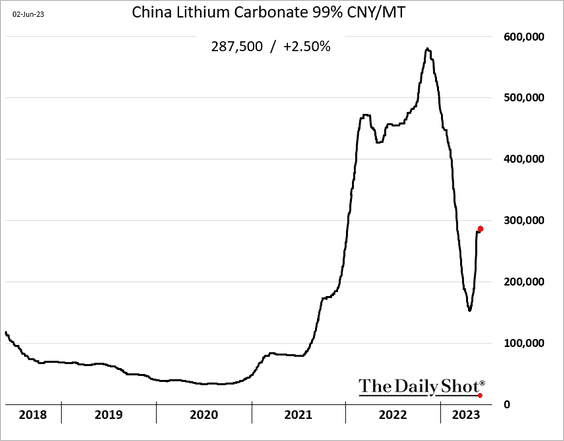
2. Lithium carbonate prices have been rebounding.
3. Who are China’s largest corn suppliers?
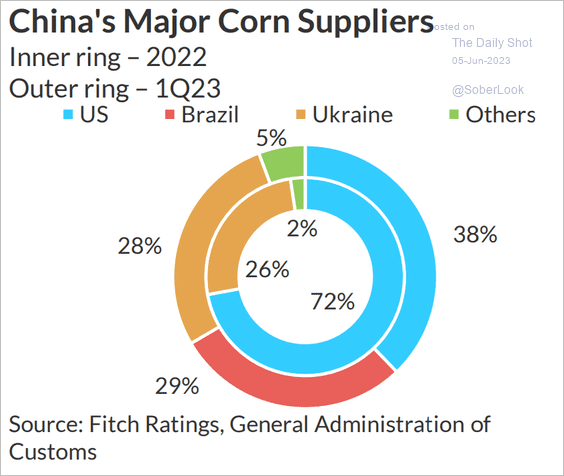 Source: Fitch Ratings
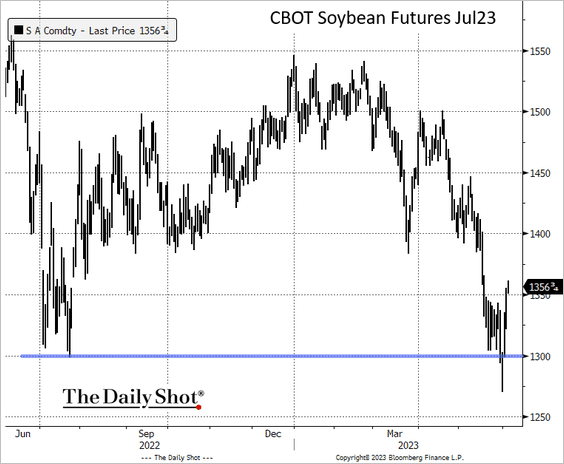
4. Soybean futures bounced from the lows last week and are higher again this morning.
5. US beef production is expected to fall next year.
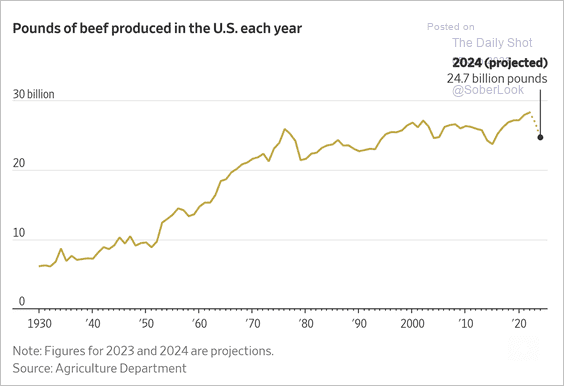 Source: @WSJ Read full article
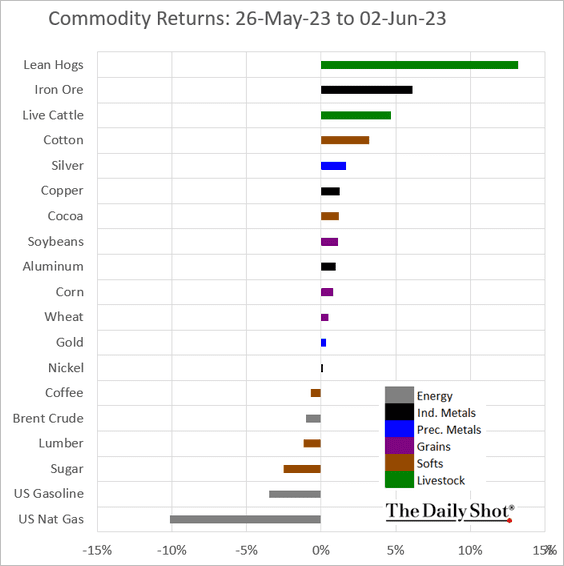
6. Finally, we have last week’s performance across key commodity markets.
Back to Index
Energy
1. The Saudis decided to cut output without Russia’s support.
 Source: @WSJ Read full article
Oil prices jumped.
——————–
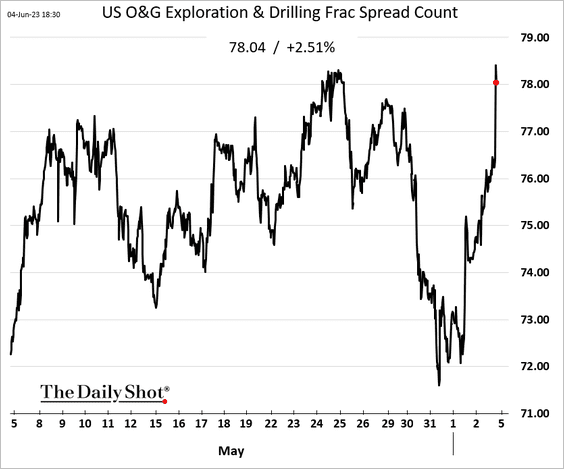
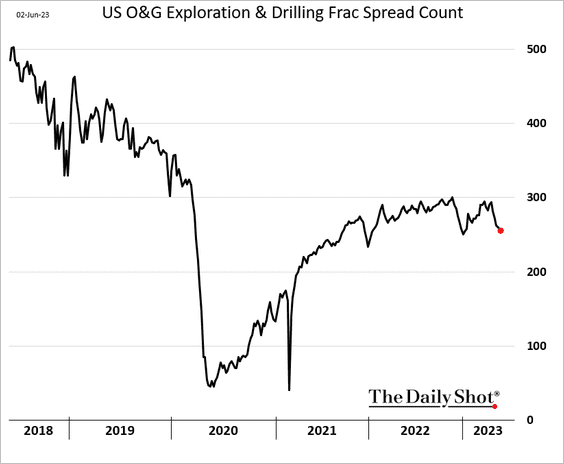
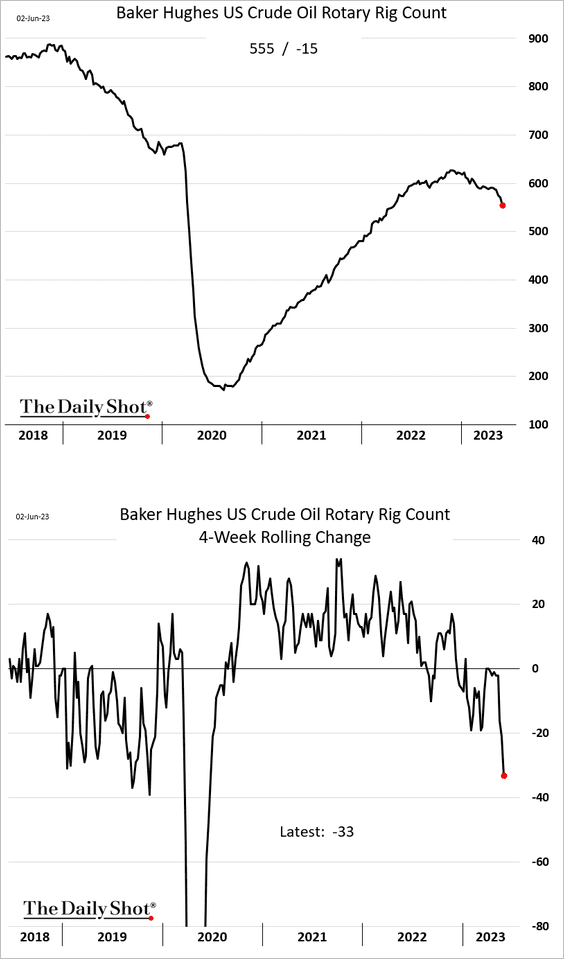
2. US drilling activity continues to deteriorate.
• Frac spread count:
• Oil rig count:
Back to Index
Equities
1. More pressure on earnings ahead?
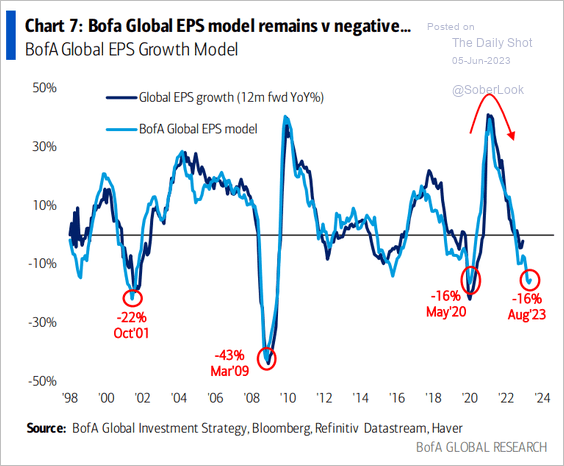 Source: BofA Global Research
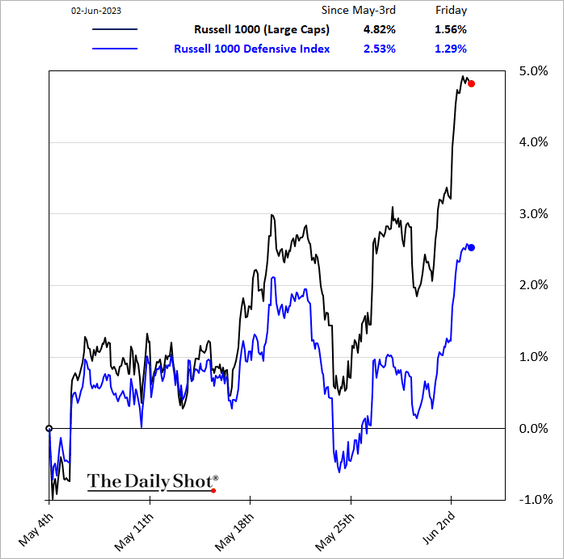
2. Defensives have been lagging.
3. Deutsche Bank’s consolidated equity positioning indicator is near neutral levels.
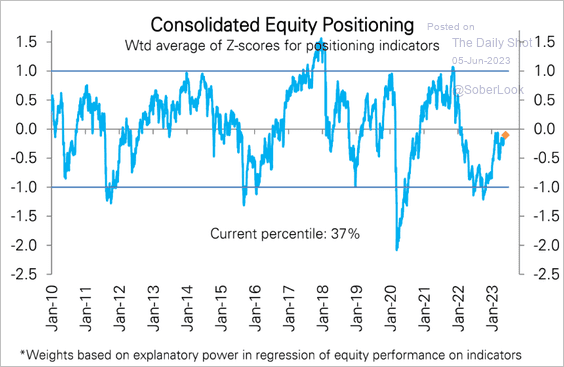 Source: Deutsche Bank Research
Money market ETFs have been reporting outflows.
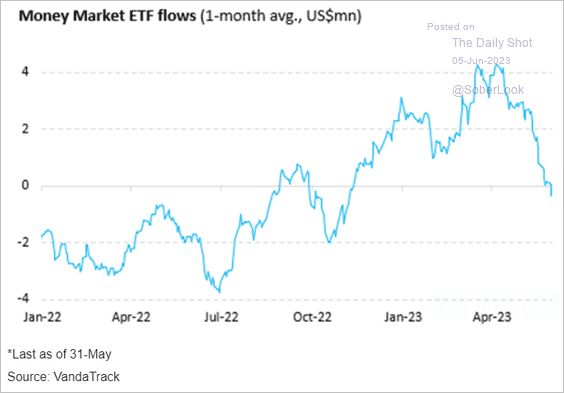 Source: Vanda Research
——————–
4. Globally, capital-scarce companies (energy, shipping, and some LatAm stocks) have outperformed capital-abundant companies (US software and entertainment stocks) over the past year.
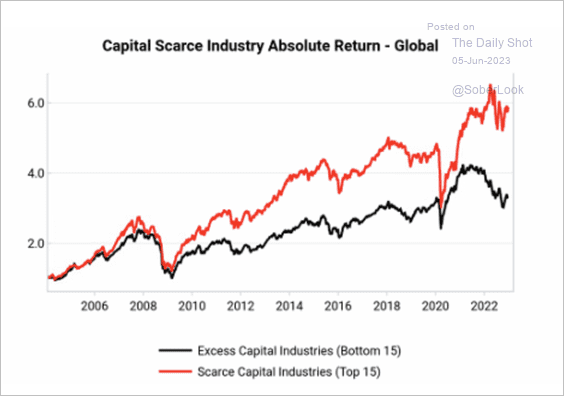 Source: Variant Perception
Variant Perception expects US bank stocks to struggle amid a downward capital cycle, driven by rising loan loss provisions and falling return on equity.
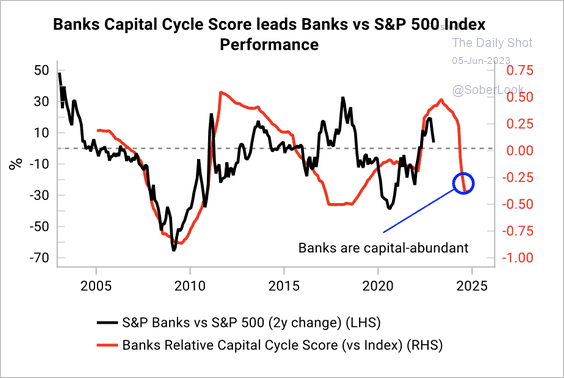 Source: Variant Perception
——————–
5. Next, we have detailed equity factor performance over the past five weeks (ending last Friday).
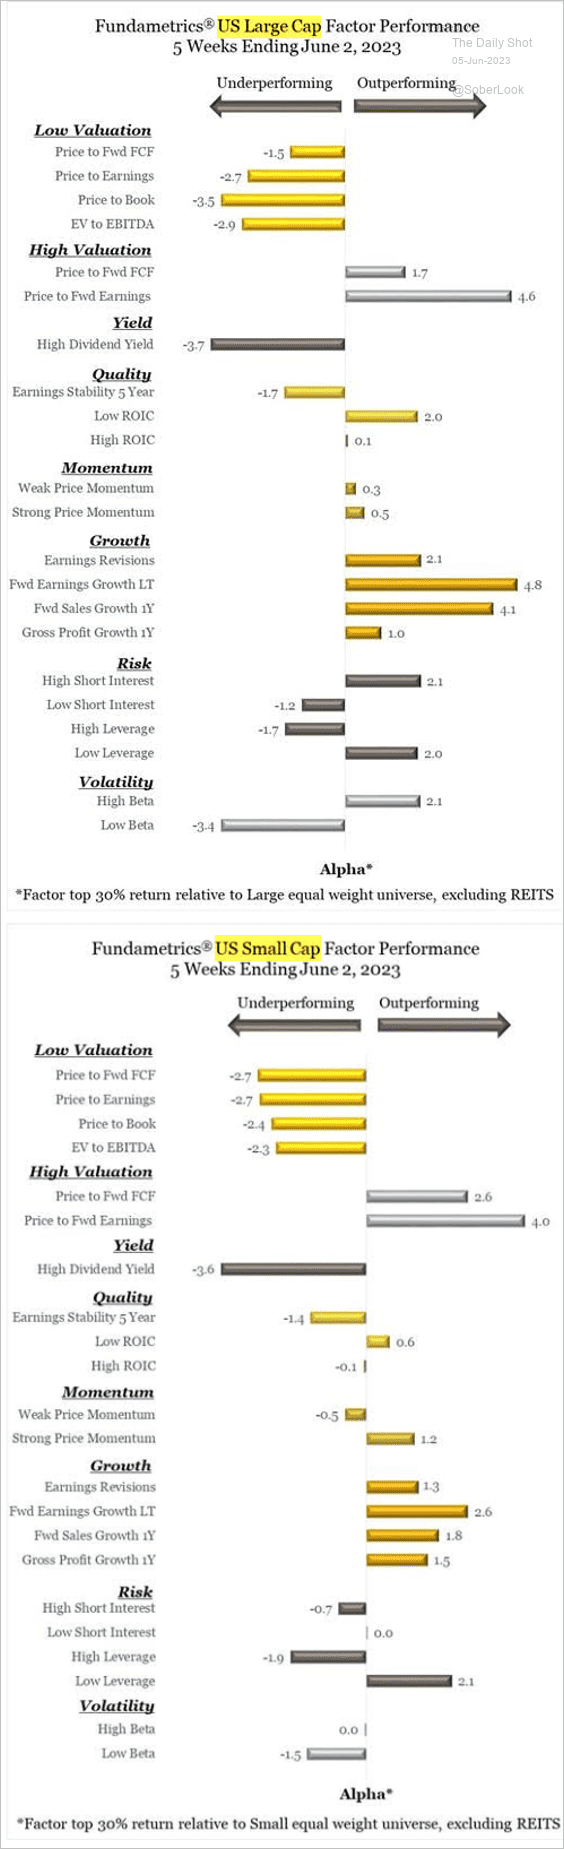 Source: CornerCap Institutional
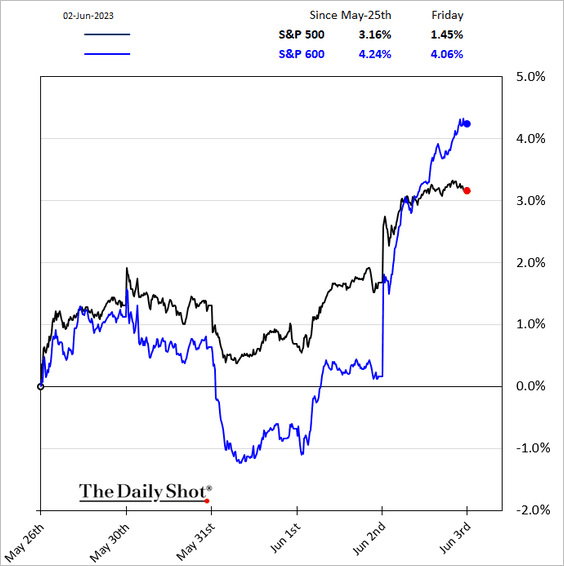
6. Small caps outperformed on Friday.
• Breadth among US small-caps is improving.
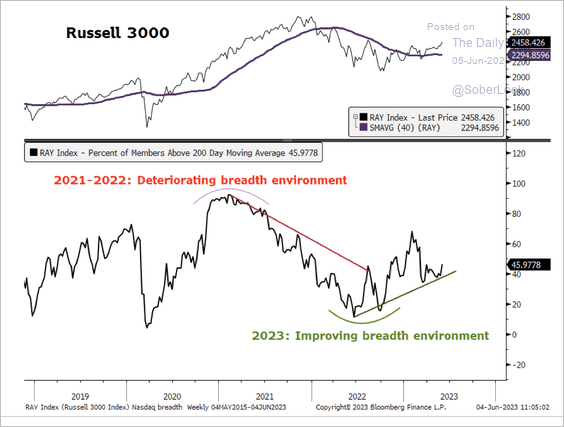 Source: Aazan Habib, Paradigm Capital
• Small caps outside of the US have been rebounding.
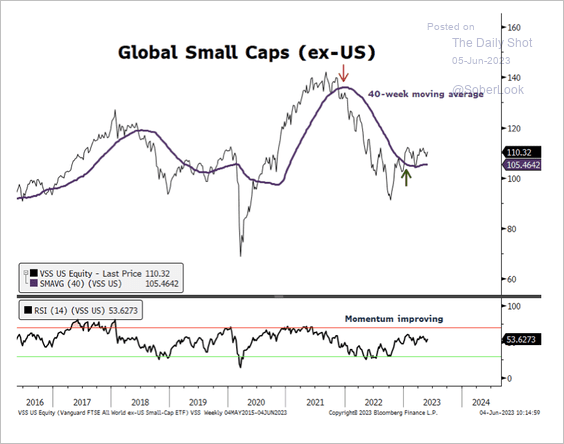 Source: Aazan Habib, Paradigm Capital
——————–
7. Below are some updates on the volatility markets.
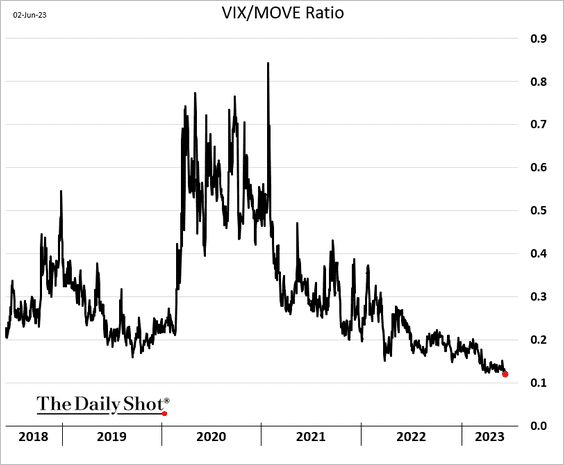
• VIX hit a COVID-era low, …
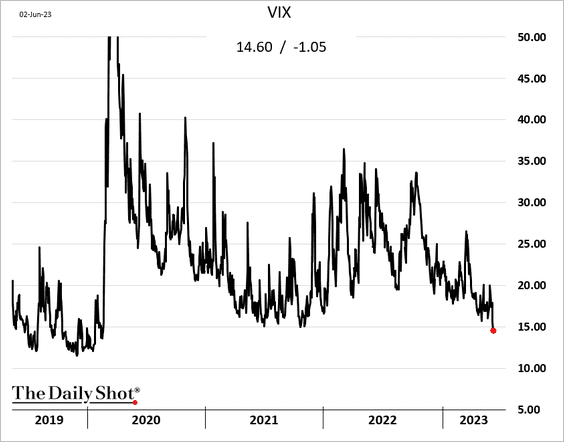
… further disconnecting from rates vol (MOVE).
• Market skew declined sharply last week, …
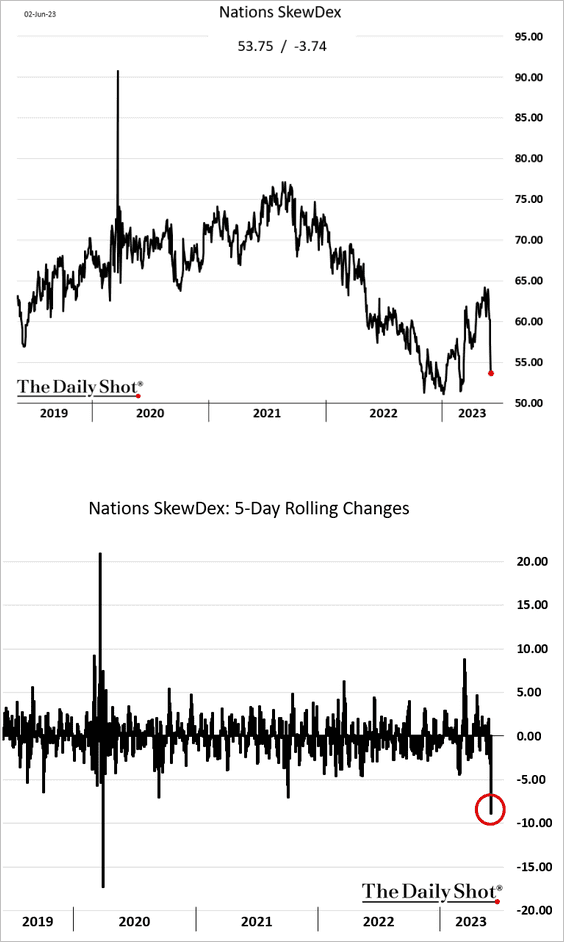
… as investors boosted bullish options strategies, …
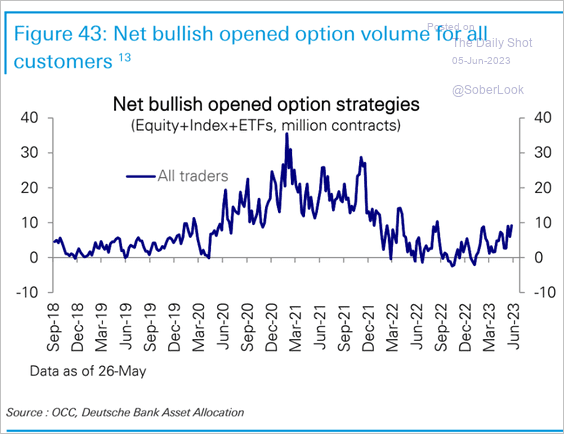 Source: Deutsche Bank Research
… especially in tech.
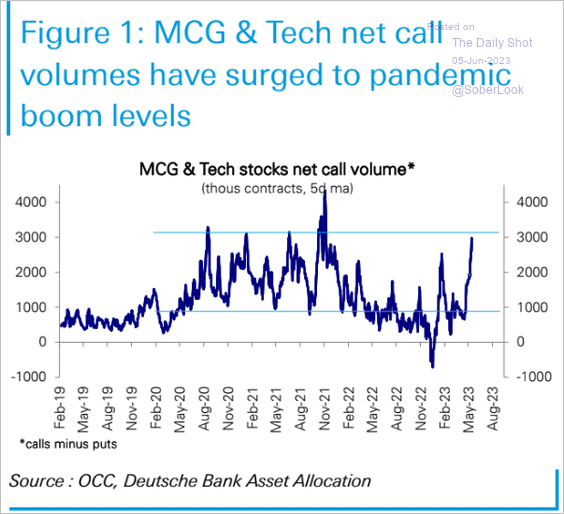 Source: Deutsche Bank Research
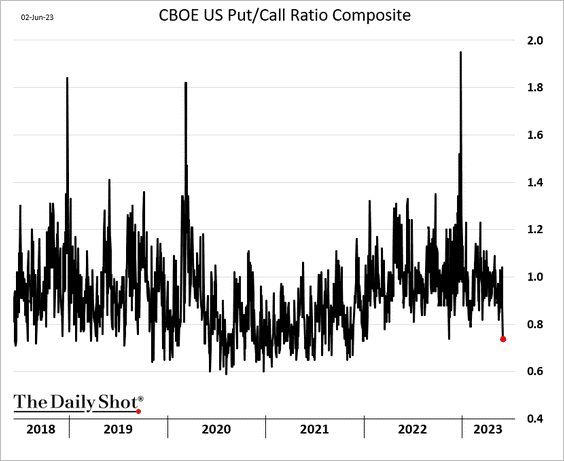
• Here is the put/call ratio.
——————–
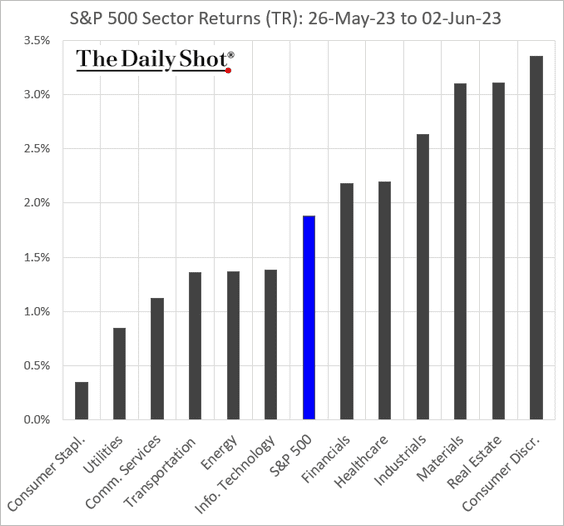
7. Finally, we have some performance data from last week.
• Sectors:
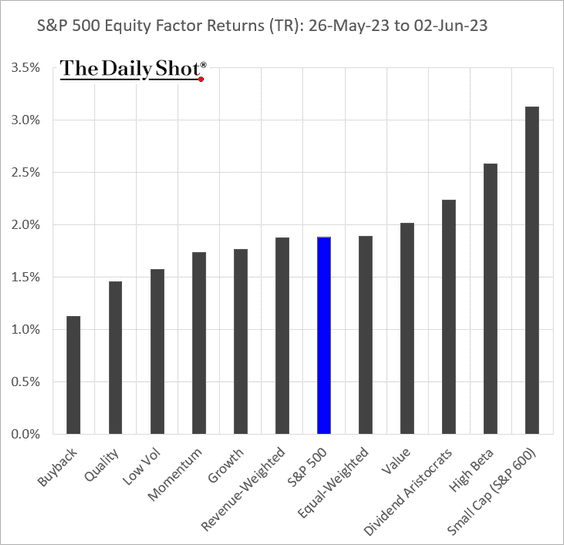
• Equity factors:
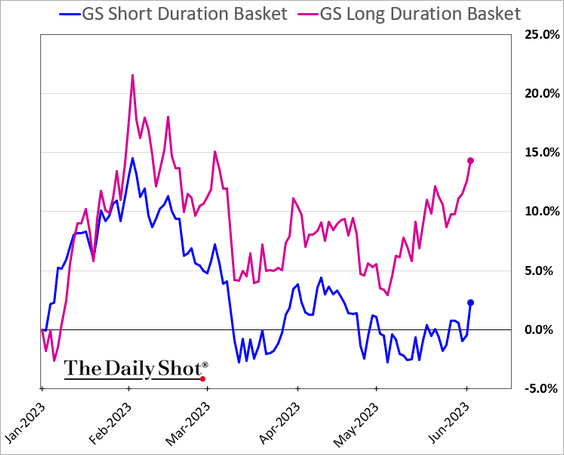
• Macro basket pairs:
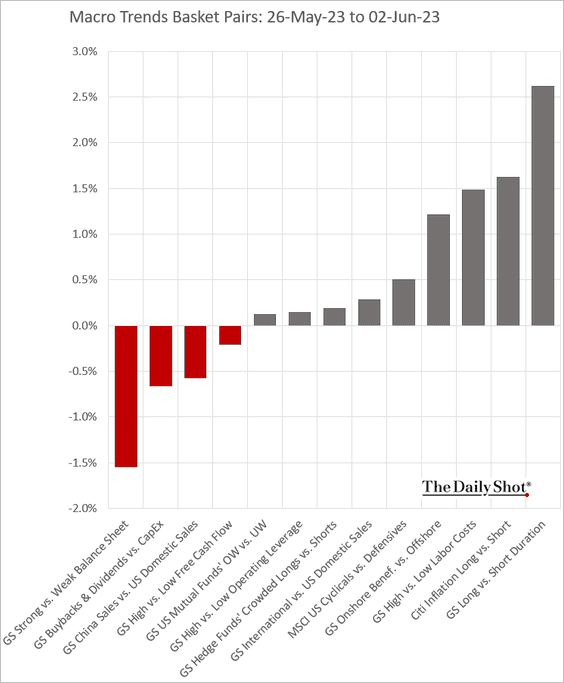
Long-duration stocks have been outperforming.
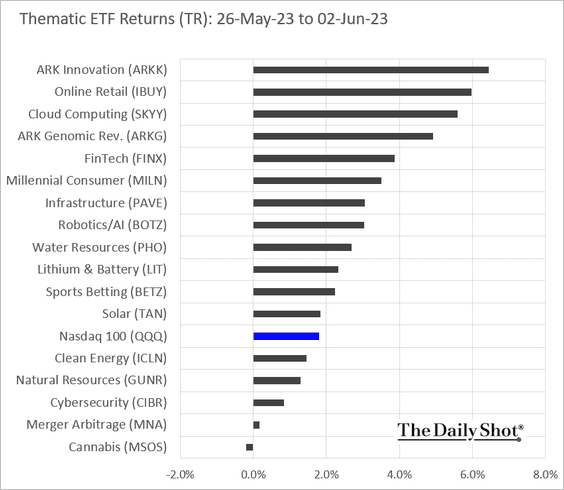
• Thematic ETFs:
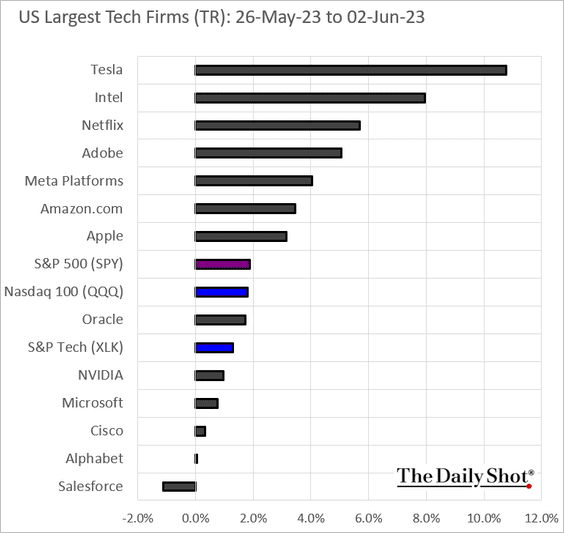
• Largest tech firms:
Back to Index
Credit
1. US office vacancies have been rising.
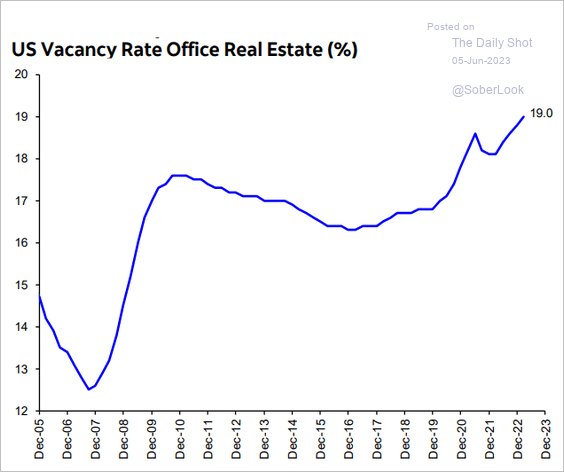 Source: Hugo Ste-Marie, Portfolio & Quantitative Strategy Global Equity Research, Scotia Capital
And yet, office construction spending remains robust.
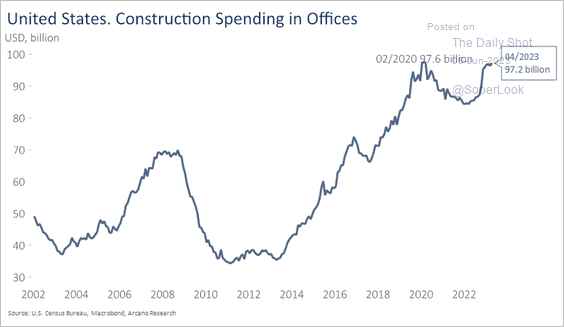 Source: Arcano Economics
——————–
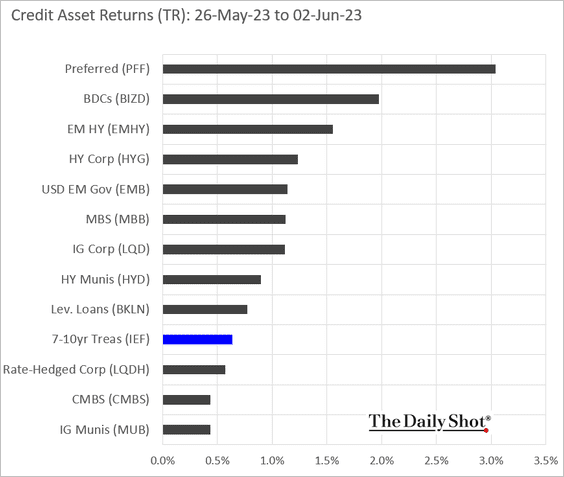
2. Here is last week’s performance by asset class.
Back to Index
Rates
1. Alpine Macro sees the Fed’s policy as very restrictive.
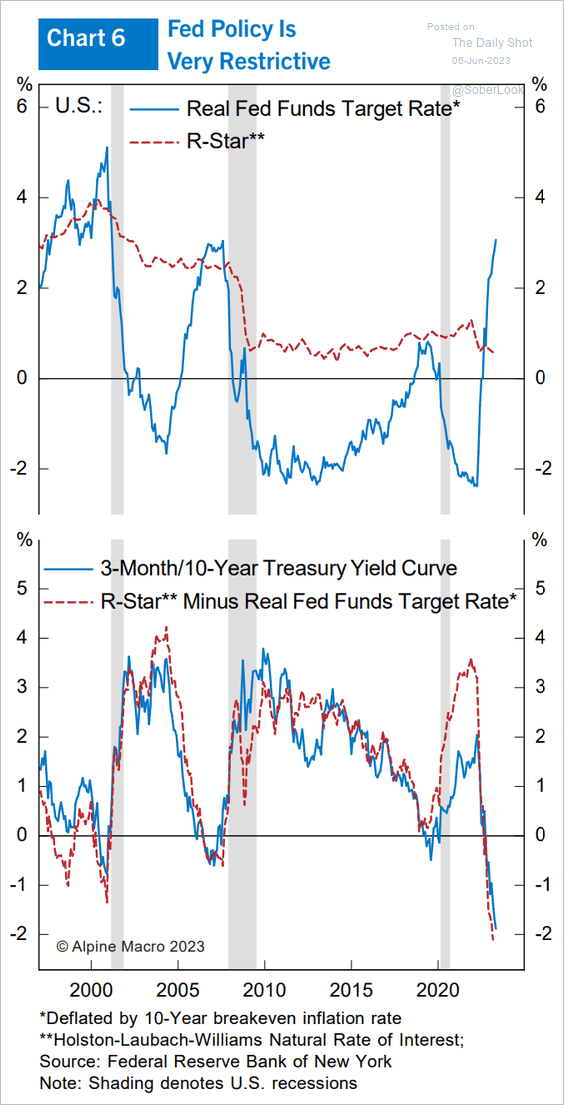 Source: Alpine Macro
2. Now that the debt ceiling has been lifted, the supply of T-bills is expected to surge.
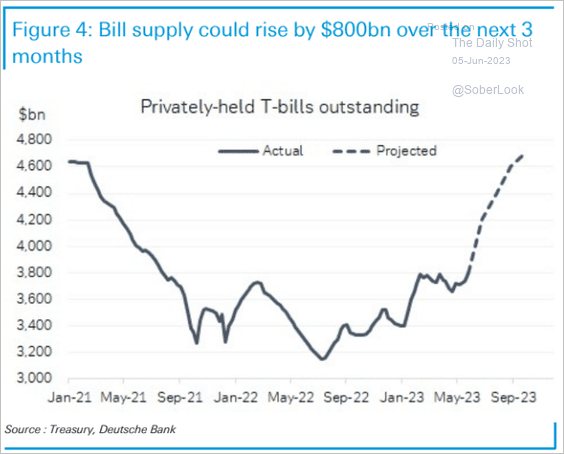 Source: Deutsche Bank Research
Back to Index
Global Developments
1. Global food prices continue to move lower.
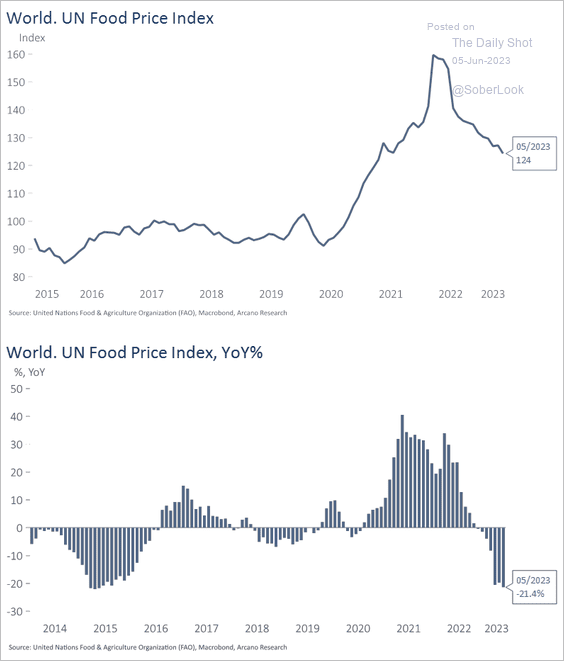 Source: Arcano Economics
2. Next, we have some performance data.
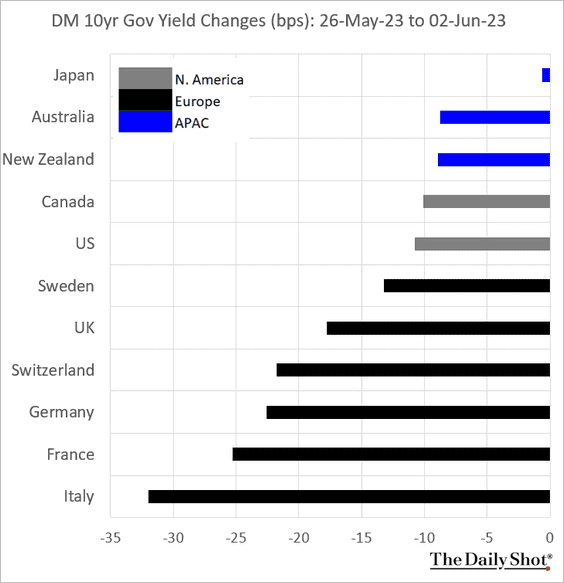
• Bond yields:
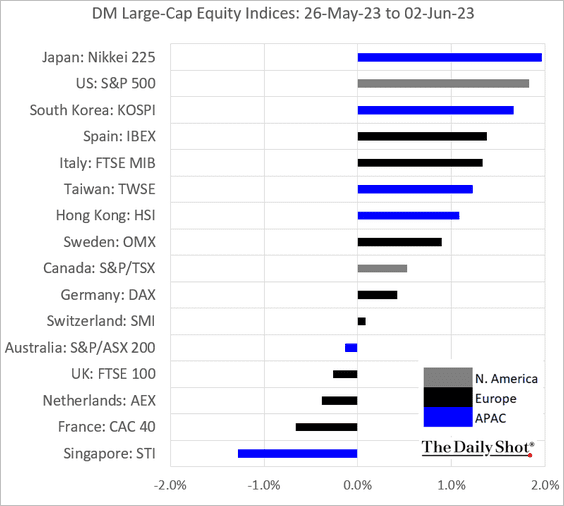
• Large-cap equity indices:
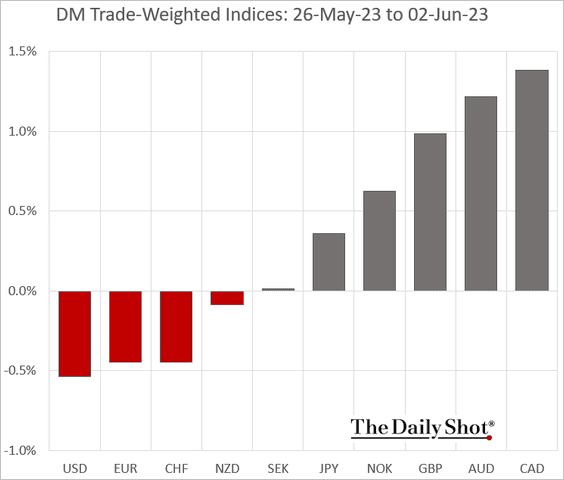
• Trade-weighted currency indices:
– This chart shows year-to-date returns for select currencies.
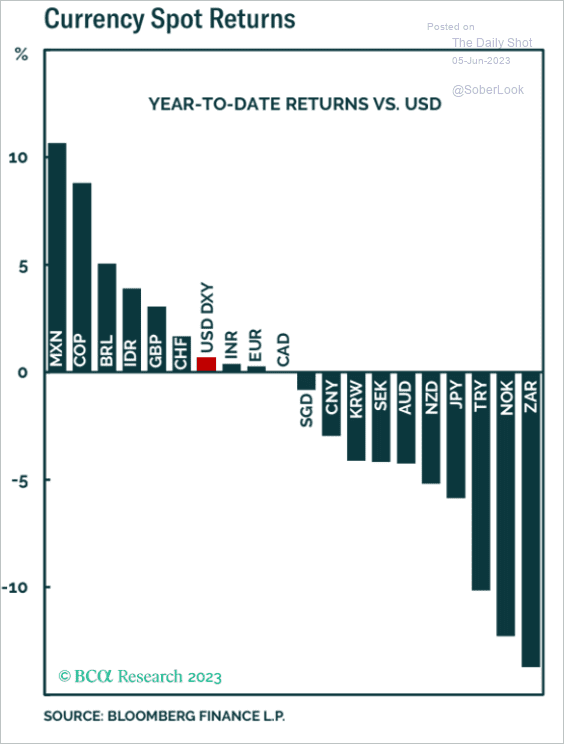 Source: BCA Research
——————–
Food for Thought
1. Opening weekend box office proceeds:
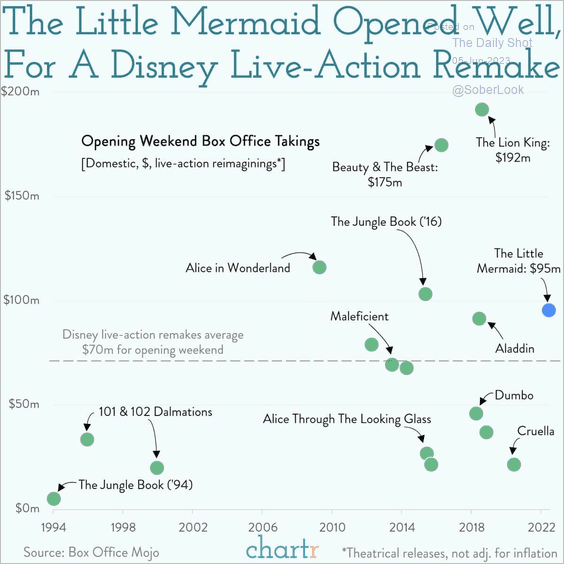 Source: @chartrdaily
– US box office gross revenue over time:
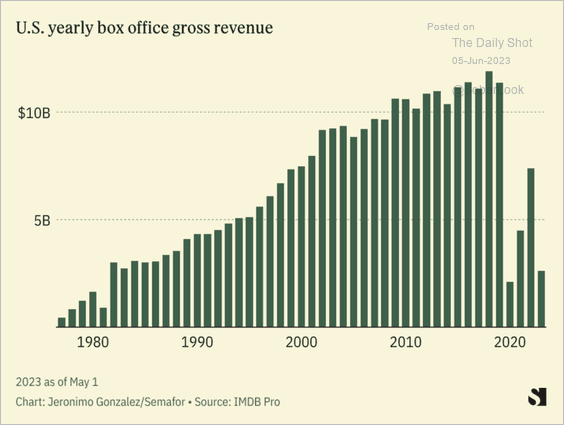 Source: Semafor
——————–
2. Amazon’s sales by segment:
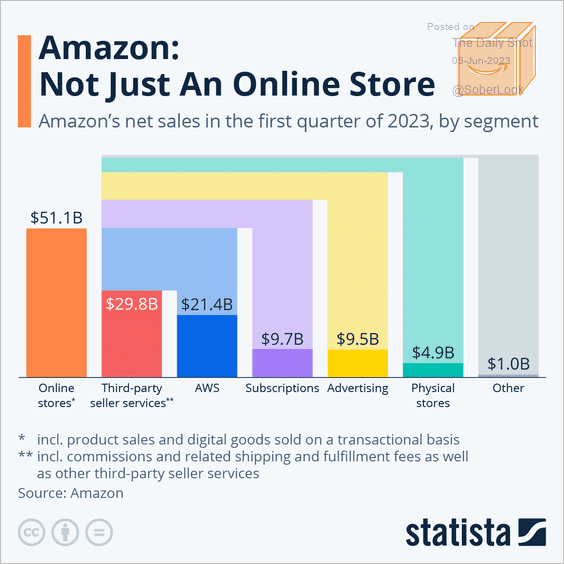 Source: Statista
3. China’s automotive market share:
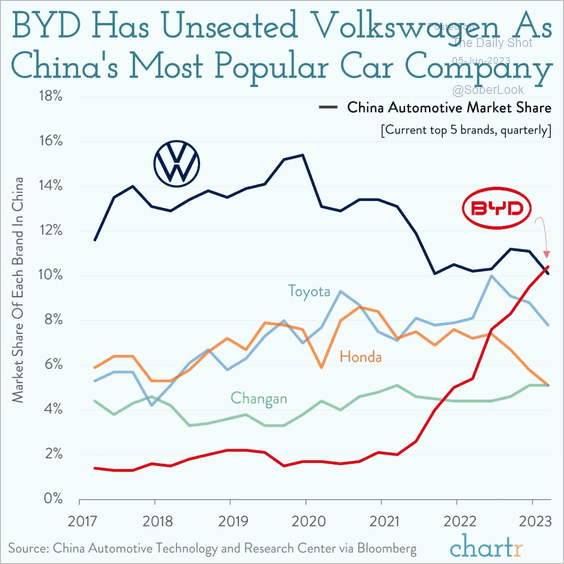 Source: @chartrdaily
4. EV sales in the US:
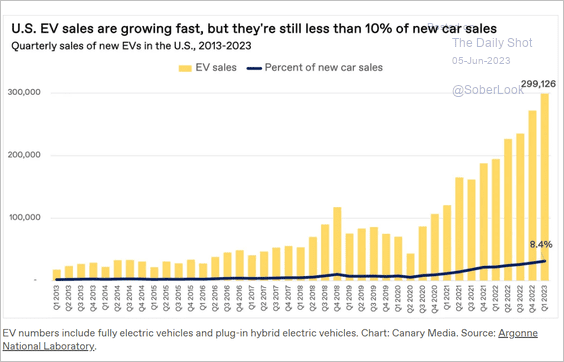 Source: Canary Media Read full article
5. Factors considered when shopping for apparel:
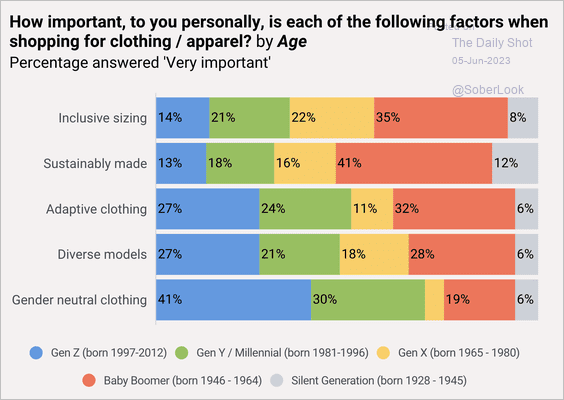 Source: @CivicScience Read full article
6. Penny production costs to the US Treasury:
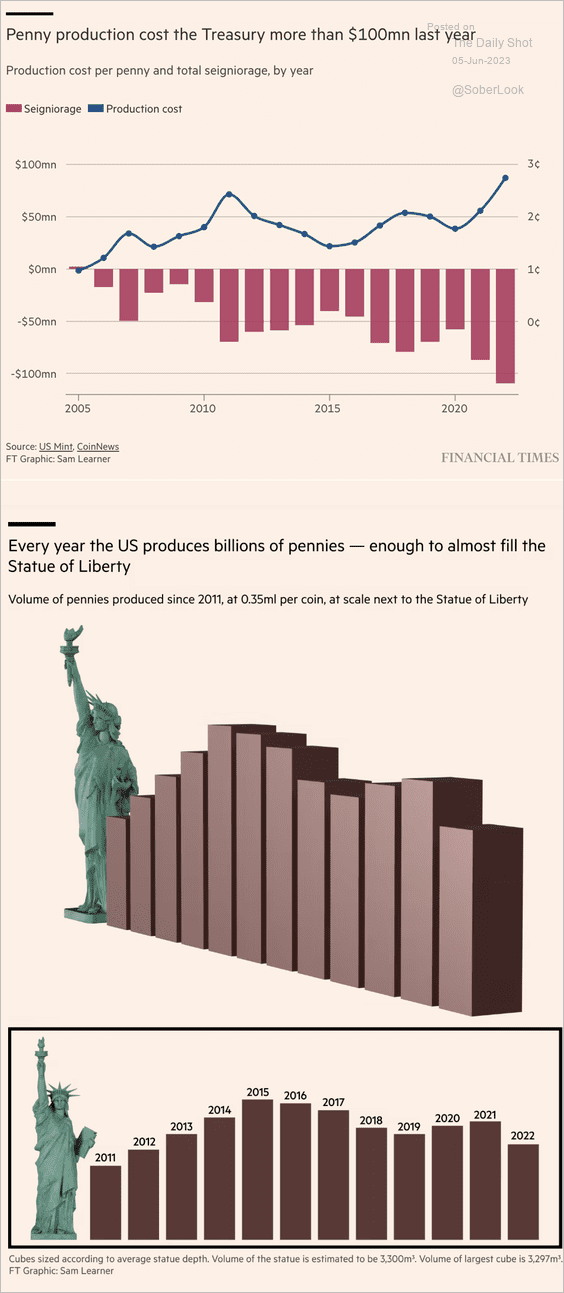 Source: @financialtimes Read full article
The half-cent coin was eliminated in 1857.
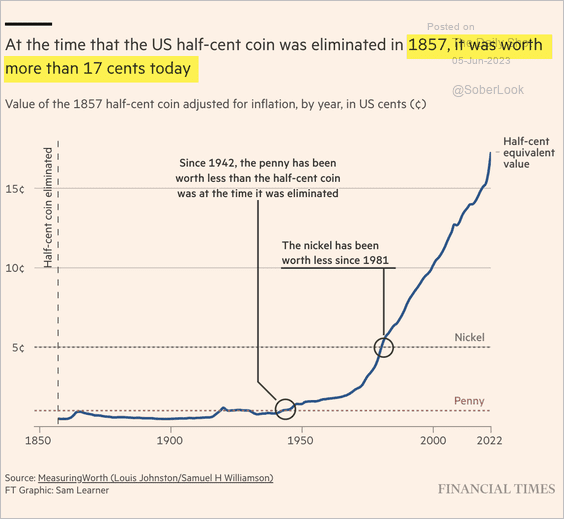 Source: @financialtimes Read full article
——————–
7. Who will benefit from Bed Bath & Beyond’s bankruptcy?
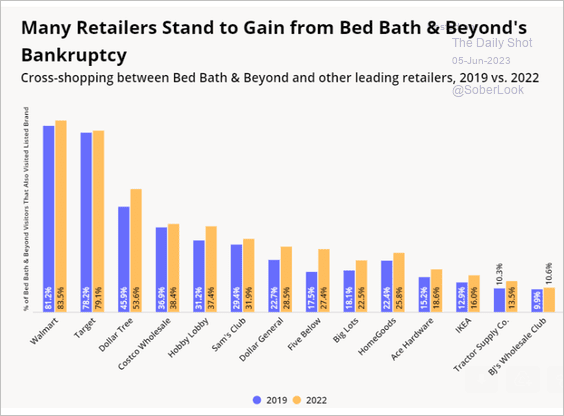 Source: Placer.ai
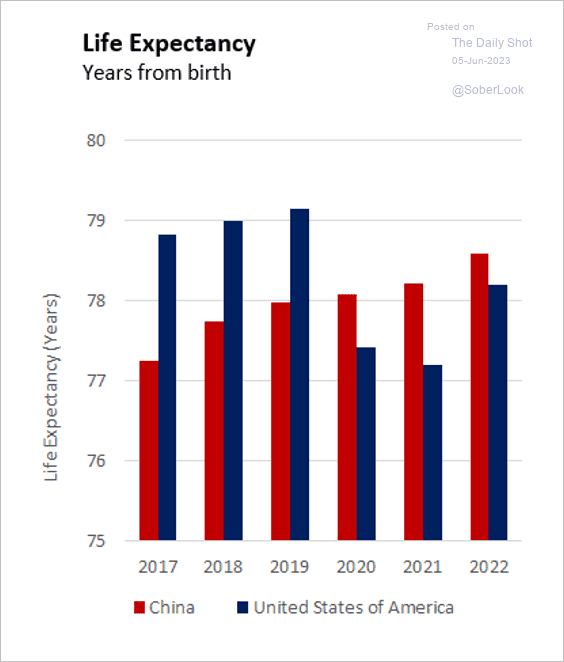
8. The global trend toward higher life expectancy continued after a temporary setback caused by COVID-19.
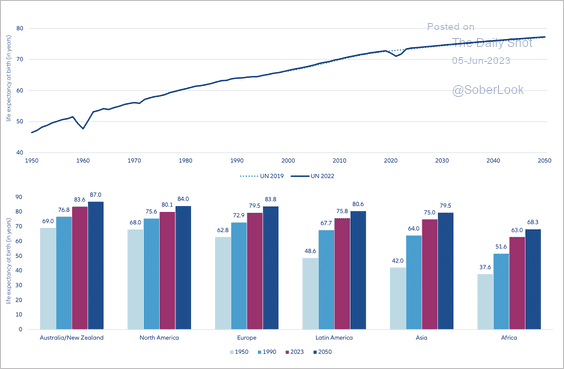 Source: Allianz Research
– Life expectancy in China and the US:
 Source: World Economics
——————–
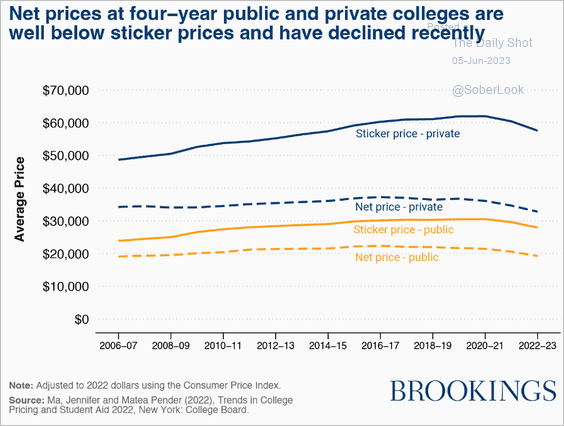
9. Net college prices:
 Source: Brookings Read full article
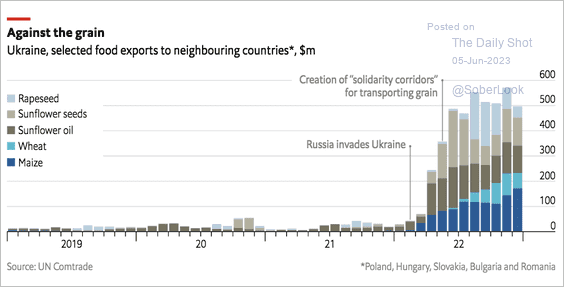
10. Ukraine’s food exports to neighboring countries:
 Source: The Economist Read full article
11. The world’s roads mapped:
 Source: Visual Capitalist Read full article
——————–
Back to Index