
The Daily Shot: 06-Jun-23
• The United States
• Canada
• The United Kingdom
• The Eurozone
• Europe
• Japan
• Australia
• Emerging Markets
• Cryptocurrency
• Energy
• Equities
• Credit
• Rates
• Global Developments
• Food for Thought
The United States
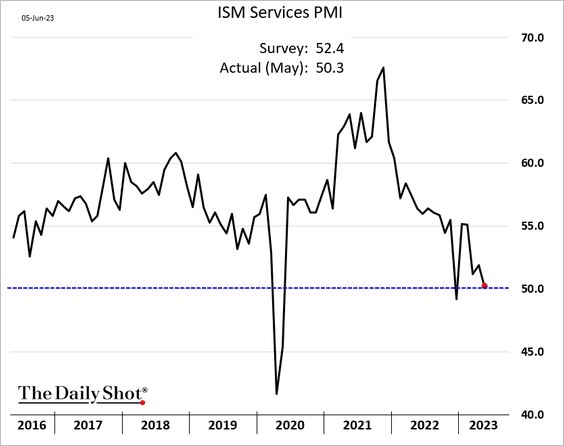
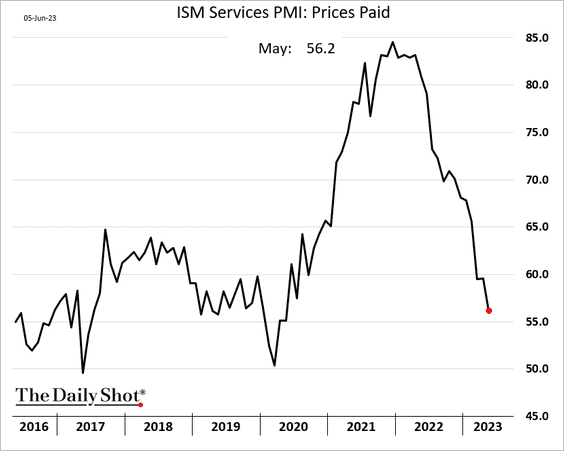
1. The ISM Services PMI signals stalled business activity growth in May.
 Source: MarketWatch Read full article
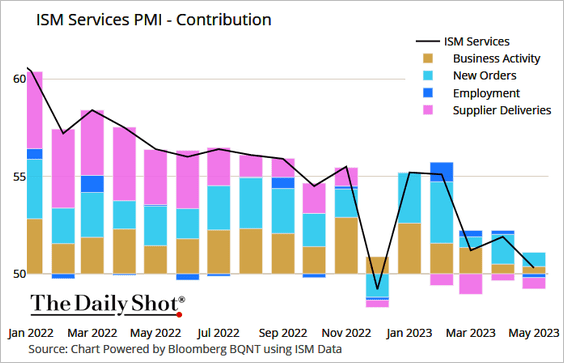
• Here are the contributions to the ISM index.
 Source: @TheTerminal, Bloomberg Finance L.P.
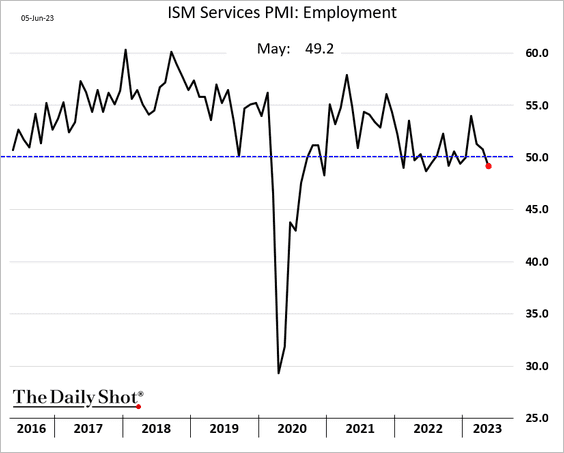
• The employment index shows staff reductions last month.
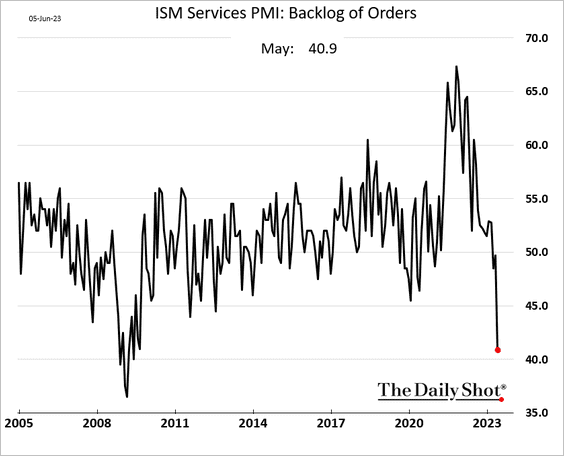
• Companies faced significant challenges in managing the influx of new orders last year, but now it seems like a distant memory.
• Service-sector cost increases continue to slow, …
… which points to softer inflation ahead, …
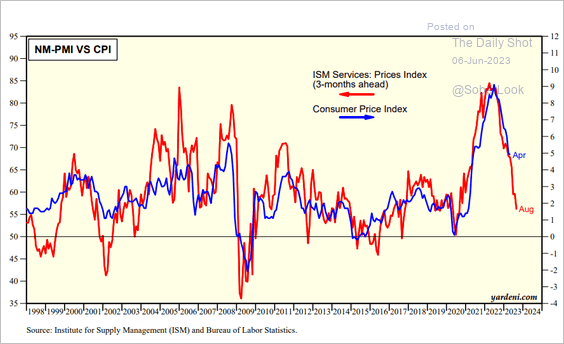 Source: Yardeni Research
… as well as moderating wage growth.
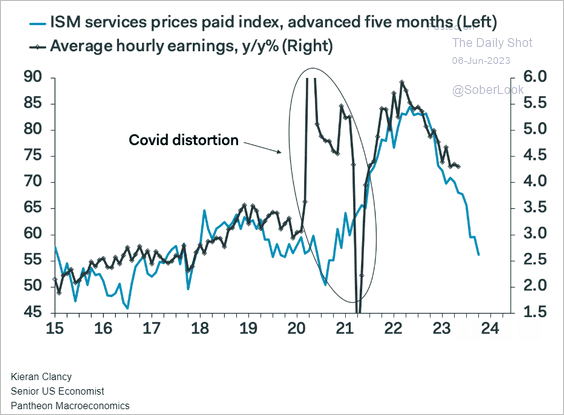 Source: Pantheon Macroeconomics
——————–
2. A separate survey from S&P Global PMI shows improvements in US tech, consumer services, and financials in May.
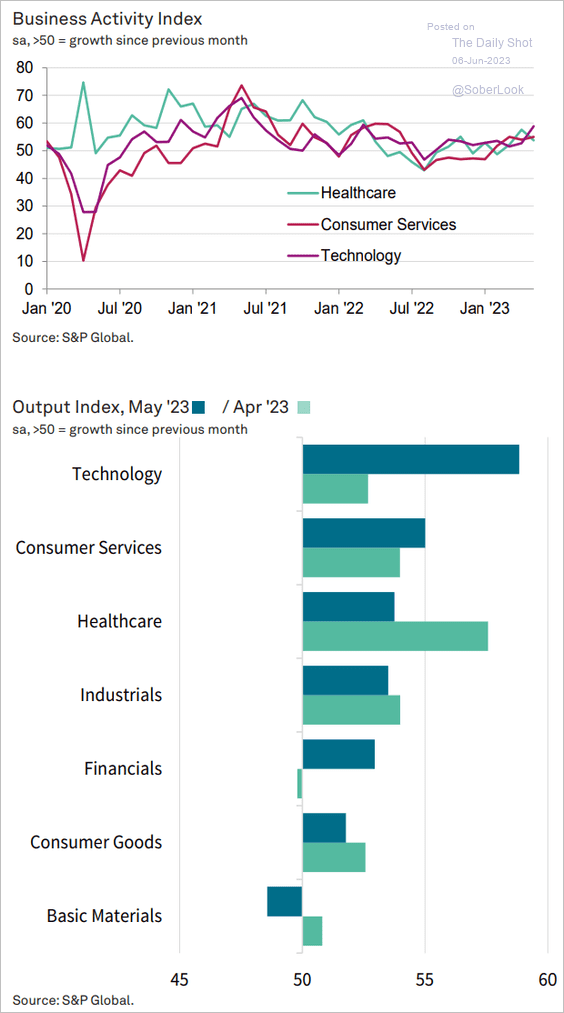 Source: S&P Global PMI
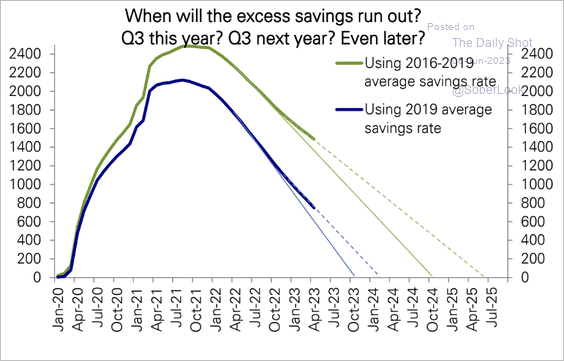
3. Next, we have some updates on consumer spending.
• There is some debate regarding the extent of excess household savings and the point at which this buffer is depleted.
 Source: Deutsche Bank Research
– Wells Fargo:
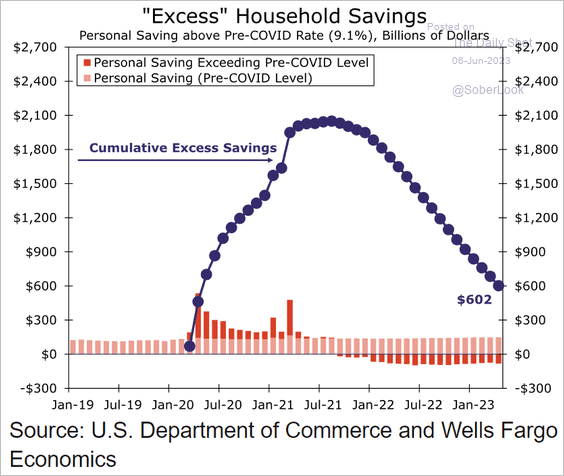 Source: Wells Fargo Securities
– Fidelity:
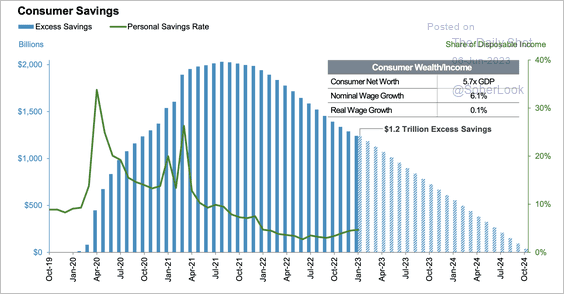 Source: Fidelity Investments Read full article
Deutsche Bank expects excess savings to be depleted by year-end…
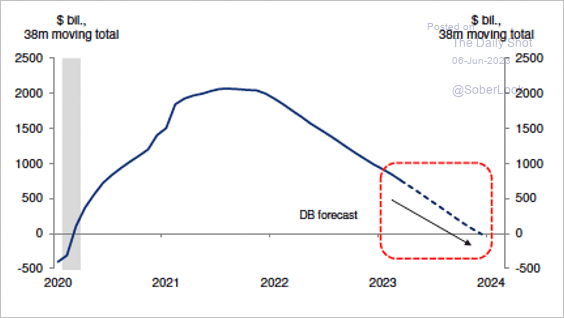 Source: Deutsche Bank Research
…and a later, somewhat deeper recession than consensus.
 Source: Deutsche Bank Research
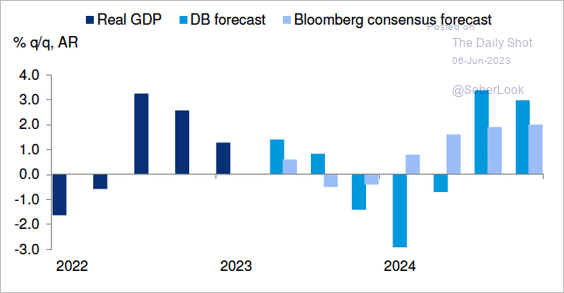
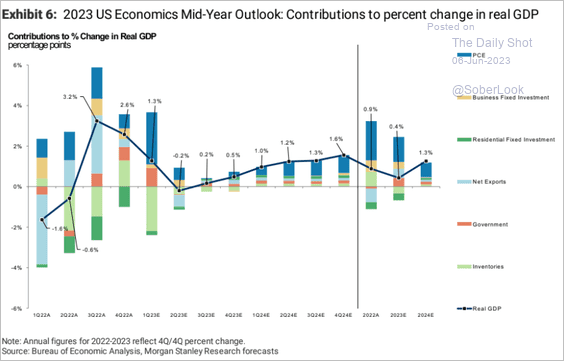
• Here is Morgan Stanley’s forecast for real consumer spending.
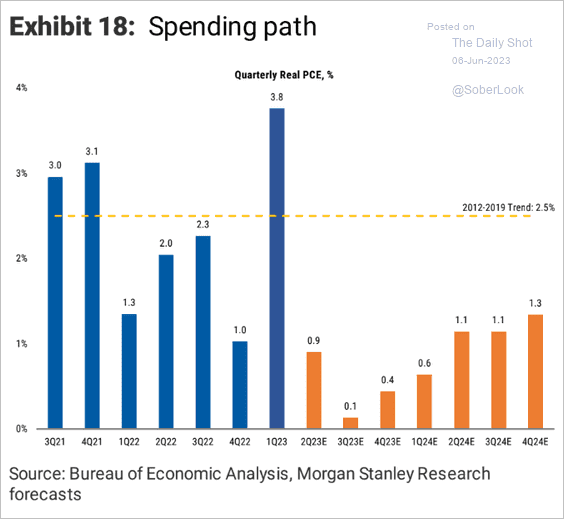 Source: Morgan Stanley Research
The Q3 spending dip would lead to only one negative quarter but no recession.
 Source: Morgan Stanley Research
• Nondiscretionary consumer spending will become a larger portion of total expenditures.
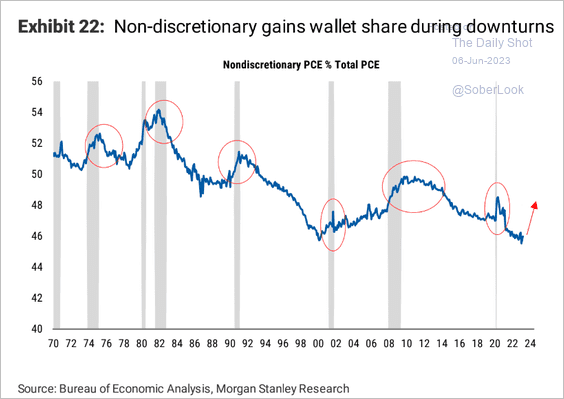 Source: Morgan Stanley Research
• Consumption as a share of labor income has been elevated and will turn lower.
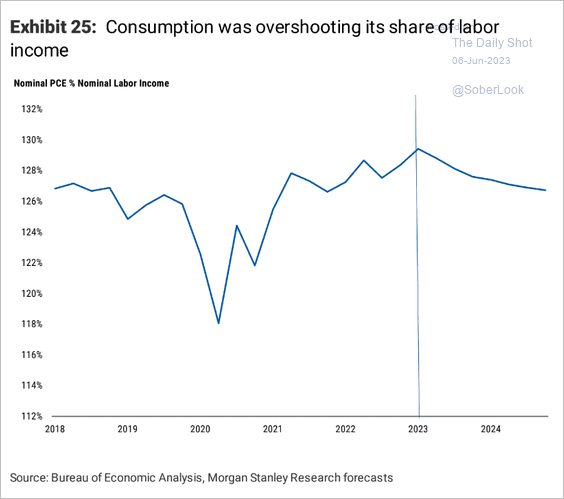 Source: Morgan Stanley Research
• Credit card data points to weaker spending in May.
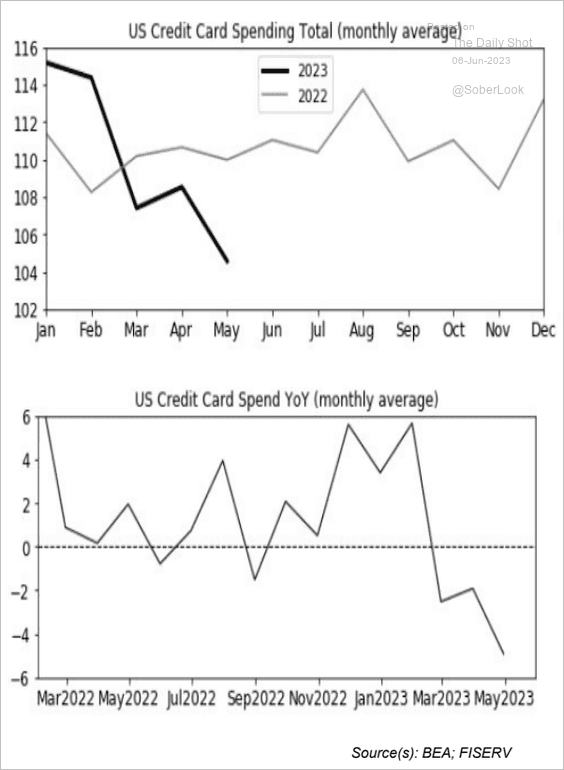 Source: III Capital Management
• Some cohorts are seeing the highest credit card delinquency rates since the GFC.
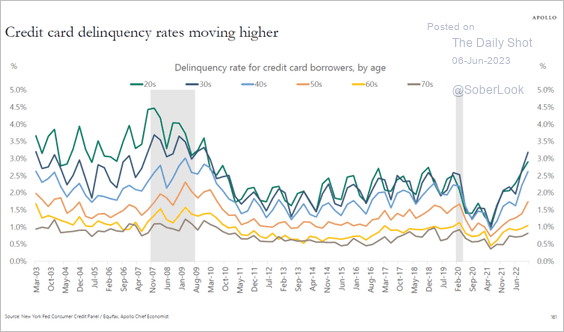 Source: Torsten Slok, Apollo
——————–
4. A significant amount of private-sector investment has been announced since the passage of the Inflation Reduction Act.
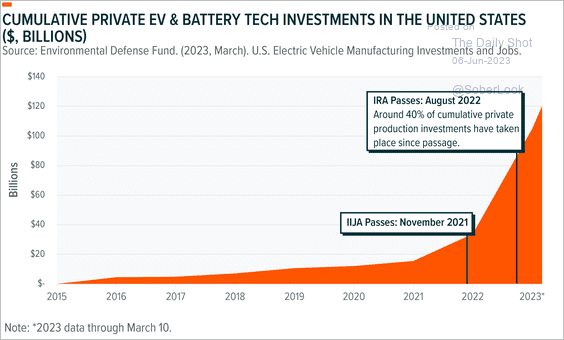 Source: Global X ETFs Read full article
5. This chart shows asset values relative to GDP.
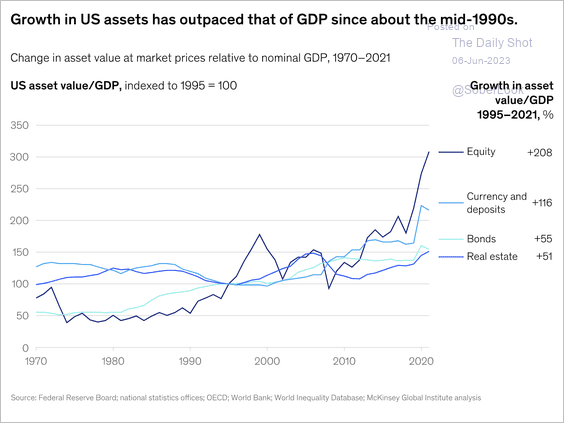 Source: McKinsey & Company Read full article
Back to Index
Canada
1. Regional housing data reveal a significant rebound in the market last month.
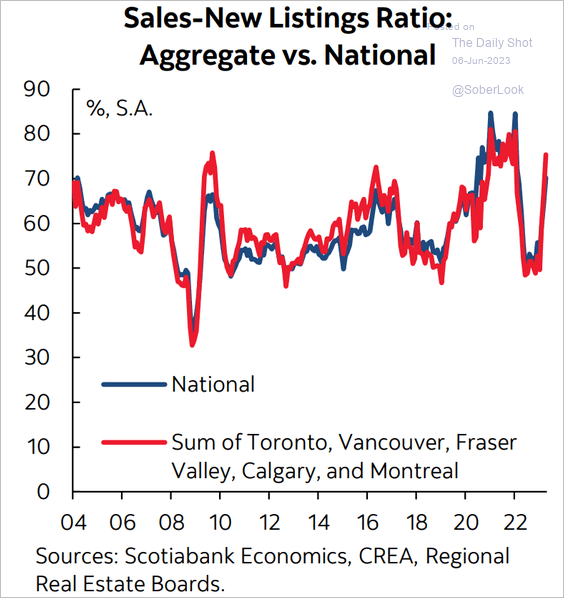 Source: Scotiabank Economics
2. Labor costs have been rising quickly in recent years.
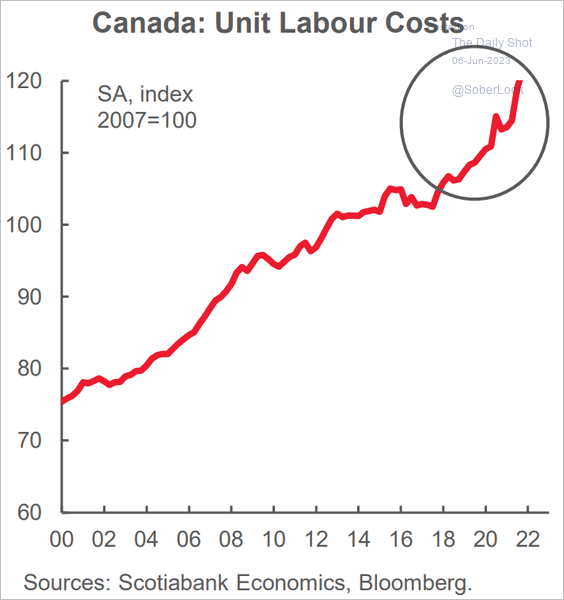 Source: Scotiabank Economics
3. Here is Canada’s Beveridge Curve.
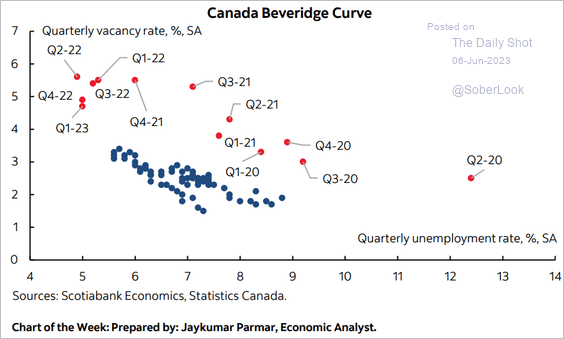 Source: Scotiabank Economics
Back to Index
The United Kingdom
1. Deutsche Bank expects the policy rate to peak at 5.25%, with a shallow easing cycle next year.
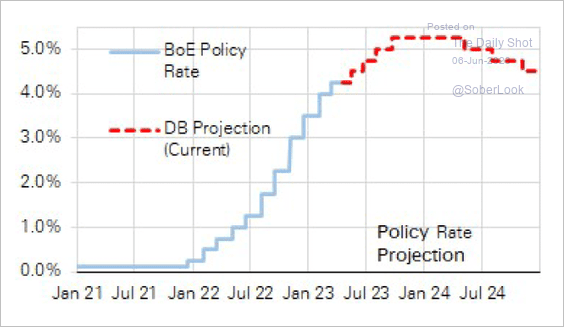 Source: Deutsche Bank Research
2. Mortgage rates have been rising again.
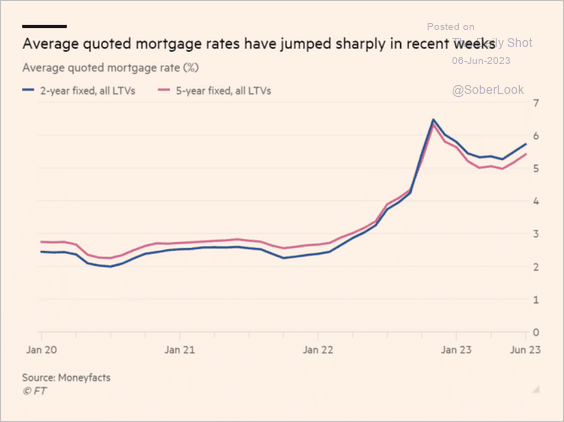 Source: @financialtimes Read full article
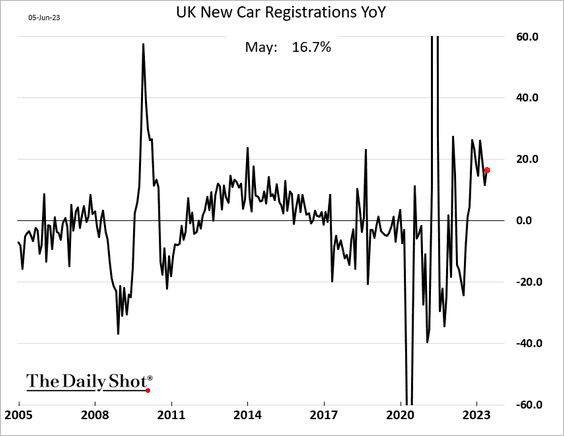
3. New car registrations remain well above last year’s levels.
Back to Index
The Eurozone
1. The Sentix investor sentiment indicator turned lower in June.
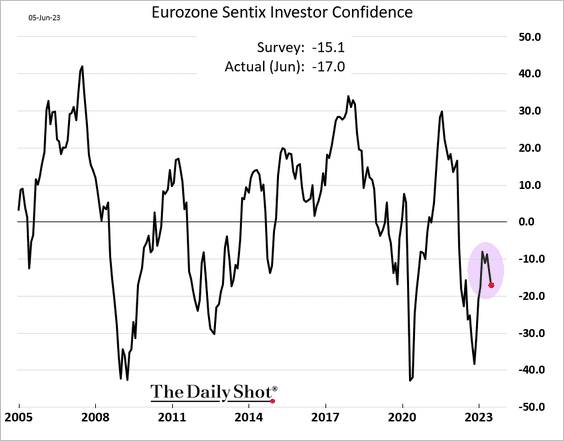
 Source: Reuters Read full article
——————–
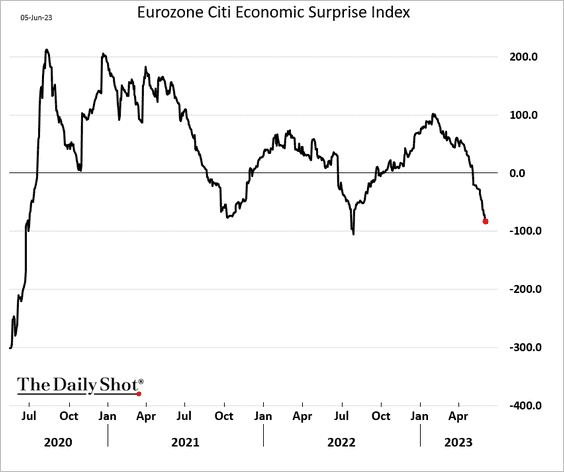
2. The Citi Economic Surprise Index is crashing.
3. Germany’s April trade surplus topped expectations as terms of trade continued to improve.
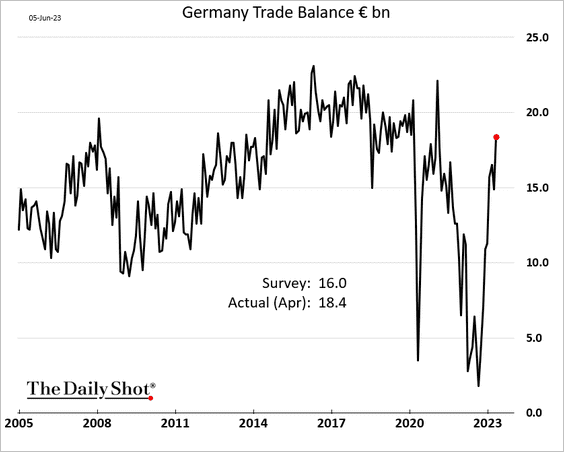
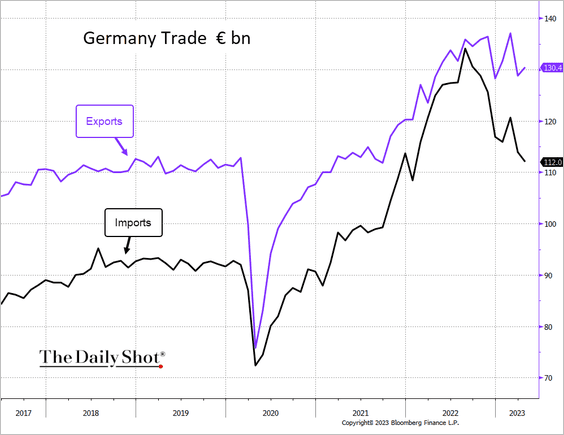 Source: @TheTerminal, Bloomberg Finance L.P.
——————–
4. The Euro has consolidated its gains versus the dollar and Swiss franc this year, although its short-term uptrend remains intact versus an equal-weighted basket of interest rate-sensitive currencies such as AUD, CAD, and GBP.
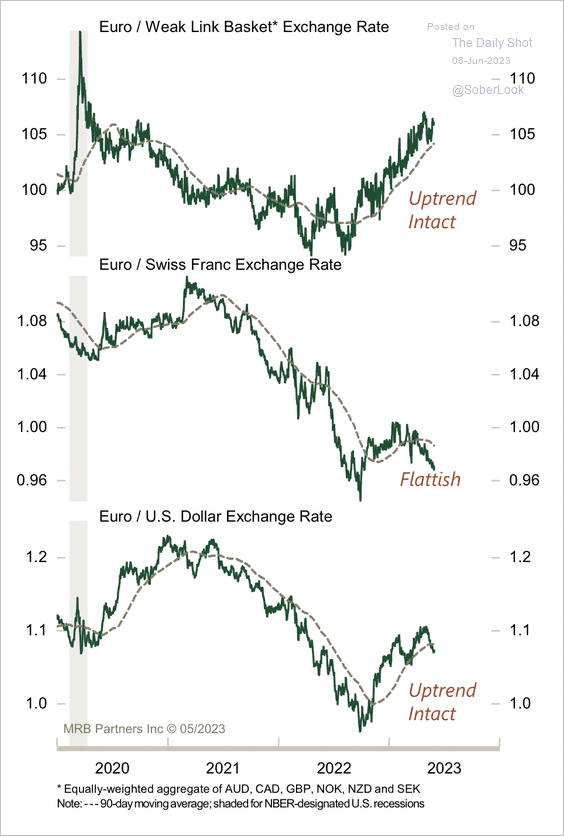 Source: MRB Partners
5. Popular support for the euro remains strong.
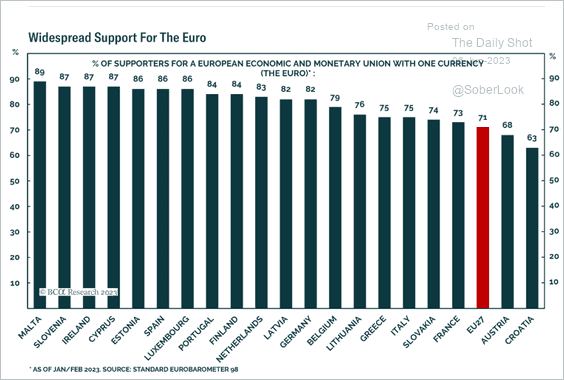 Source: BCA Research
Back to Index
Europe
1. Swiss core inflation has peaked.
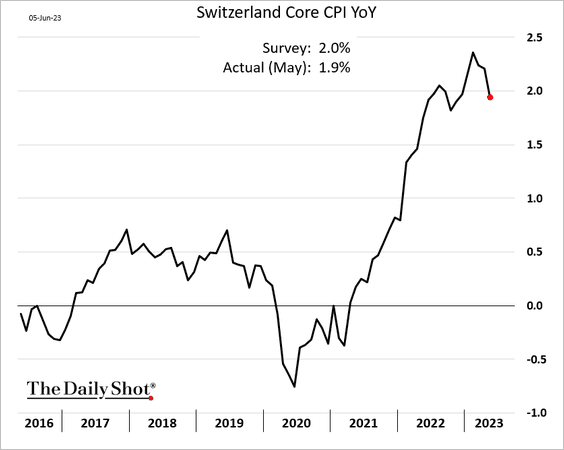
The PMI trend points to further declines in the CPI.
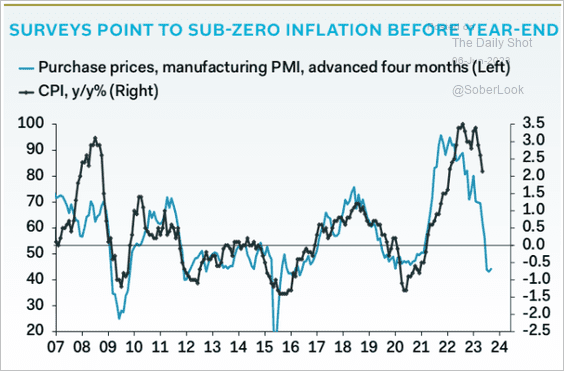 Source: Pantheon Macroeconomics
• Switzerland’s housing bubble remains a key risk.
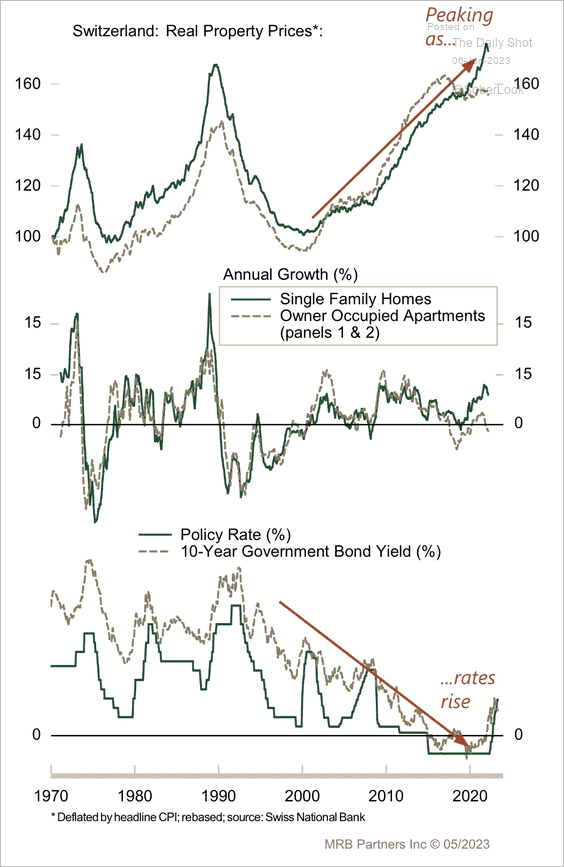 Source: MRB Partners
• The Swiss franc has held up this year.
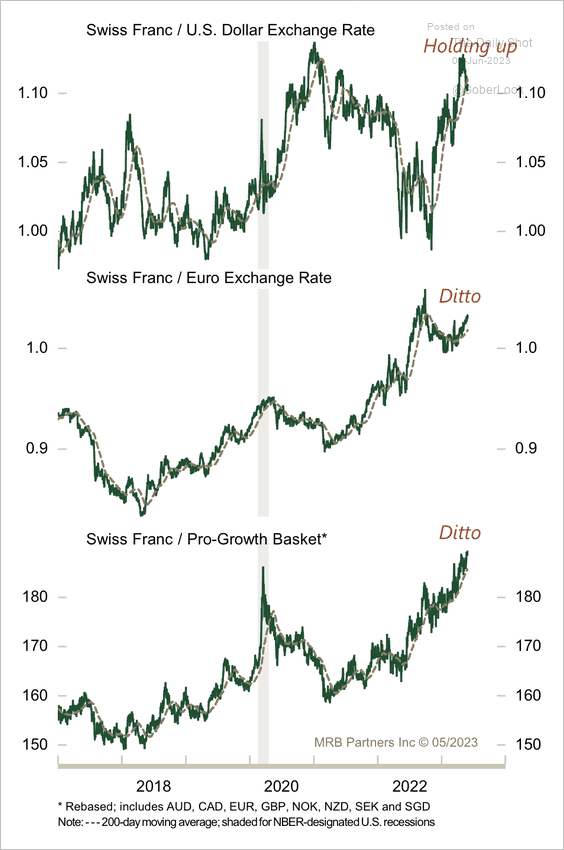 Source: MRB Partners
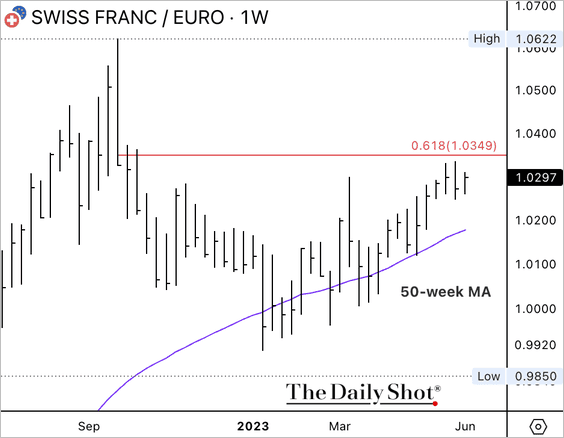
CHF/EUR is testing initial resistance. Its uptrend remains vulnerable to risk-on conditions.
——————–
2. This chart shows public spending on pensions in select economies.
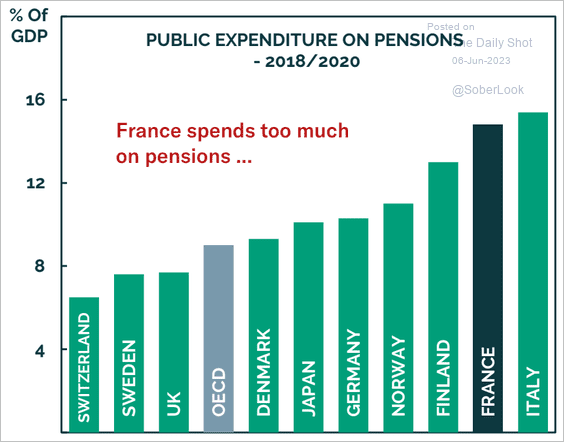 Source: BCA Research
Back to Index
Japan
1. Real wages remain well below last year’s levels.
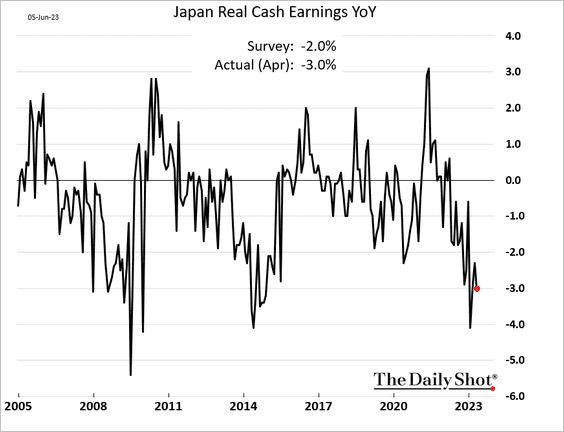
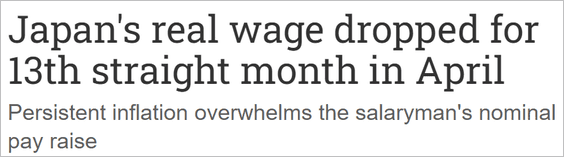 Source: Nikkei Asia Read full article
——————–
2. Household spending in April was below forecasts.
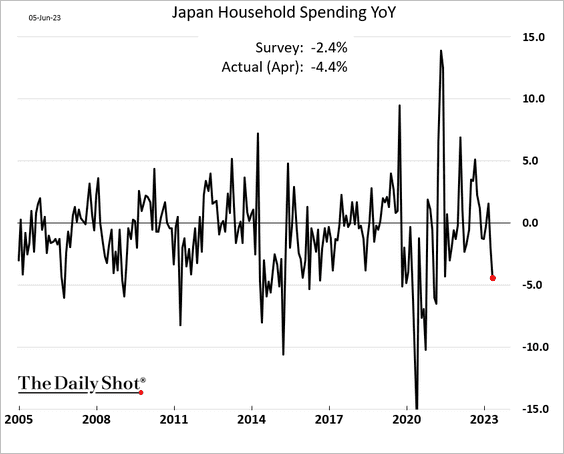
 Source: Nippon Read full article
——————–
3. Japan’s stocks have widened the gap with Asian peers.
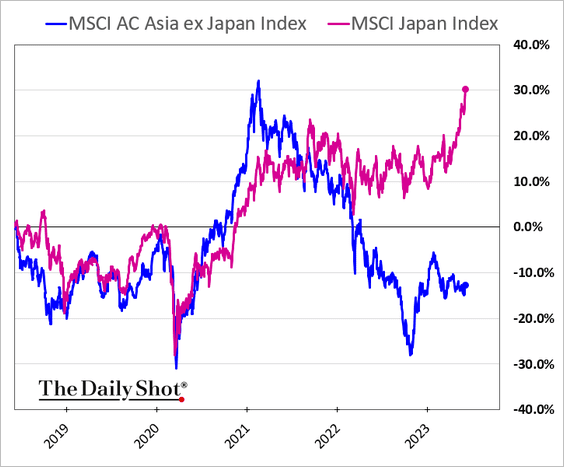
Investor-friendly corporate actions continue to be a tailwind for the stock market.
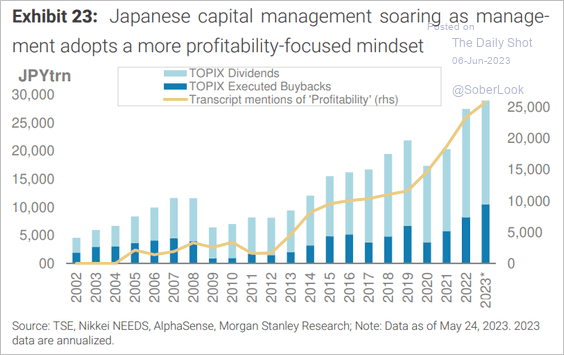 Source: Morgan Stanley Research
——————–
4. This chart shows the contributions to Japan’s population changes.
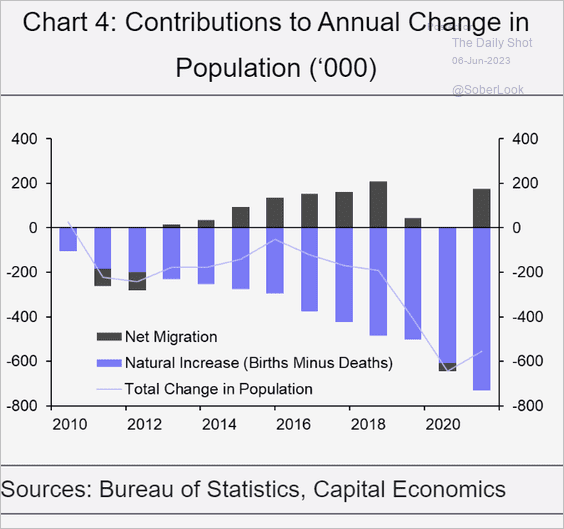 Source: Capital Economics
Back to Index
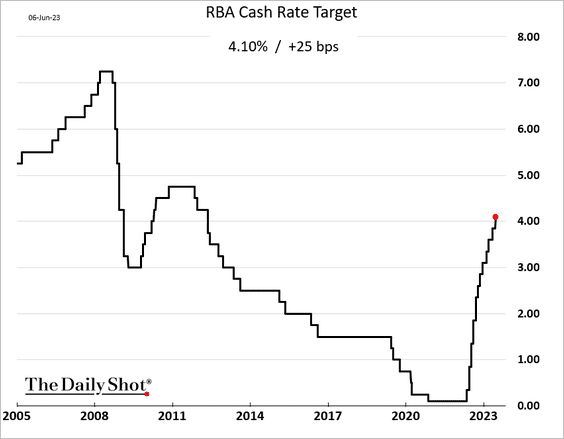
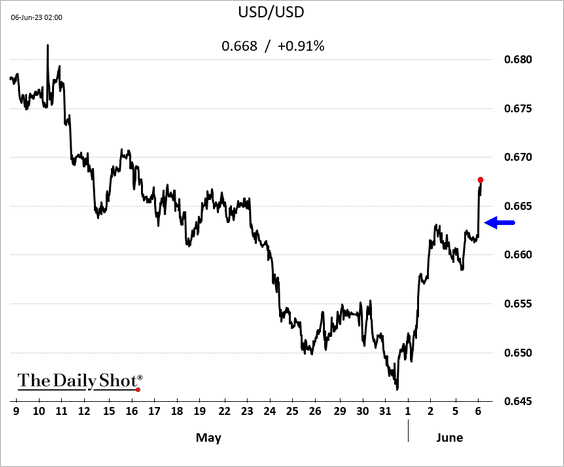
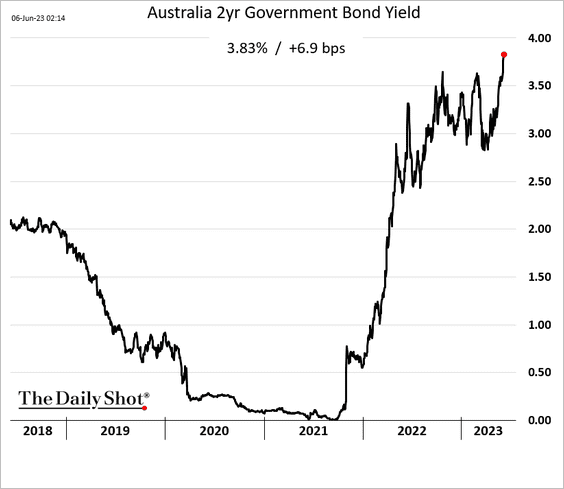
Australia
The RBA caught markets off guard with an unexpected rate hike while also cautioning about further impending increases.
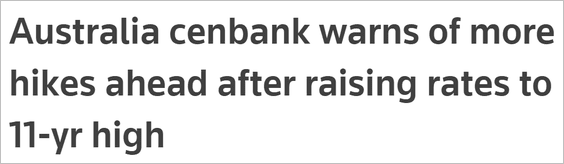 Source: Reuters Read full article
The Aussie dollar and bond yields jumped.
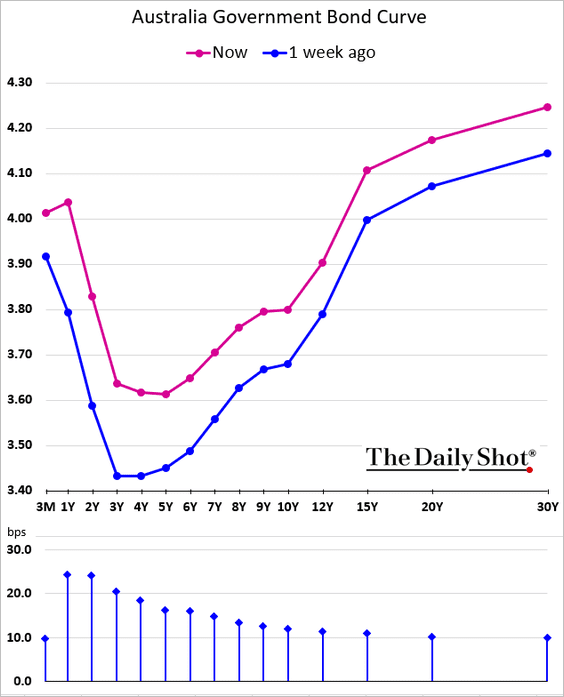
Here is the yield curve.
Back to Index
Emerging Markets
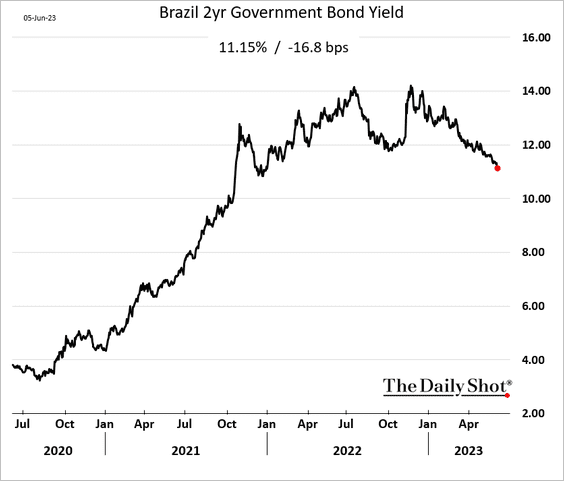
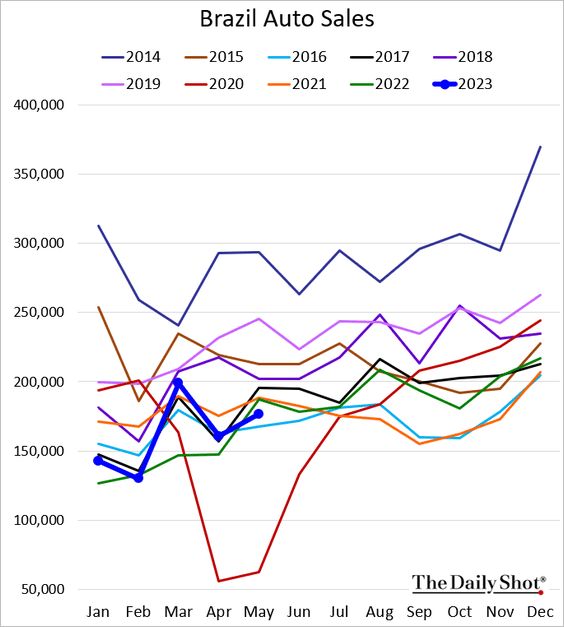
1. Let’s begin with Brazil.
• Bond yields are falling as inflation moderates.
• Auto sales fell back below last year’s levels.
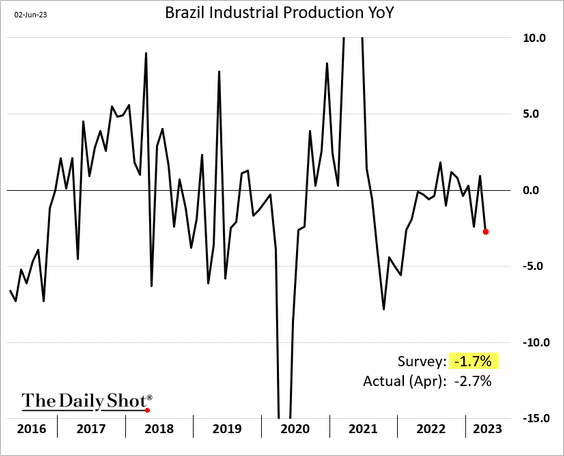
• Industrial production dropped in April.
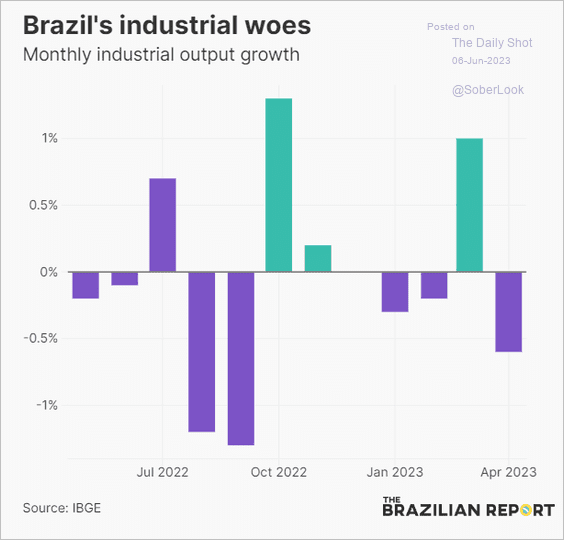 Source: The Brazilian Report Read full article
• Service firms continue to report growth.
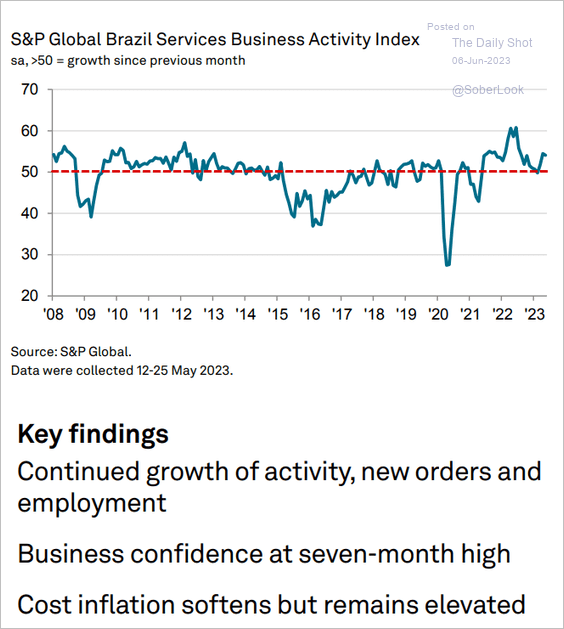 Source: S&P Global PMI
——————–
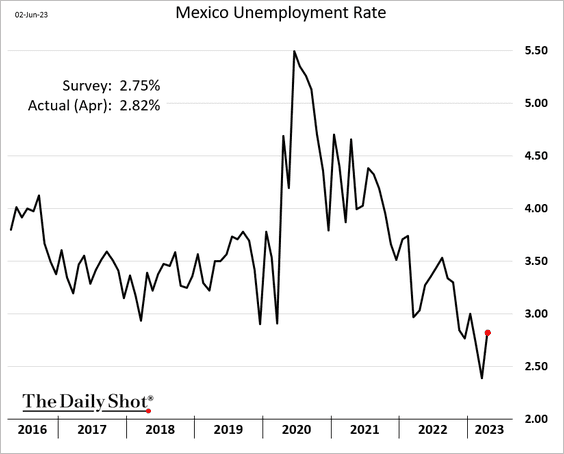
2. Mexico’s unemployment rate increased in April.
• Manufacturing growth is stalling again.
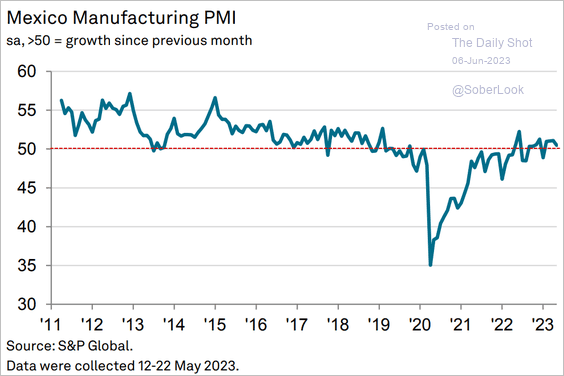 Source: S&P Global PMI
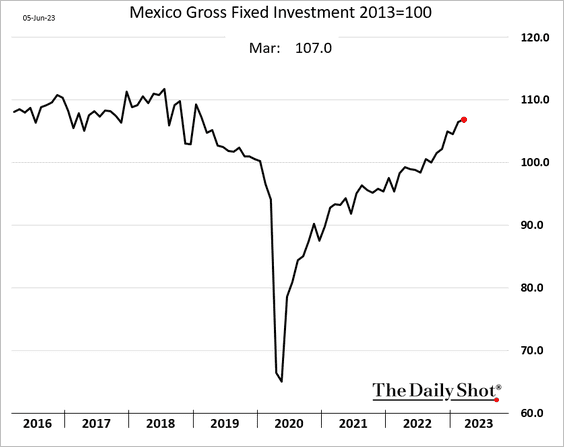
• Business investment continues to trend higher.
——————–
3. Here is a look at inflation across LatAm economies.
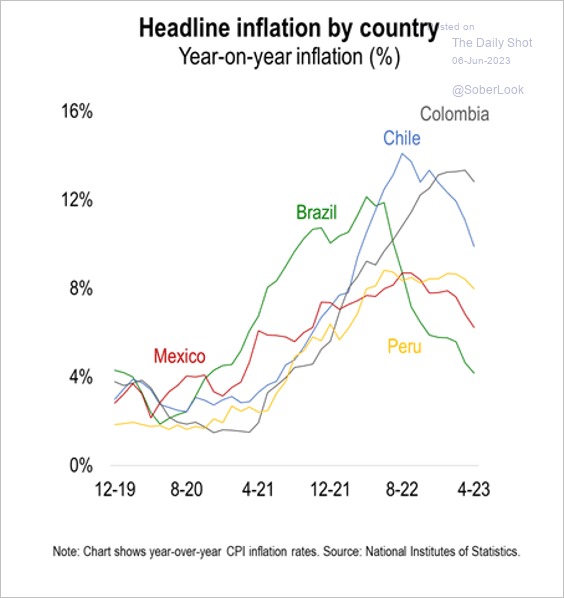 Source: Numera Analytics (@NumeraAnalytics)
4. Next, we have some updates on Russia.
• Households have been moving cash into foreign banks.
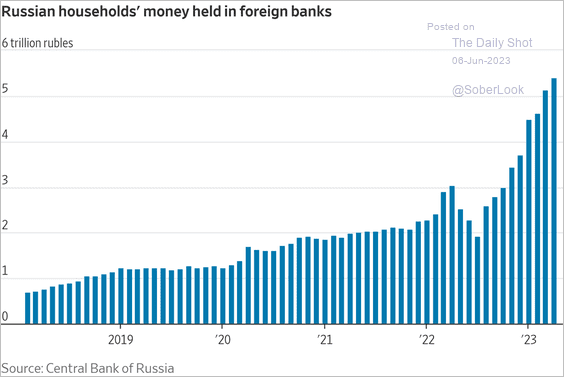 Source: @WSJ Read full article
• Amidst sustained military orders, Russia’s manufacturers have reported resilient growth.
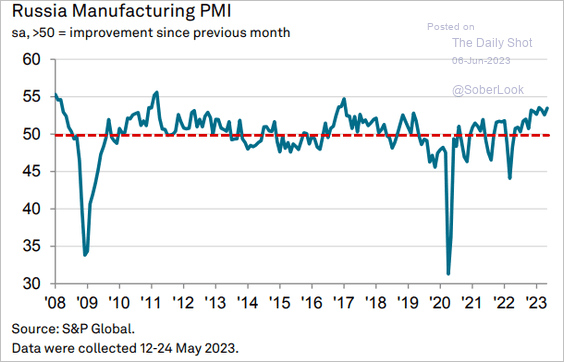 Source: S&P Global PMI
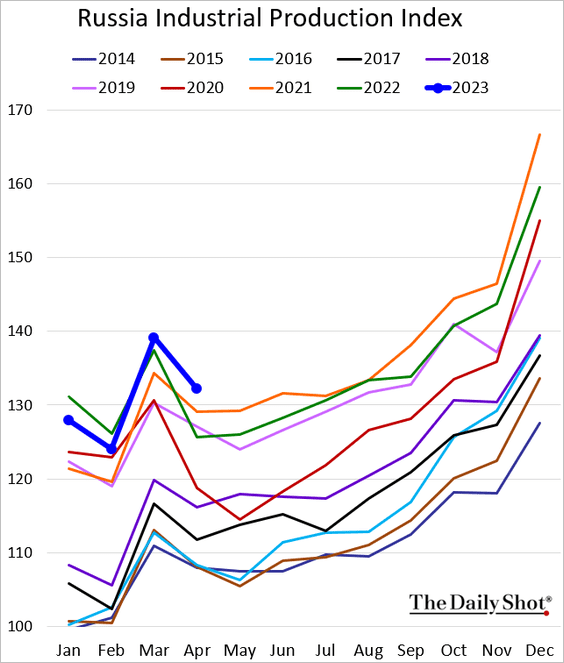
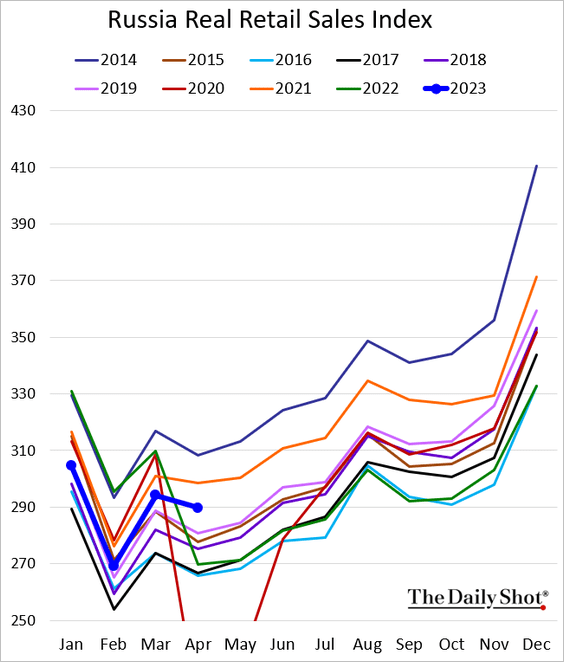
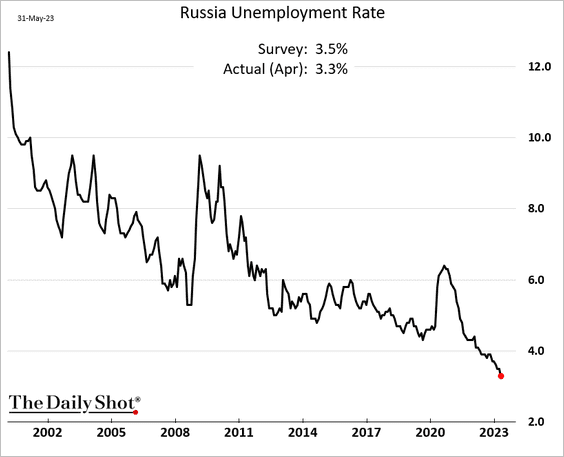
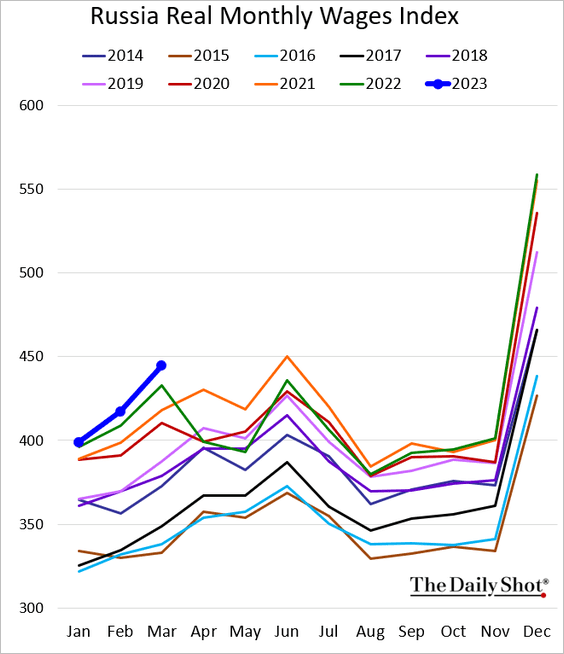
• Economic trends below are reported by the government.
– Industrial production:
– Retail sales:
– Unemployment:
– Real wages:
——————–
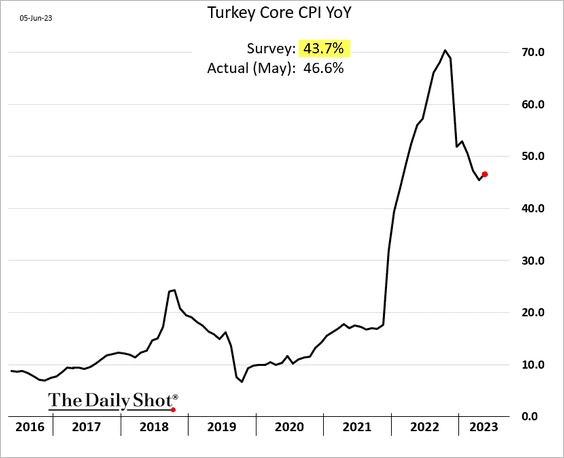
5. Turkey’s core inflation unexpectedly accelerated in May.
6. Inflation is already declining into target ranges in some EM countries.
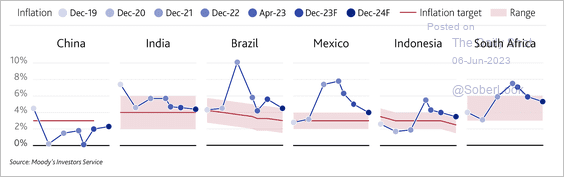 Source: Moody’s Investors Service
Back to Index
Cryptocurrency
1. Bitcoin saw a spike in long liquidations on Monday as the crypto’s price fell below $26K. News of the SEC’s lawsuit against Binance and its CEO unsettled crypto markets.
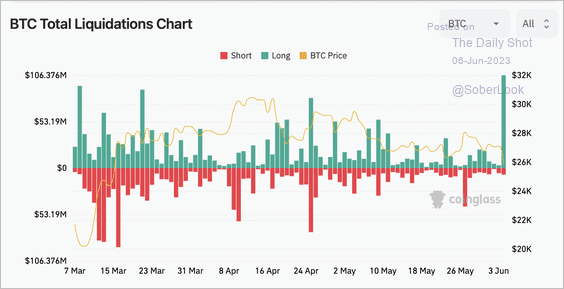 Source: Coinglass
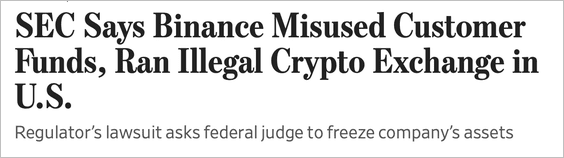 Source: @WSJ Read full article
——————–
2. For now, the Crypto Fear & Greed Index is stuck in the neutral zone, declining from greed levels earlier this year.
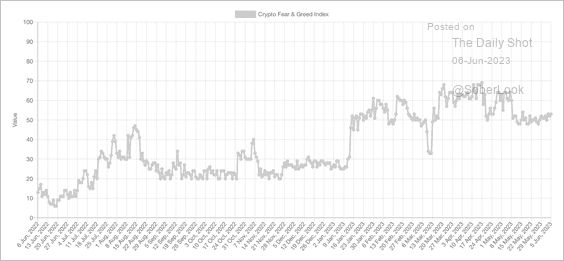 Source: Alternative.me
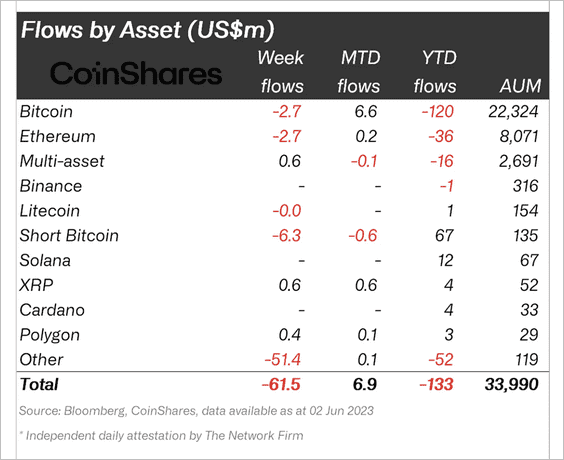
3. Crypto funds saw the seventh-straight week of outflows.
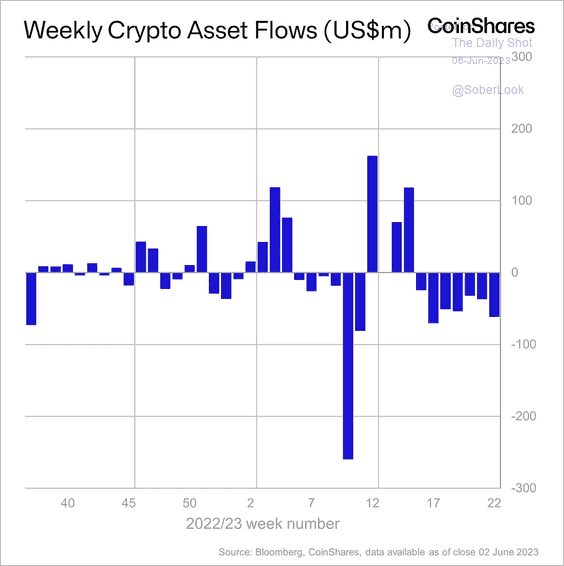 Source: CoinShares Read full article
Funds that focus on Tron, a smart contract platform, saw most outflows totaling $51 million last week. Short-bitcoin focused funds also saw notable outflows, suggesting neutral sentiment among investors.
 Source: CoinShares Read full article
Back to Index
Energy
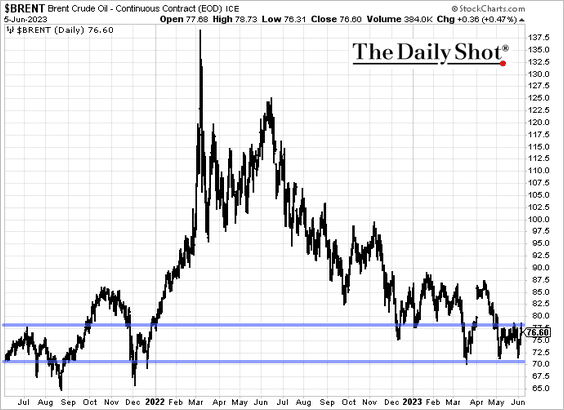
1. Despite OPEC production cuts, Brent crude remains range-bound.
2. Money managers remain cautious on crude oil and refined products.
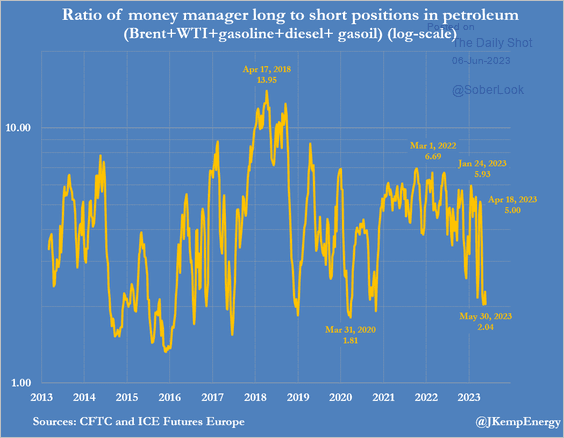 Source: @JKempEnergy
Back to Index
Equities
1. Let’s start with this remarkable chart of sector fund flows.
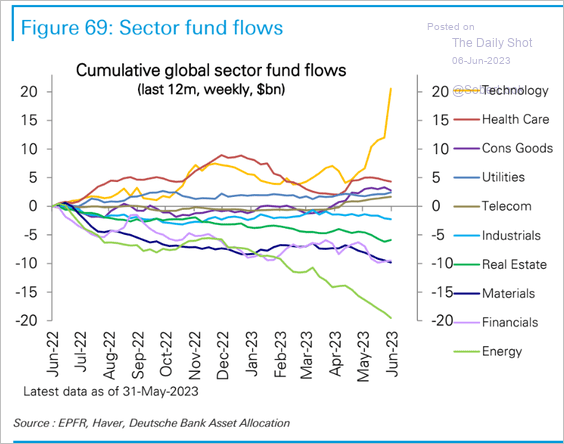 Source: Deutsche Bank Research
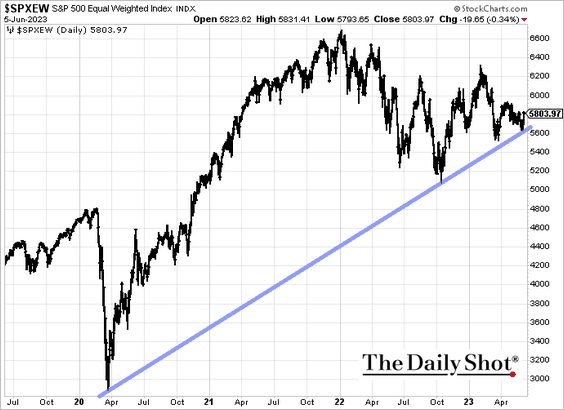
2. The S&P 500 equal-weighted index held the uptrend support.
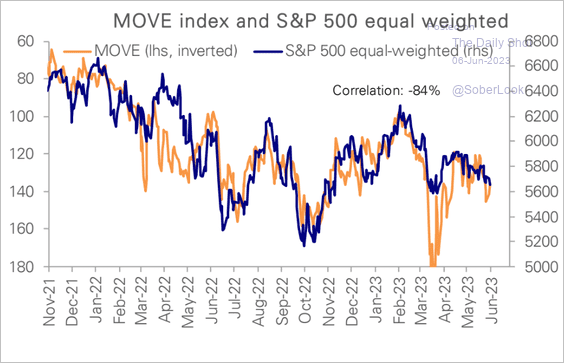
• The equal-weighted index is inversely correlated to Treasuries’ implied volatility index (MOVE).
 Source: Deutsche Bank Research
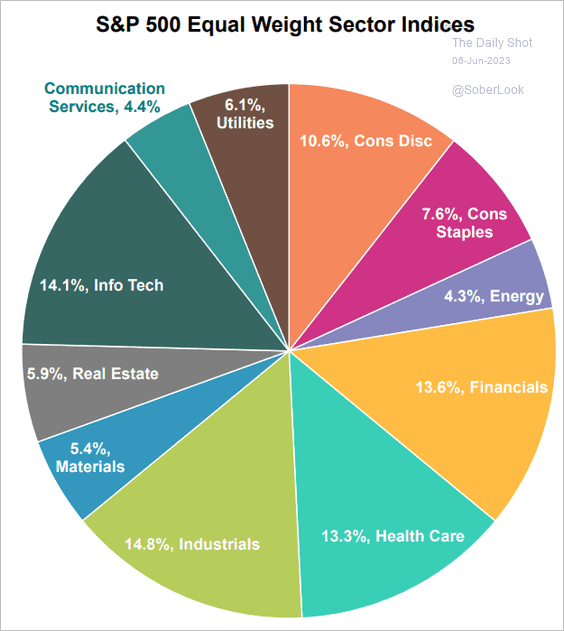
• What are the sector weights of the equal-weighted index?
 Source: S&P Dow Jones Indices
——————–
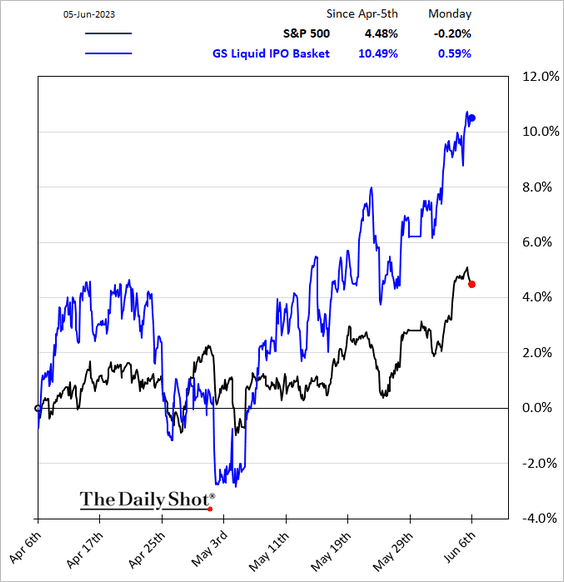
3. Post-IPO stocks have been outperforming.
4. S&P 500’s price/earnings ratio has fallen toward its 10-year average.
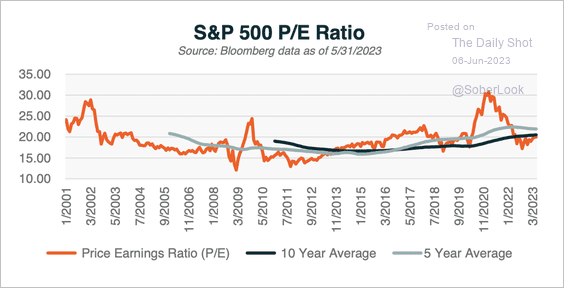 Source: Global X ETFs Read full article
5. The high relative market value of tech mega-caps looks stretched, given the level of Treasury yields.
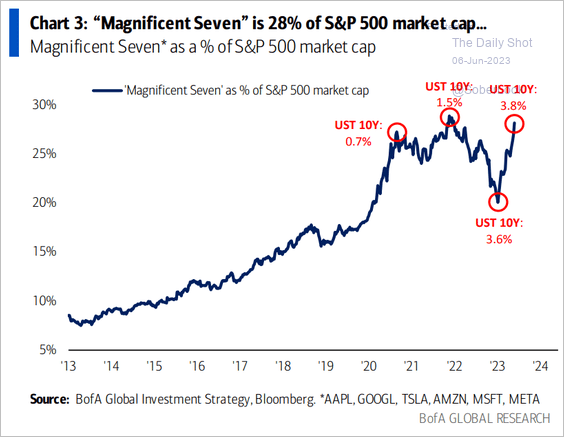 Source: BofA Global Research
6. Here is a look at market fear indicators.
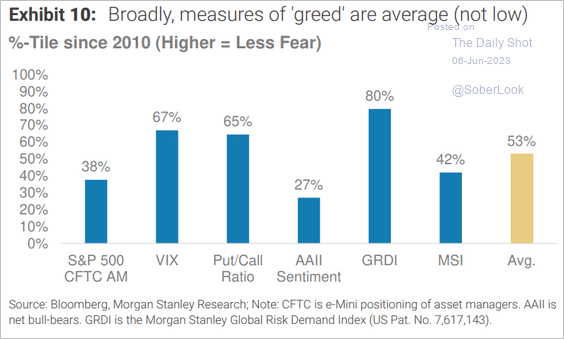 Source: Morgan Stanley Research
7. The S&P 500 forward PE to VIX ratio signals a growing pullback risk.
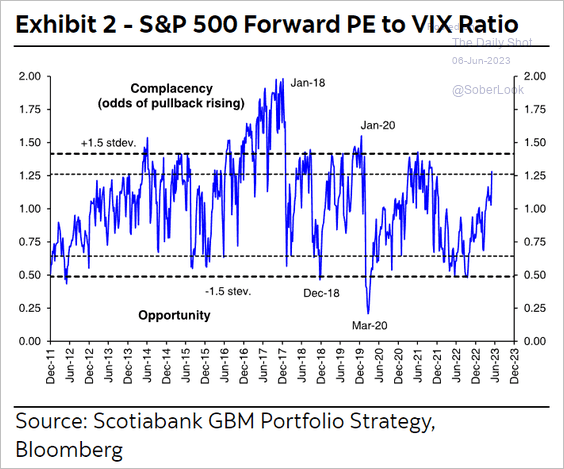 Source: Hugo Ste-Marie, Portfolio & Quantitative Strategy Global Equity Research, Scotia Capital
8. International markets have been underperforming the S&P 500.
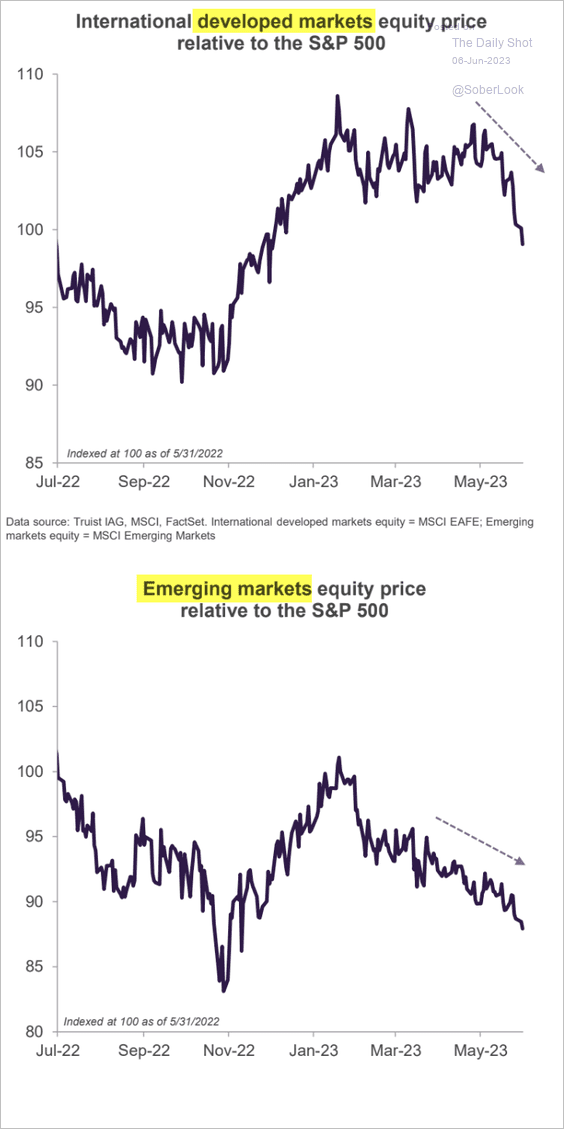 Source: Truist Advisory Services
Back to Index
Credit
1. The debt costs of sub-investment-grade firms have soared to their highest level since 2010.
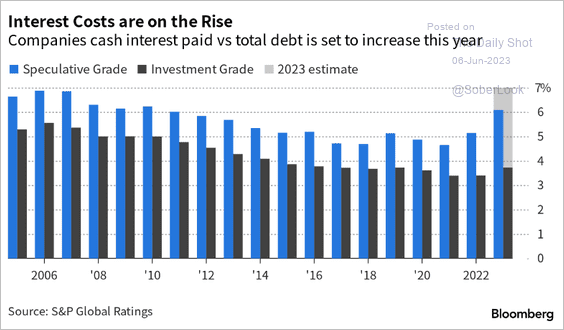 Source: Bloomberg Law Read full article
2. CMBS spreads remain elevated.
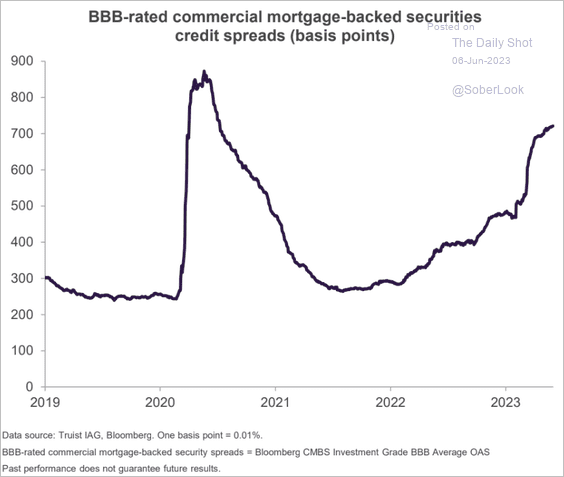 Source: Truist Advisory Services
Back to Index
Rates
1. The inverted yield curve makes the balanced portfolio carry unattractive relative to T-bills.
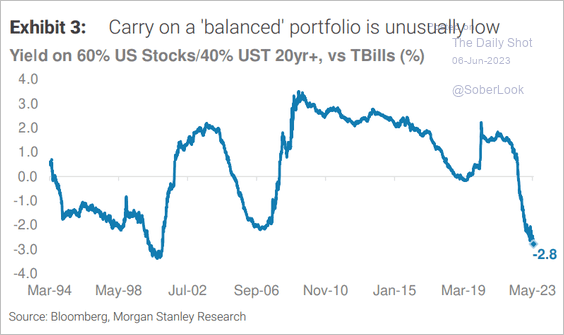 Source: Morgan Stanley Research
2. Treasury futures aggregate positioning remains exceptionally bearish.
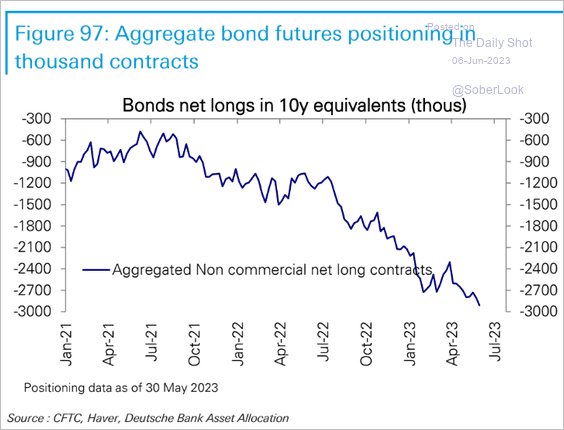 Source: Deutsche Bank Research
Back to Index
Global Developments
1. Moody’s expects policy rates to remain restrictive in the US, Europe, and the UK for most of next year.
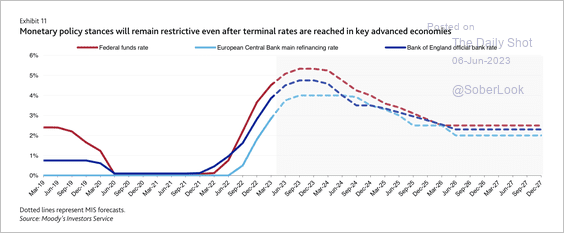 Source: Moody’s Investors Service
2. The global composite PMI index shows improving economic growth.
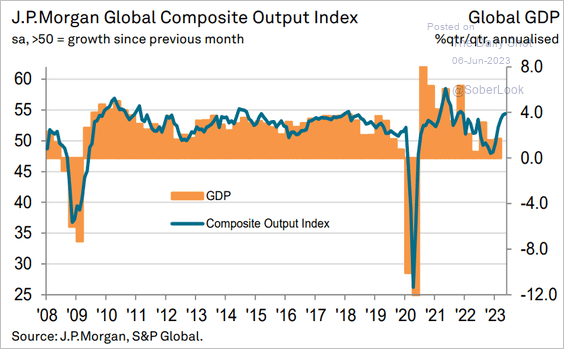 Source: S&P Global PMI
——————–
Food for Thought
1. States with high cybercrime-related losses:
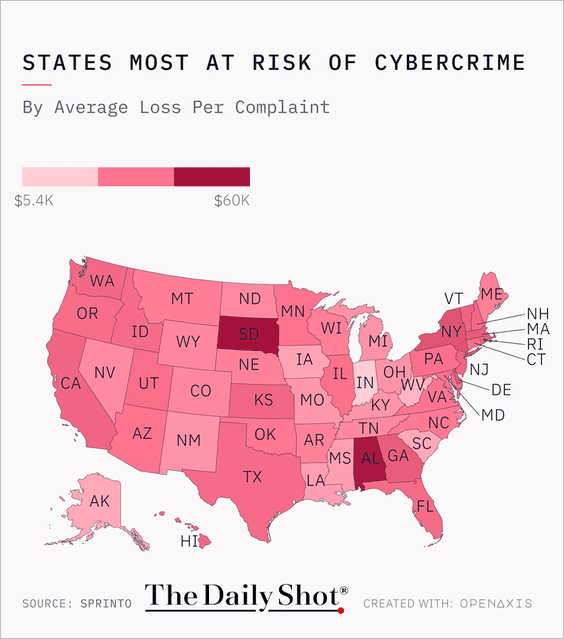 Source: @TheDailyShot
2. US mortgage originations by age:
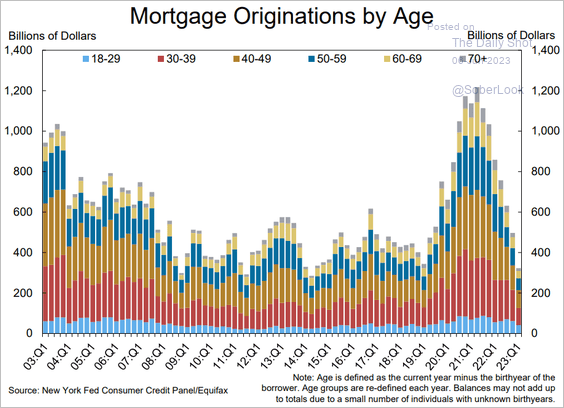 Source: Federal Reserve Bank of New York
3. US banks’ assets and liabilities:
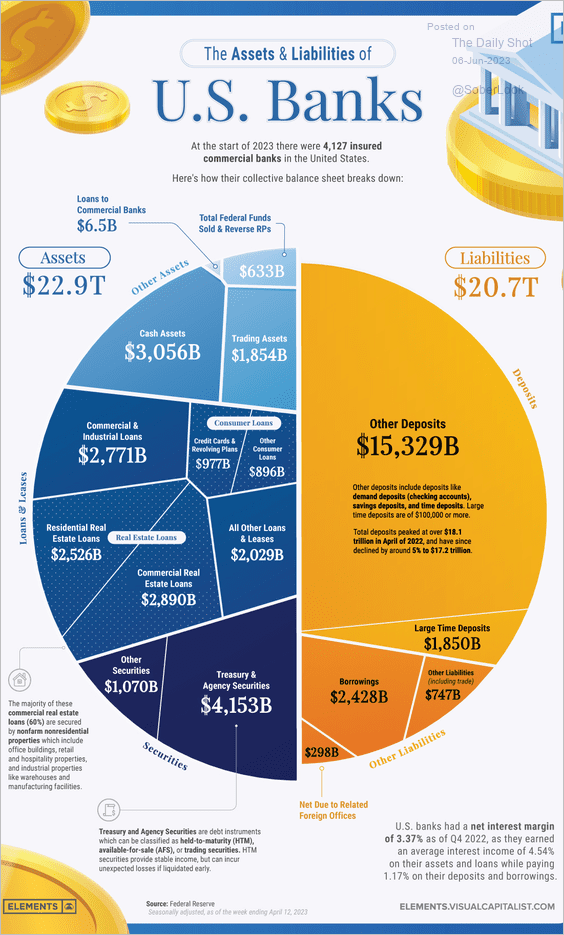 Source: Visual Capitalist Read full article
4. Concerns about gun violence at school:
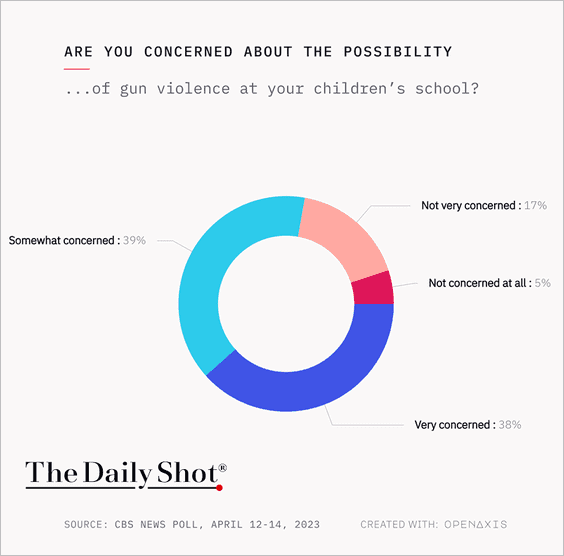 Source: @TheDailyShot
5. Adverse work outcomes due to menopausal symptoms:
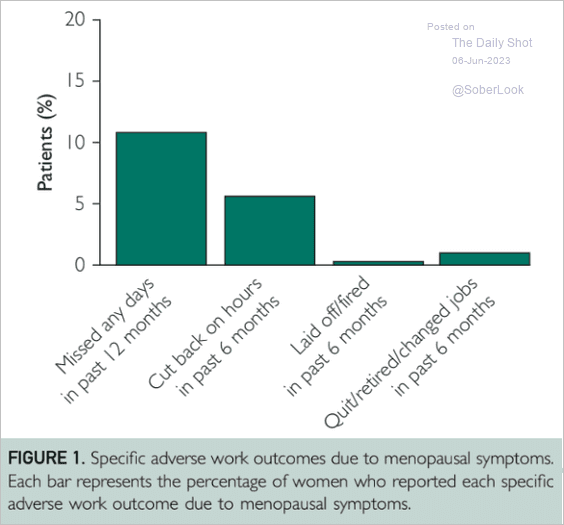 Source: Mayo Clinic
6. The most violent cities:
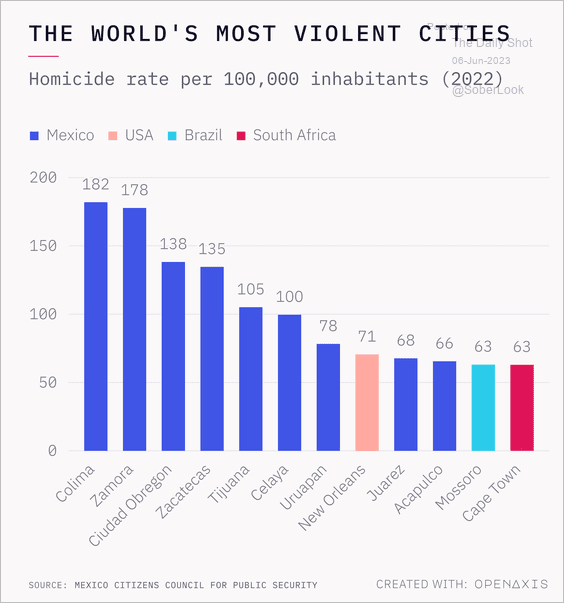 Source: @OpenAxisHQ
7. Quantum processors:
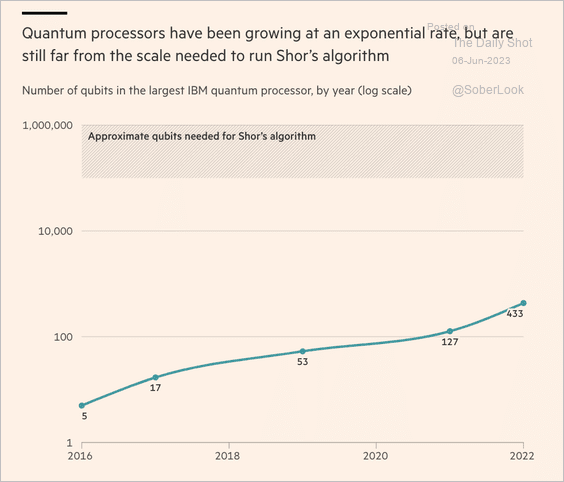 Source: @financialtimes Read full article Further reading
8. Ordering pizza:
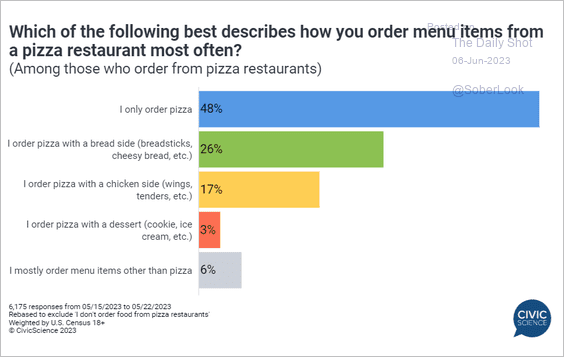 Source: @CivicScience Read full article
——————–
Back to Index