
The Daily Shot: 27-Jul-20
• Commodities
• Cryptocurrency
• Energy
• Equities
• Rates
• Emerging Markets
• China
• Asia – Pacific
• The Eurozone
• The United Kingdom
• The United States
• Global Developments
• Food for Thought
Commodities
1. Spot gold broke through the 2011 high this morning.
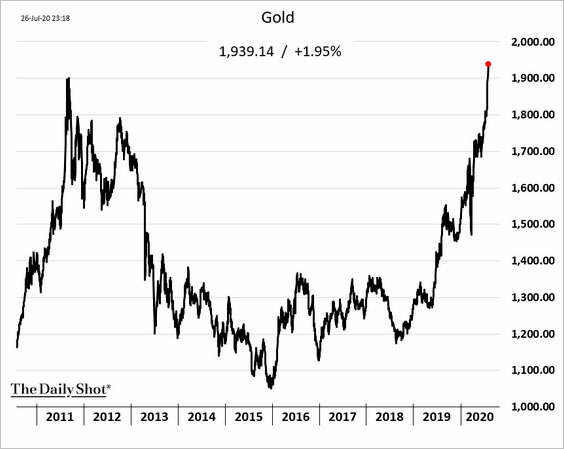
Below are some of the drivers of the latest rally.
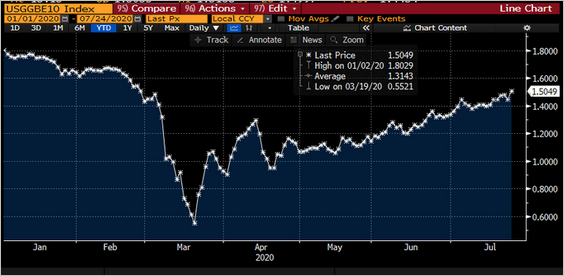
• Unprecedented monetary and fiscal stimulus has been boosting inflation expectations. Here is the US 10yr breakeven rate.
 Source: @lisaabramowicz1
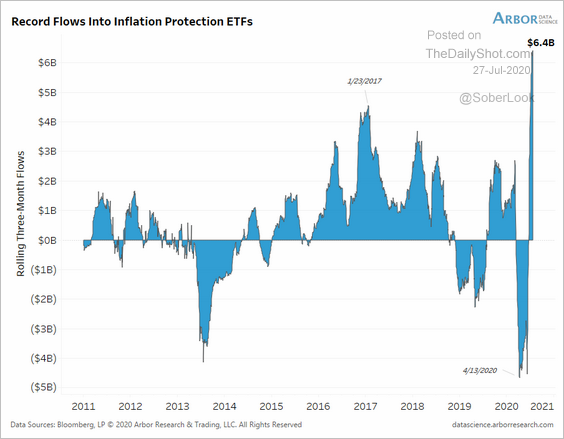
Positioning for higher inflation, investors are pouring capital into inflation-linked Treasuries (TIPS).
 Source: Arbor Research & Trading
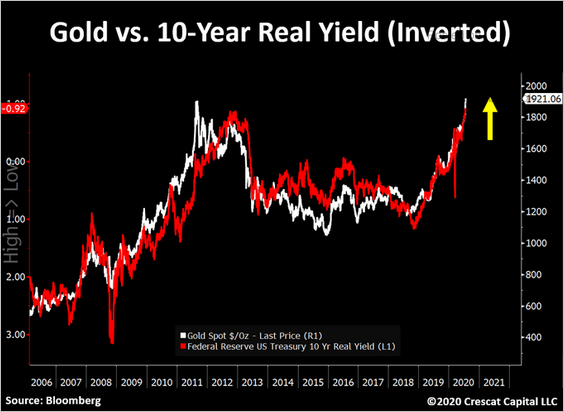
As a result, real rates are moving deeper into negative territory, supporting gold.
 Source: @TaviCosta
• The recent dollar weakness is another factor behind the rally.
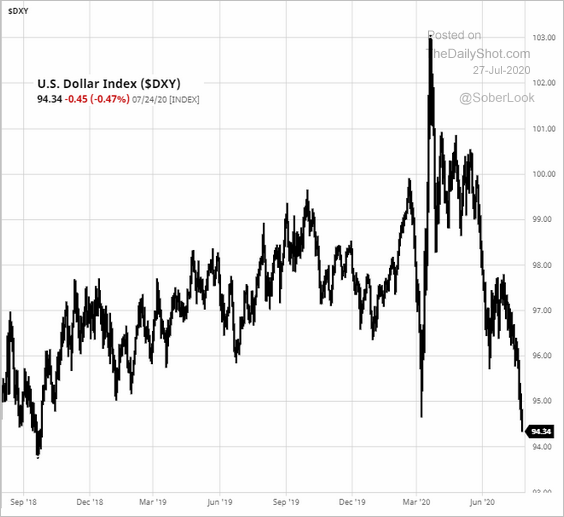 Source: barchart.com
Will the dollar continue to weaken? Asset managers keep increasing their bets against the US currency.
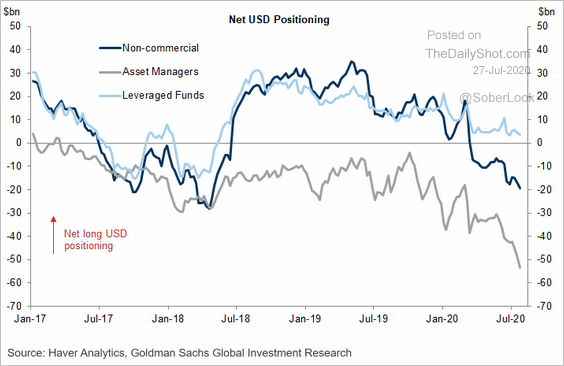 Source: Goldman Sachs
• Rising US-China tensions are also boosting demand for gold.
 Source: BBC Read full article
Goldman’s geopolitics tension barometer hit a new high.
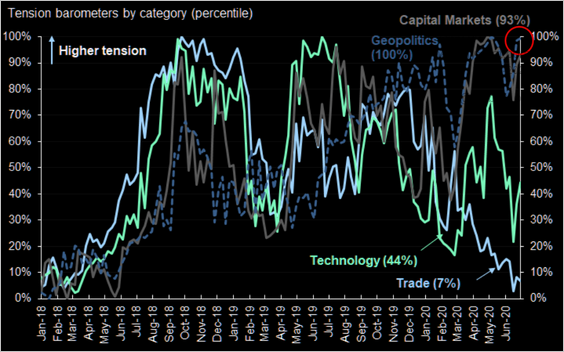 Source: Goldman Sachs, @themarketear
China will be further irritated by the possibility of the US expanding its relationship with Taiwan.
 Source: The Taipei Times Read full article
• Another factor boosting gold is a concern about a double-dip recession in the US. The drag on the recovery will come from the potential income cliff …
 Source: @axios Read full article
… and schools/daycare establishments remaining closed.
 Source: Barrons Read full article
As a result, the Fed’s balance sheet will expand further, …
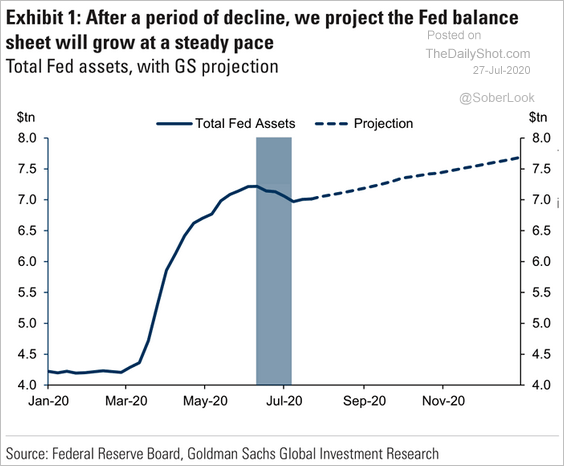 Source: @ISABELNET_SA, @GoldmanSachs
… with risks to the upside if the central bank is forced to fill the deficit gap.
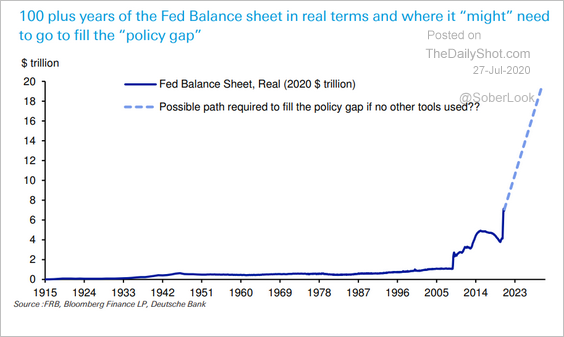 Source: Deutsche Bank Research
——————–
2. Next, we have some additional updates on precious metals.
• Adjusted for inflation, gold isn’t near record highs.
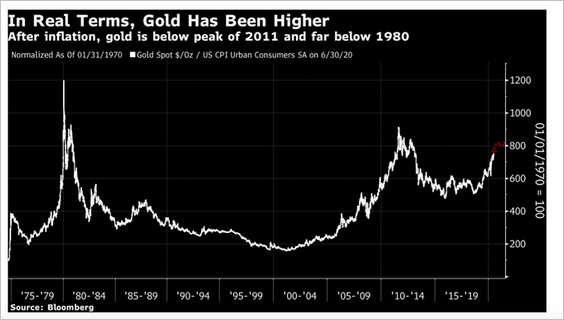 Source: @acemaxx, @JohnAuthers Read full article
• Technical indicators suggest that the gold rally is stretched.
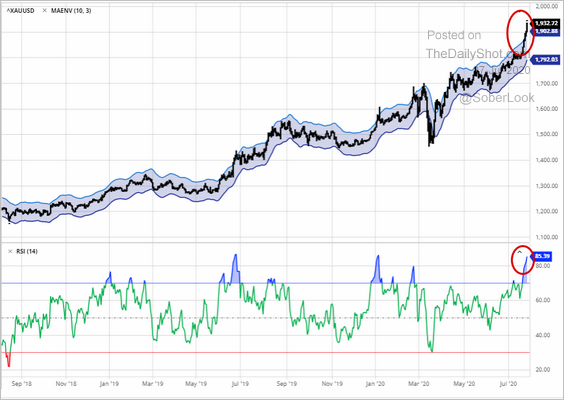 Source: barchart.com
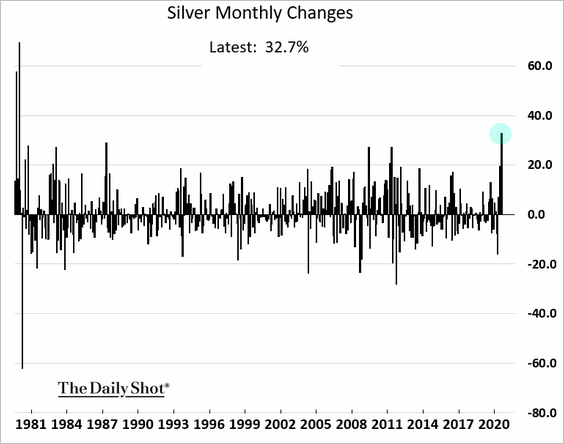
• The rally in silver has been impressive.
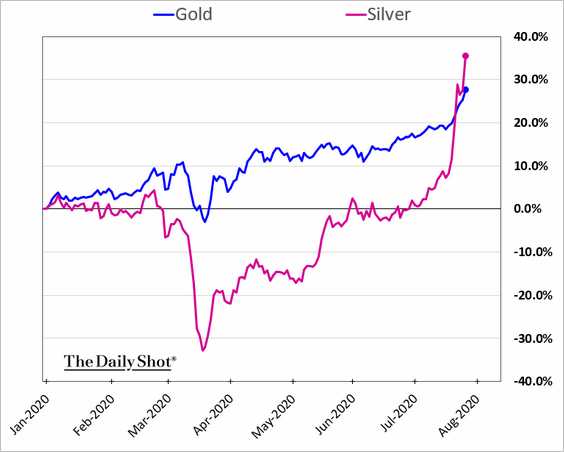
Silver hasn’t had a month this strong since the Hunt Brothers tried to corner the market.
The silver miners ETF (SIL) saw its largest inflows on record.
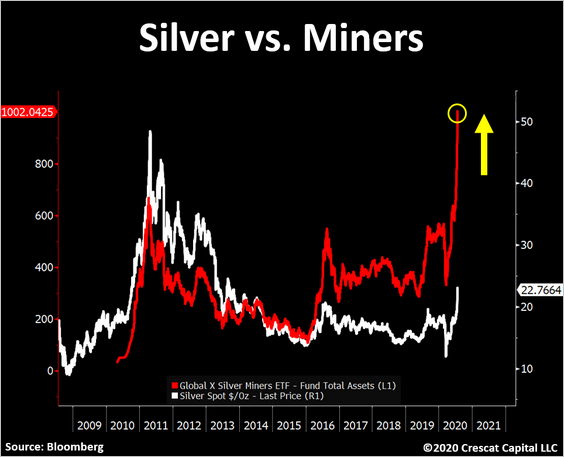 Source: @TaviCosta
——————–
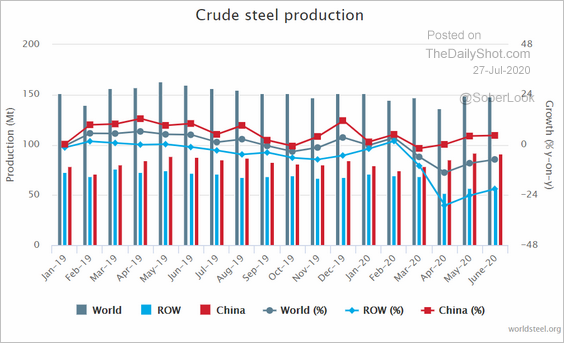
3. Global steel production (ex-China) is gradually recovering but remains well below pre-crisis levels.
 Source: World Steel Association
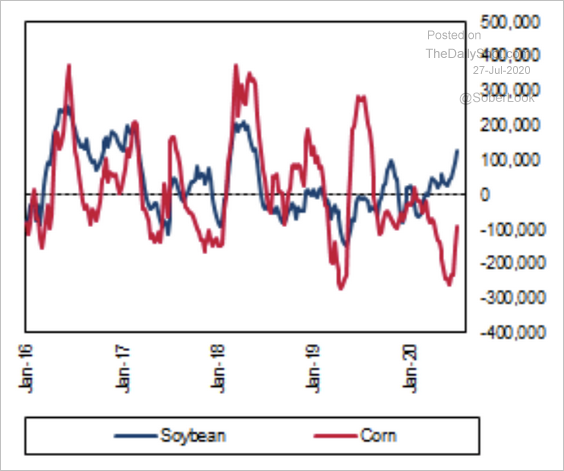
4. Speculative accounts have boosted their bets on US soybean futures and cut back their short positions in corn.
 Source: Fitch Solutions Macro Research
Cryptocurrency
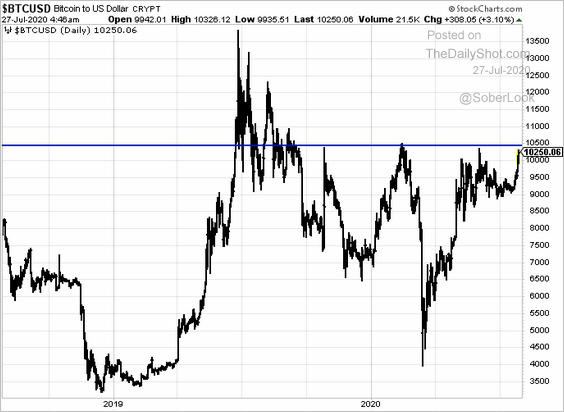
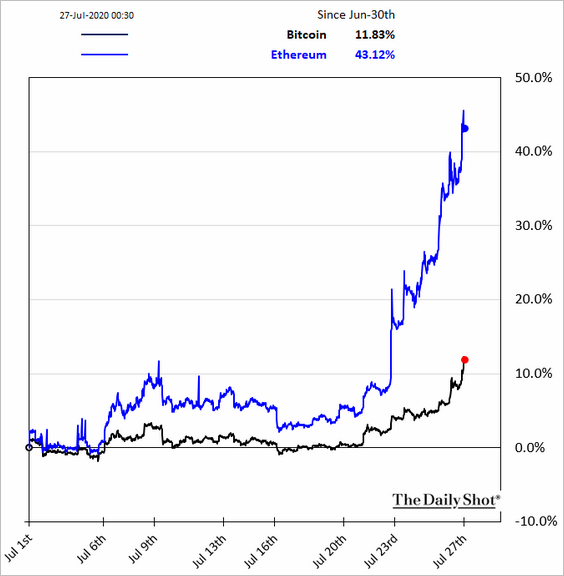
Cryptos are rallying with gold as Bitcoin blasts past $10k. The next resistance level is $10.5K.
Etherium continues to outperform.
Energy
1. The US rig count rose last week for the first time since March.
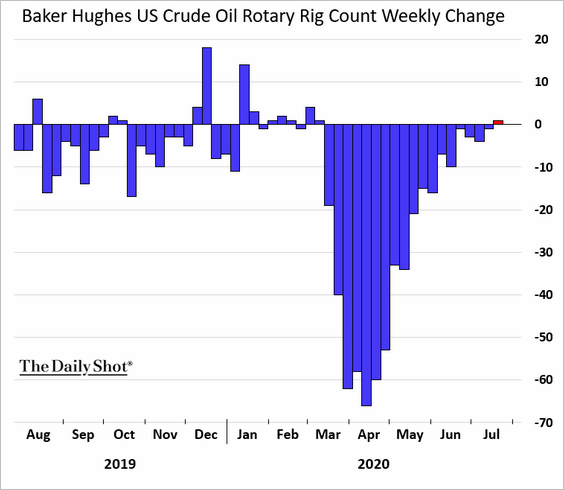
Production is rebounding.
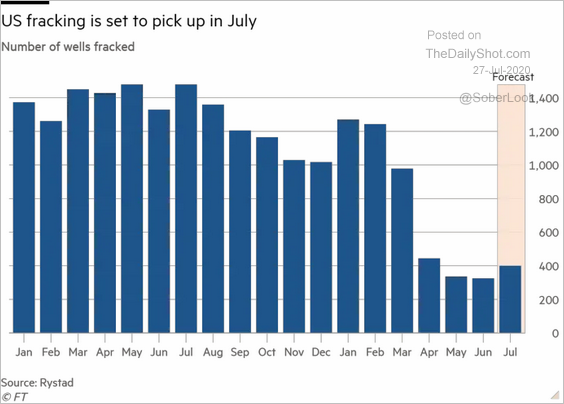 Source: @financialtimes Read full article
——————–
2. US natural gas rig productivity accelerated as prices fell.
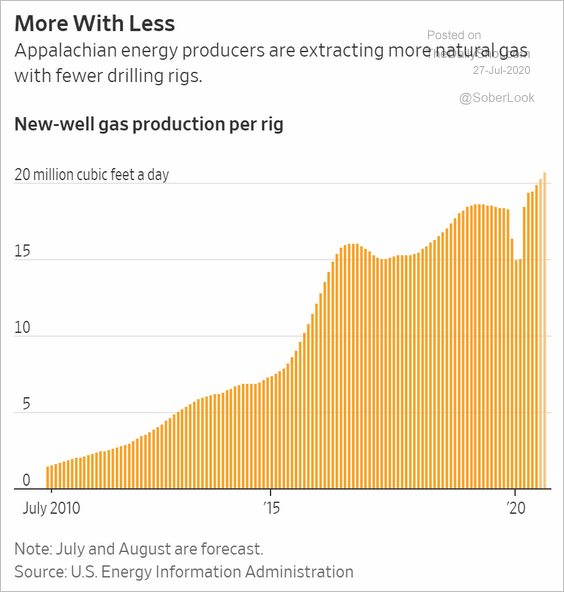 Source: @WSJ Read full article
Equities
1. Insiders have been selling into the rally.
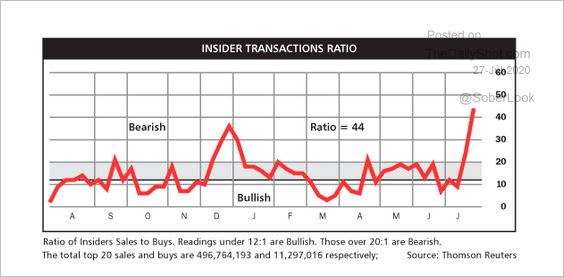 Source: @hmeisler, @DiMartinoBooth
The Nasdaq Composite has diverged from insider sentiment.
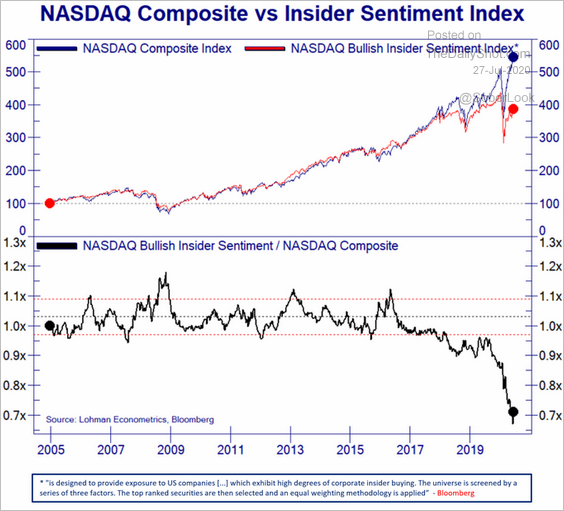 Source: @Not_Jim_Cramer
——————–
2. Market breadth has been weak.
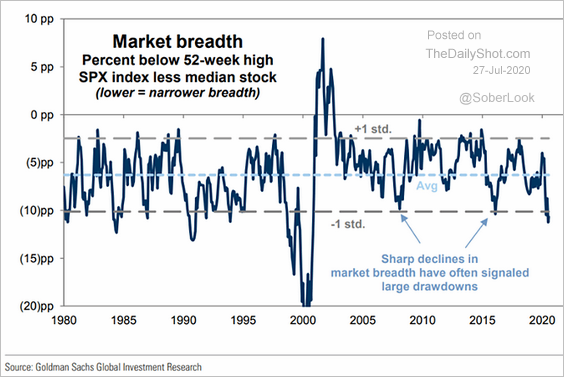 Source: @ISABELNET_SA, @GoldmanSachs
3. The NYSE trading volume hit the lowest level since mid-March.
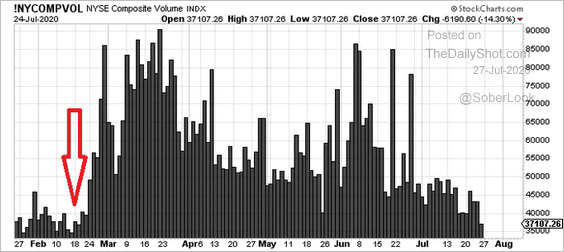 Source: @hmeisler
4. The Citi sentiment index is holding in “euphoria” territory.
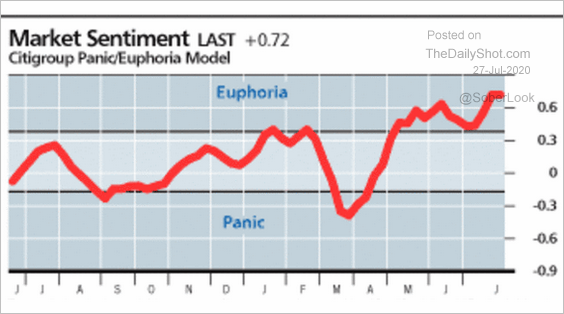 Source: @hmeisler
5. Related to the above, single-stock options volumes are outpacing share trading.
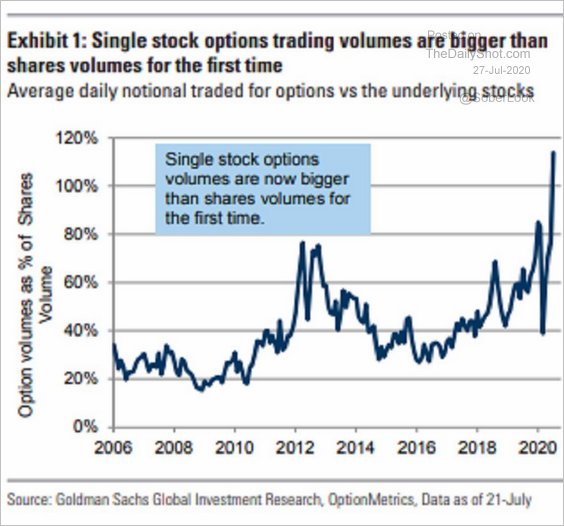 Source: @LizAnnSonders, @GoldmanSachs, @OptionMetrics
6. ETF flows into equities have slowed, as bond investment picks up.
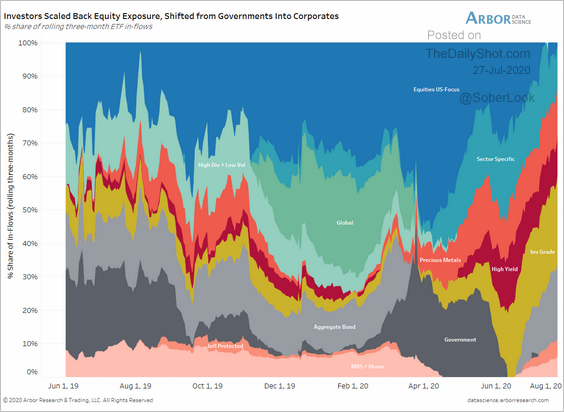 Source: Arbor Research & Trading
7. The “all-weather portfolio” (25/25/25/25 in stocks, bonds, cash, and gold) is up 18% over the past 90 days.
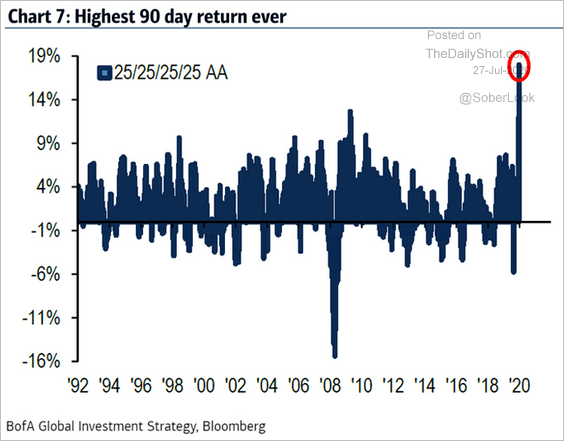 Source: @ISABELNET_SA, @BofAML
8. Tech concentrations are not yet near record highs. It’s the tech mega-caps that are at extreme levels.
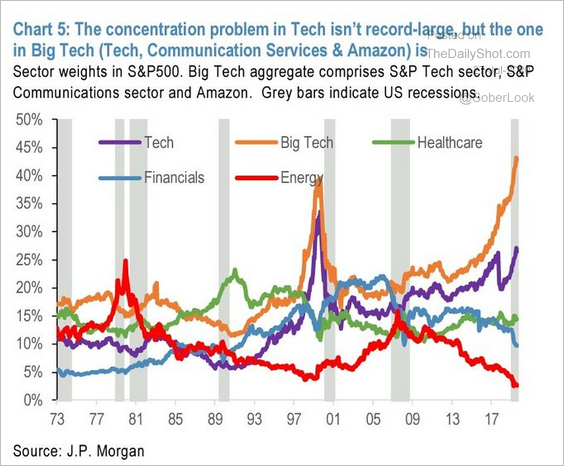 Source: JP Morgan, @chigrl
9. These charts show earnings and revenue surprises for the Q2 results thus far.
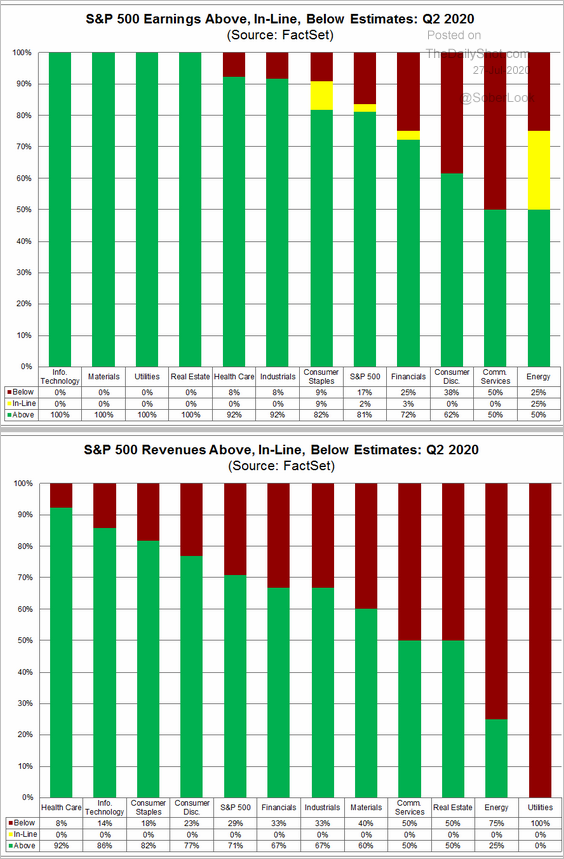 Source: @FactSet Read full article
Rates
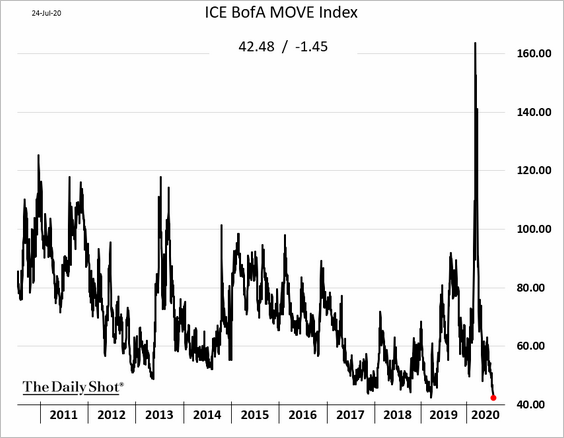
1. Treasury implied volatility index (MOVE) hit a record low. Complacency is setting in again.
2. The surge in the US economic surprise index hasn’t done much to support the long-end of the Treasury yield curve (2 charts).
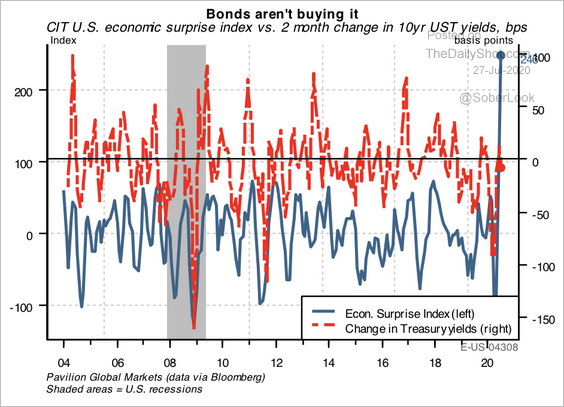 Source: Pavilion Global Markets
——————–
3. The 10yr Treasury yield is holding support.
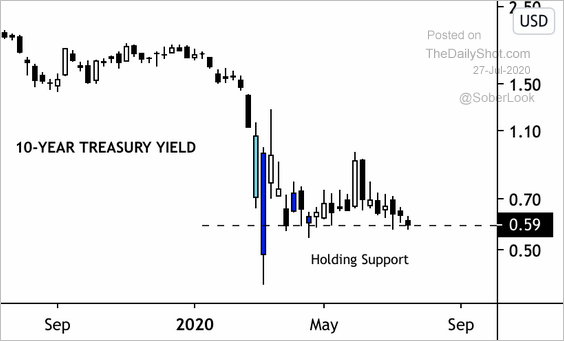 Source: @DantesOutlook
4. The market continues to price in some probability that the Fed will take rates into negative territory.
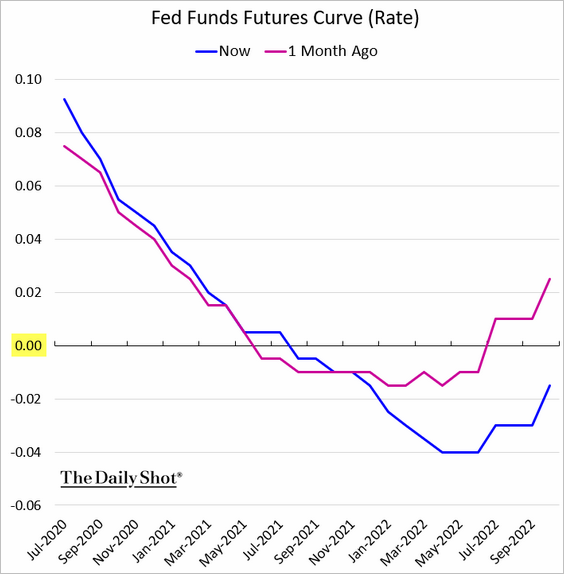
What about a rate hike? Here is what economists think.
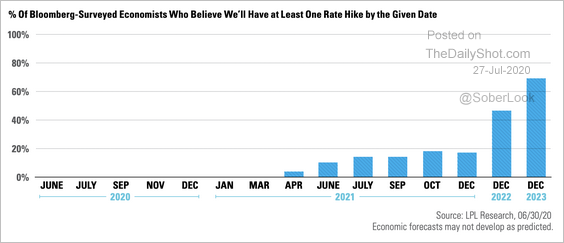 Source: LPL Research
Emerging Markets
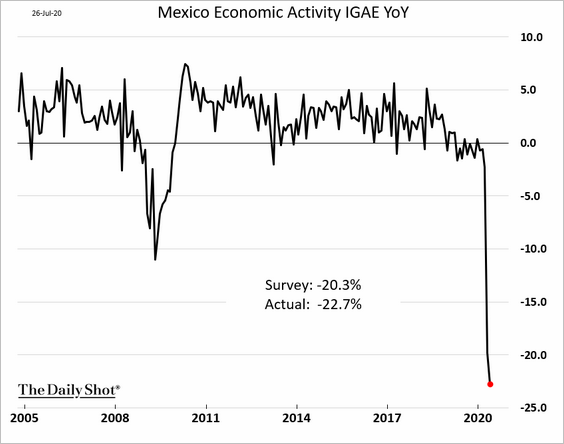
1. Mexico’s economic contraction worsened in May. It will take a while to dig out of this hole.
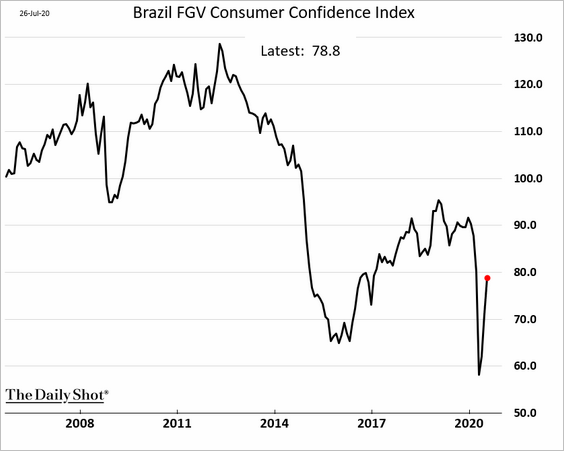
2. Brazil’s consumer sentiment rebounded in July.
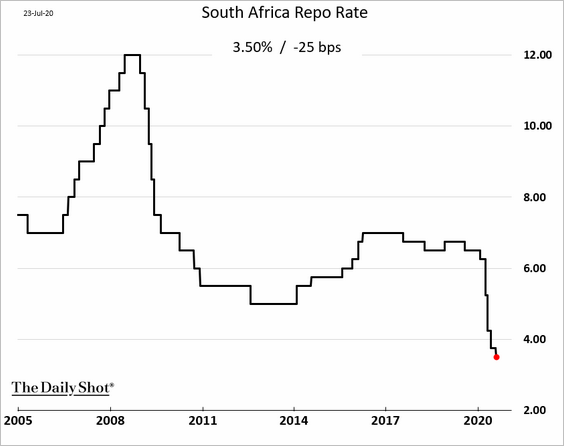
3. South Africa’s central bank cut rates again last week.
4. Russia’s central bank has been reducing rates as the economy stalls.
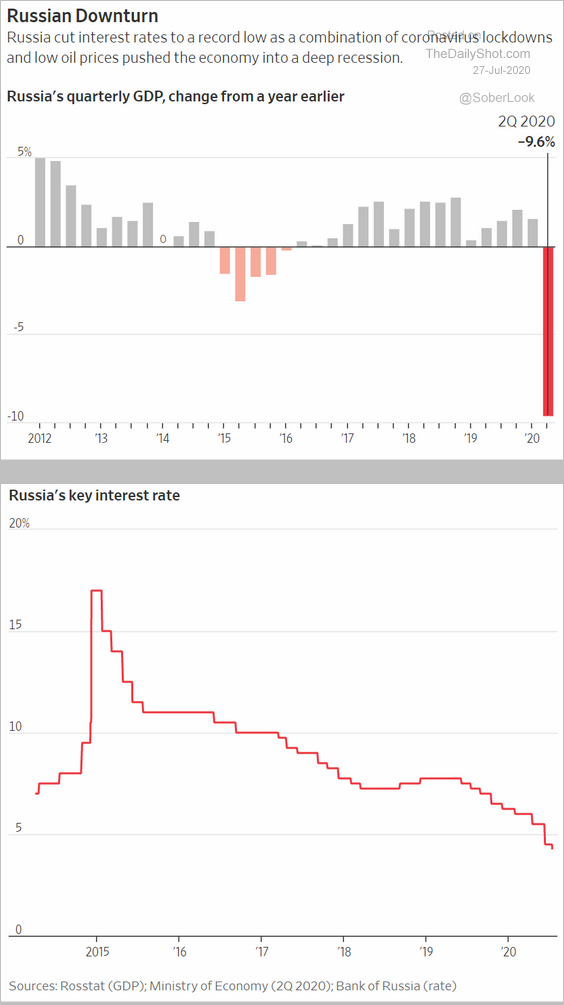 Source: @WSJ Read full article
5. The number of visitors to Turkey held near zero last month.
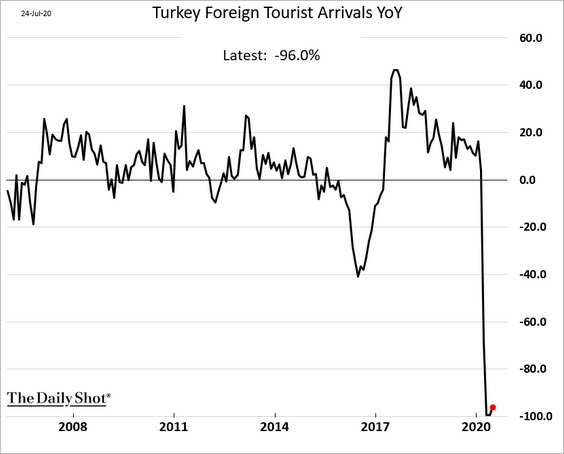
Separately, foreign investors have been getting out of local Turkish bonds.
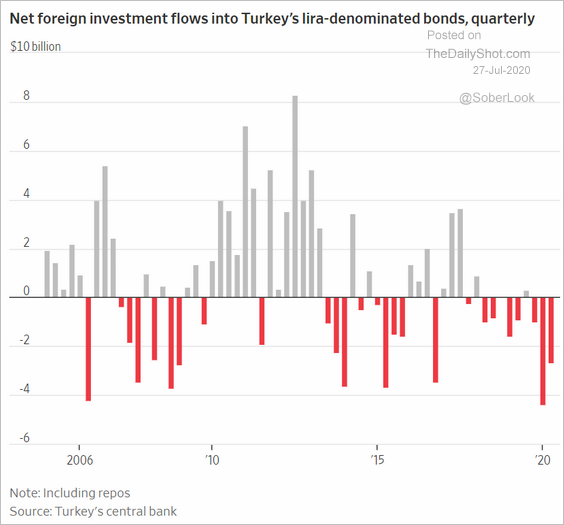 Source: @WSJ Read full article
China
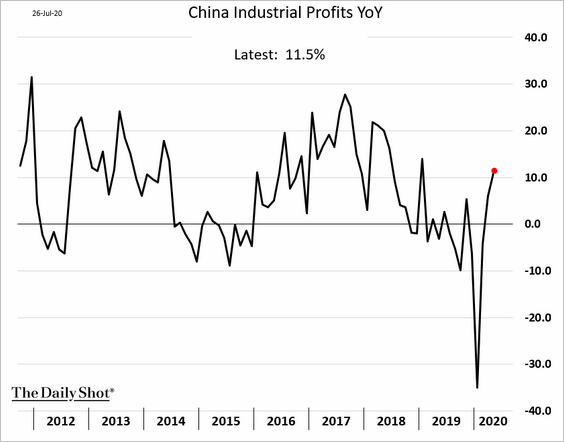
1. Industrial profits continue to rebound.
2. Money supply growth has been weak relative to historical trends.
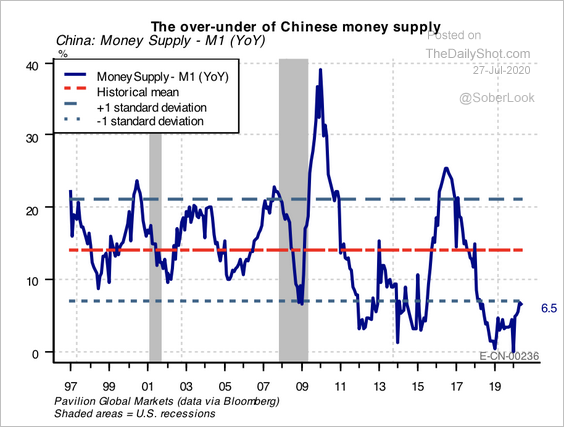 Source: Pavilion Global Markets
3. China-domiciled funds saw some outflows in recent days.
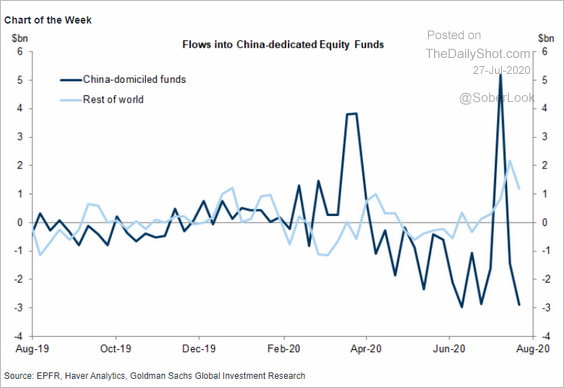 Source: Goldman Sachs
4. Mainland companies dominate Hong Kong’s stock market.
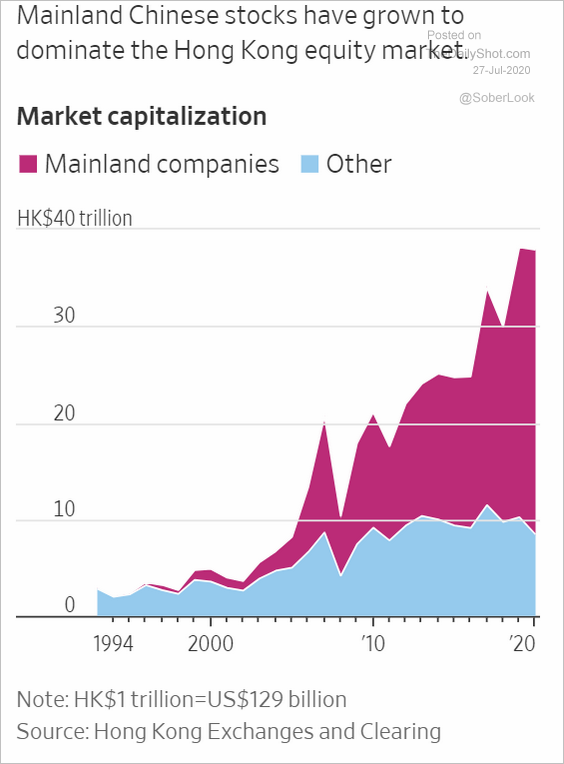 Source: @WSJ Read full article
5. Vacancies in Hong Kong’s shopping districts have been rising.
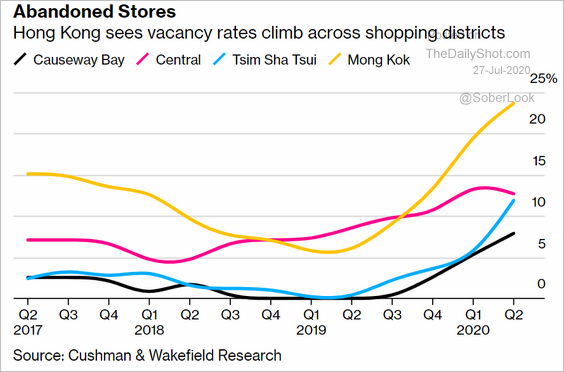 Source: @business Read full article
Asia – Pacific
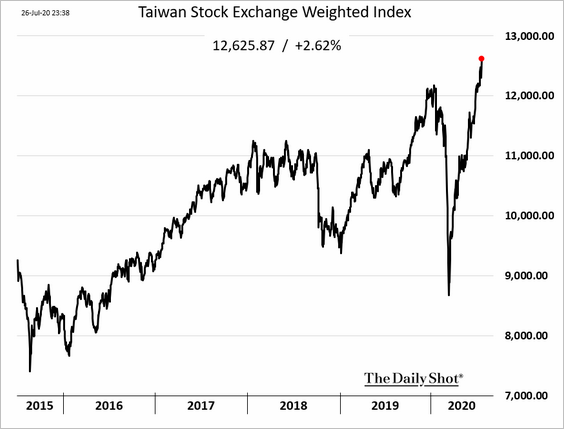
1. Taiwan’s stock market is soaring, partially supported by a potential shift in US policy (see the commodities section).
2. South Korea’s property prices jumped following the Bank of Korea’s rate cuts.
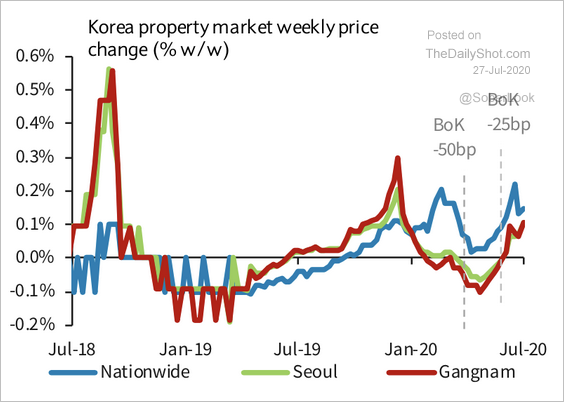 Source: Barclays Research
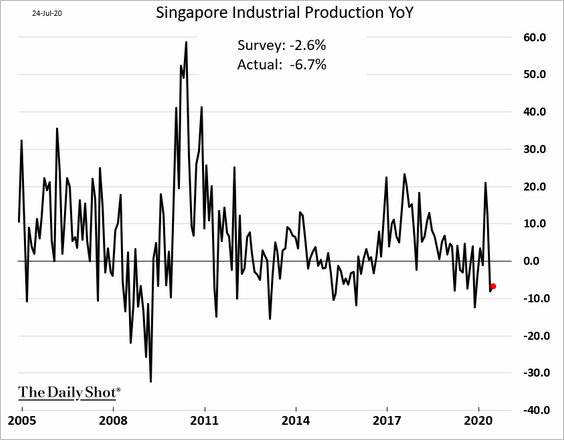
3. Singapore’s industrial production surprised to the downside.
4. Shipbuilding orders from Asia have slowed.
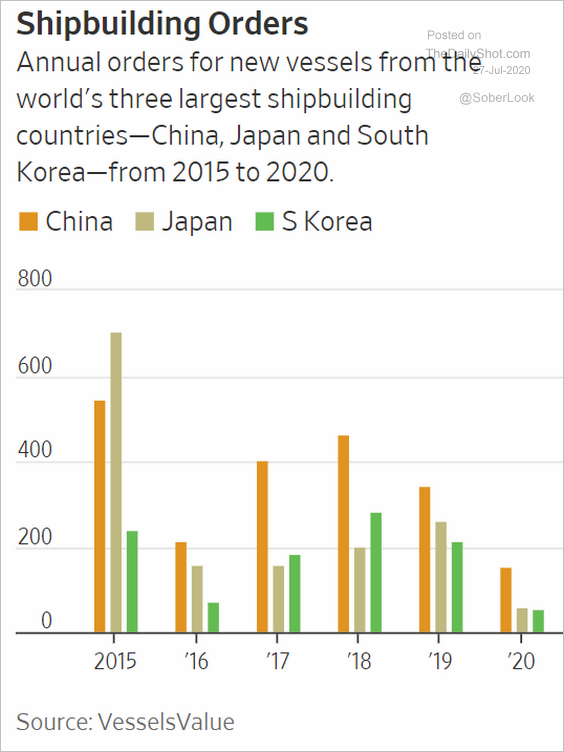 Source: @WSJ Read full article
5. Australia is facing a substantial income cliff.
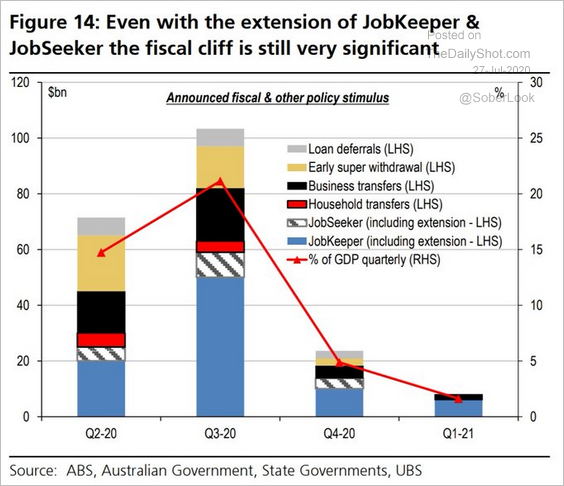 Source: @Scutty
At the same time, new cases in Victoria keep rising.
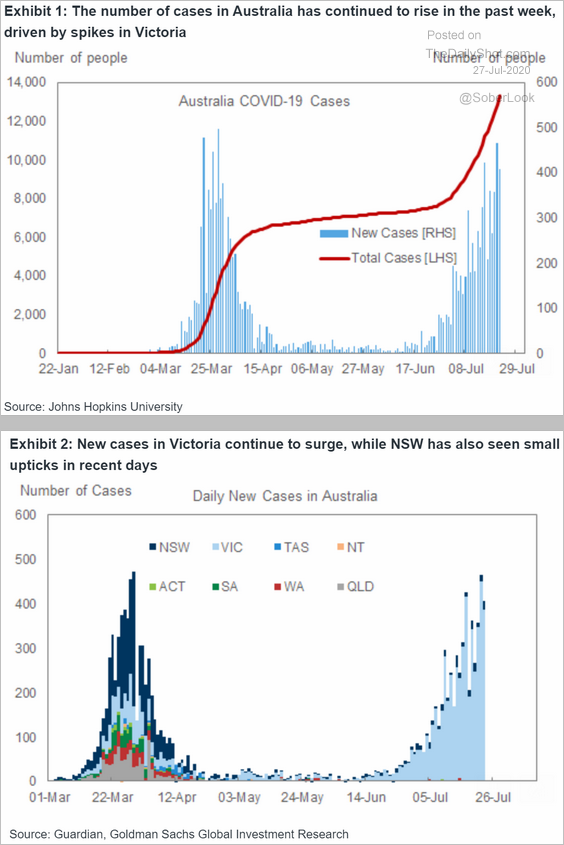 Source: Goldman Sachs
The Eurozone
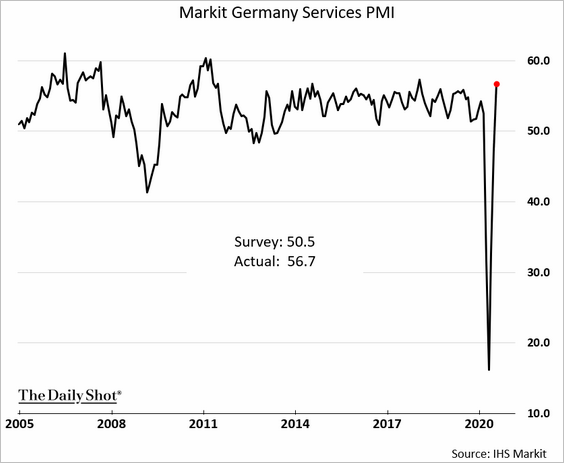
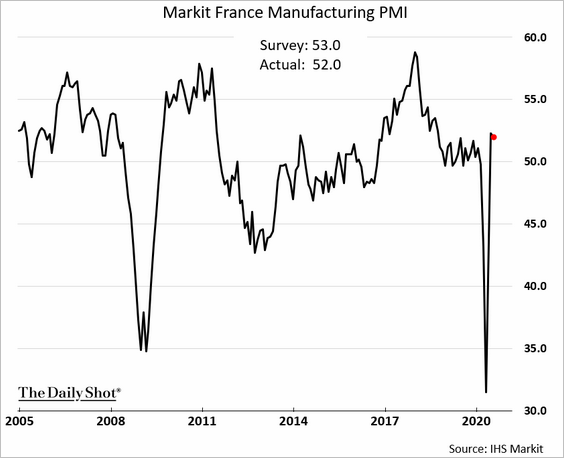
1. The July preliminary PMI reports surprised to the upside, with gains driven mostly by services.
• Germany:
– Manufacturing (no longer contracting):

– Services:
– Composite output PMI:
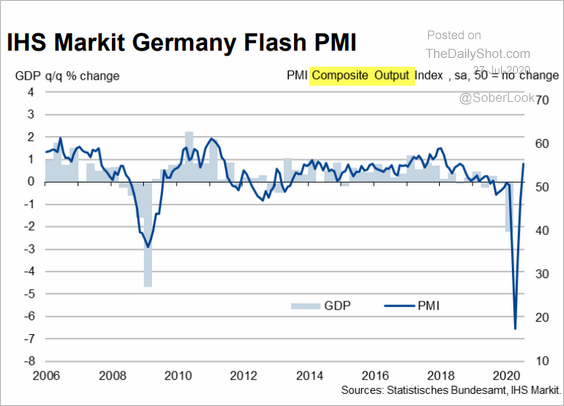 Source: @IHSMarkitPMI Read full article
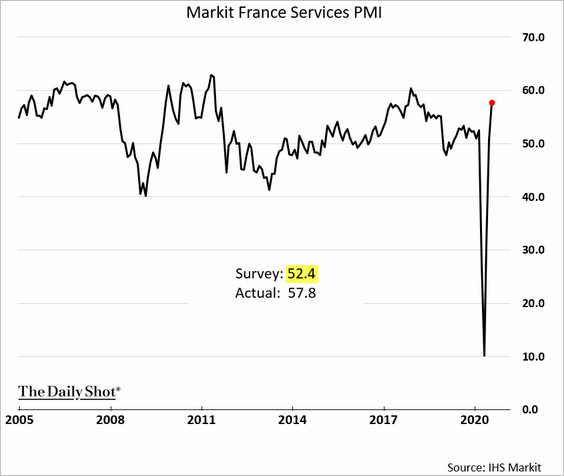
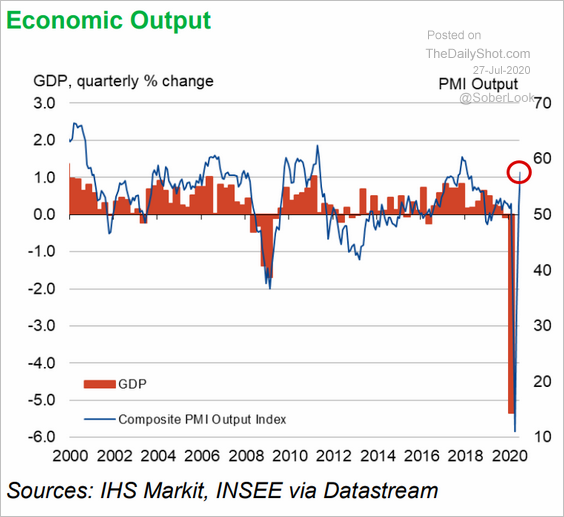
• France:
– Manufacturing (still expanding):
• Services:
• Composite output:
 Source: @IHSMarkitPMI Read full article
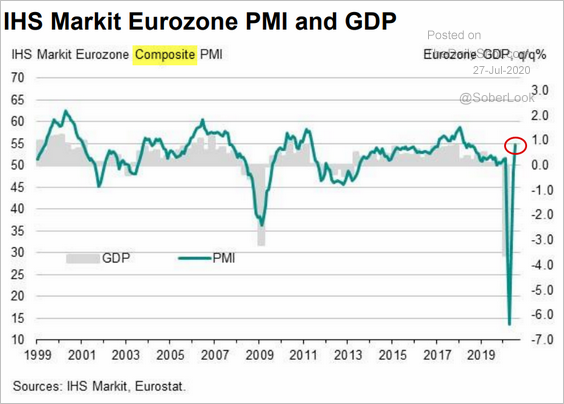
• Eurozone composite PMI:
 Source: @IHSMarkitPMI Read full article
——————–
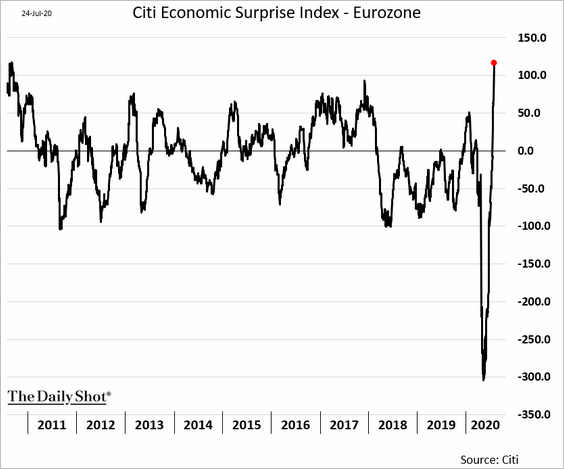
2. The Citi Economic Surprise index hit the highest level in nearly a decade.
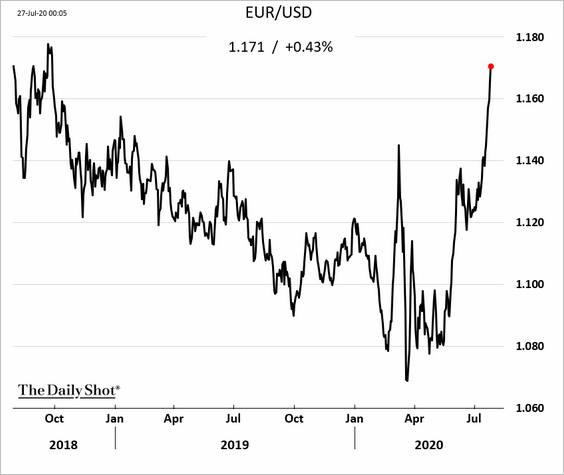
3. The euro is soaring:
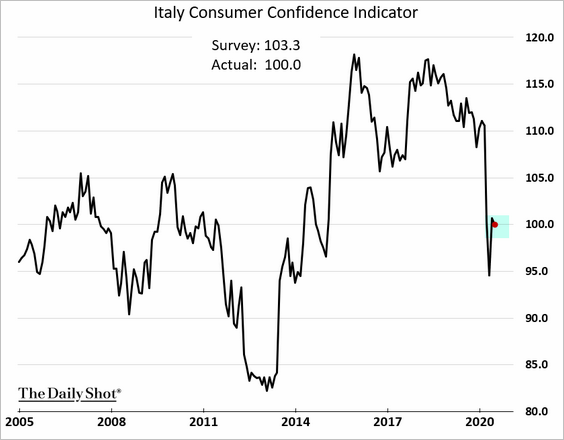
4. Italian consumer sentiment unexpectedly weakened this month.
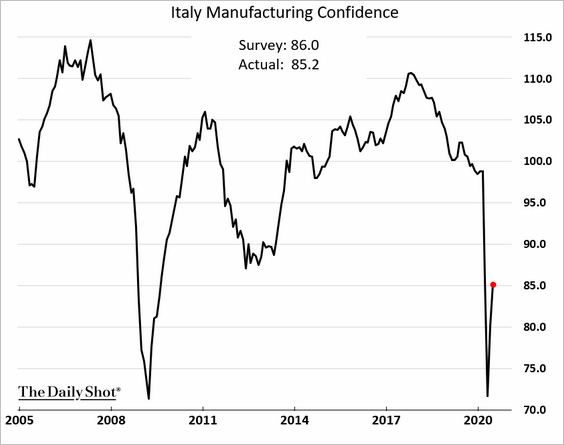
Manufacturing confidence is recovering from extreme lows.
The United Kingdom
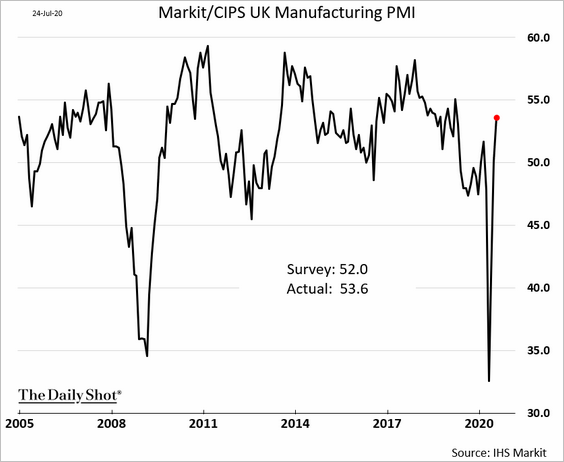
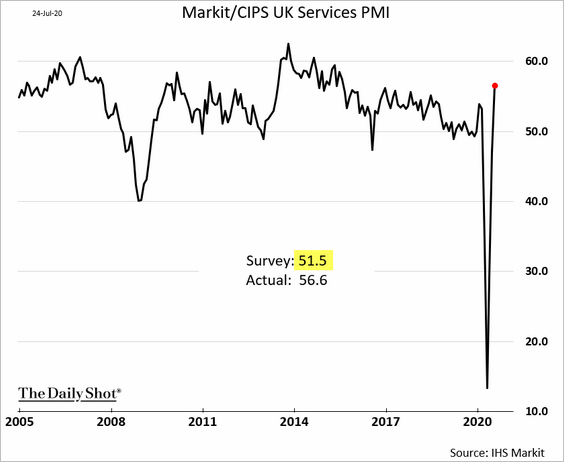
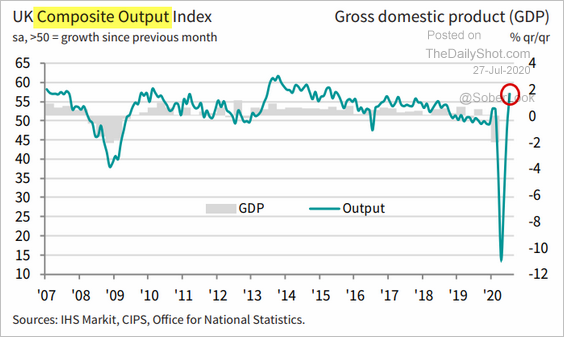
1. The UK Markit PMI report also surprised to the upside.
• Manufacturing:
• Services:
• Composite:
 Source: @IHSMarkitPMI Read full article
However, the labor market remains weak.
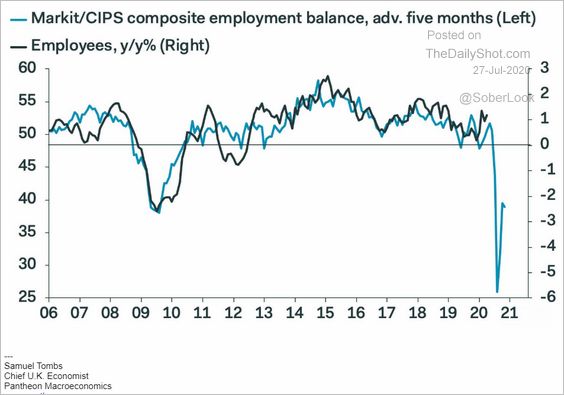 Source: Pantheon Macroeconomics
——————–
2. The UK’s mobility trends are still lagging that of other European economies.
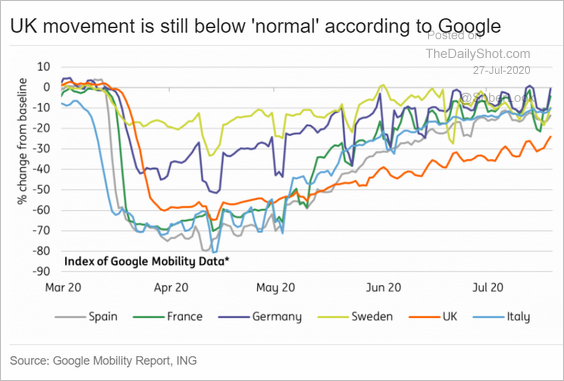 Source: ING
3. Support for Scottish independence has risen.
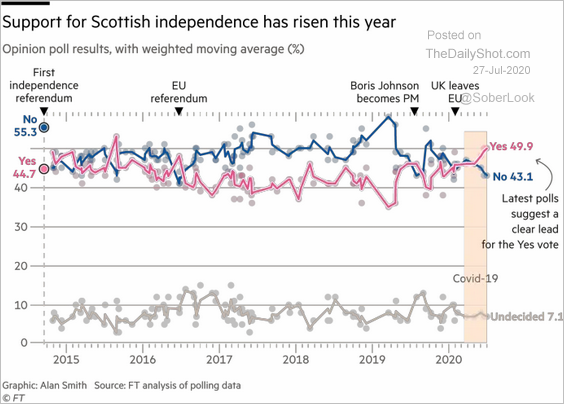 Source: @financialtimes Read full article
The United States
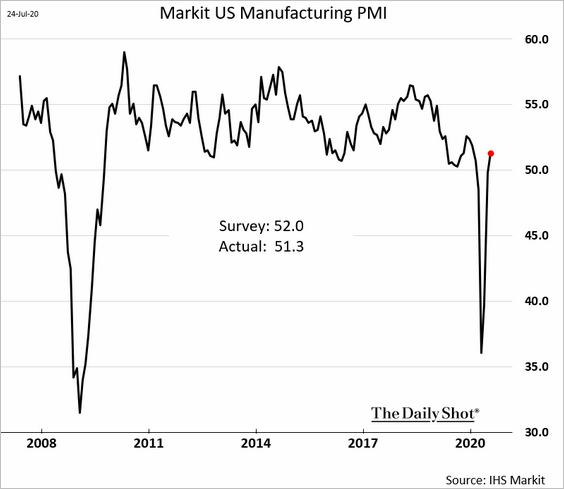
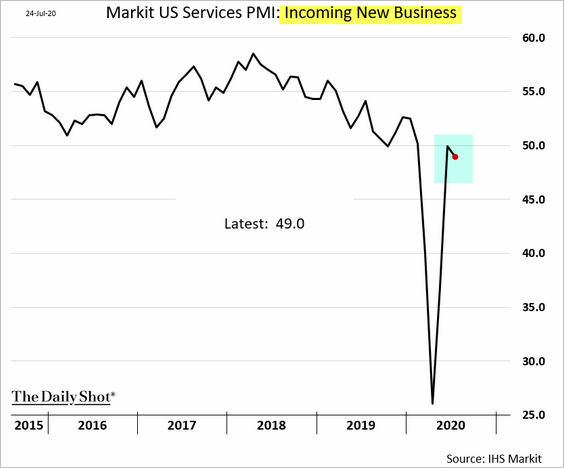
1. Markit manufacturing PMI continues to show expansion (PMI > 50).
However, the nation’s service-sector activity is still soft.
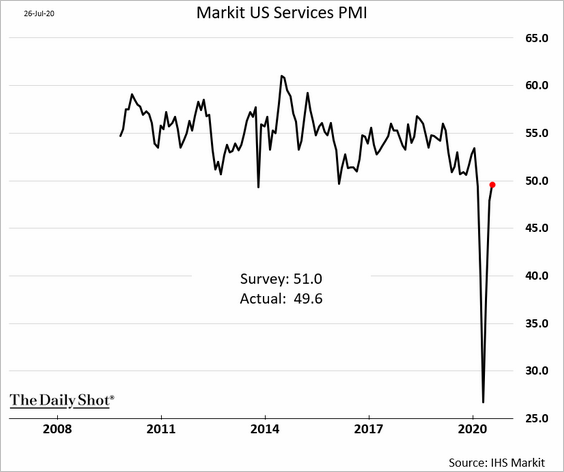
The index of new business dipped in July.
——————–
2. Models point to new coronavirus cases peaking over the next couple of weeks.
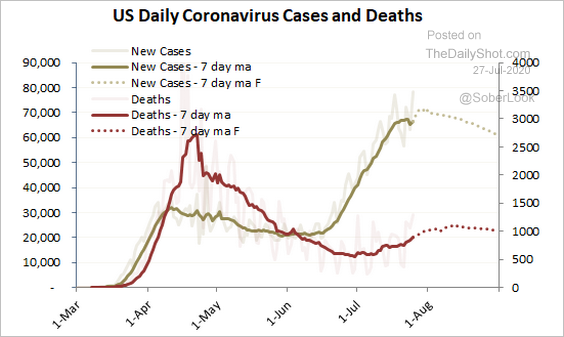 Source: Princeton Energy Advisors
But the reopening will be uneven.
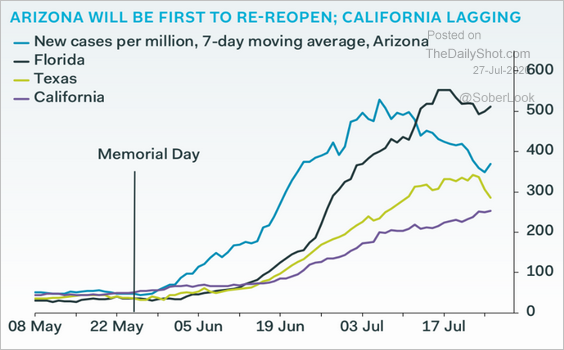 Source: Pantheon Macroeconomics
——————–
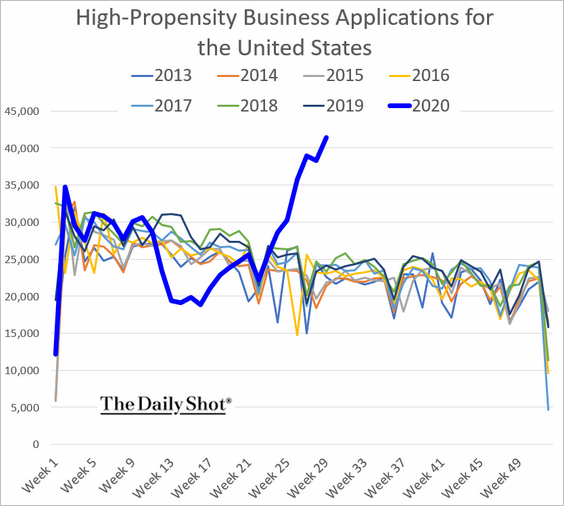
3. Business applications are soaring.
4. Need your credit card limit increased? The latest NY Fed’s survey points to a higher rate of rejections.
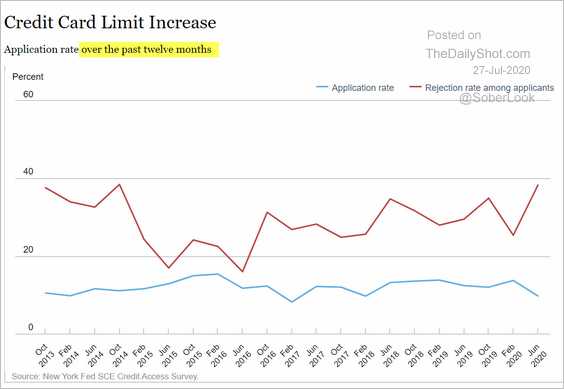 Source: NY Fed
5. This chart shows consumer spending trends by sector.
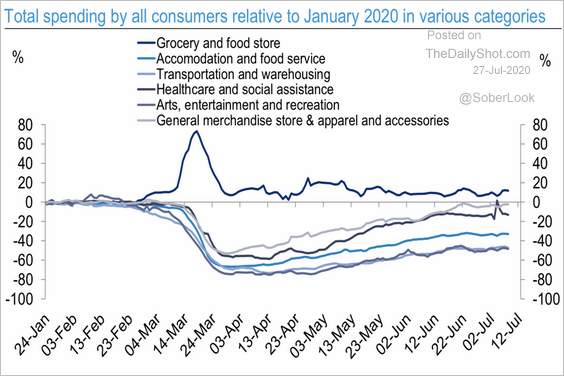 Source: Deutsche Bank Research
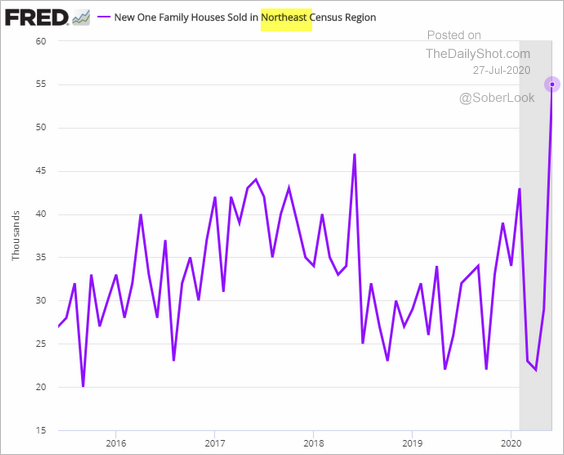
6. New home sales topped economists’ forecasts.
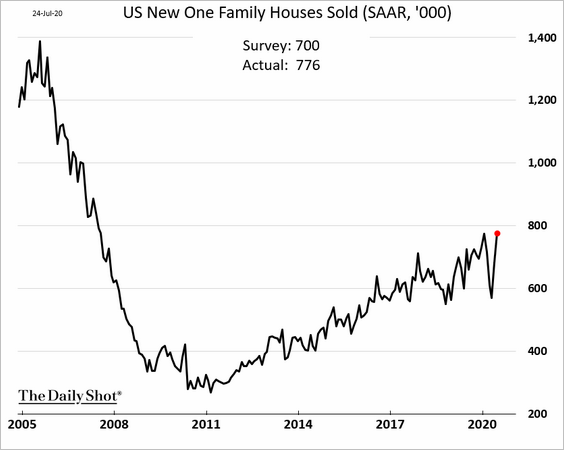
 Source: HW Read full article
Here is the trend without seasonal adjustments.
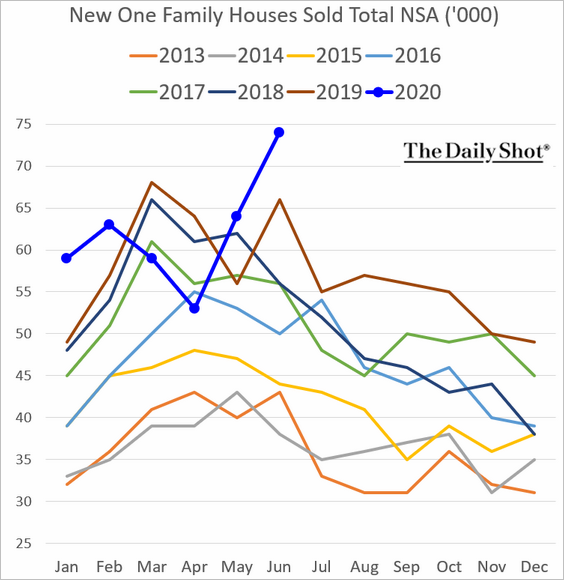
Seales in the Northeast were especially strong.
Global Developments
1. Let’s start with the share of COVID fatalities in advanced vs. emerging countries.
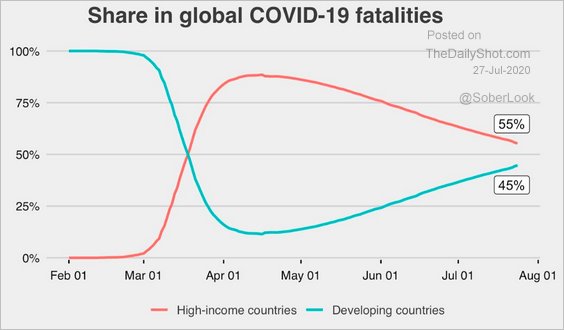 Source: Philip Schellekens (World Bank)
2. Here is the status of school openings around the world.
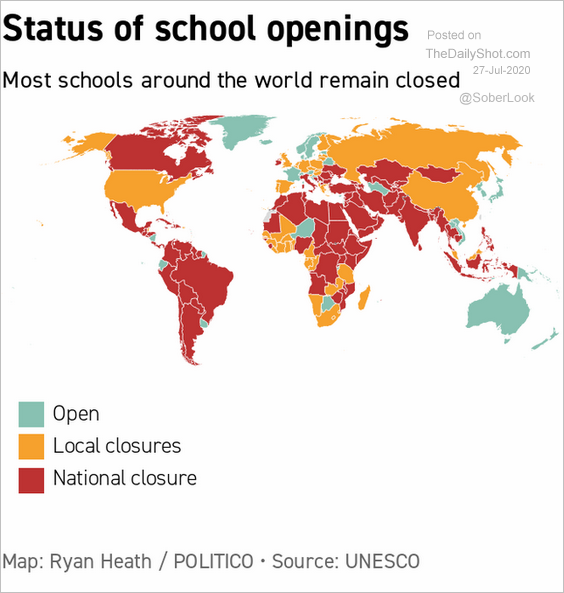 Source: @PoliticoRyan
3. European business activity is outpacing the US and Japan.
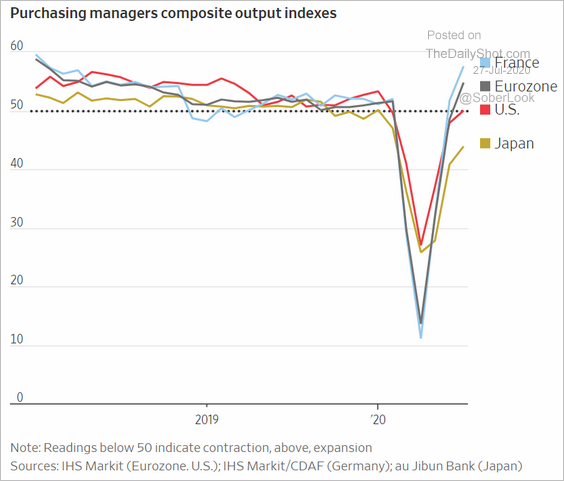 Source: @WSJ Read full article
4. This chart shows central bank rate cuts in 2020 across major economies.
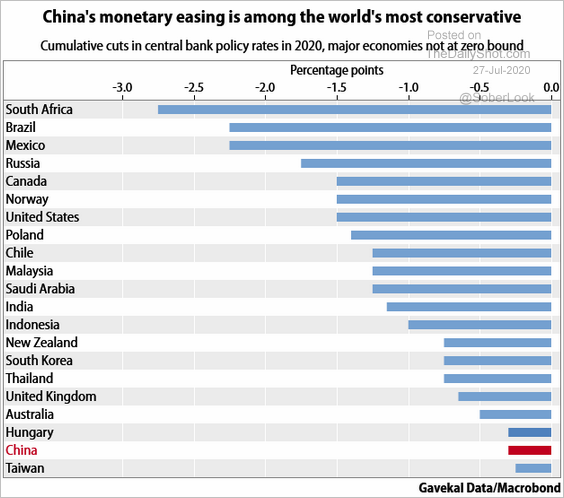 Source: Gavekal
5. Growth in the global monetary base is fading.
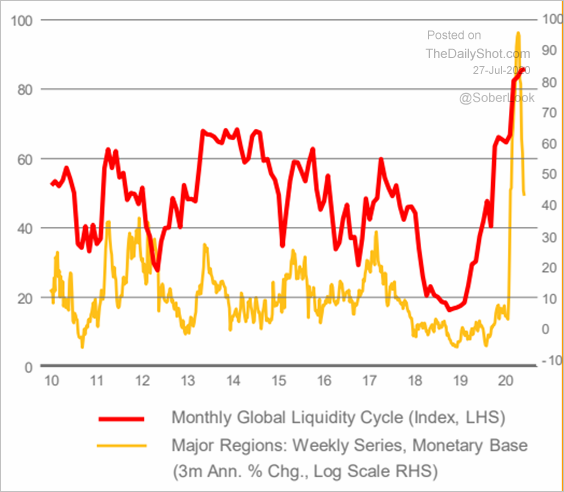 Source: @crossbordercap
——————–
Food for Thought
1. Relative changes in dissatisfaction with democracy (since 1995):
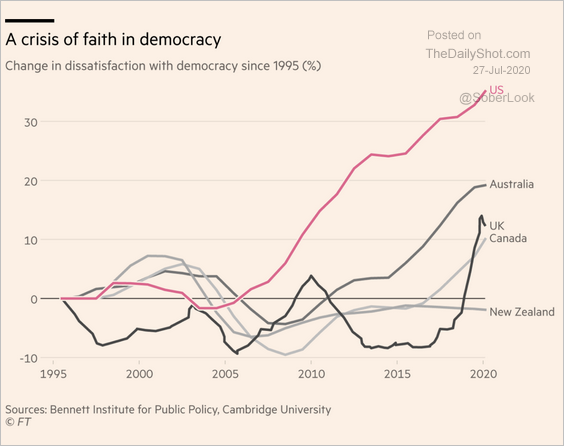 Source: @financialtimes Read full article
2. Recent incidents in the South China Sea:
 Source: @financialtimes Read full article
3. COVID-19 deaths in Canada vs. the US (per million people):
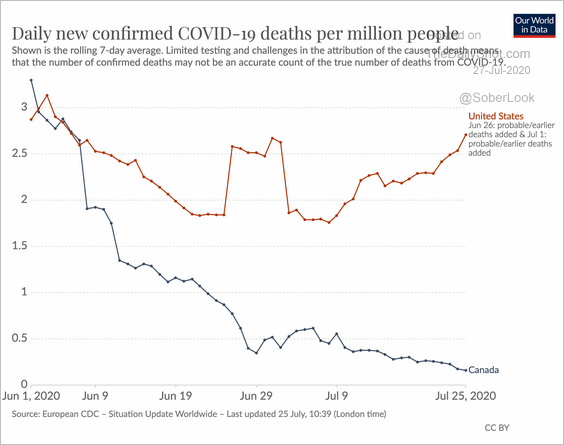 Source: @MaxCRoser Read full article
4. Concerns about climate change vs. distance from the coast:
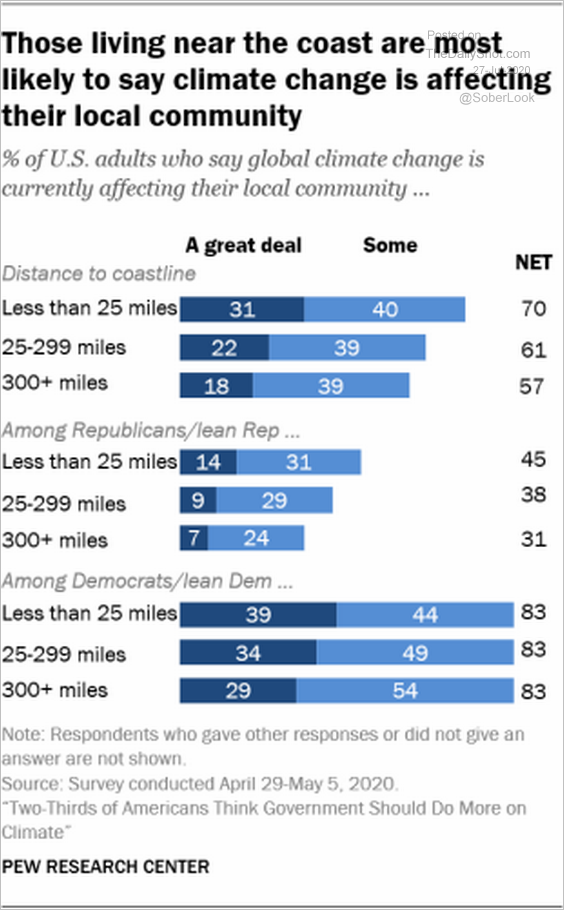 Source: @FactTank Read full article
5. Truckers’ wages:
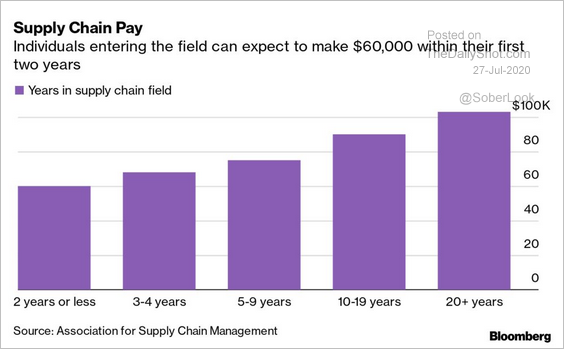 Source: @business Read full article
6. Industries with the highest unemployment:
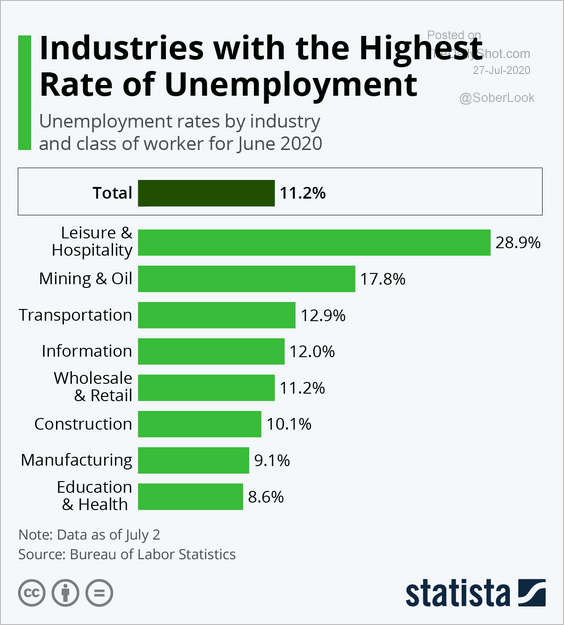 Source: Statista
7. The demographics of US low-wage workers:
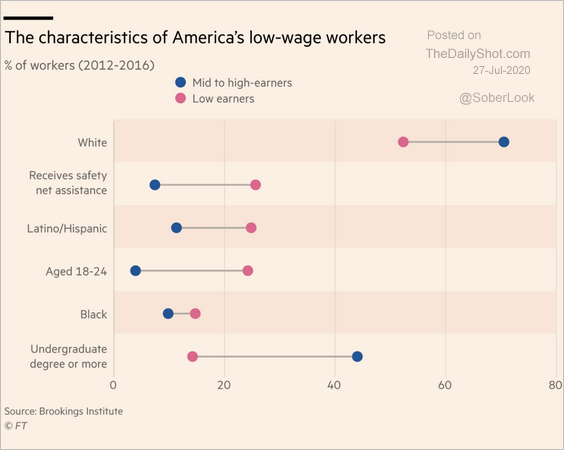 Source: @financialtimes Read full article
8. Food delivery sales:
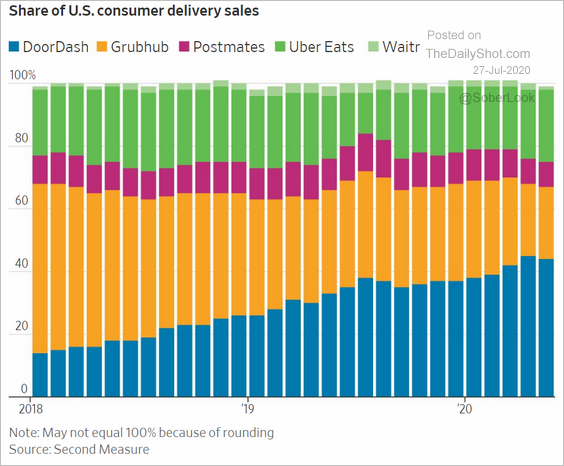 Source: @WSJ Read full article
9. The Great Lakes system profile:
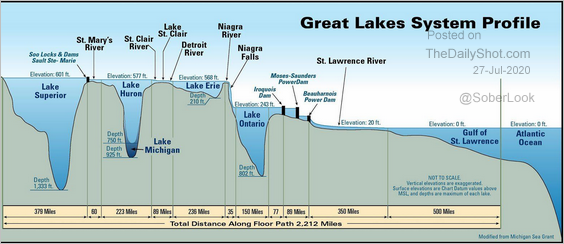 Source: @simongerman600 Read full article
——————–
Please note that The Daily Shot will no longer be published by The Wall Street Journal beginning on August 1. The Daily Shot will still be available as an independent publication. If you would like to continue to receive The Daily Shot, you can get more information on how to subscribe here.