
The Daily Shot: 19-Feb-21
• The United States
• Canada
• The United Kingdom
• The Eurozone
• Japan
• Australia
• Hong Kong
• Emerging Markets
• Commodities
• Energy
• Equities
• Rates
• Food for Thought
The United States
1. Let’s begin with the housing market.
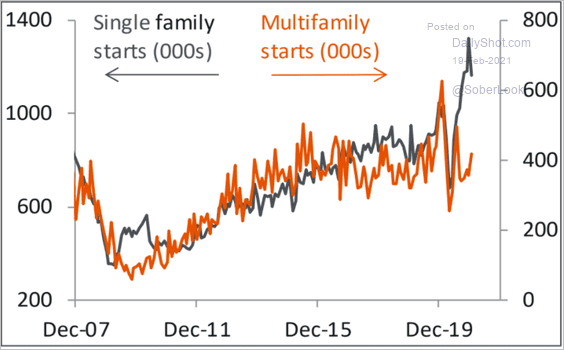
• Last month’s housing starts report showed residential construction pulling back from recent highs.
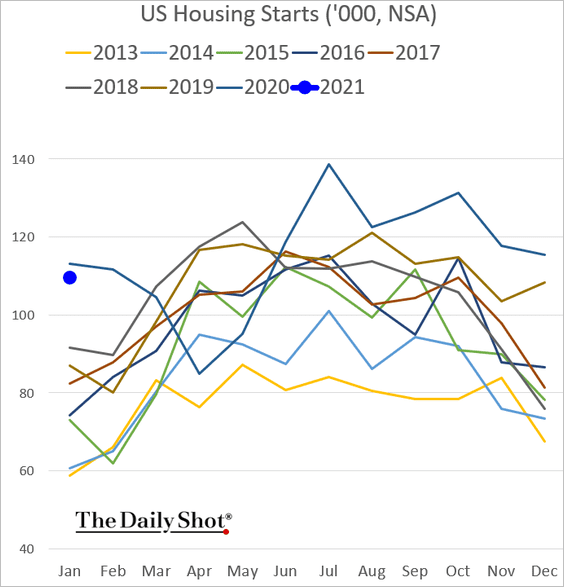
Multi-family housing starts improved somewhat. Here are the seasonally adjusted trends.
 Source: Piper Sandler
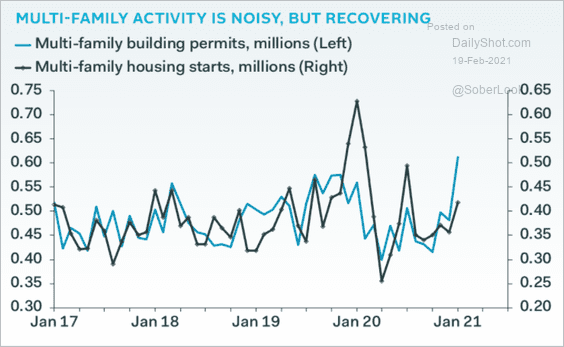
Building permits remained strong, …
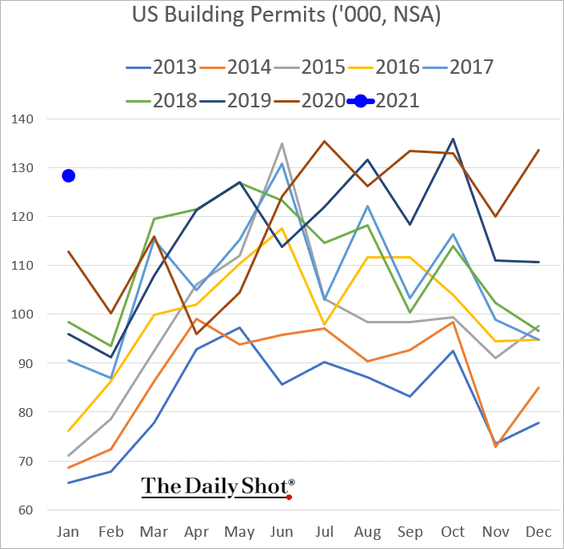
… with a sharp increase in multi-family housing.
 Source: Pantheon Macroeconomics
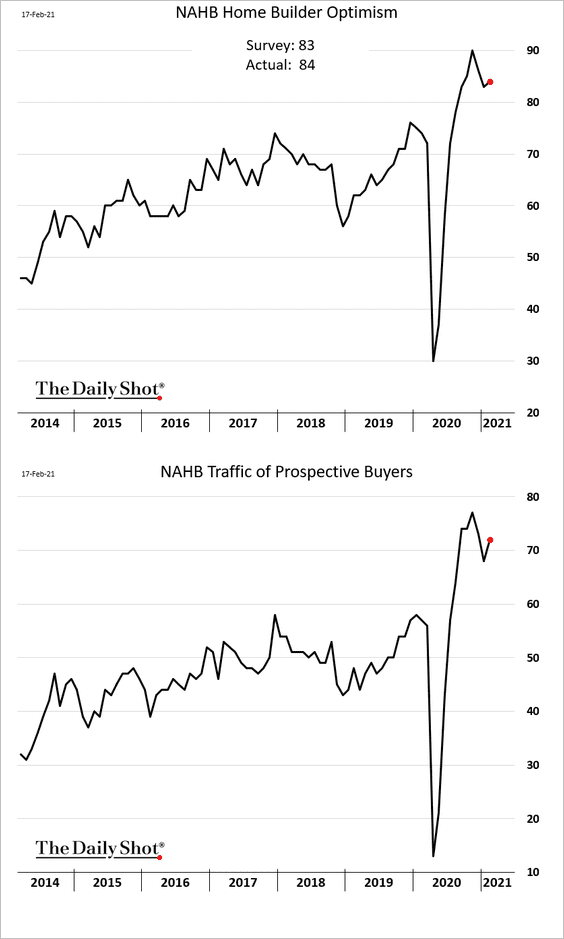
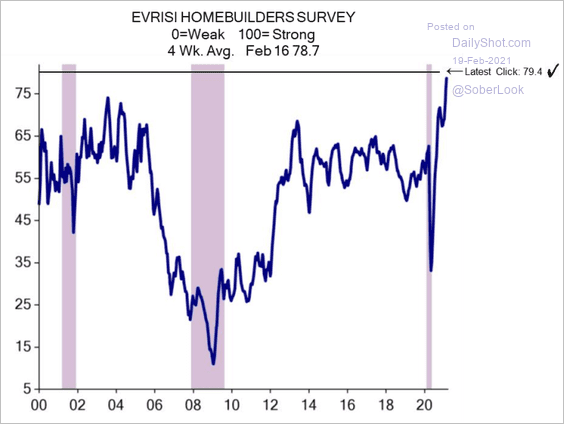
• Homebuilder optimism strengthened this month (near multi-year highs) as traffic of prospective buyers picked up.
This chart shows the Evercore ISI Homebuilder Survey.
 Source: Evercore ISI
• Housing inventories are tumbling.
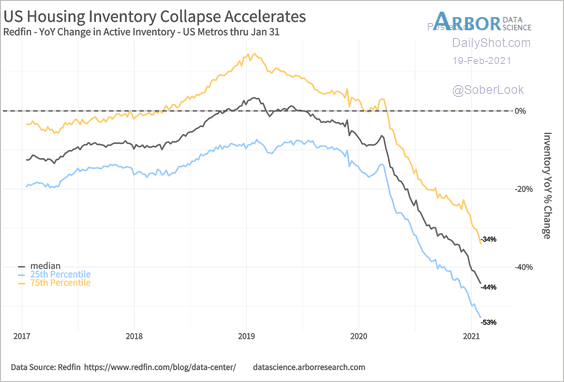 Source: Arbor Research & Trading Read full article
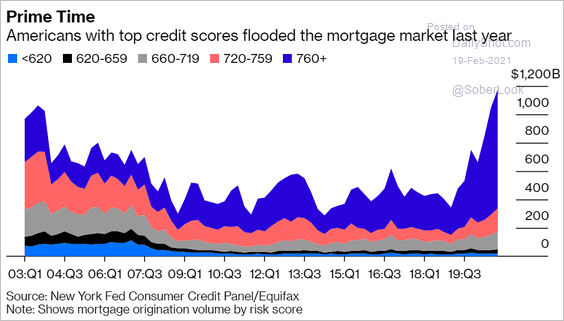
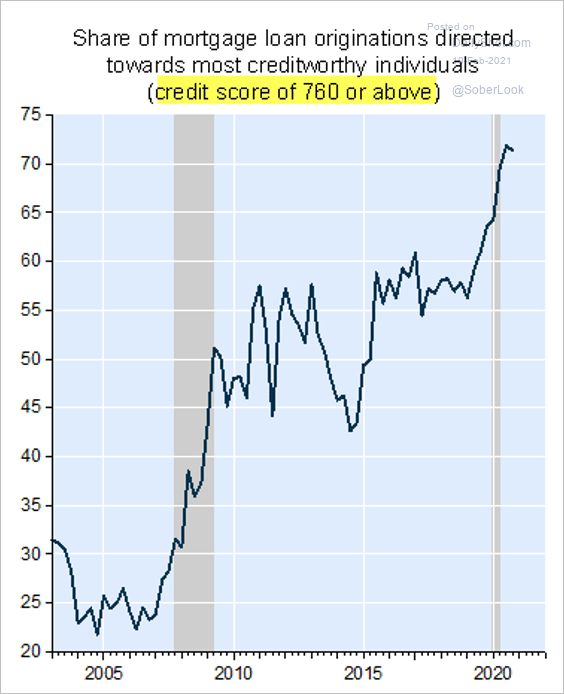
• Last year’s spike in mortgage originations was driven by borrowers with the highest credit scores (2 charts).
 Source: Bloomberg Read full article
 Source: Economics and Strategy Group, National Bank of Canada
Cash-out refinancing activity picked up.
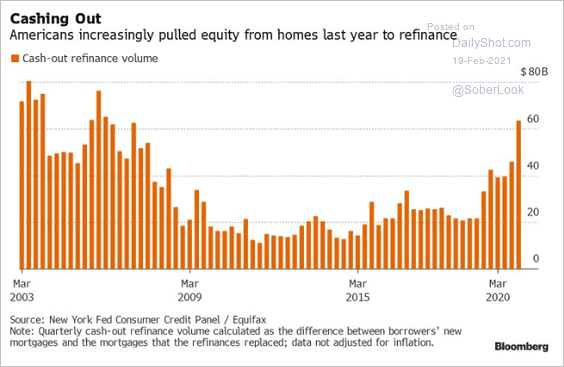 Source: @LizAnnSonders, @Bloomberg
——————–
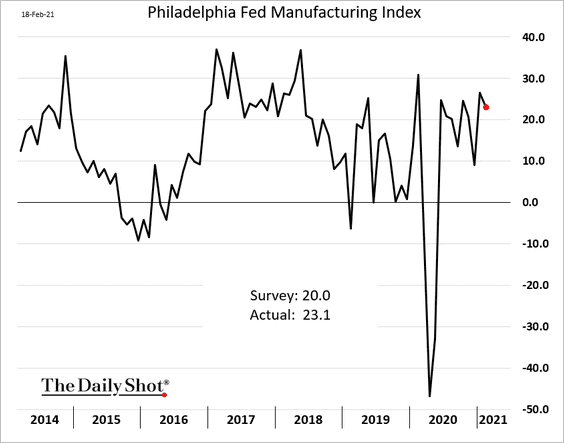
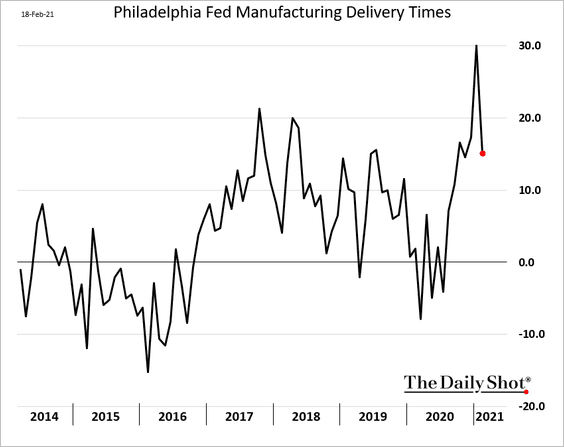
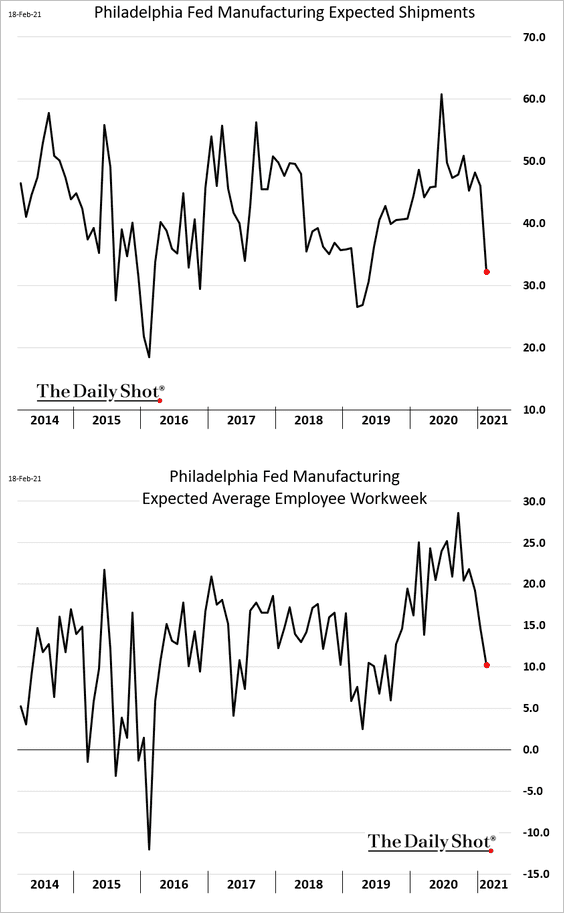
2. The Philly Fed’s manufacturing index showed continued strength in the region’s factory activity.
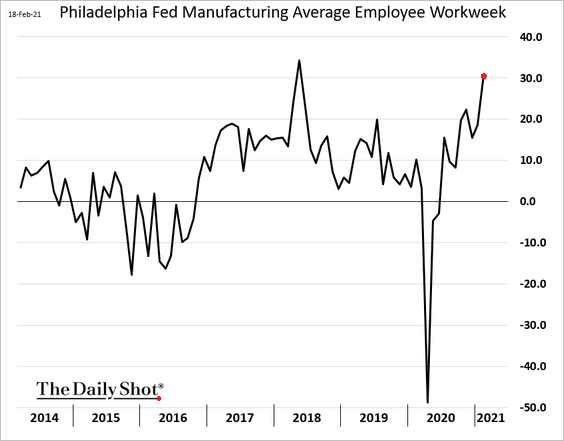
• Manufacturers are boosting employee hours.
• Logistics bottlenecks eased somewhat.
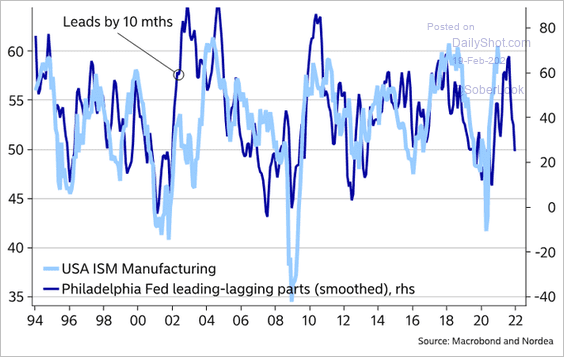
• One area of concern was some deterioration in manufacturers’ expectations (2 charts).
Here is the spread between leading and lagging indicators in the Philly Fed report.
 Source: @MikaelSarwe
——————–
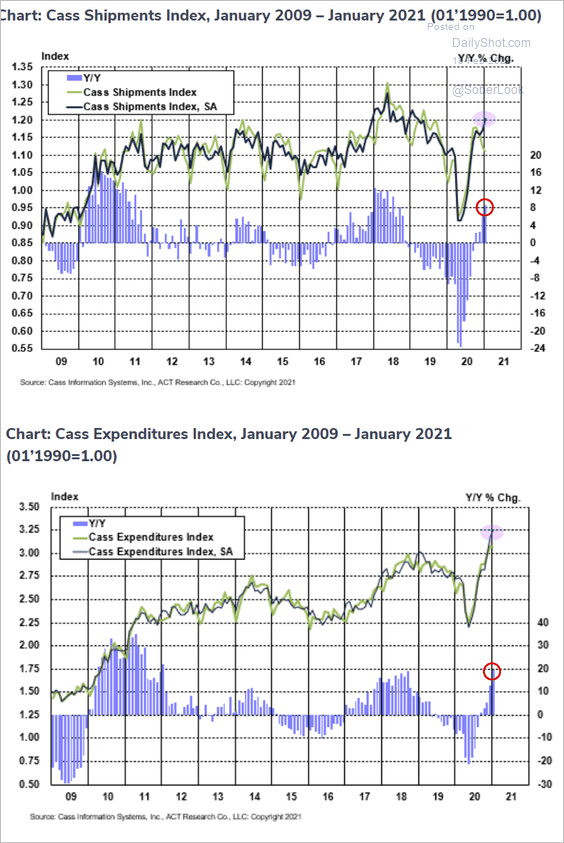
3. Freight activity continues to expand as shipping expenditures hit a record high.
 Source: Cass Information Systems
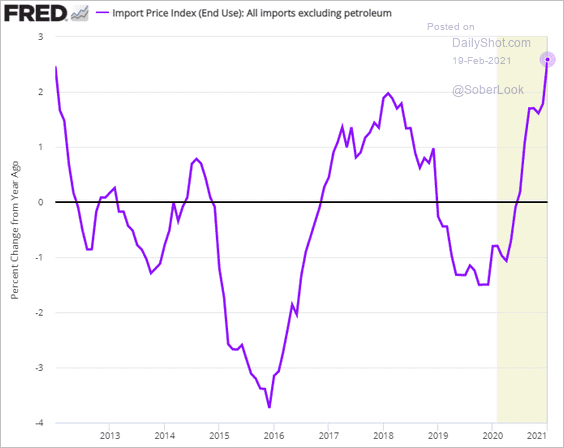
4. Boosted by the US dollar weakness, import prices (ex. petroleum) are rising at the fastest pace since 2012.
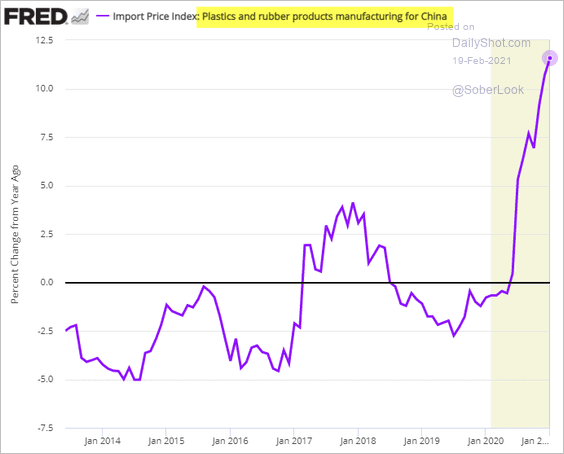
This chart shows the increases in prices of plastics and rubber products from China (pre-tariff). Some of these items are COVID-related (see #3 here).
——————–
5. Jobless claims remain elevated with no signs of tapering.
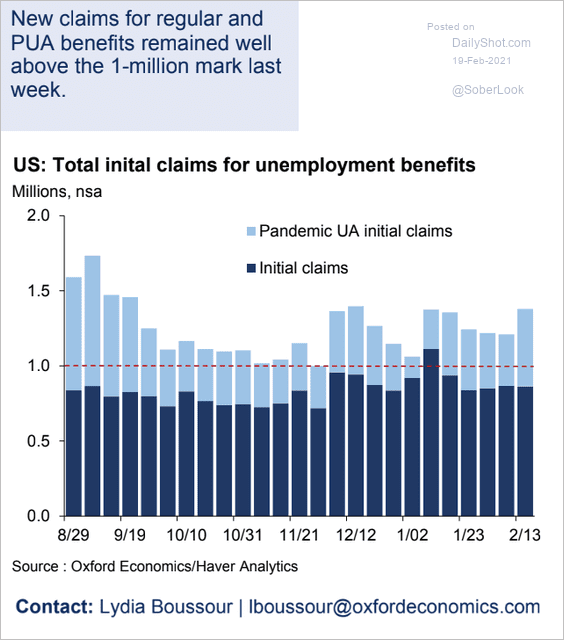 Source: Oxford Economics
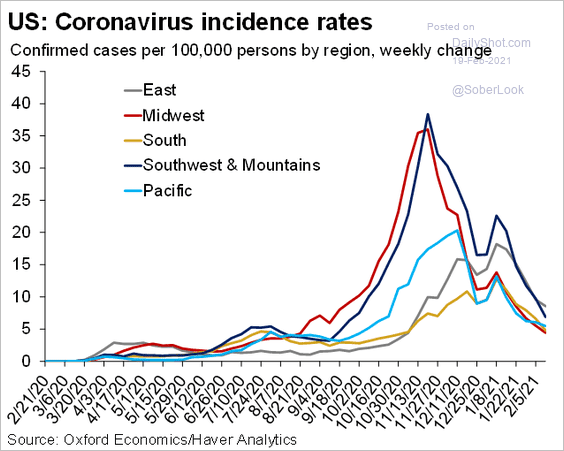
6. The Oxford Economics recovery tracker continues to improve as new COVID cases around the country decline (2nd and 3rd chart).
![]() Source: Oxford Economics
Source: Oxford Economics
 Source: @GregDaco
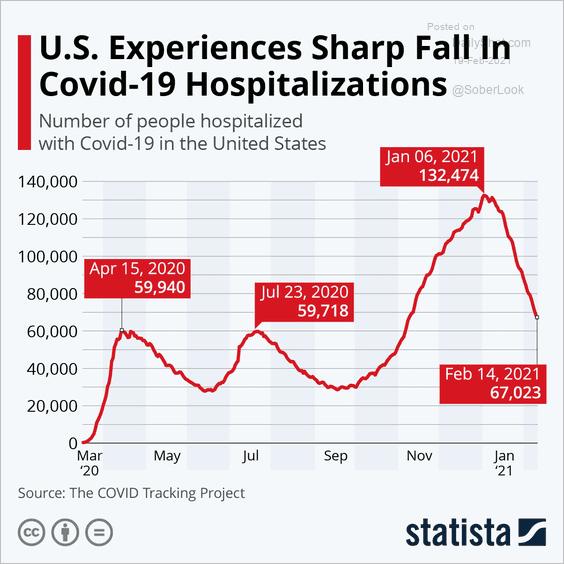 Source: Statista
Will there be enough vaccines to cover everyone by Independence Day?
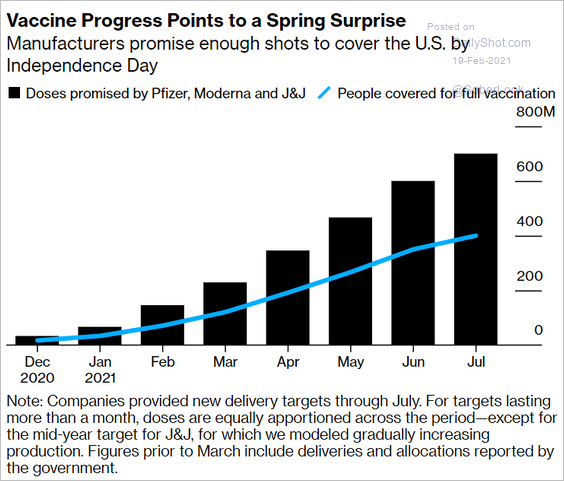 Source: Bloomberg Read full article
——————–
7. Here is Goldman’s estimate of the GDP impact from this year’s expected fiscal stimulus (GS argues that stimulus won’t overheat the economy over the intermediate-term).
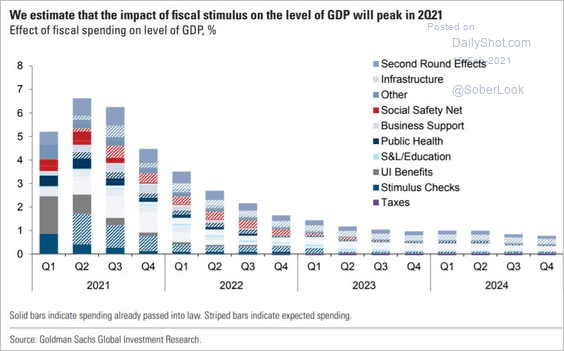 Source: Goldman Sachs, @ReutersJamie
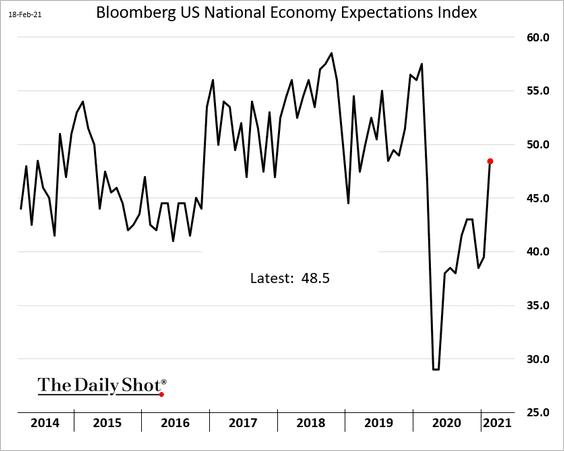
8. Blomberg’s economic expectations survey is rebounding.
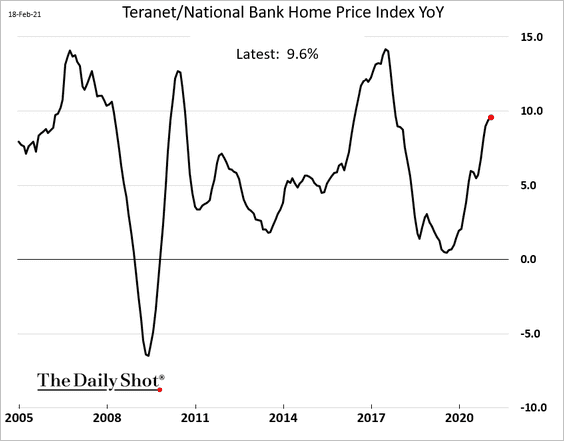
Canada
Home price appreciation is approaching 10% per year.
The biggest gains have been in single-family housing.
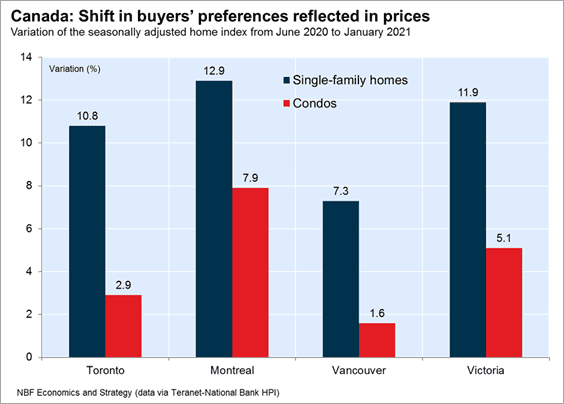 Source: Economics and Strategy Group, National Bank of Canada
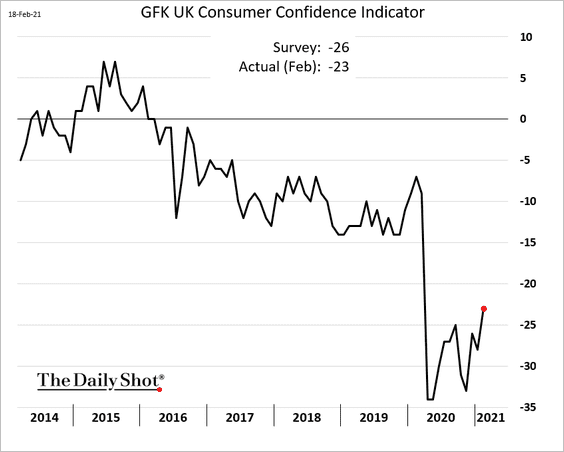
The United Kingdom
1. Consumer confidence is starting to recover.
2. Households with the highest income have been saving the most.
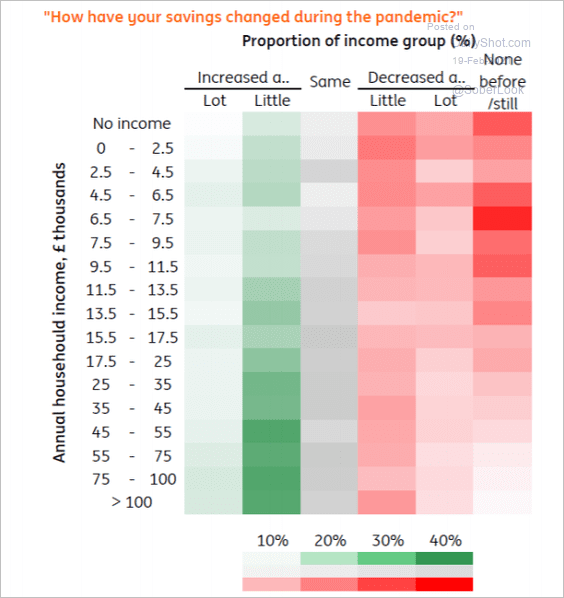 Source: ING
3. The vaccine impact is showing up in the data as fewer older Britons get sick.
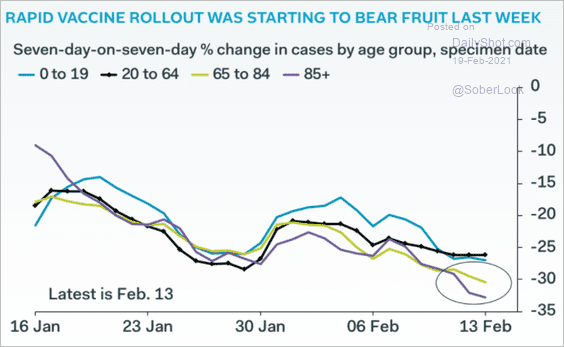 Source: Pantheon Macroeconomics
4. Next, we have a couple of charts on UK demographics.
• Population growth forecast:
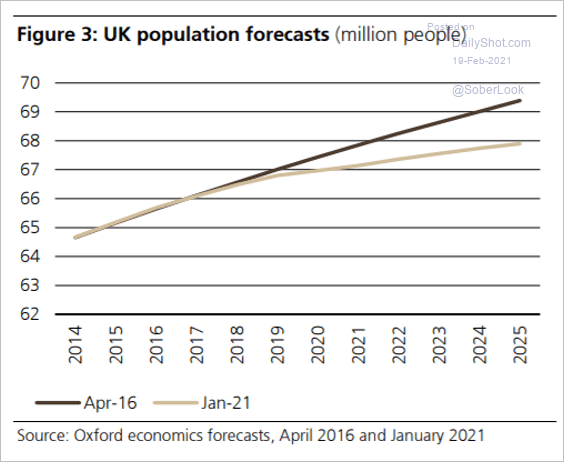 Source: UBS
• Projected age distribution:
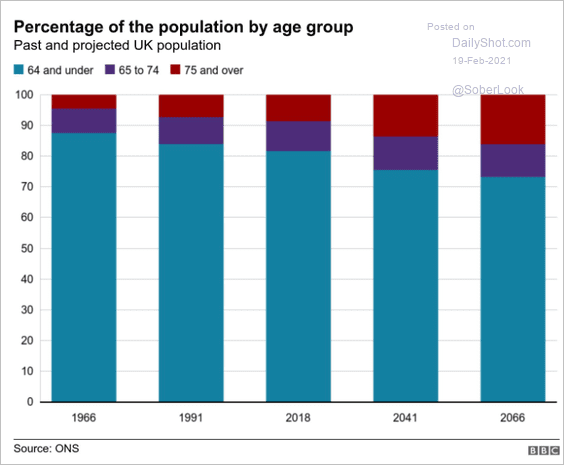 Source: BBC Read full article
——————–
5. Here are the latest voting intention polls.
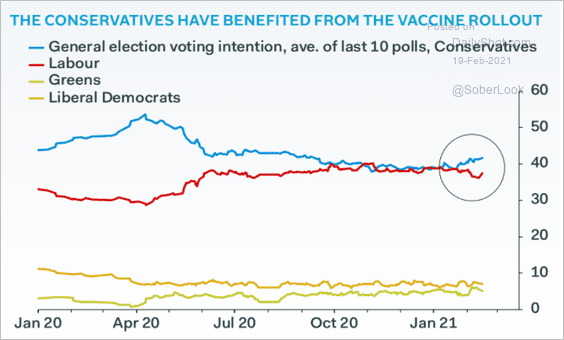 Source: Pantheon Macroeconomics
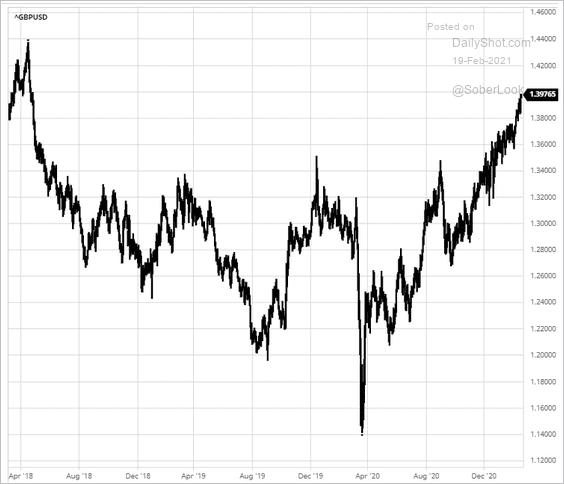
6. The pound continues to climb vs. USD.
 Source: barchart.com
The Eurozone
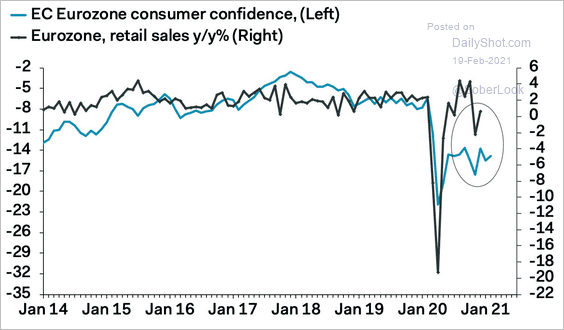
1. Euro-area consumer confidence remains soft, …
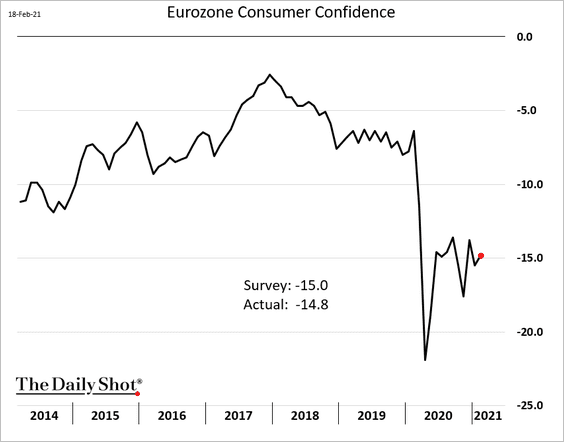
… which may be a drag on retail sales.
 Source: Pantheon Macroeconomics
——————–
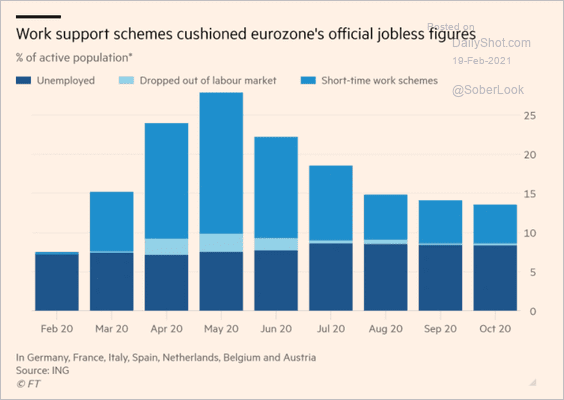
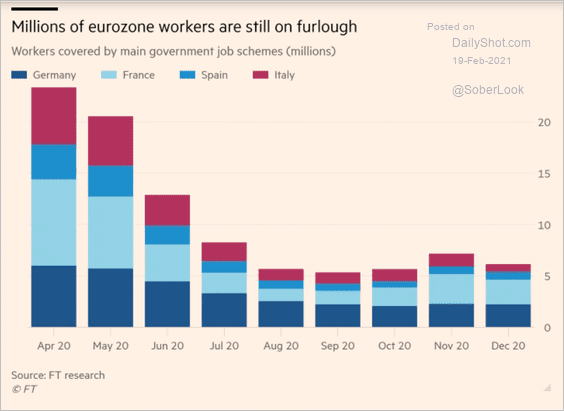
2. Work support programs capped unemployment.
 Source: @financialtimes Read full article
But millions of workers are still on furlough.
 Source: @financialtimes Read full article
——————–
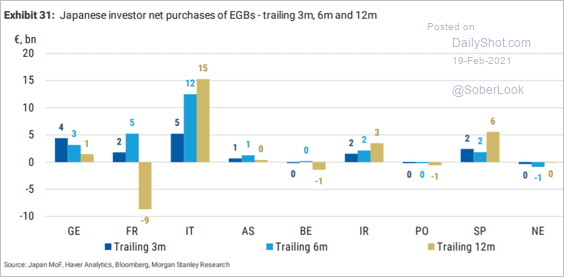
3. Japanese investors have been buying higher-yielding Eurozone government bonds.
 Source: Morgan Stanley Research
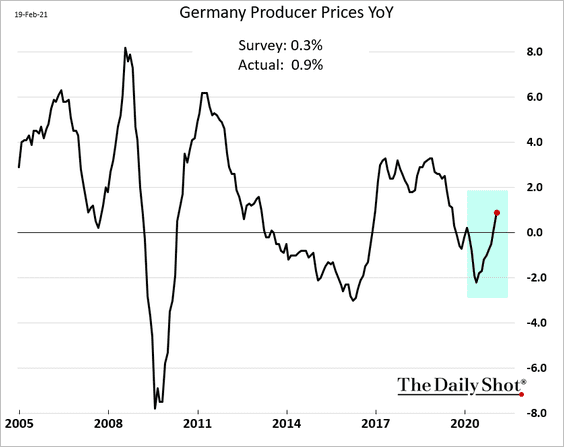
4. Germany’s PPI is rebounding.
Japan
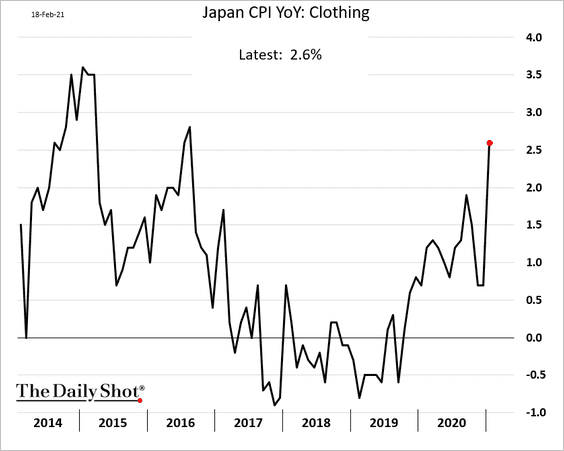
1. Inflation firmed up last month, with the core CPI rising above zero.
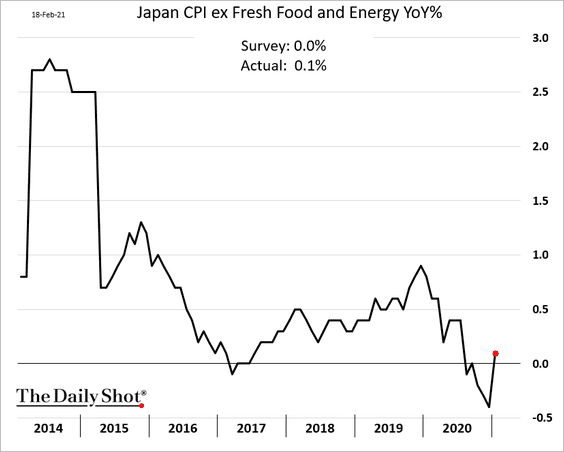
Clothing prices jumped.
——————–
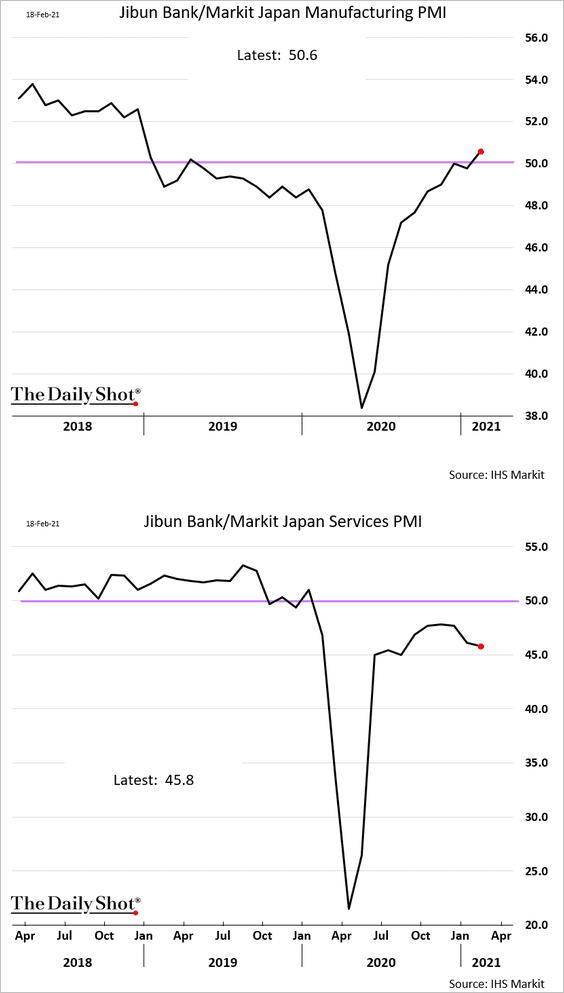
2. Manufacturing activity is back in growth mode (PMI > 50), but the services slump continues.
Australia
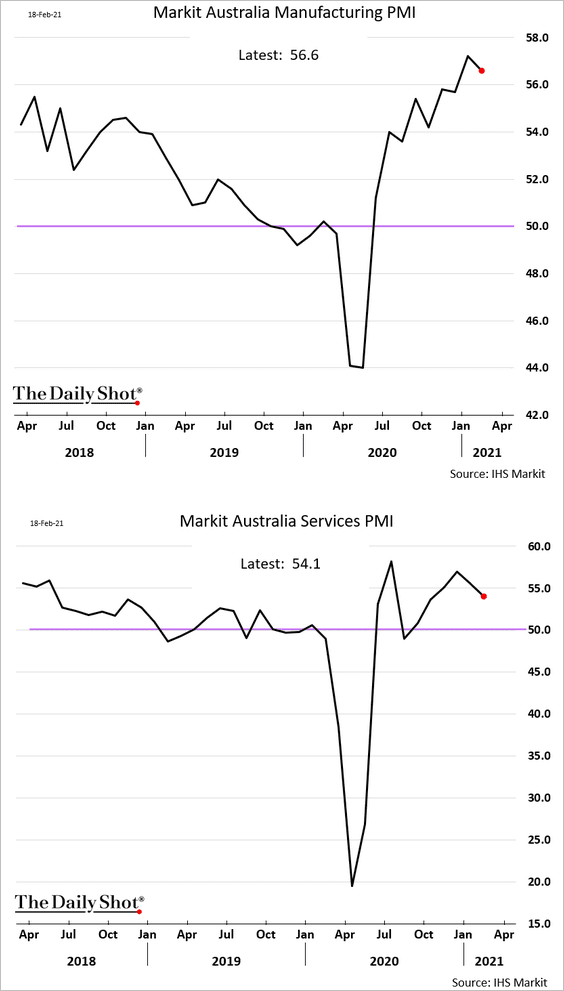
1. Business activity held up well this month, although momentum has slowed somewhat.
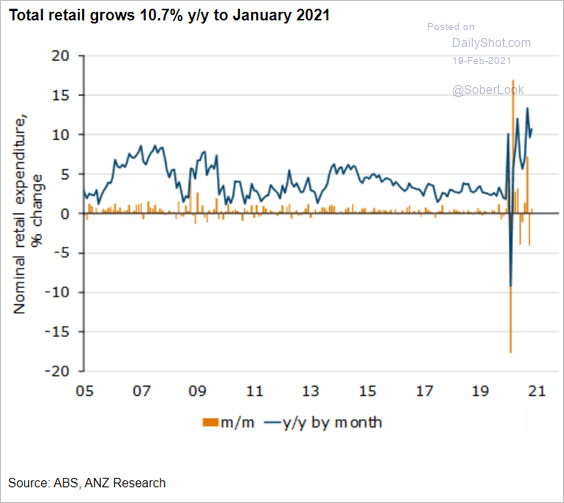
2. Retail sales remain robust.
 Source: ANZ Research
3. Coal exporters shifted from China to India in response to China blocking Australian coal.
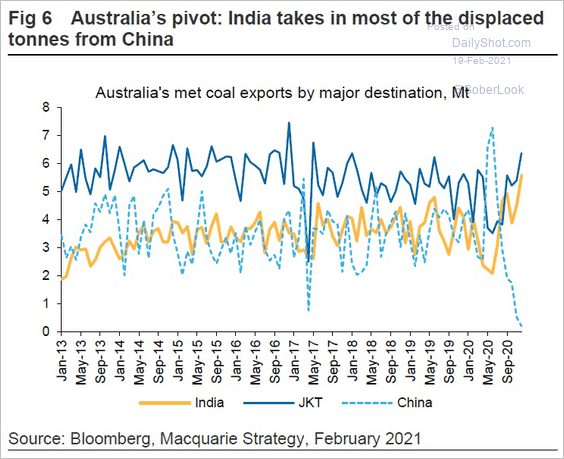 Source: Macquarie; @Scutty
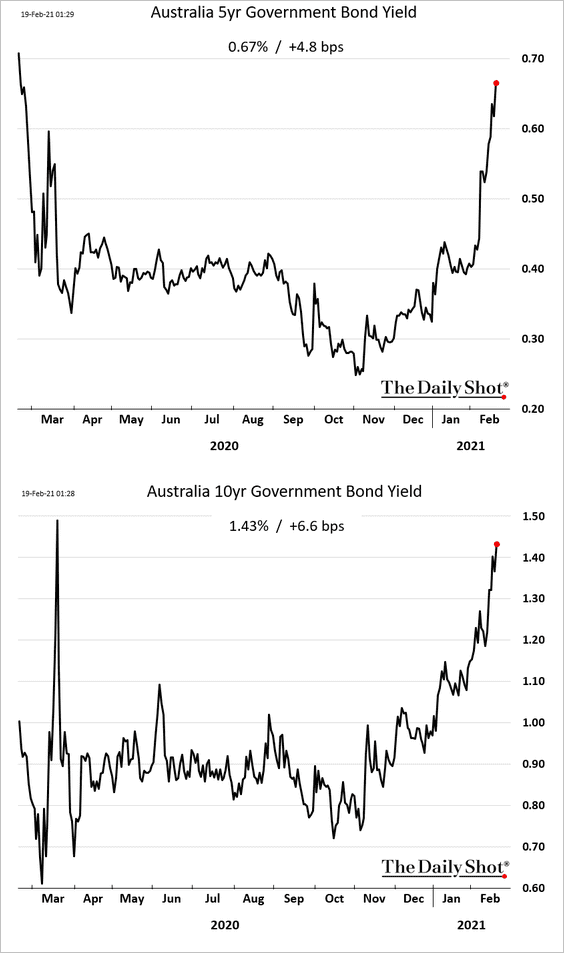
4. Bond yields are surging.
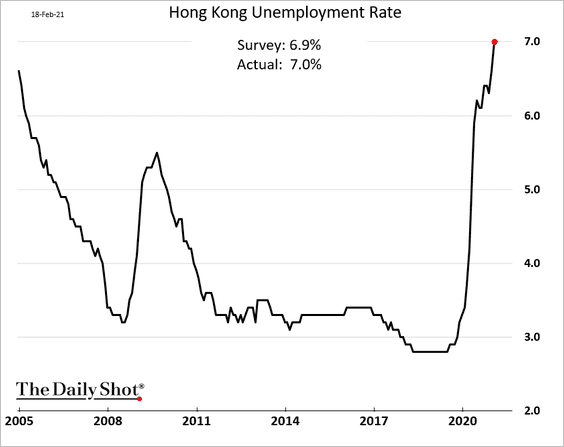
Hong Kong
1. The unemployment rate keeps climbing.
2. Hong Kong’s stock trading volume is now four times that of London.
 Source: @financialtimes Read full article
Emerging Markets
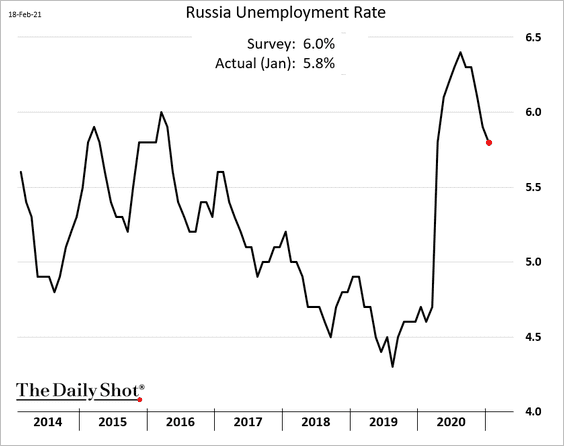
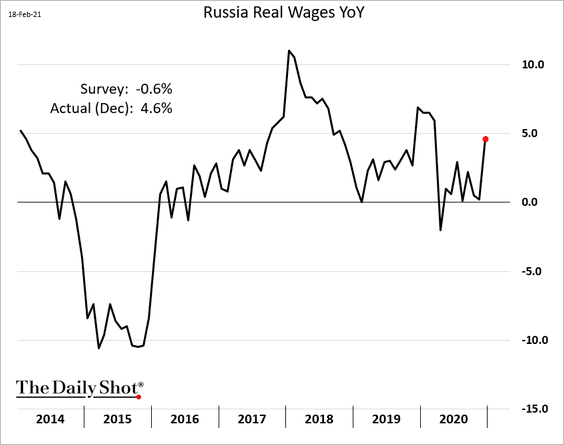
1. Let’s begin with Russia.
• The unemployment rate continues to fall.
• Wage growth picked up in December.
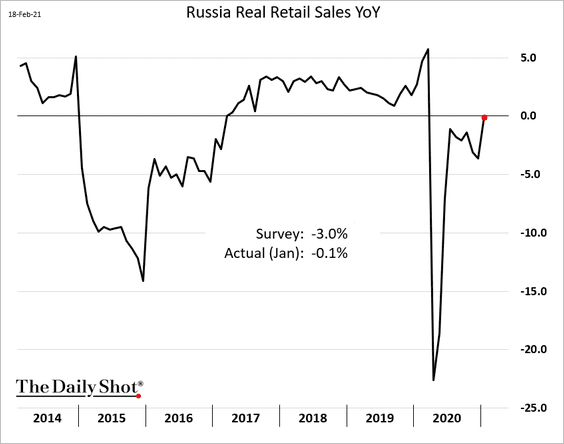
• Retail sales jumped last month, exceeding forecasts.
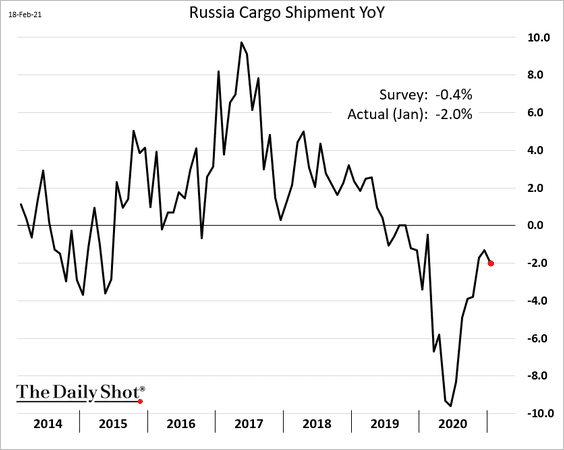
• Cargo shipments remain soft.
——————–
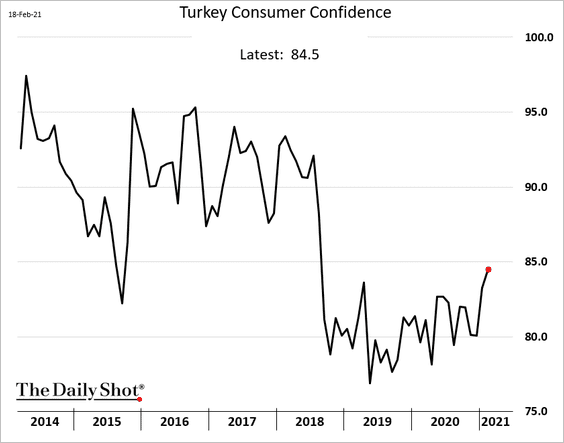
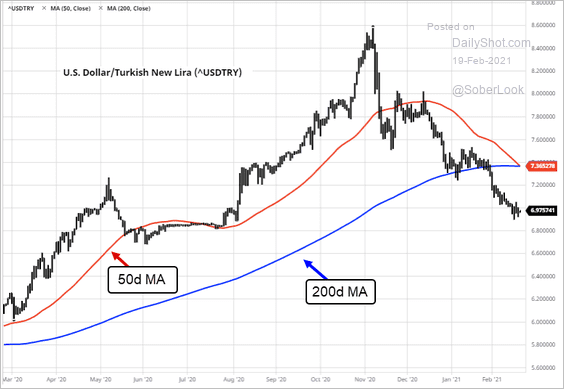
2. Turkey’s consumer confidence is improving.
Technicals are bullish for the lira.
 Source: barchart.com
——————–
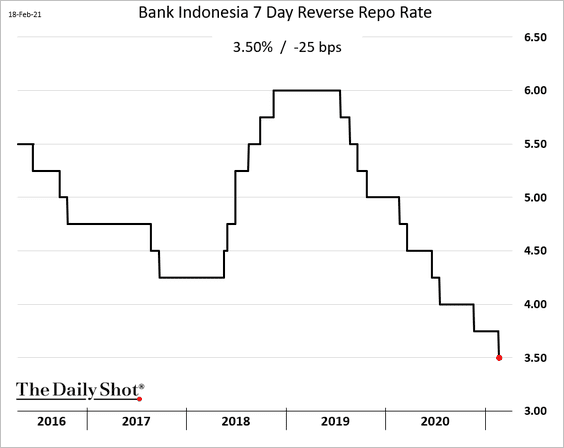
3. Indonesia’s central bank cut rates amid economic weakness.
4. EM rate cuts are coming to an end.
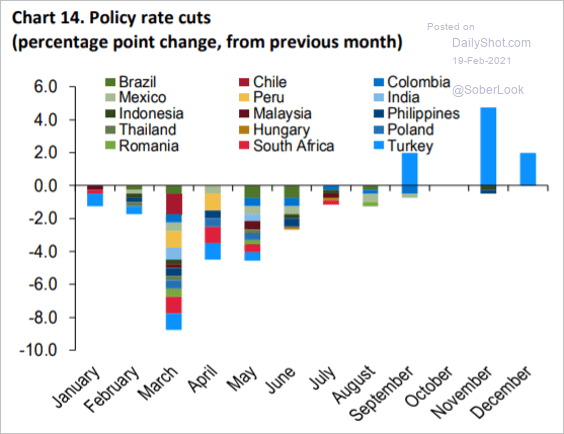 Source: IMF
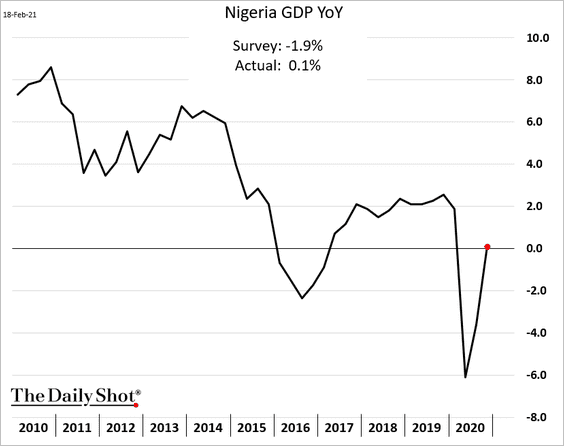
5. Nigeria has pulled out of recession.
6. The Mexican peso is about 10% undervalued versus the dollar, according to Oxford Economics.
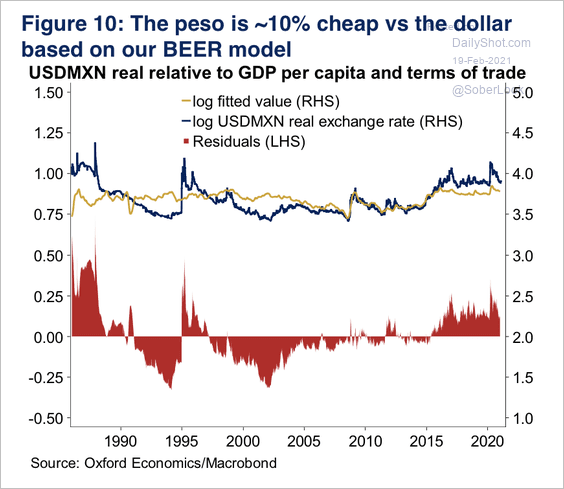 Source: Oxford Economics
Commodities
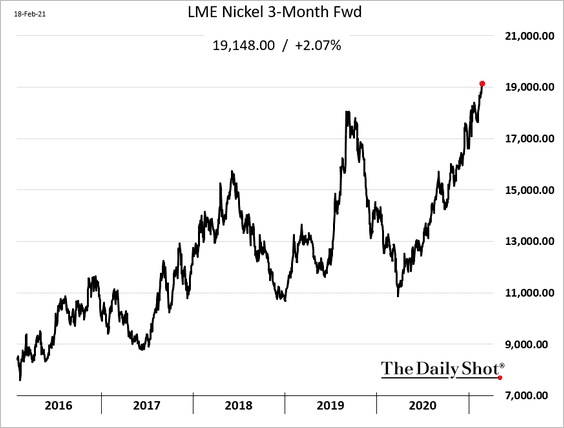
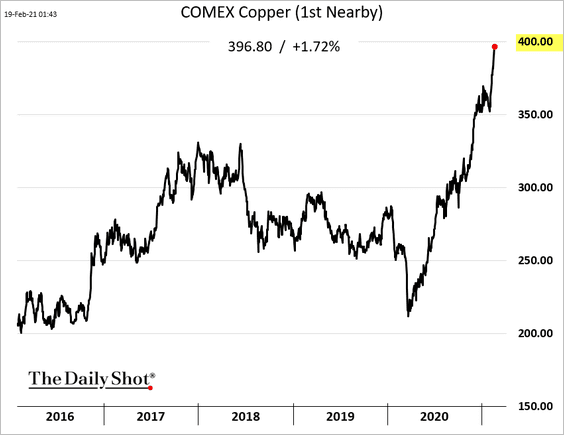
1. Industrial metals continue to surge.
• Nickel:
• Copper (approaching $4.0/lb):
– Is there more upside for copper?
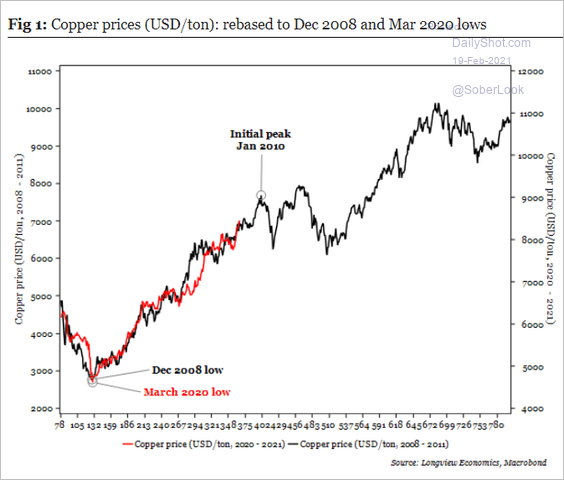 Source: Longview Economics
– CTAs are increasingly bullish.
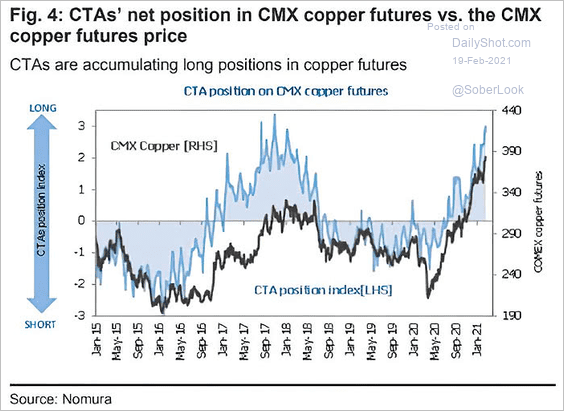 Source: @ISABELNET_SA, @Nomura
——————–
2. Gold is at support.
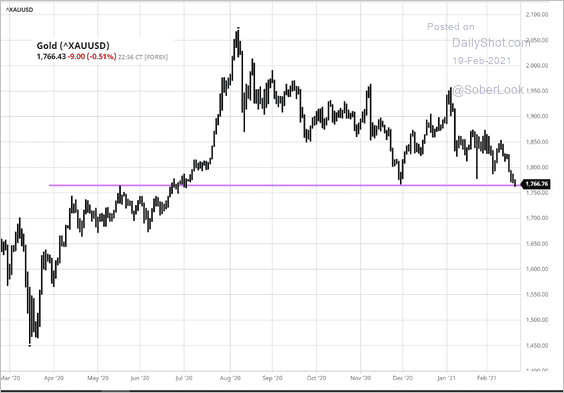 Source: barchart.com
Energy
1. US gasoline demand has been rebounding.
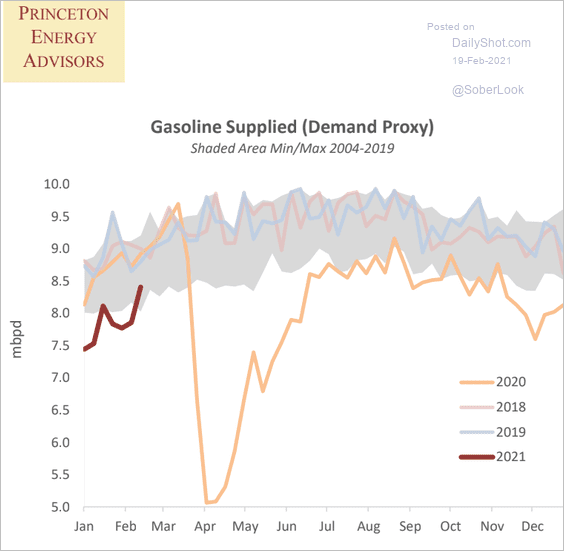 Source: Princeton Energy Advisors
2. A recovery in the Permian basin is critical for US oil production.
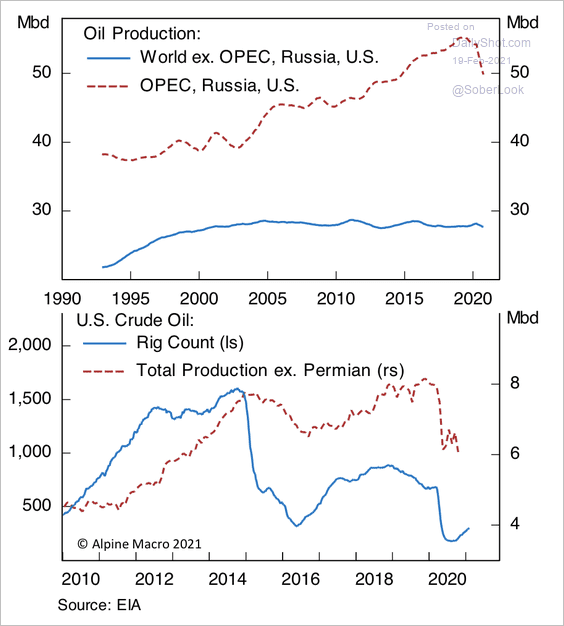 Source: Alpine Macro
3. Natural gas prices in the Houston ship channel hit new highs due to disruptions.
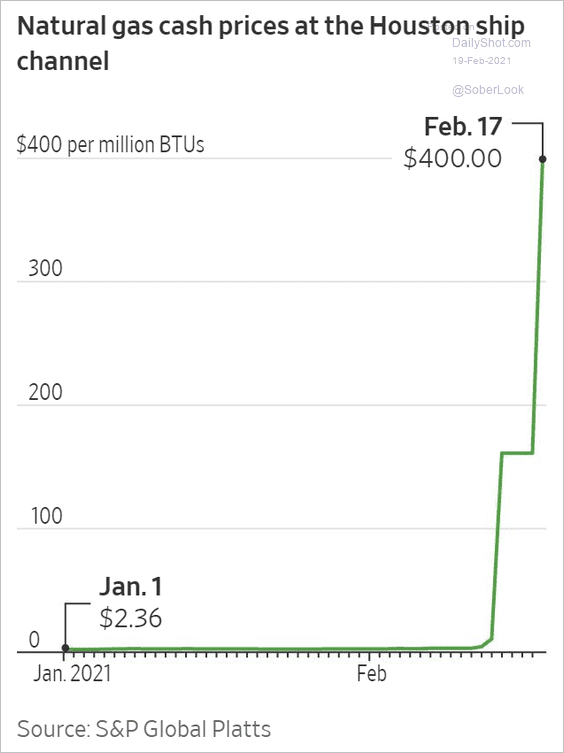 Source: @WSJ Read full article
4. The SPDR energy sector ETF (XLE) is holding short-term support vs. to the overall market.
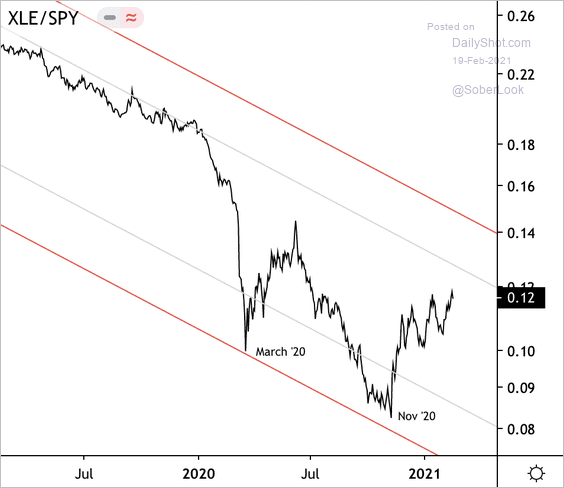 Source: Dantes Outlook
Energy stocks are trading at (relatively) cheap valuations.
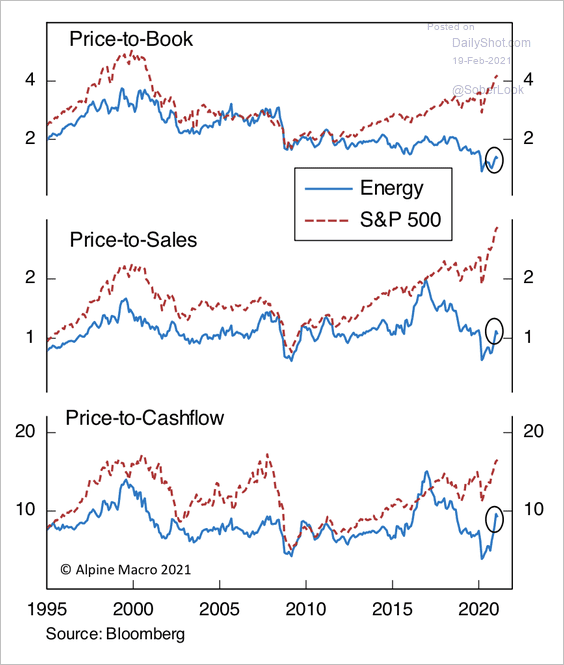 Source: Alpine Macro
Equities
1. Most fund managers surveyed by BofA don’t see a bubble in the market.
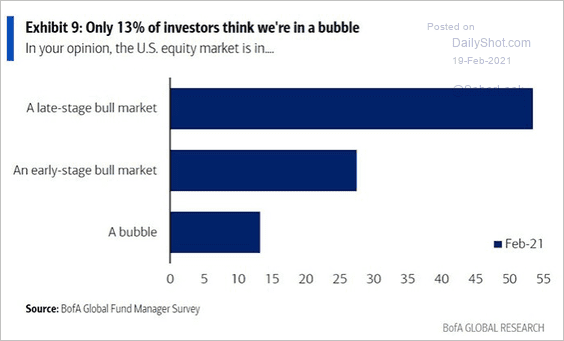 Source: BofA Global Research
2. Short interest has declined throughout the US stock market.
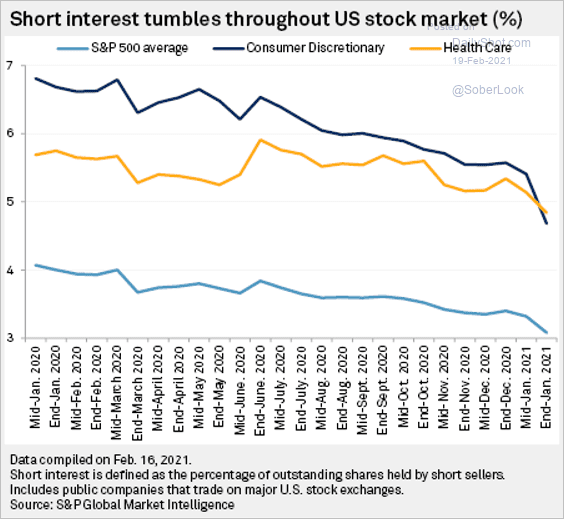 Source: S&P Global Market Intelligence
Here is a look at short interest by sector.
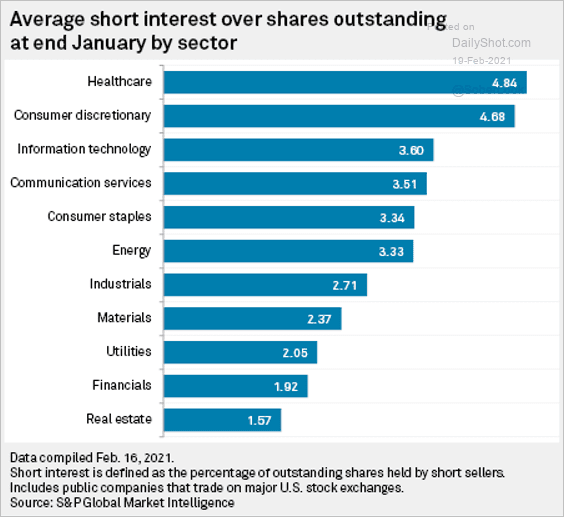 Source: S&P Global Market Intelligence
——————–
3. This chart shows sector performance over the past 12 months.
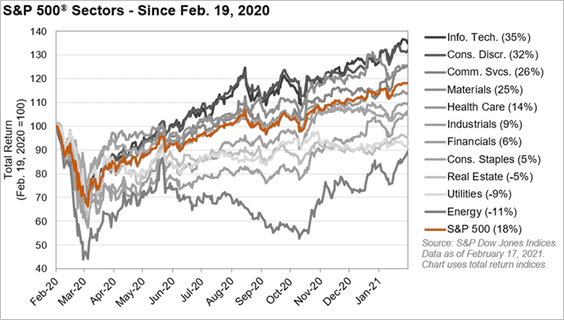 Source: S&P Global Market Intelligence
4. Will rising yields trigger a sell-off in popular tech stocks relative to the S&P 500?
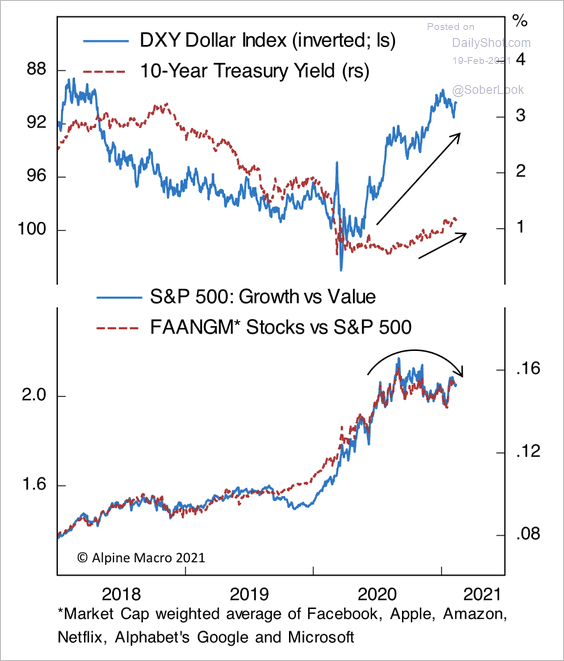 Source: Alpine Macro
The reversal in real rates (TIPS yield) is of particular concern.
• The inverse correlation between real yields and the stock market has been high.
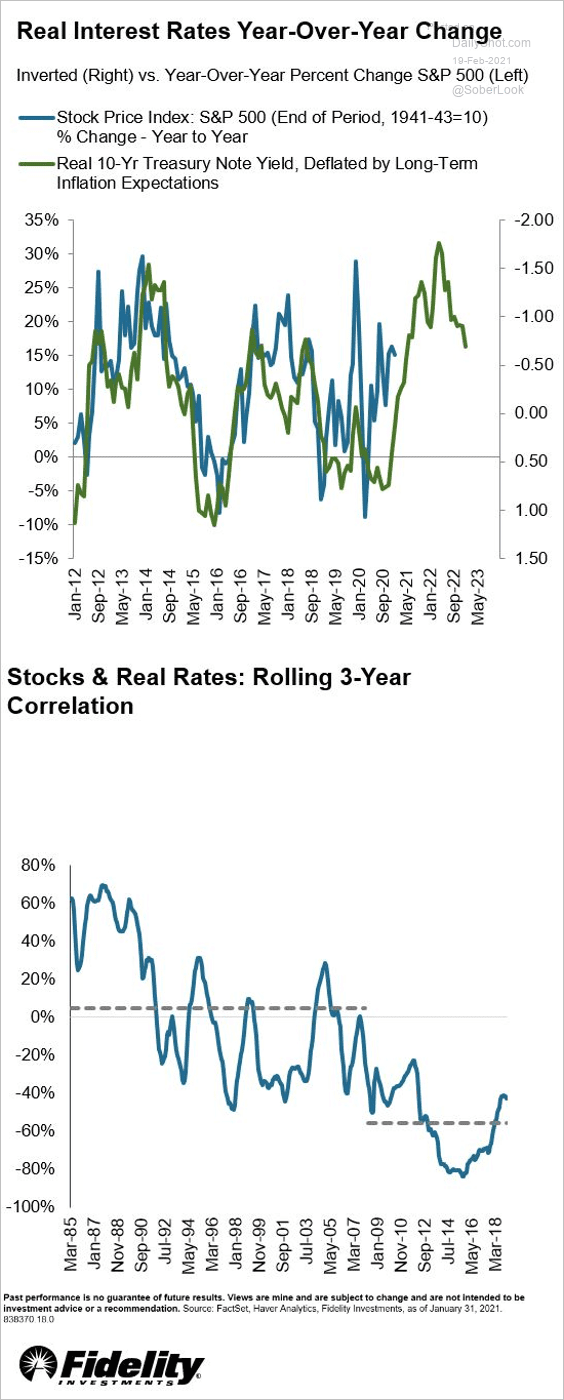 Source: Denise Chisholm
• The market now expects real yields to rebound (2nd chart).
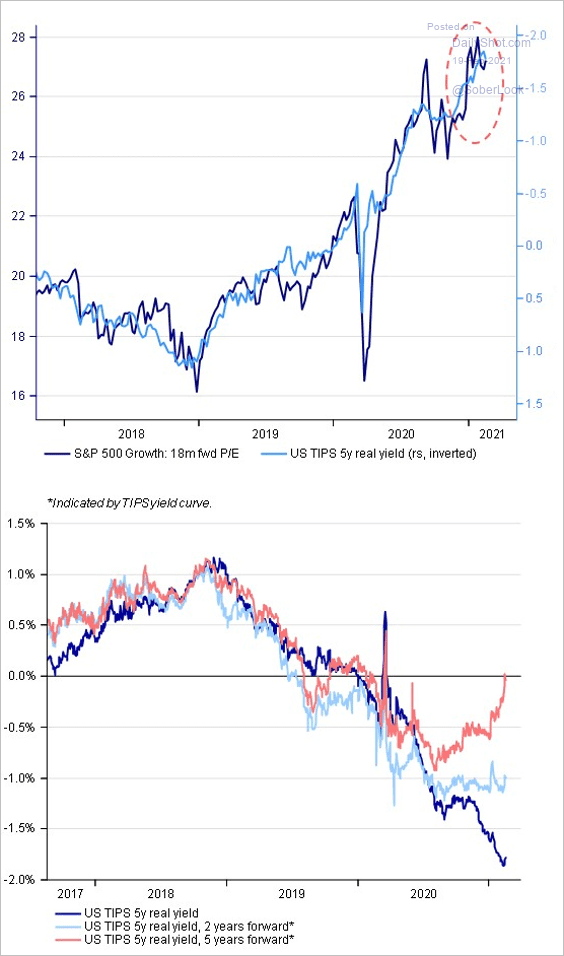 Source: @sdypbuktkallman
——————–
5. Here is a look at how stocks discussed on Reddit’s WallStreetBets performed 30 days after they were “promoted.”
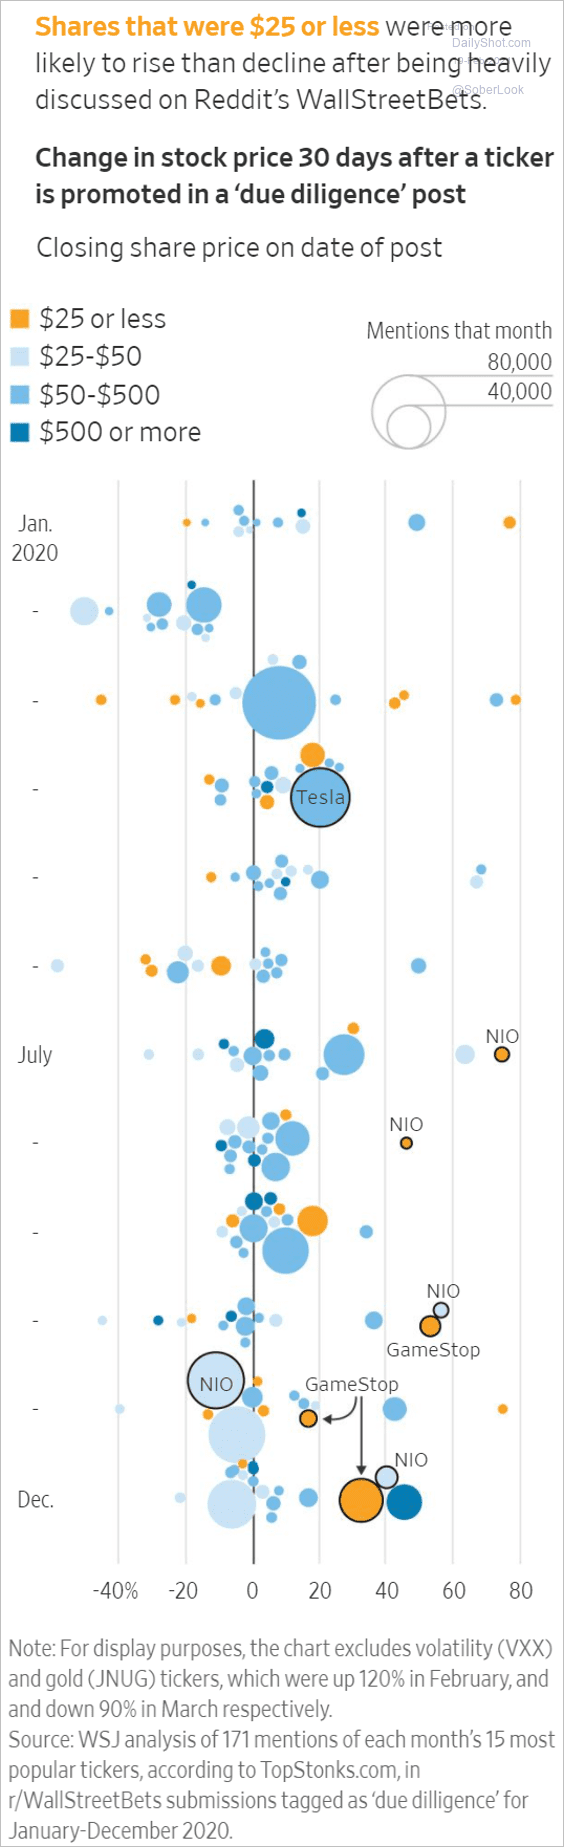 Source: @WSJ Read full article
6. Roundhill’s Sports Betting and iGaming ETF (BETZ) has outperformed the overall market since August.
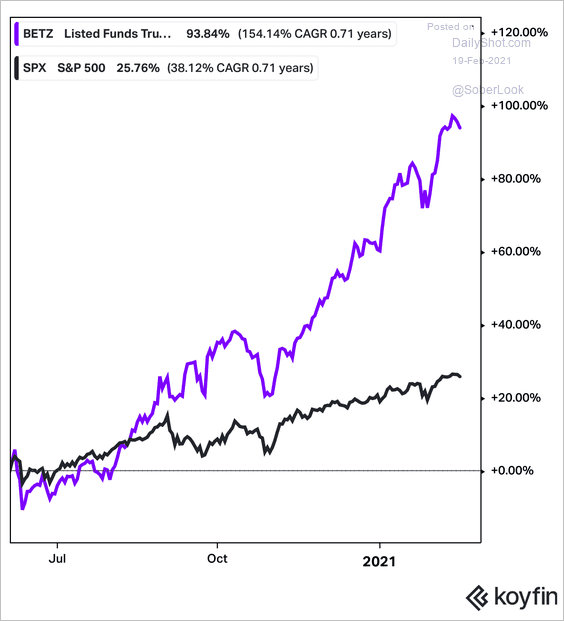 Source: Koyfin; h/t Daniel Moskovits
7. What percentage of companies have executive compensation linked to ESG?
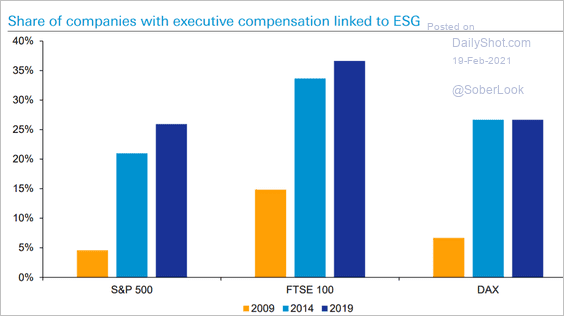 Source: Deutsche Bank Research
Rates
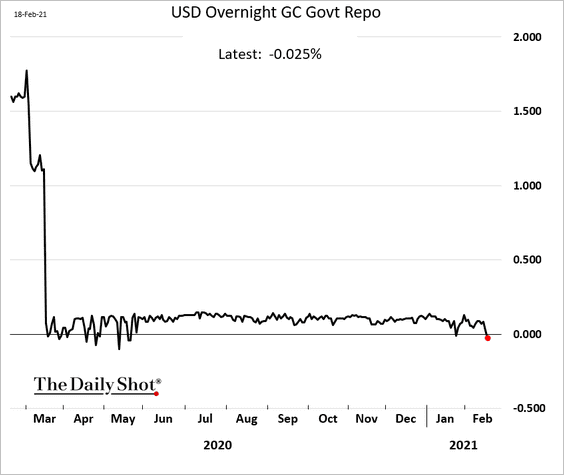
1. The banking system is flooded with liquidity, with companies trying to find a home for their cash balances. The overnight repo rate is negative again.
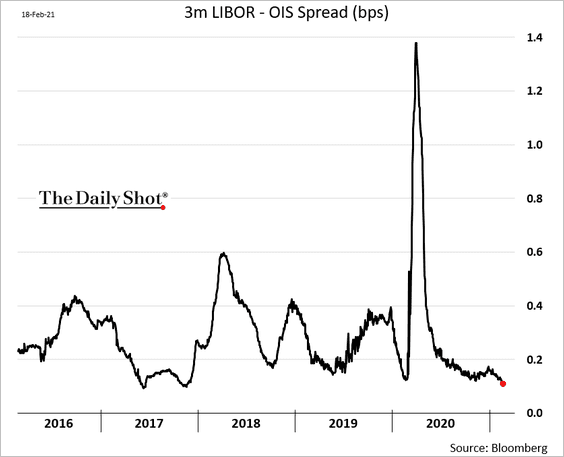
The LIBOR-OIS spread hit the lowest level since 2017.
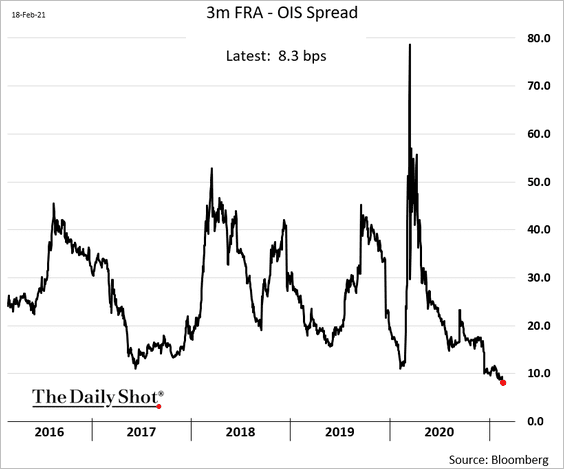
And the market expects further downward pressure on short-term rates as the US Treasury pulls its deposits from the Fed (and into private markets).
• FRA (LIBOR forward) – OIS spread:
• 2yr swap – OIS spread:
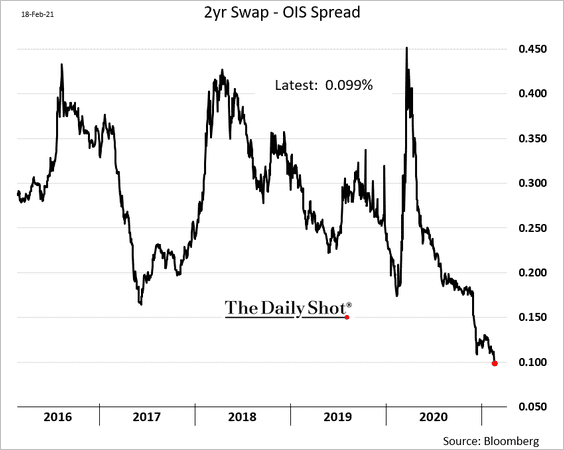 Source: @TheTerminal, Bloomberg Finance L.P.
——————–
2. The copper-to-gold ratio continues to point to further upside for Treasury yields.
 Source: @TheTerminal, Bloomberg Finance L.P.
3. Volatility is extremely low at the front-end of the Treasury yield curve.
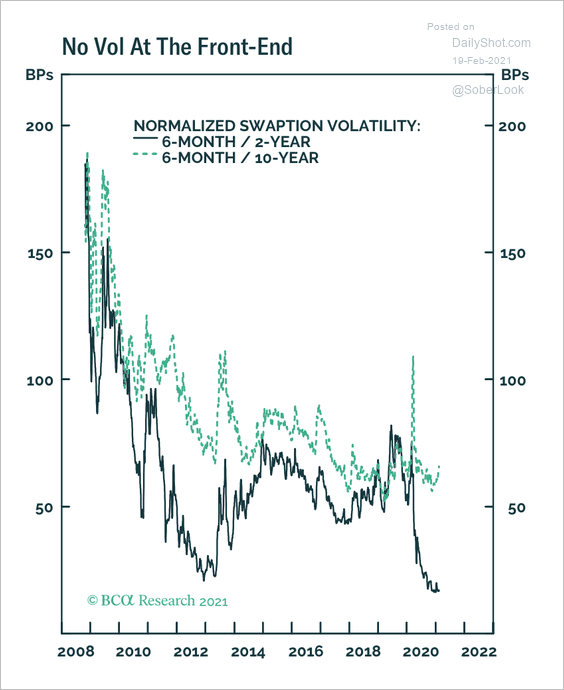 Source: BCA Research
3. Treasury volatility (MOVE) has risen relative to VIX.
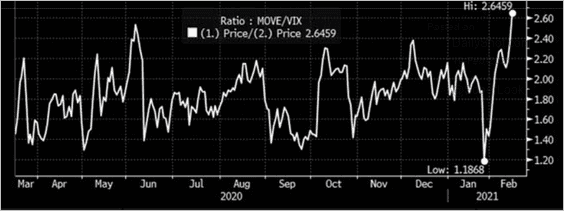 Source: Chirs Murphy; Susquehanna Derivatives Strategy
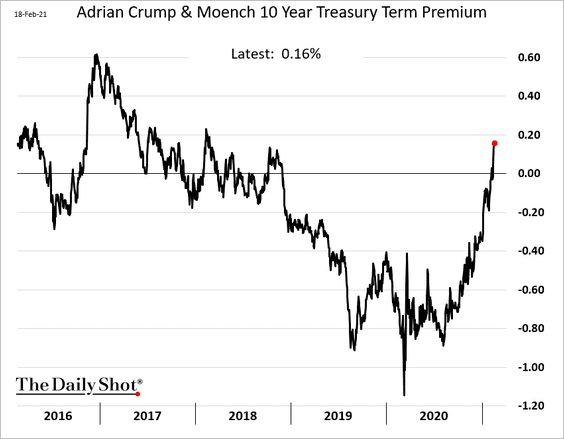
4. Treasury term premium continues to climb.
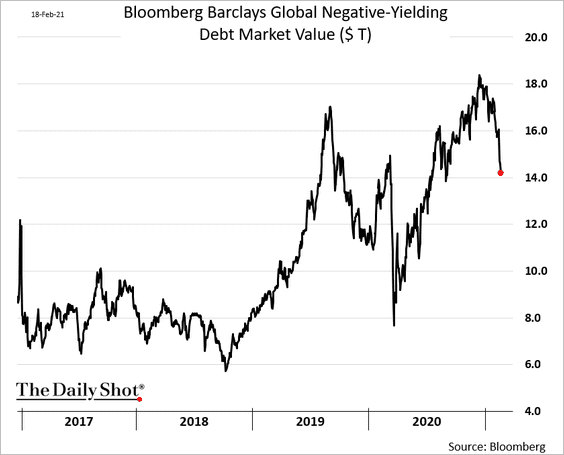
5. The amount of global negative-yielding debt decreased sharply in recent days.
6. The public is suddenly interested in concepts such as yield curve steepening and reflation.
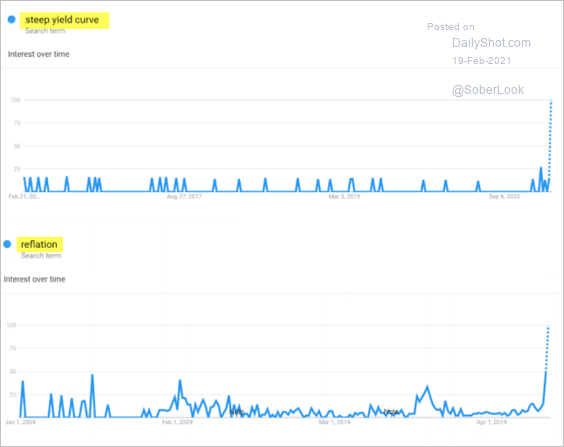 Source: @Peter_Atwater, Financial Insyghts
Food for Thought
1. How accurate is facial recognition software?
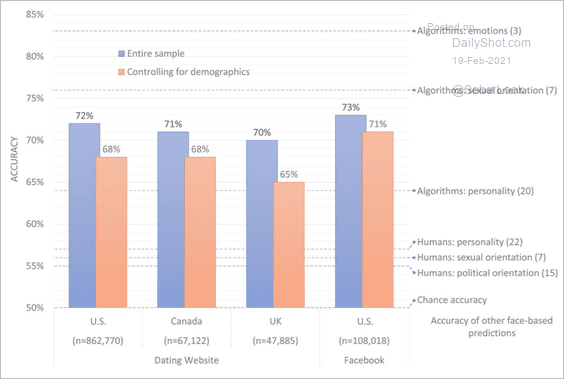 Source: Nature Read full article
2. “Widow’s succession” in US Congress:
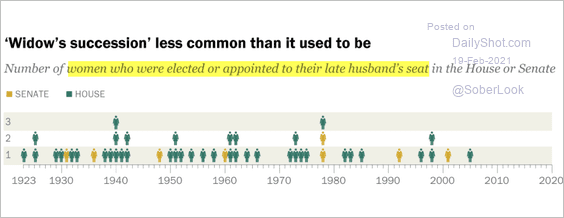 Source: Pew Research Center Read full article
3. Republicans’ views on GOP senators:
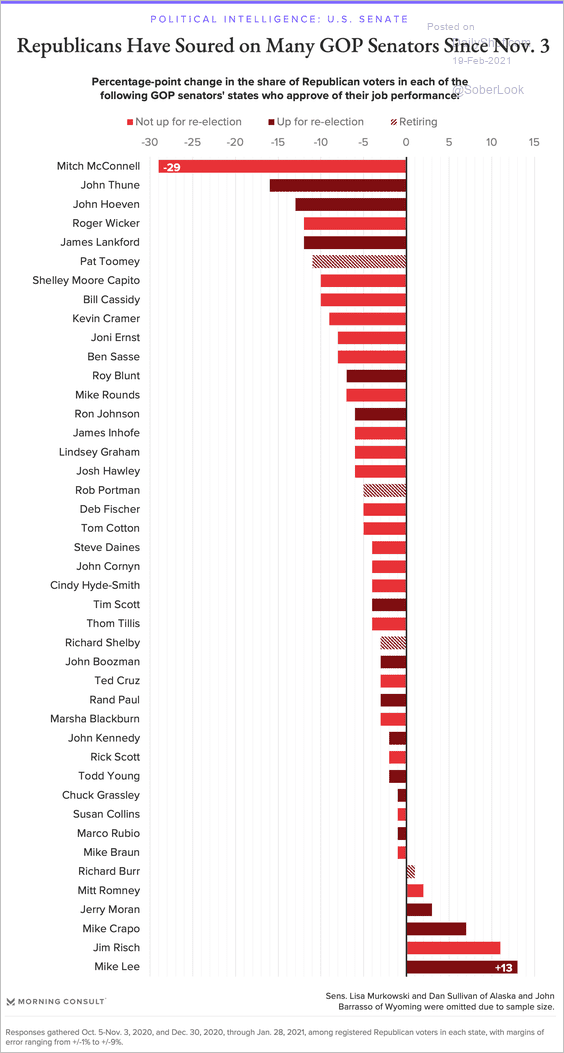 Source: Morning Consult Read full article
4. Fiscal stimulus in select countries:
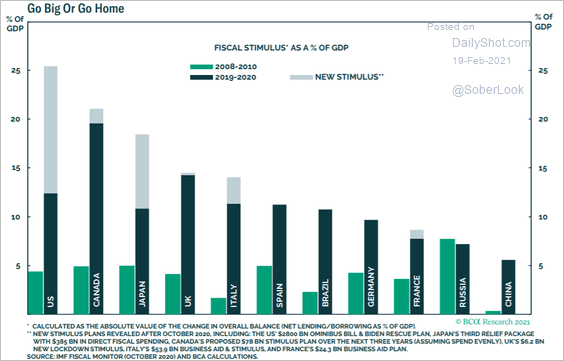 Source: BCA Research
5. 2020 was a warm year:
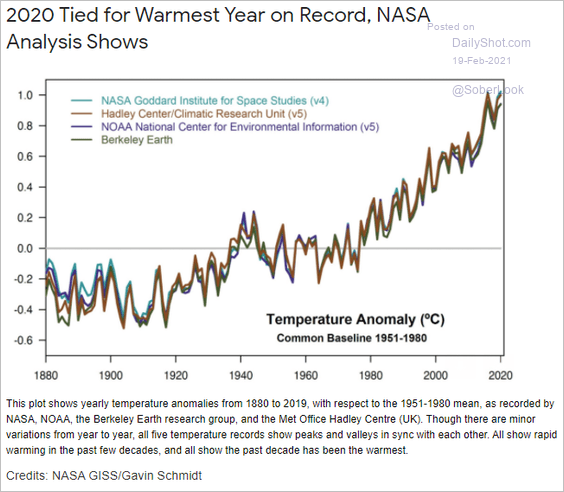 Source: NASA Read full article
6. Asia’s relative success with vaccinations:
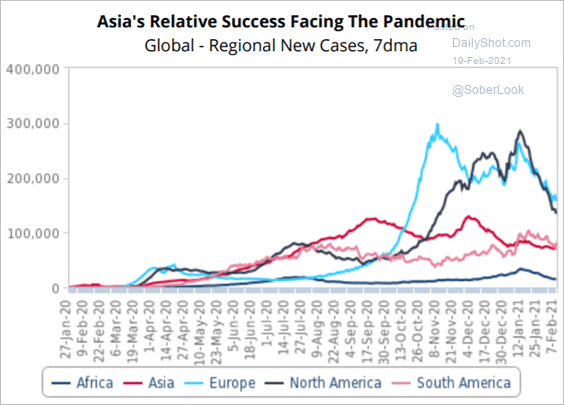 Source: Fitch Solutions Macro Research
7. Staying in and cooking dinners:
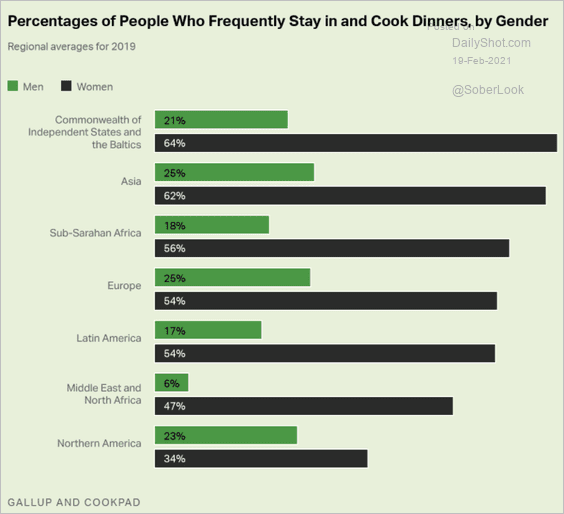 Source: Gallup Read full article
8. Online search activity for different types of vehicles:
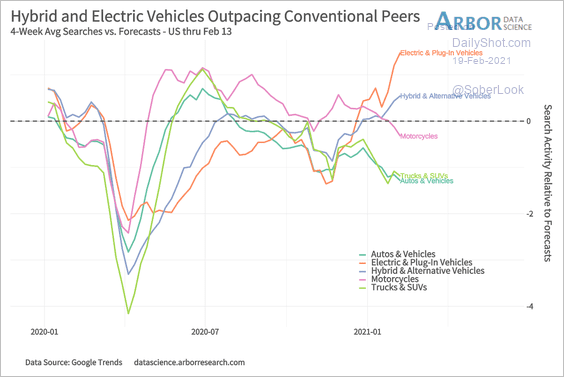 Source: Arbor Research & Trading
9. The 12 movies with the most f-bombs in them:
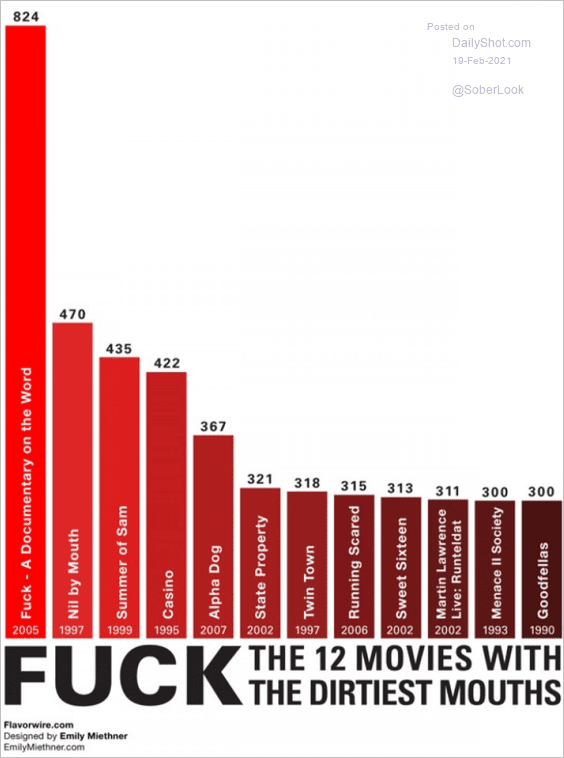 Source: Flavorwire Further reading
——————–
Have a great weekend!