
The Daily Shot: 04-Apr-22
• The United States
• Canada
• The Eurozone
• Europe
• Asia – Pacific
• China
• Emerging Markets
• Cryptocurrency
• Commodities
• Energy
• Equities
• Credit
• Global Developments
• Food for Thought
The United States
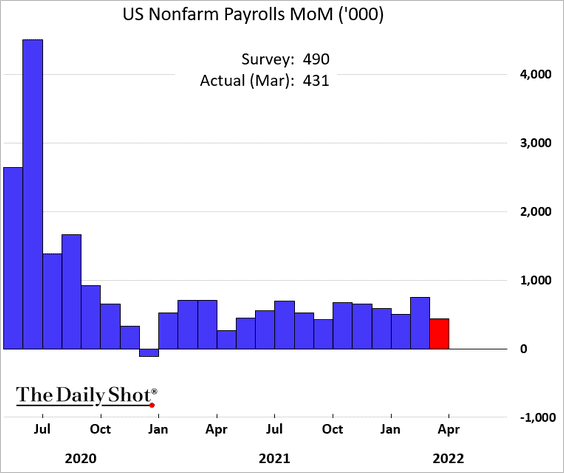
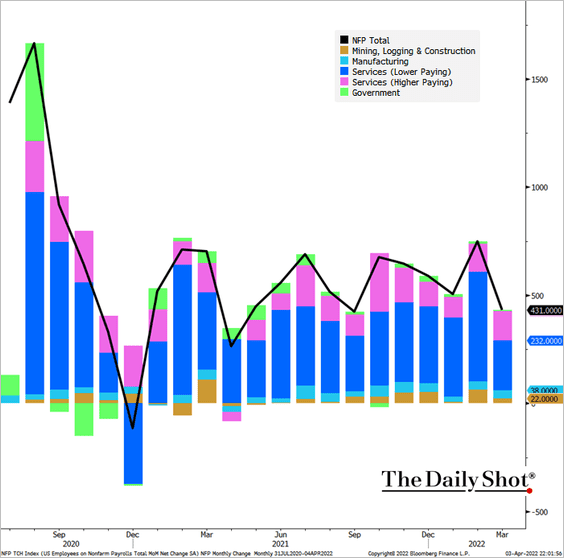
1. March job gains were a bit below consensus but still substantial.
 Source: @TheTerminal, Bloomberg Finance L.P.
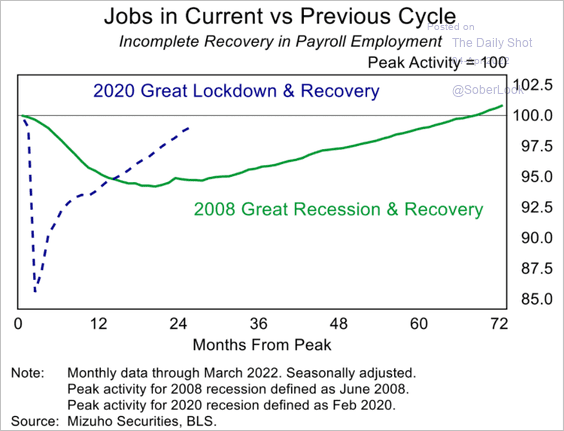
• Total employment is approaching pre-pandemic levels.
 Source: Mizuho Securities USA
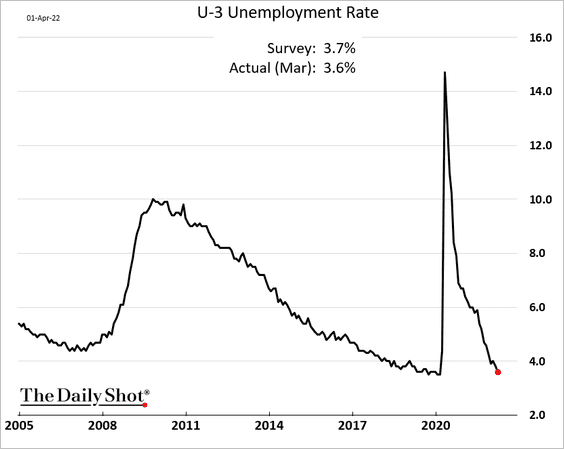
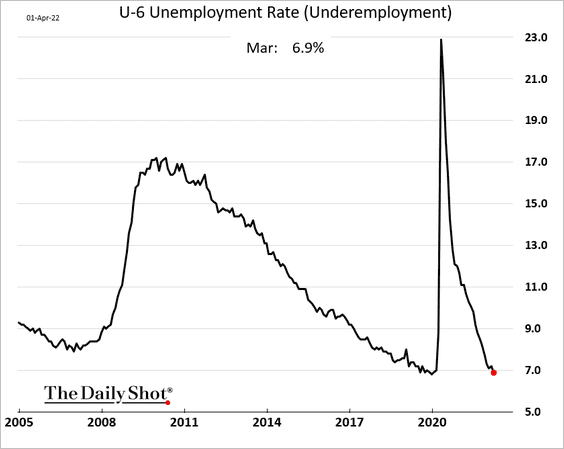
• The unemployment rate shows continuing tightness in the labor market.
Here is a measure of underemployment.
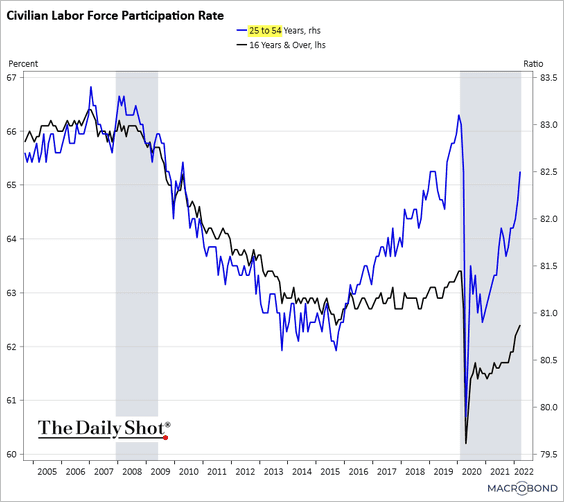
• Labor force participation continues to improve, especially for prime-age workers. This is a green light for the Fed to rapidly push up rates.
 Source: Chart and data provided by Macrobond
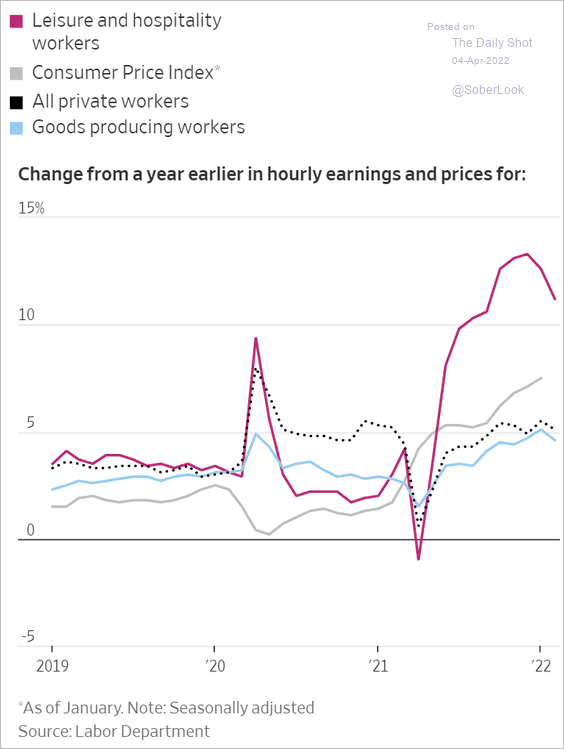
• Wage growth has been improving, but for now, it’s not signaling a wage-price spiral.
 Source: @WSJ Read full article
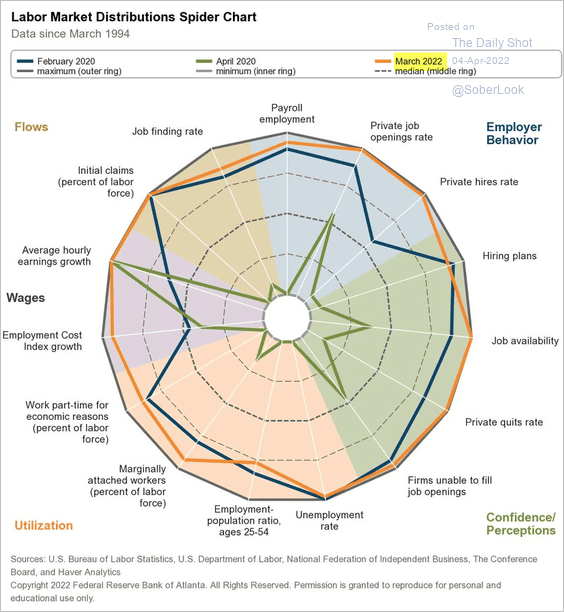
• On the whole, the labor market looks stronger than it was before the pandemic.
 Source: @AtlantaFed, @BLS_gov
——————–
2. After the employment report, the market priced in a high probability of nine additional 25 bps rate hikes this year.
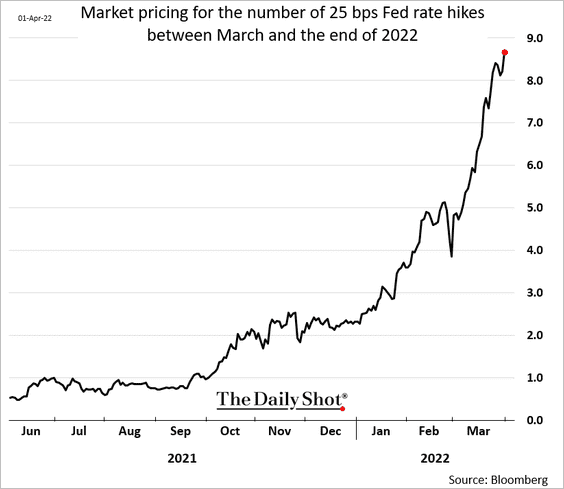
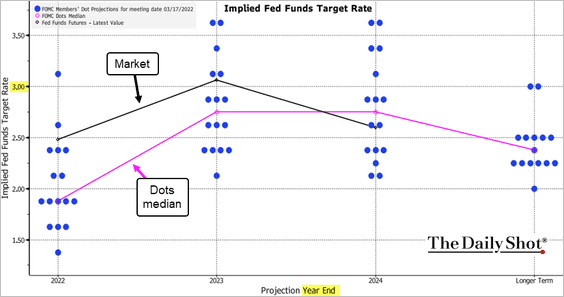
At 2.5% priced in by the end of the year, the market is now well above the FOMC dot plot.
 Source: Bloomberg
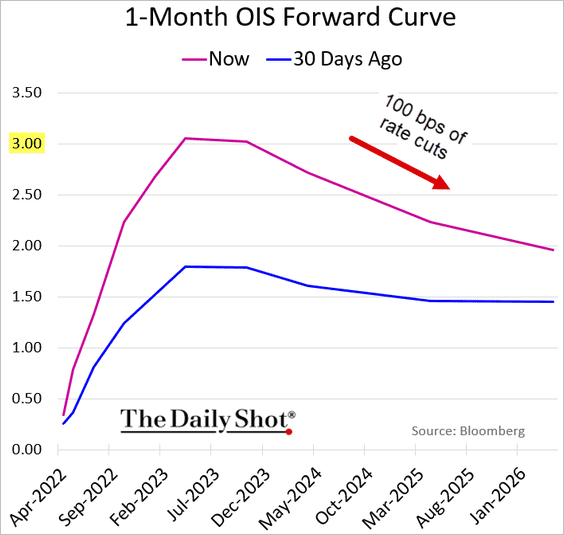
The market now sees the Fed pushing rates above 3%, with some 100 bps of rate cuts priced in starting in 2024.
3. The payrolls report solidified the yield curve inversion (3 charts).
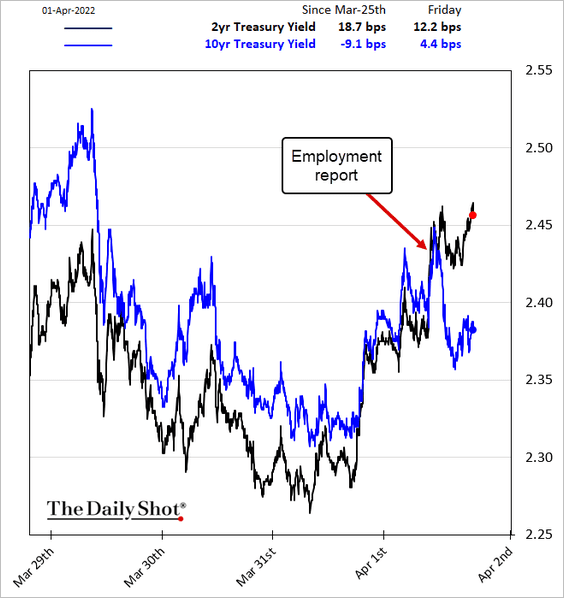
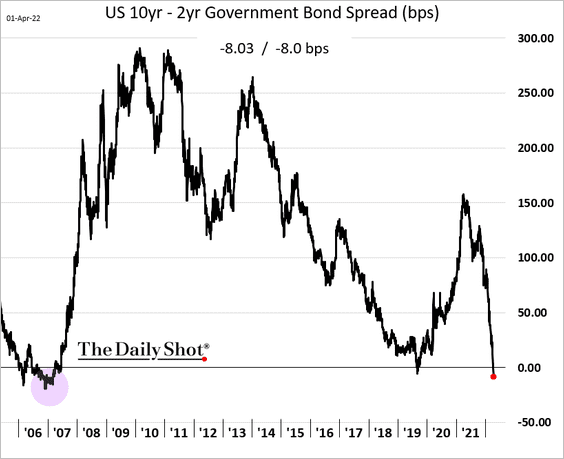
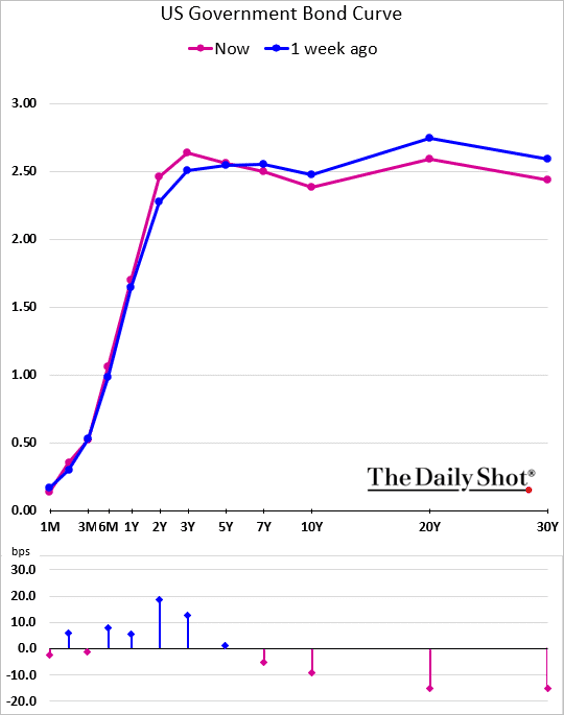
The curve inversion doesn’t mean recession is imminent. The lead time from the 2s/10s inversion can range from seven months to 33 months.
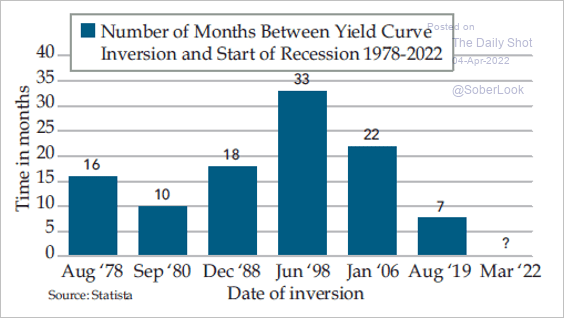 Source: @DiMartinoBooth
——————–
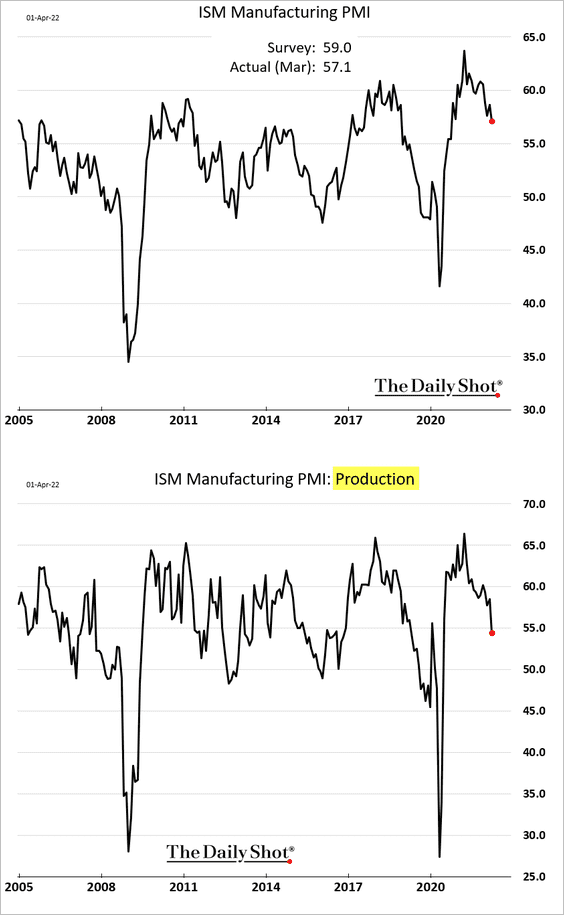
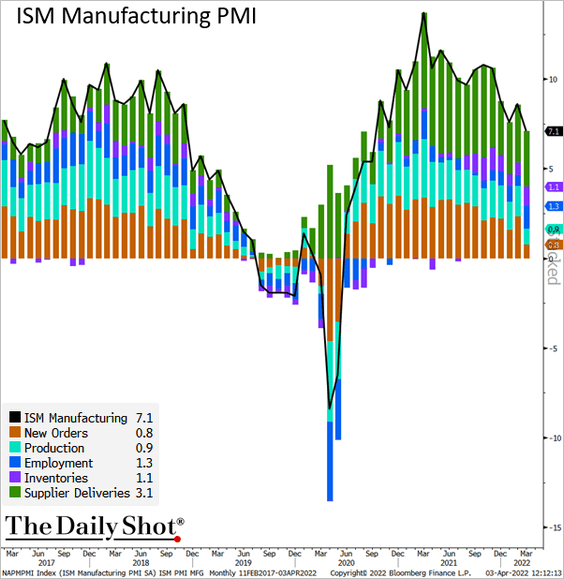
4. The ISM manufacturing PMI showed further moderation in factory activity last month.
 Source: @TheTerminal, Bloomberg Finance L.P.
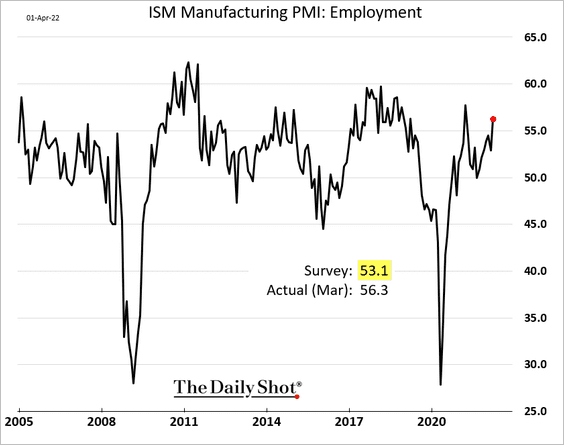
• Hiring has been strong.
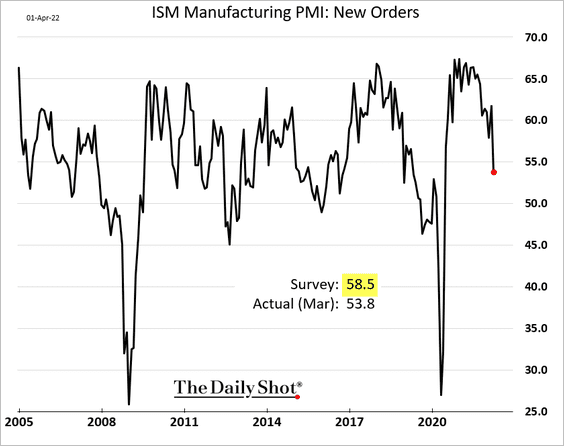
• But growth in new orders slowed sharply.
• The ratio of orders to inventories (indices) deteriorated, …
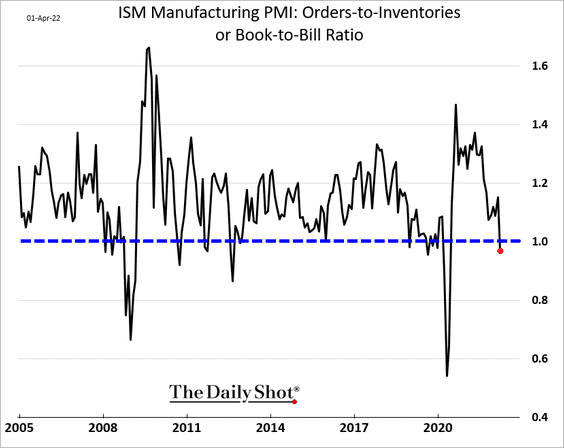
… pointing to weakness ahead for US manufacturing.
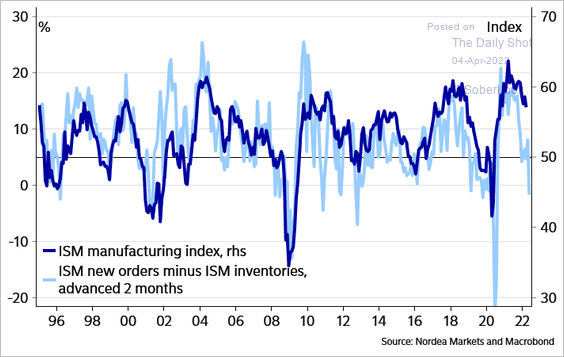 Source: @SvendsenAnders
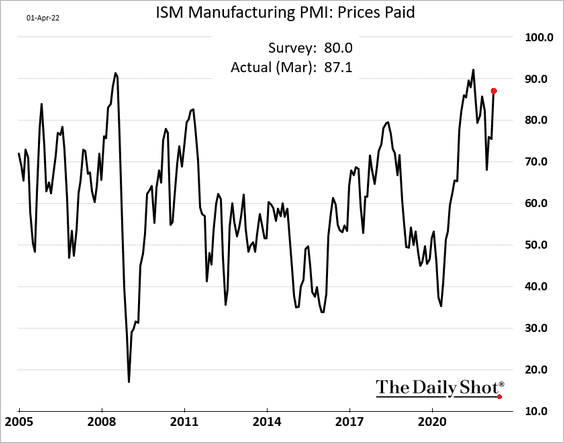
• Prices pressures remain elevated.
——————–
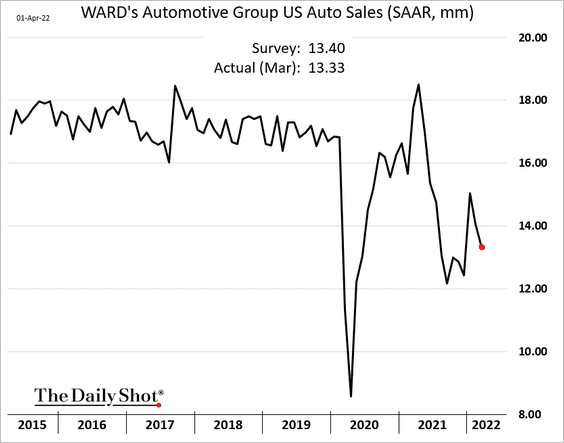
5. US vehicle sales declined again last month.
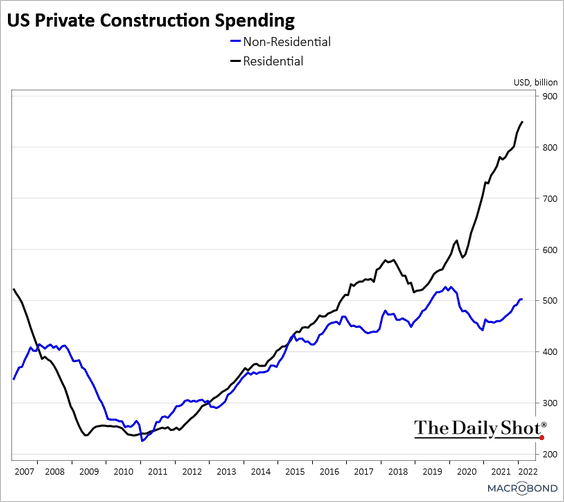
6. Residential construction spending continues to widen its lead over private non-residential expenditures.
7. In the past 50 years, the US has seen longer expansions and shorter recessions. Most cycles, however, have seen real GDP peak early in the recovery.
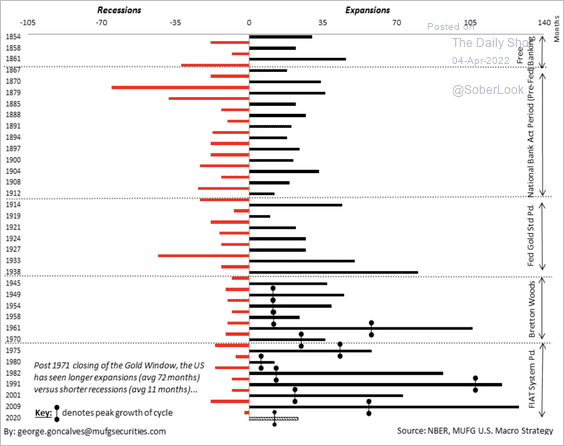 Source: MUFG
Back to Index
Canada
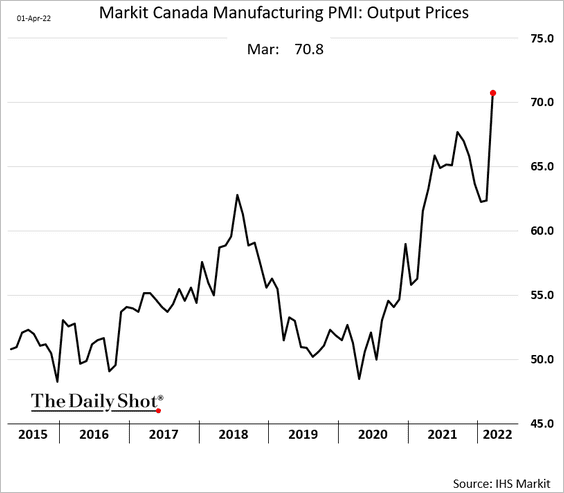
1. The Markit Manufacturing PMI hit a record high as Canada’s factory activity forges ahead.
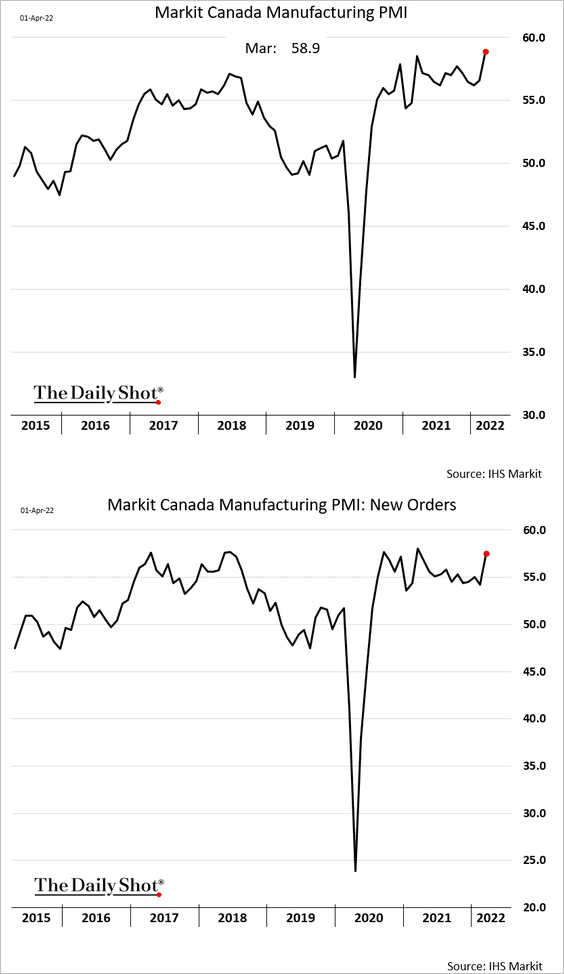
Manufacturers are rapidly boosting prices.
——————–
2. How much will the BoC raise rates before the central bank is done with the tightening cycle? Here is a forecast from Wells Fargo.
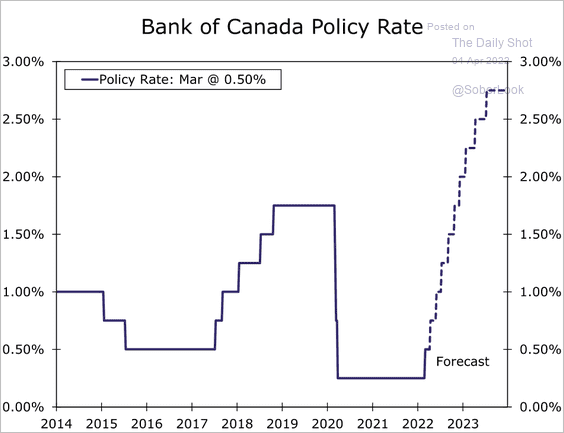 Source: Wells Fargo Securities
3. The nation’s energy companies are very profitable.
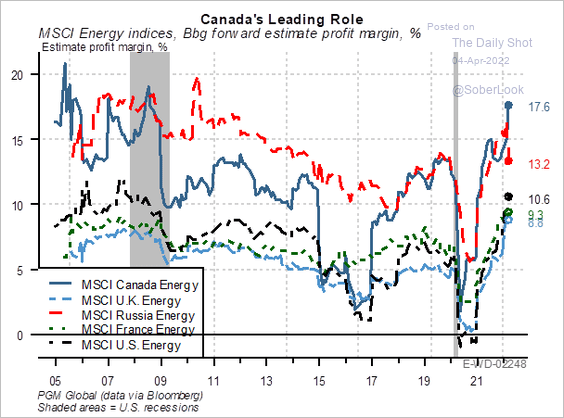 Source: PGM Global
Back to Index
The Eurozone
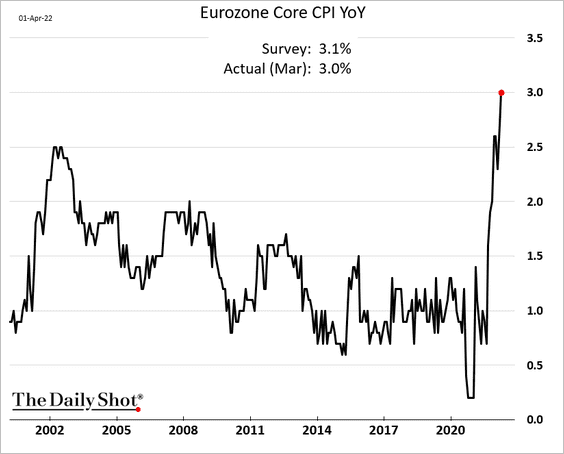
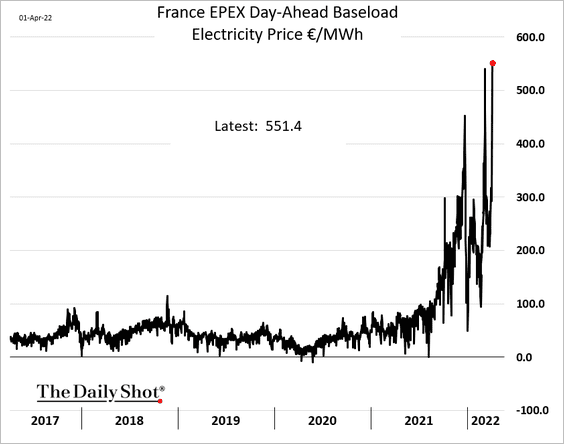
1. As we saw last week, inflation continues to surge.
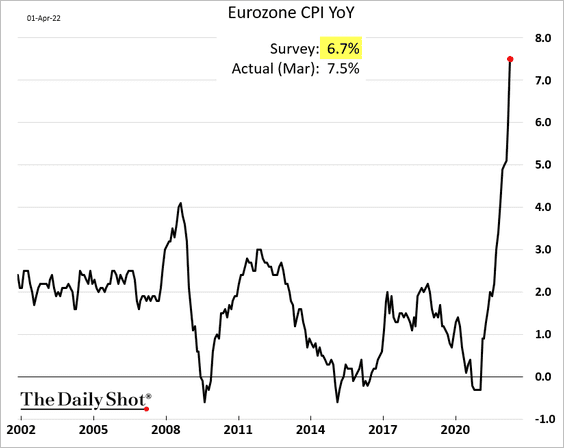
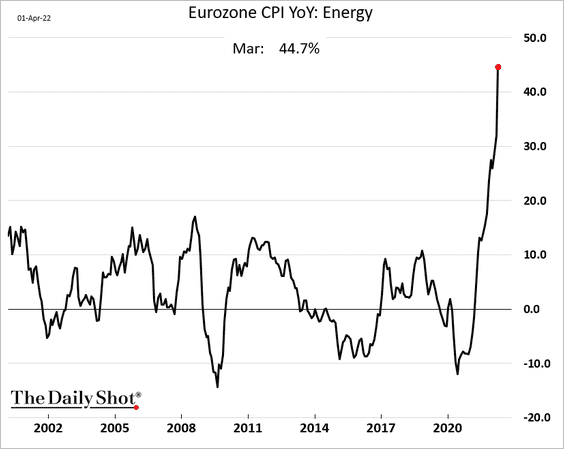
Energy CPI is up almost 45% vs. a year ago.
And there is more to come. The chart below shows French electricity prices.
By the way, here is the nation’s nuclear power output.
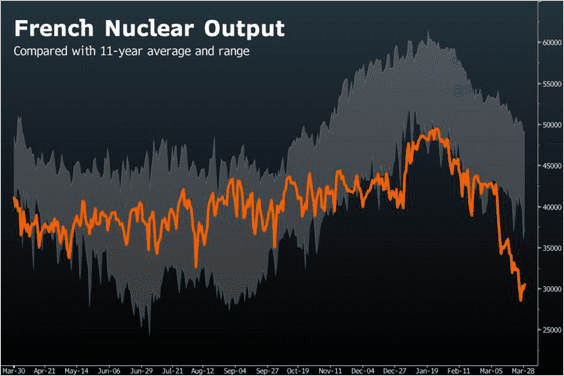 Source: Bloomberg Read full article
——————–
2. The updated euro-area manufacturing PMI shows slower growth, although activity has been resilient in the face of the war.
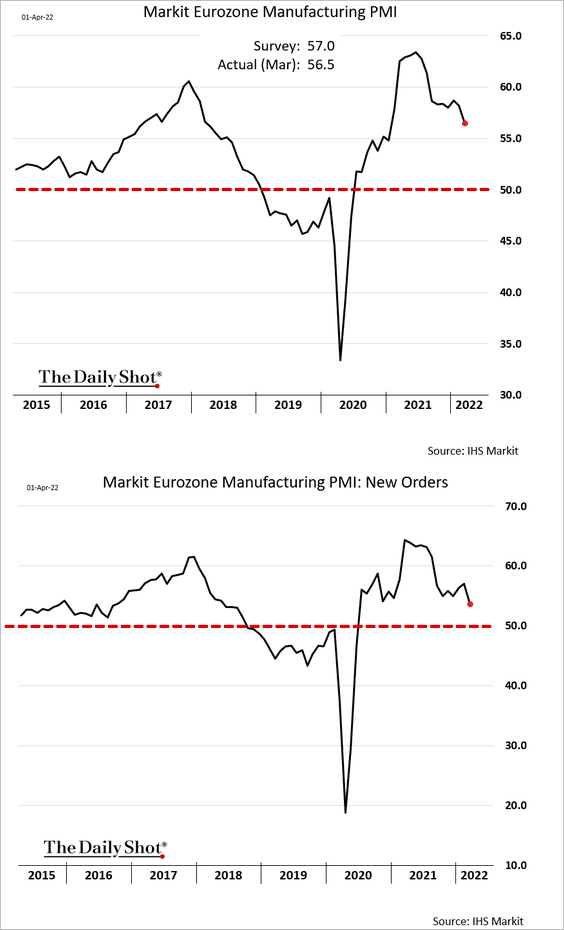
Here are the PMI trends for Spain and Italy.
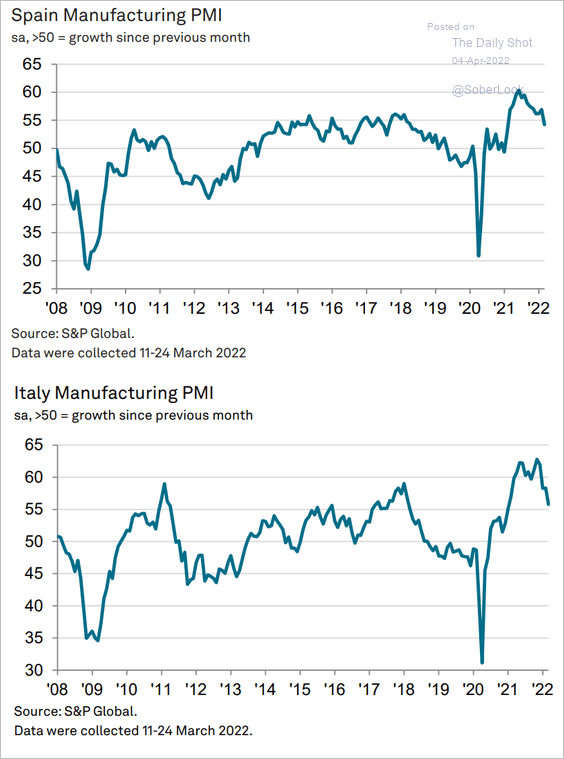 Source: IHS Markit
Back to Index
Europe
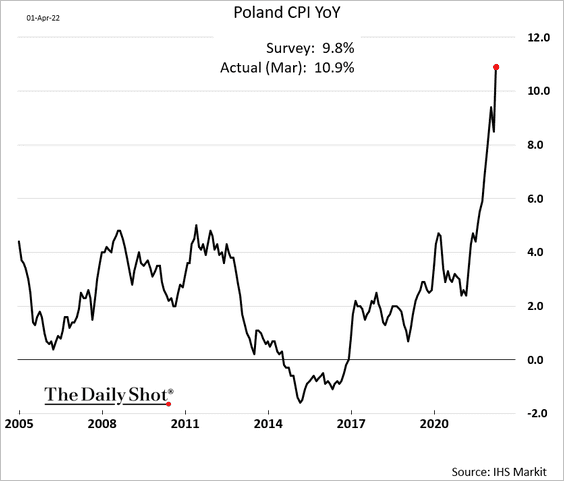
1. Poland’s CPI blasted past 10%.
2. Power prices across Europe hit extreme levels last month.
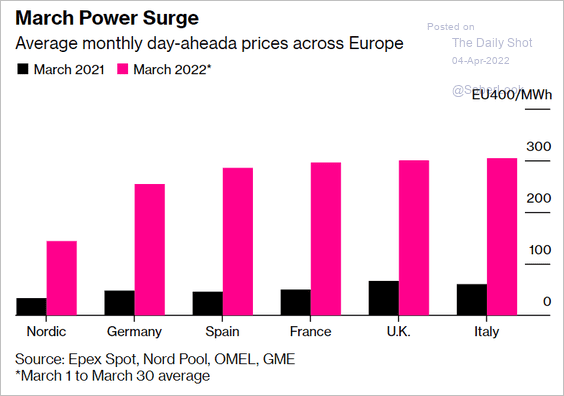 Source: Bloomberg Read full article
3. European shares trade at a deepening discount to US peers.
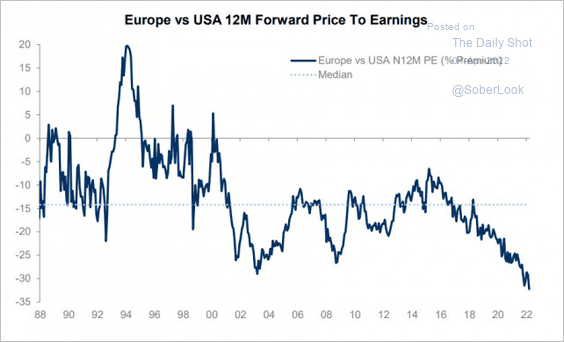 Source: @Callum_Thomas, @topdowncharts Read full article
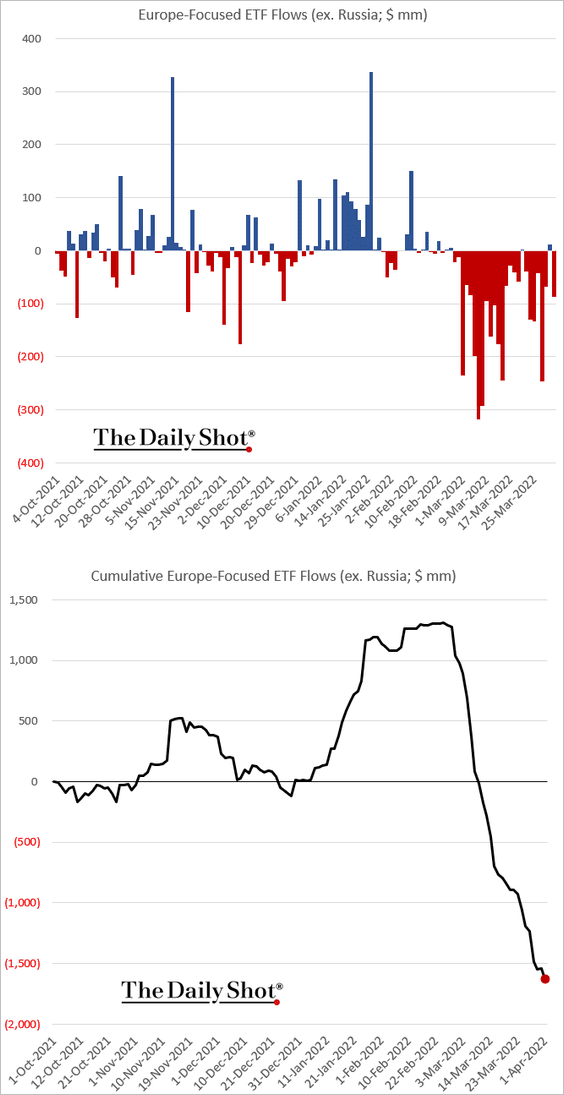
4. Europe-focused ETFs continue to see outflows.
Back to Index
Asia – Pacific
1. There has been a clear break between the latest yen moves versus prior patterns into and out of Fed hikes.
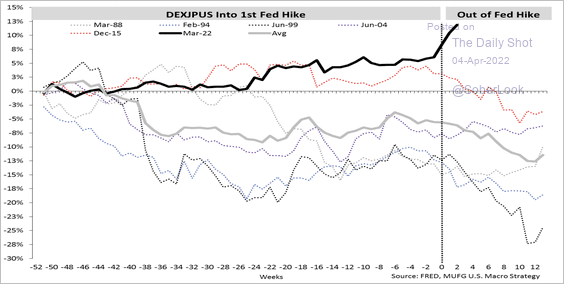 Source: MUFG
The weak yen has benefited Japanese stocks.
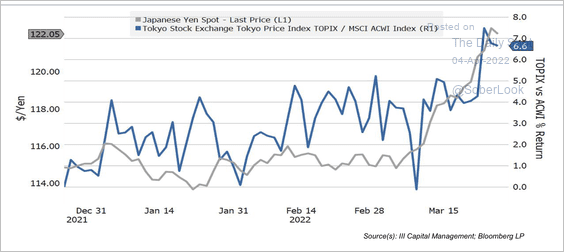 Source: III Capital Management
——————–
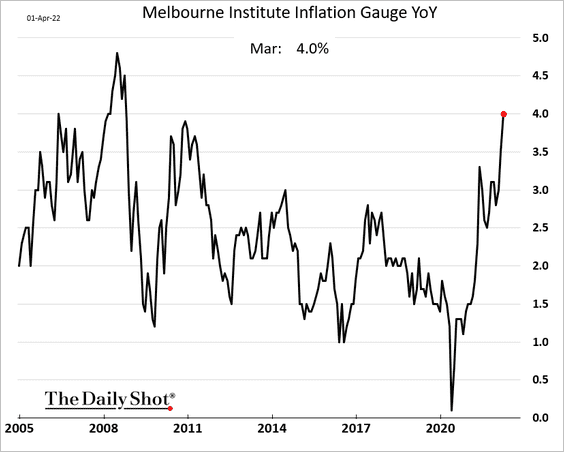
2. Australia’s inflation tracker hit the highest level since 2008 last month.
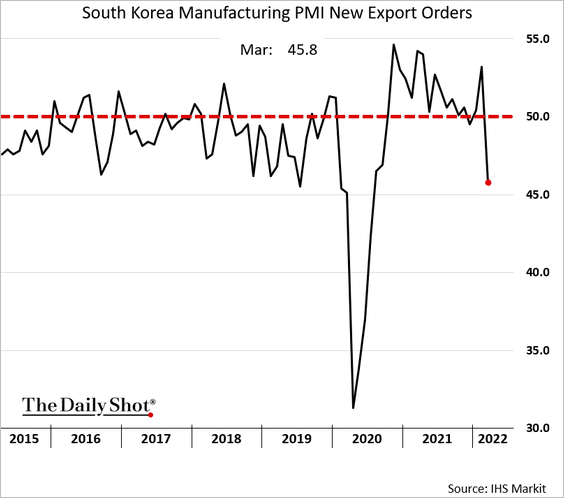
3. South Korea’s manufacturing PMI report from Markit showed substantial deterioration in export orders last month, even as exports hit a new high. Driven in part by lockdowns in China, this indicator could be signaling a sharp slowdown in global trade.
Back to Index
China
1. COVID cases continue to surge, with China discovering an even more contagious strain of omicron.
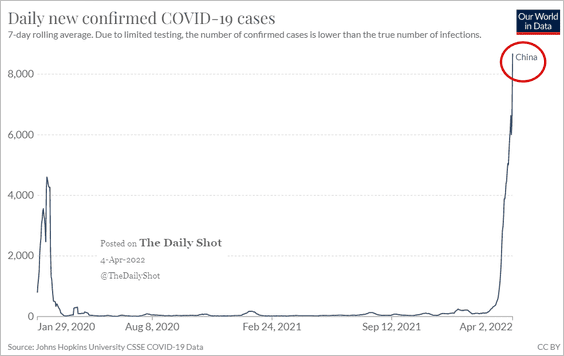 Source: Our World in Data
2. Shipping bottlenecks are worsening.
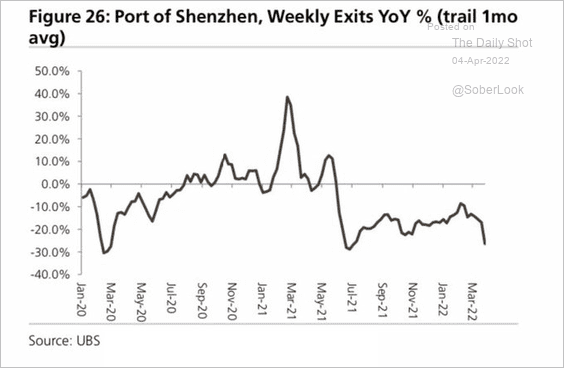 Source: UBS Research; @AlessioUrban
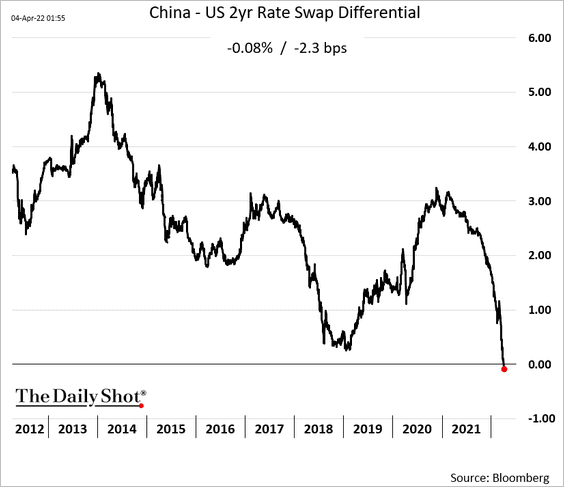
3. The 2-year rate differential with the US is now negative, an indication of divergence in monetary policies and economic growth. This can’t be good for the renminbi.
4. It was a rough quarter for mainland shares.
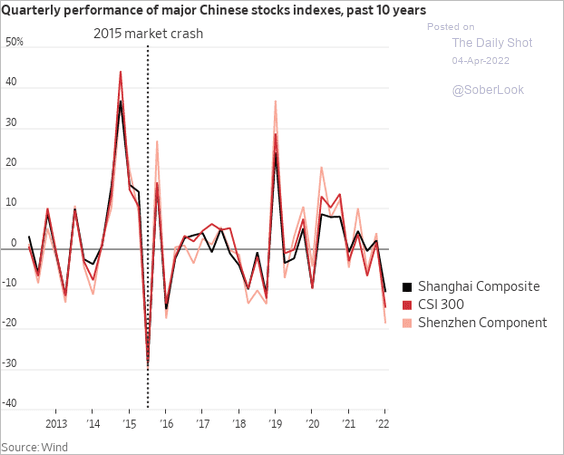 Source: @WSJ Read full article
5. Passenger vehicle sales volume ticked higher in February.
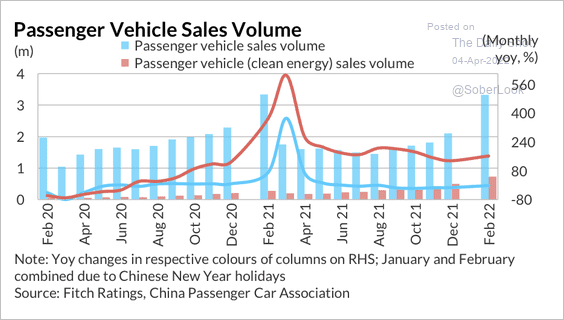 Source: Fitch Ratings
Back to Index
Emerging Markets
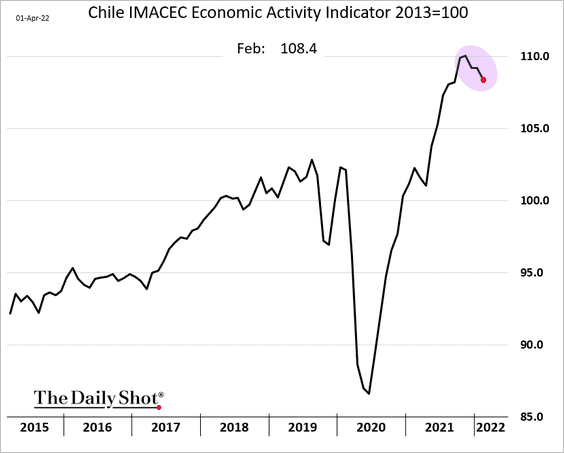
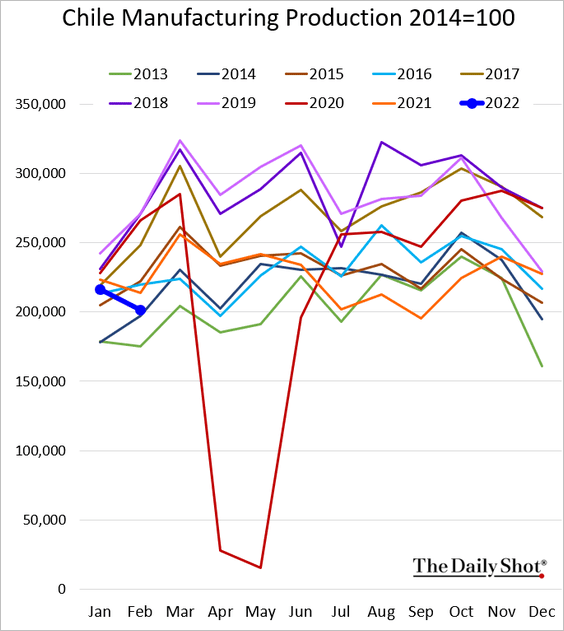
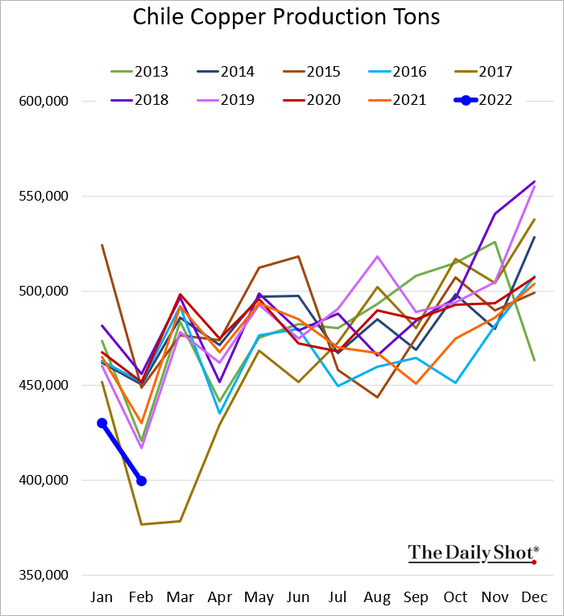
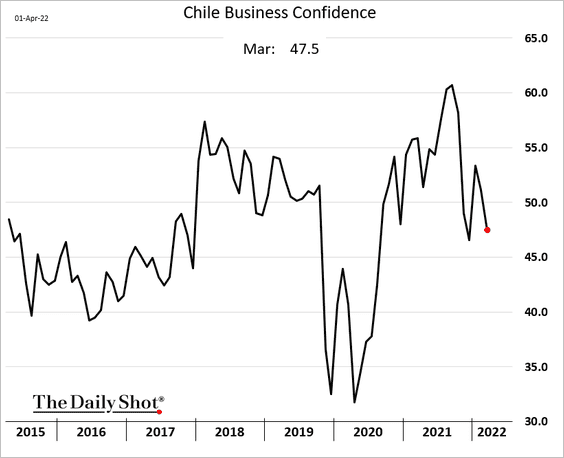
1. Let’s begin with Chile, where we see further signs of slowing economic activity.
• Factory output:
• Mining output:
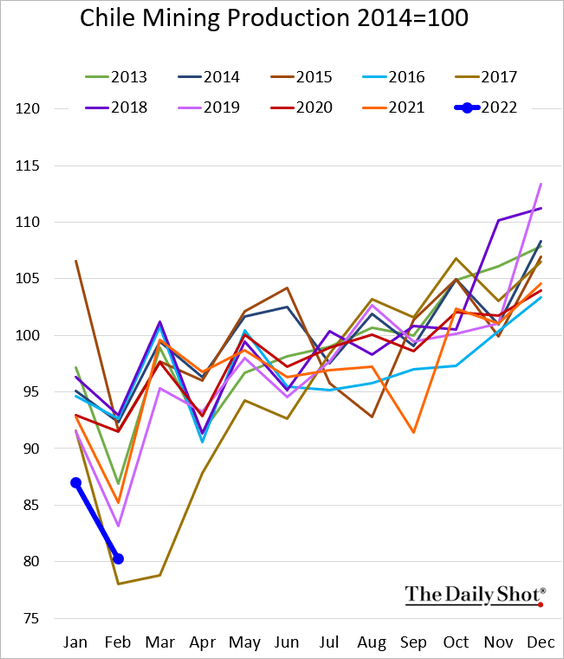
• Copper production (volume):
• Business confidence:
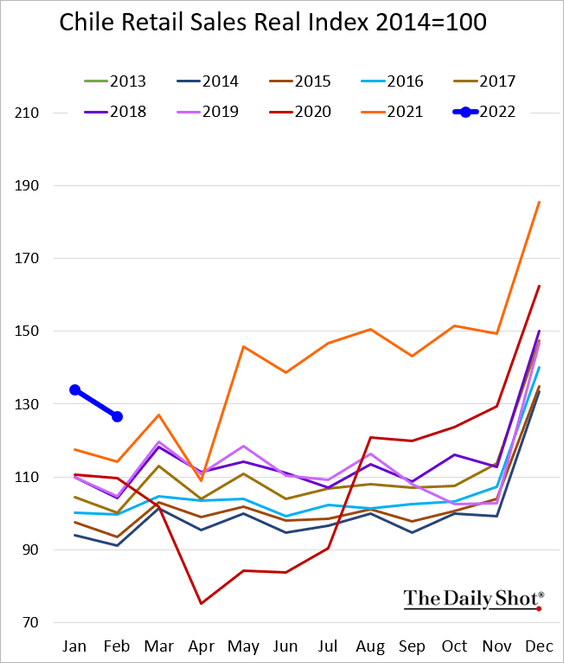
• Retail sales were still very strong in February, but the decline from January was bigger than usual.
——————–
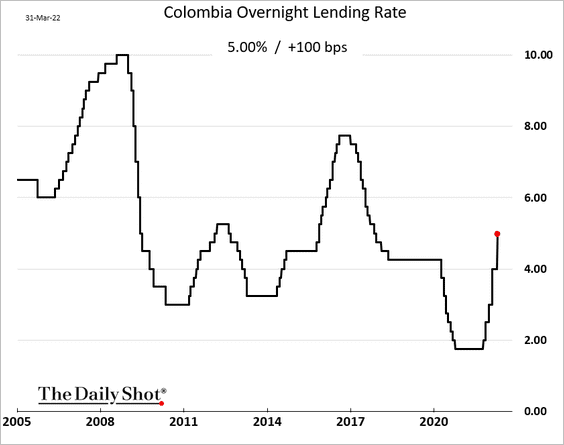
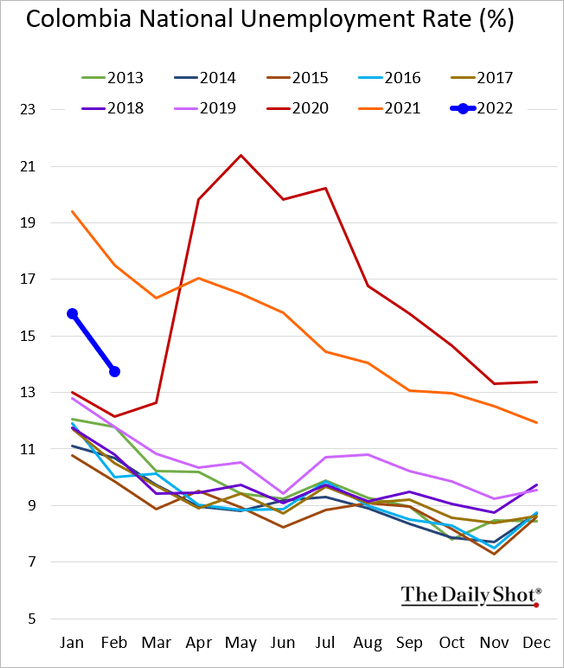
2. Colombia’s central bank hiked rates by 100 bps (the market expected 150 bps).
The unemployment rate is falling rapidly.
——————–
3. Mexico’s factory activity has been in contraction mode (PMI < 50) since the start of the pandemic.
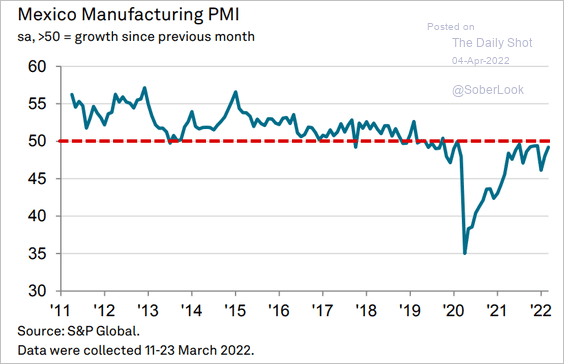 Source: IHS Markit
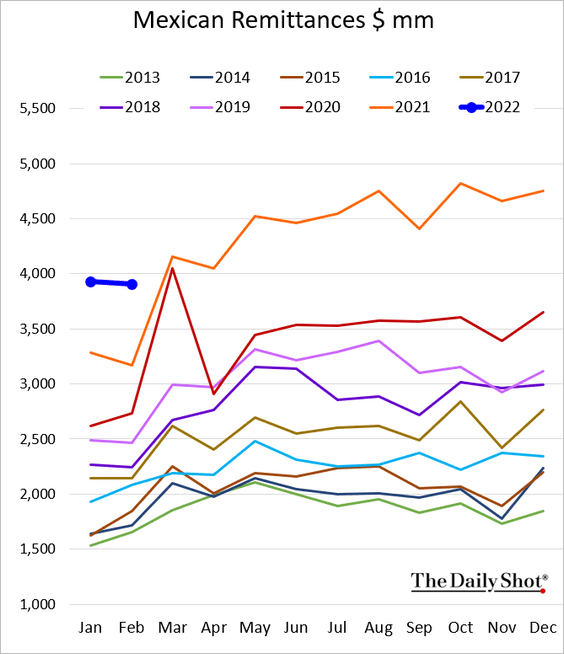
Remittances have been exceptionally strong.
——————–
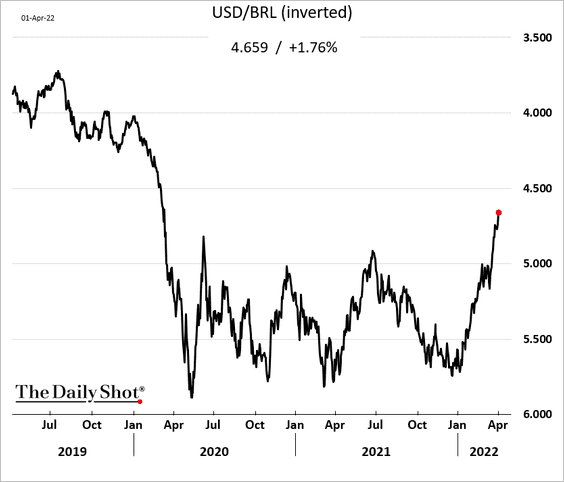
4. Next, we have some updates on Brazil.
• The real is surging amid robust capital inflows.
• Factory activity swung into (modest) growth last month.
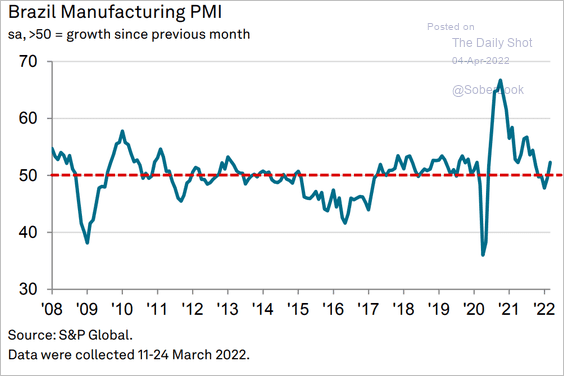 Source: IHS Markit
• Industrial production ticked up in February, …
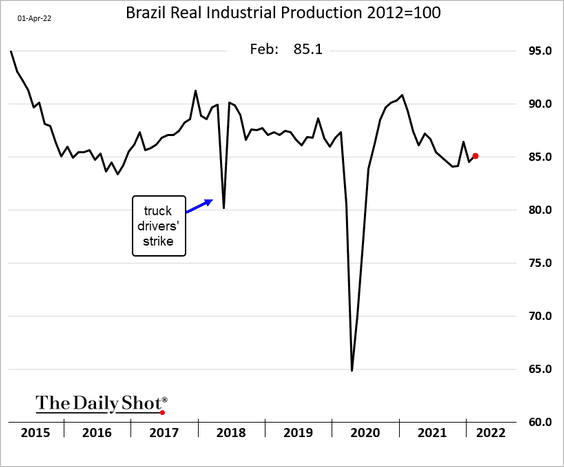
… but sentiment points to downside risks ahead.
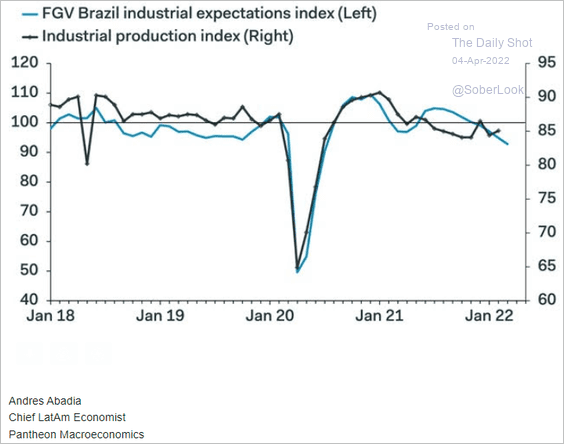 Source: Pantheon Macroeconomics
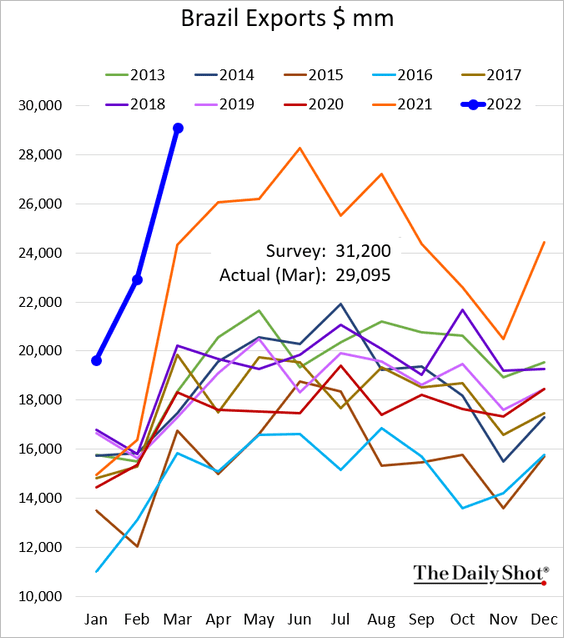
• Exports were below consensus forecasts but still hit a new high.
——————–
5. Russia’s factory activity tumbled last month.
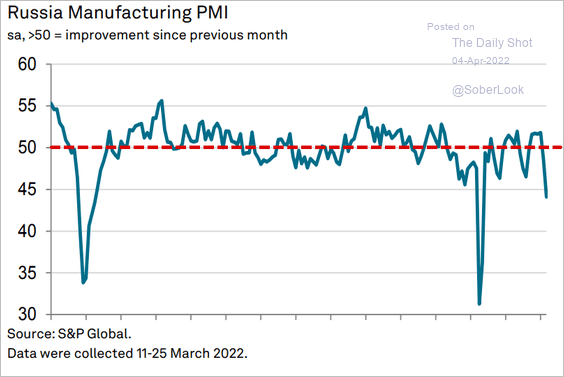 Source: IHS Markit
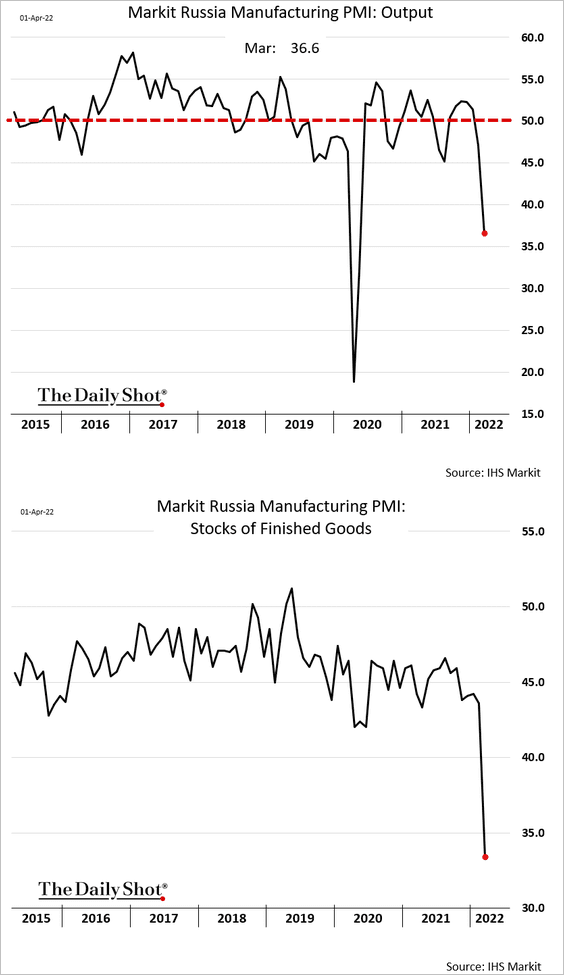
• Production deteriorated, and finished goods inventories slumped.
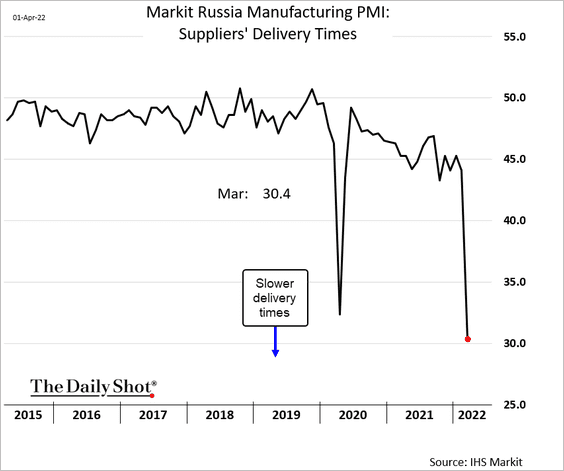
International sanctions caused a collapse in supplier deliveries, …
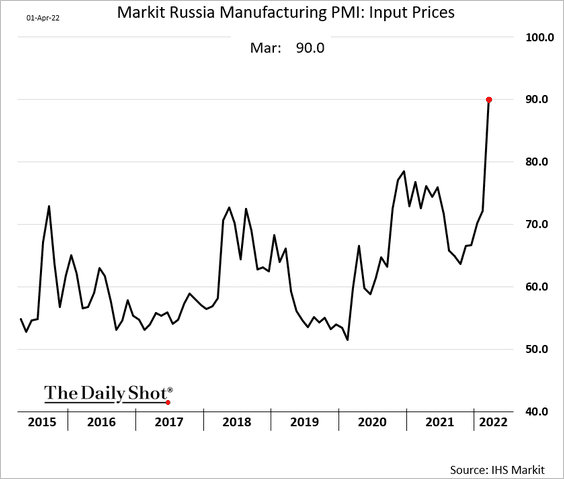
… sending costs soaring.
Back to Index
Cryptocurrency
1. Typically, bitcoin performs well in April.
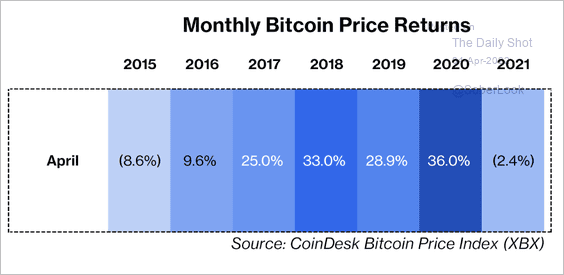 Source: CoinDesk Read full article
2. Persistent buying pressure from the Luna Foundation Guard has been a near-term tailwind for bitcoin’s price.
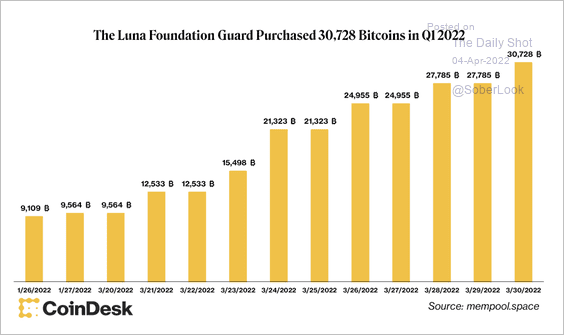 Source: CoinDesk Read full article
3. Spikes in bitcoin’s trading volume tend to occur during the first and last weeks of the month.
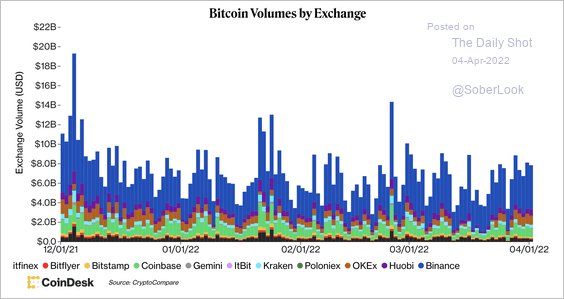 Source: CoinDesk Read full article
4. Bitcoin’s put/call ratio has stabilized over the past two weeks.
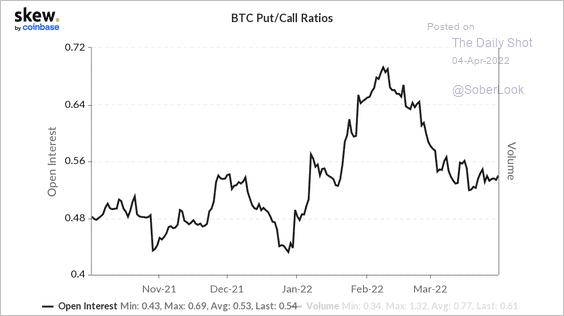 Source: @CoinbaseInsto
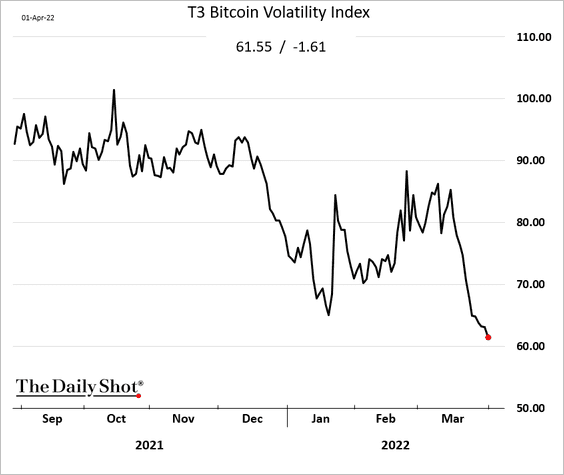
5. Bitcoin implied volatility has been falling.
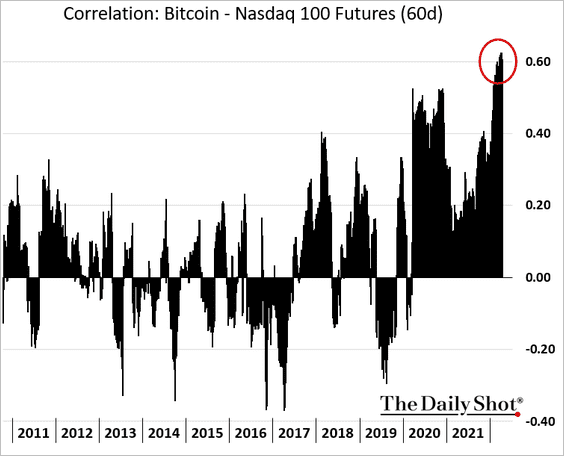
6. Bitcoin remains highly correlated with stocks.
Back to Index
Commodities
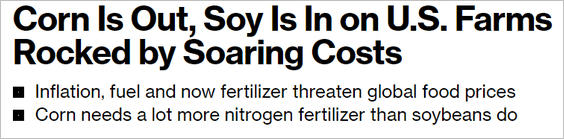
1. US farmers are switching from corn to soybeans as fertilizer prices soar.
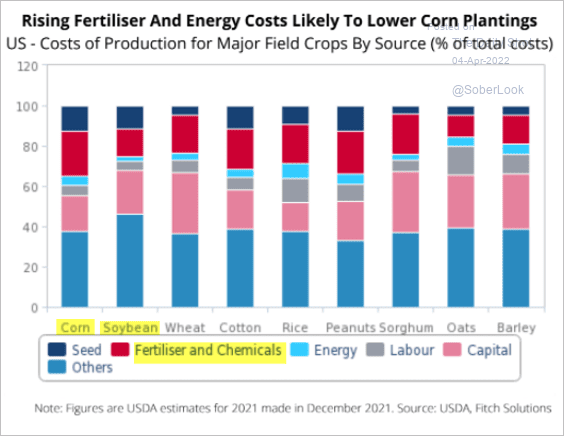 Source: Fitch Solutions Macro Research
 Source: @kannbwx
 Source: Bloomberg Read full article
——————–
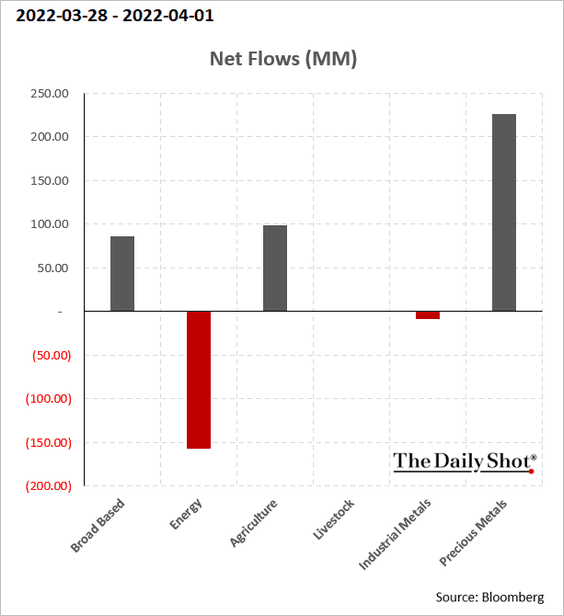
2. Precious metals continue to see fund inflows.
Back to Index
Energy
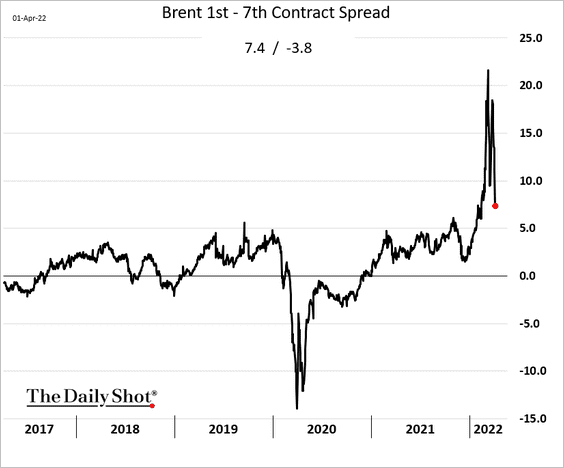
1. Crude oil backwardation is moderating.
2. What are the components of crude oil price gains relative to March 2021?
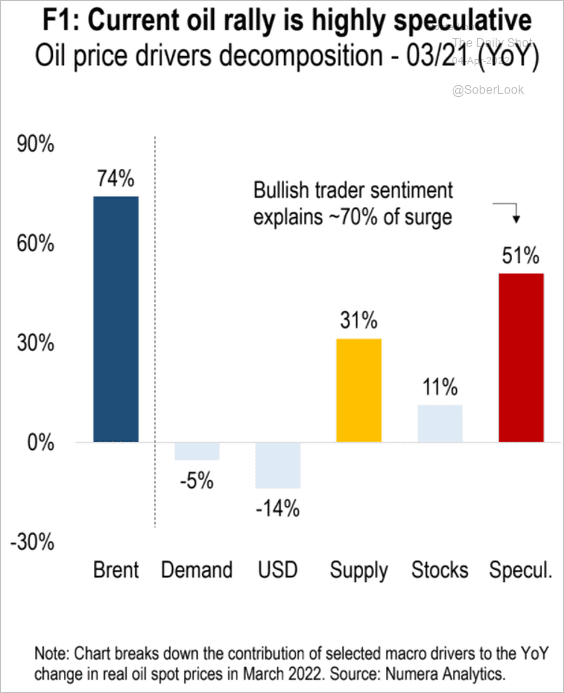 Source: Numera Analytics
3. Here is an oil supply/demand forecast from OIES.
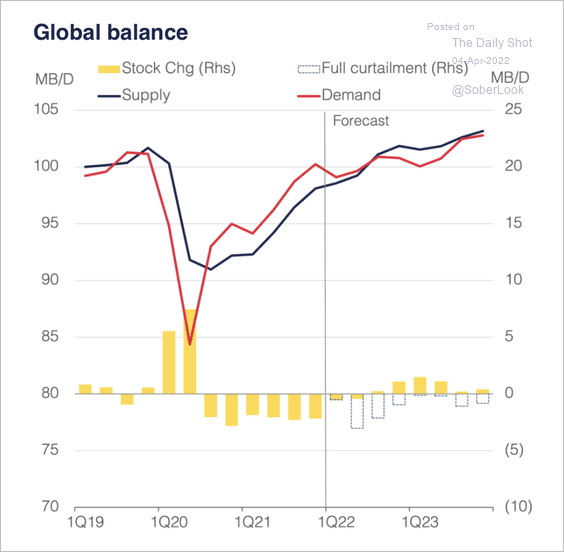 Source: Oxford Institute for Energy Studies
OIES expects a marginal impact on oil prices if Iranian output resumes.
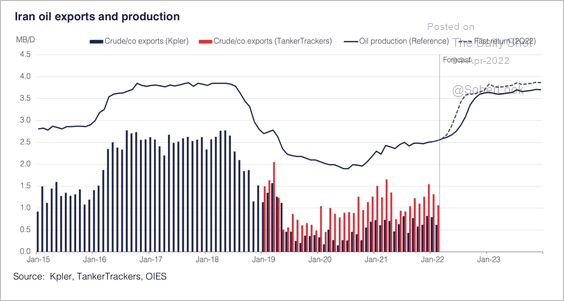 Source: Oxford Institute for Energy Studies
——————–
4. This chart shows the US Strategic Petroleum Reserve.
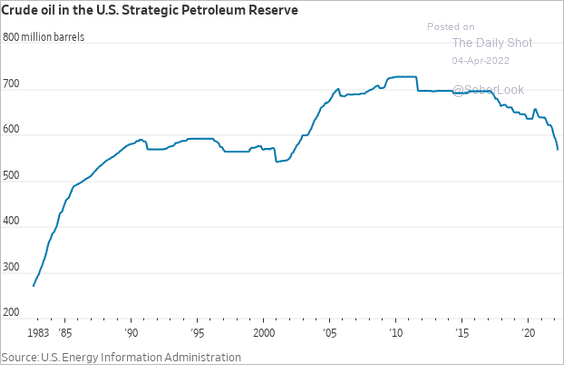 Source: @WSJ Read full article
5. Are elevated prices starting to weigh on US refined products’ demand?
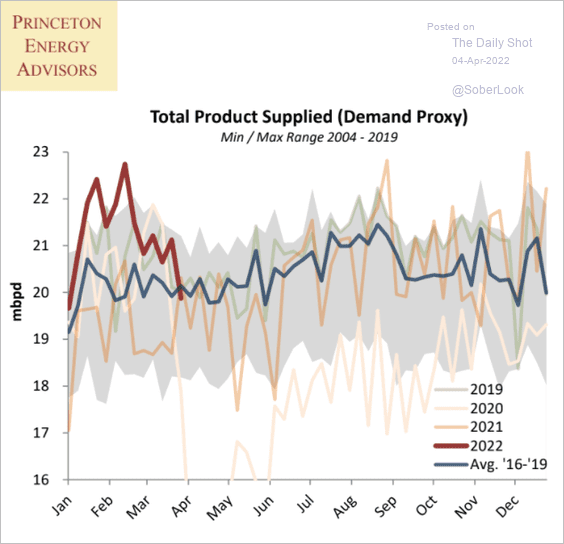 Source: Princeton Energy Advisors
Back to Index
Equities
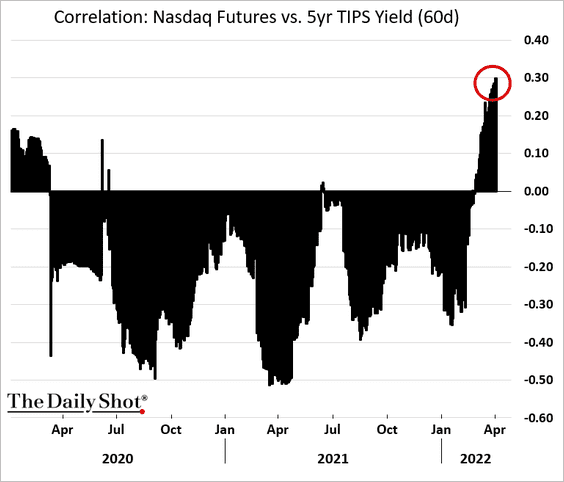
1. The market continues to ignore rising US real rates, …
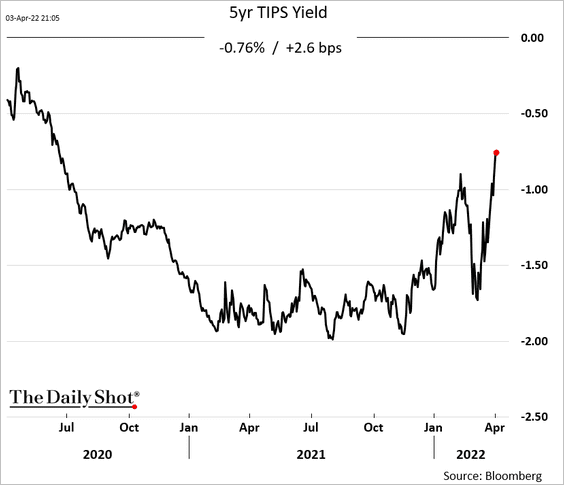
… as the equities/TIPS yields correlation turns increasingly positive.
——————–
2. Has the stock/bond ratio peaked?
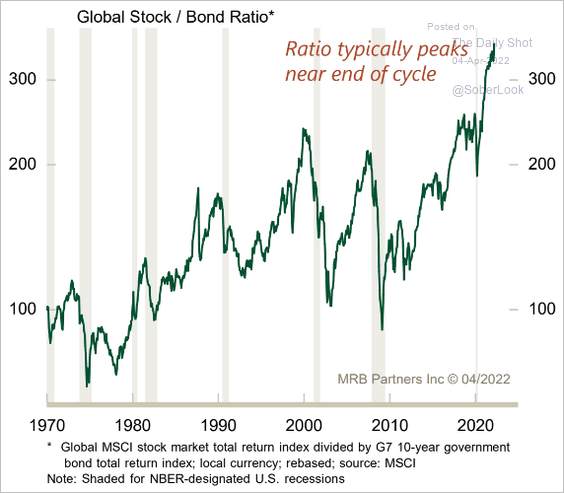 Source: MRB Partners
3. US shares have widened their outperformance vs. the rest of the world.
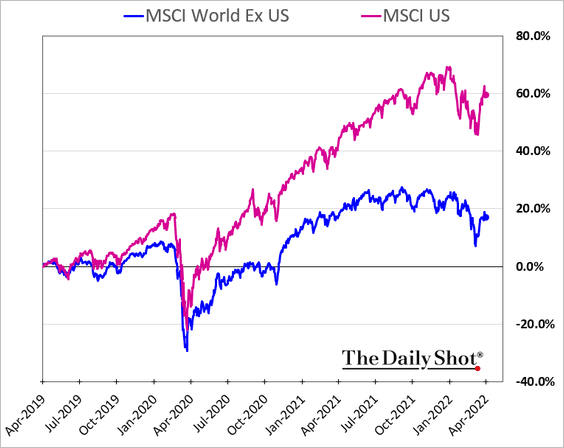
International stocks increasingly look attractive on a relative basis.
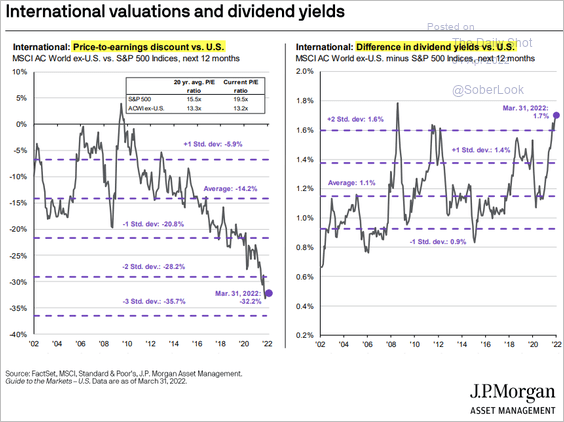 Source: J.P. Morgan Asset Management
——————–
4. Below is the March performance of equity indices in select countries.
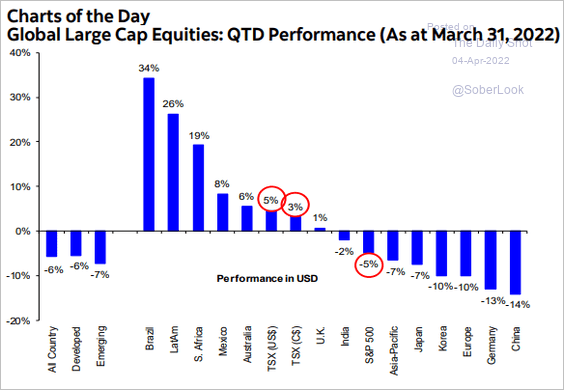 Source: Hugo Ste-Marie, Portfolio & Quantitative Strategy Global Equity Research, Scotia Capital
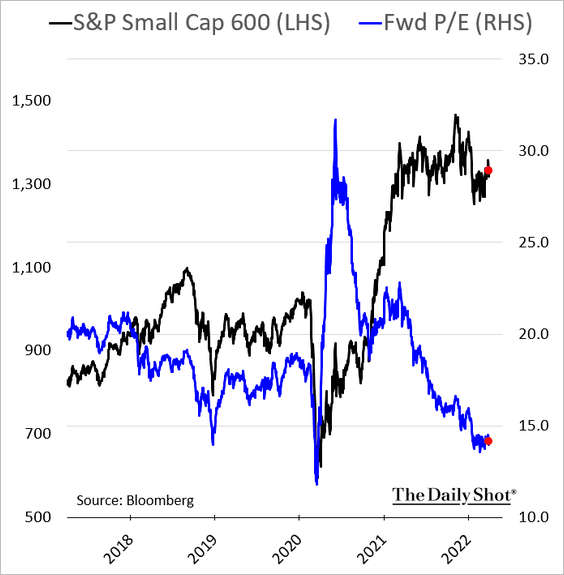
5. Small-cap valuations remain depressed relative to levels we saw in recent years.
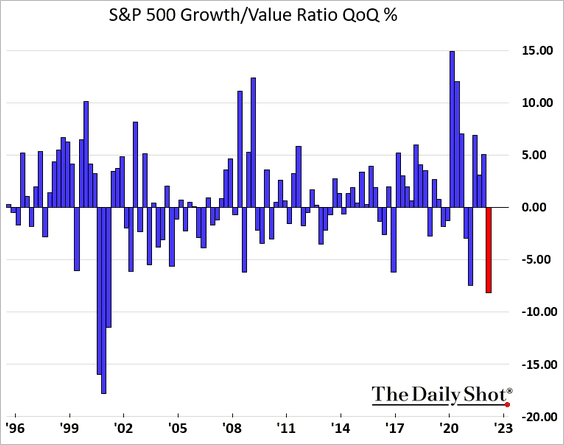
6. It was a tough quarter for growth stocks relative to value.
7. April tends to be a good month for stocks.
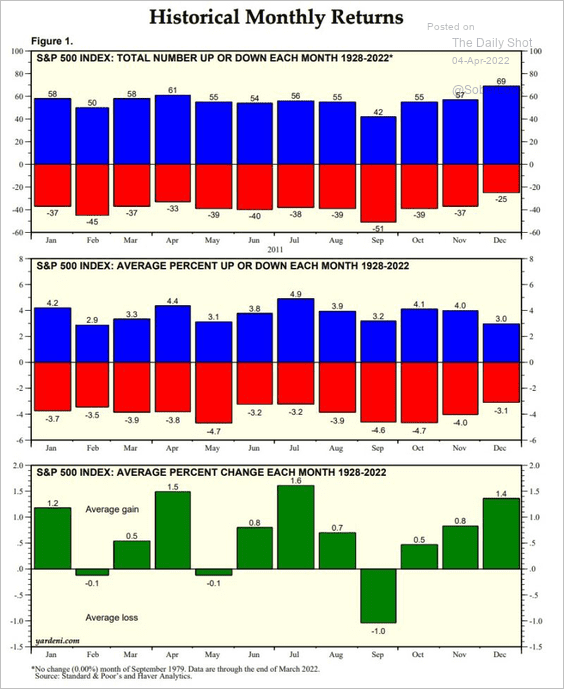 Source: Yardeni Research
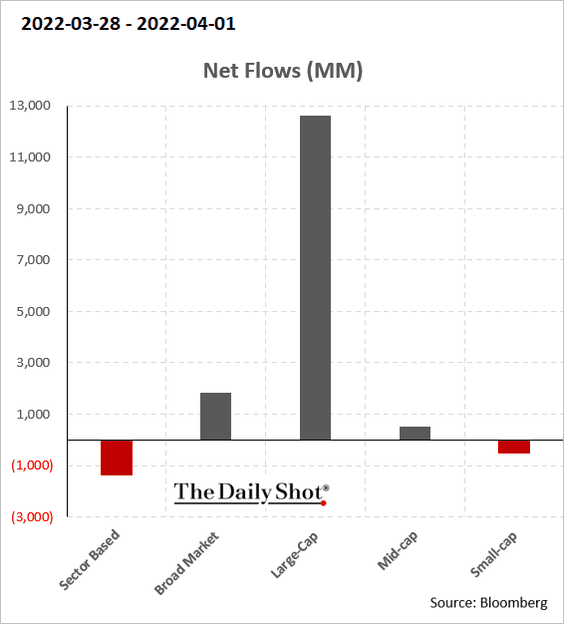
8. Next, we have some fund flow data.
• Once again, we had inflows into large caps last week.
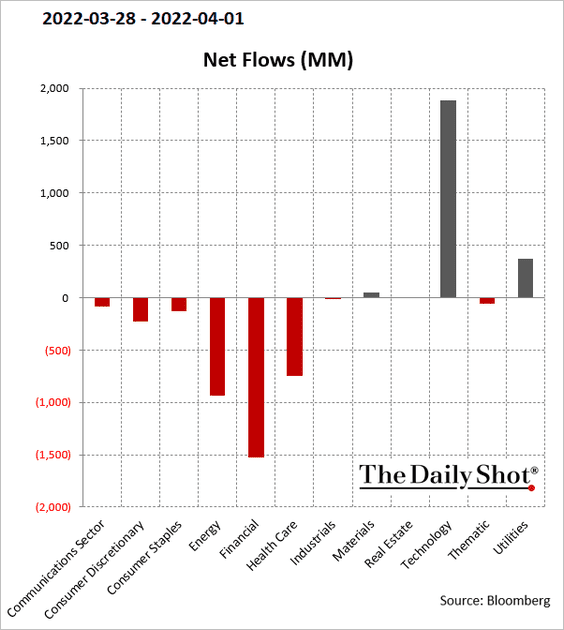
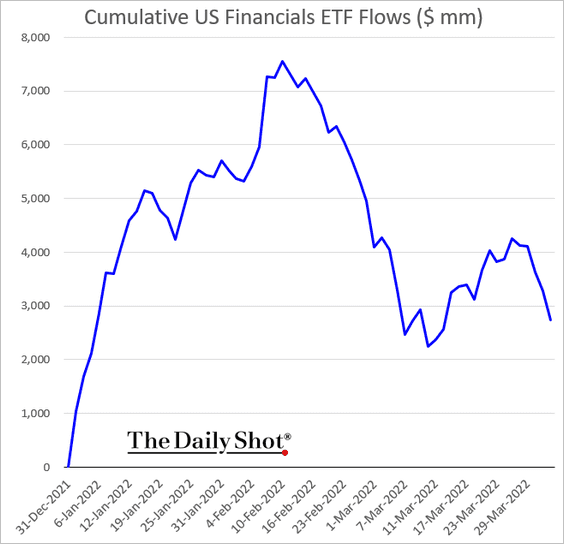
• Financials continue to see outflows (2 charts).
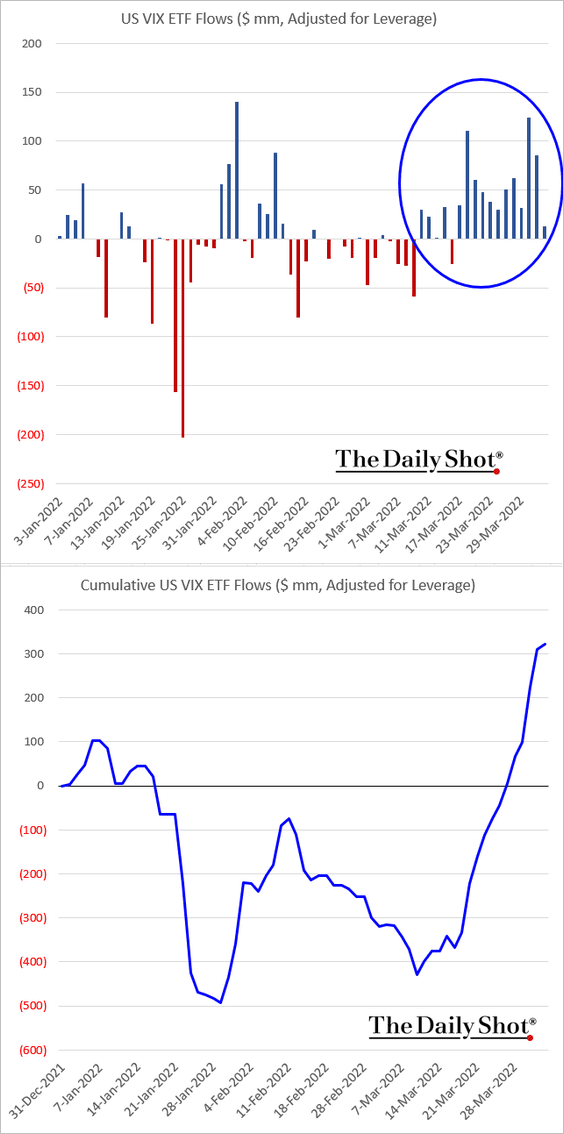
• VIX ETFs keep getting inflows.
Back to Index
Credit
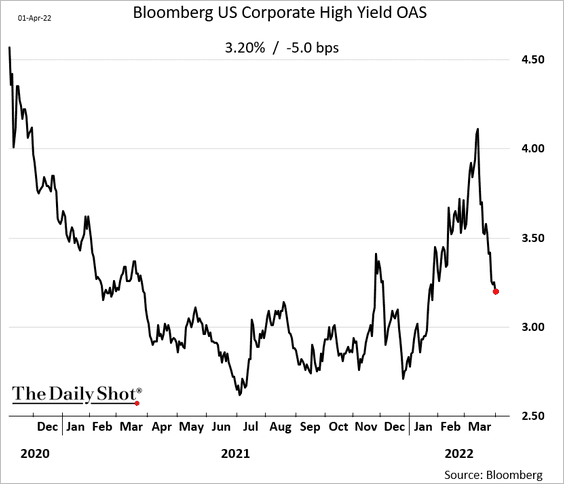
1. High-yield spreads are tightening.
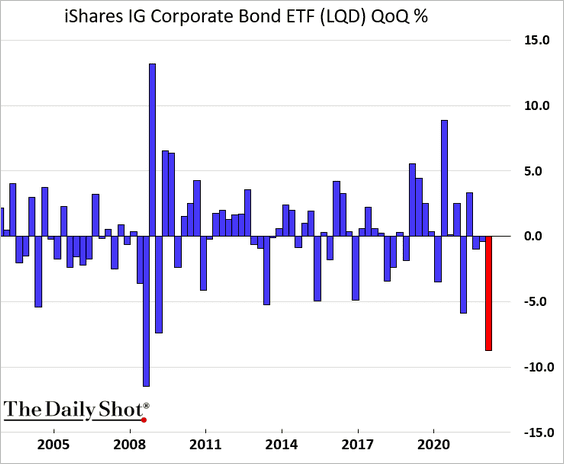
2. It was a tough quarter for investment-grade bonds.
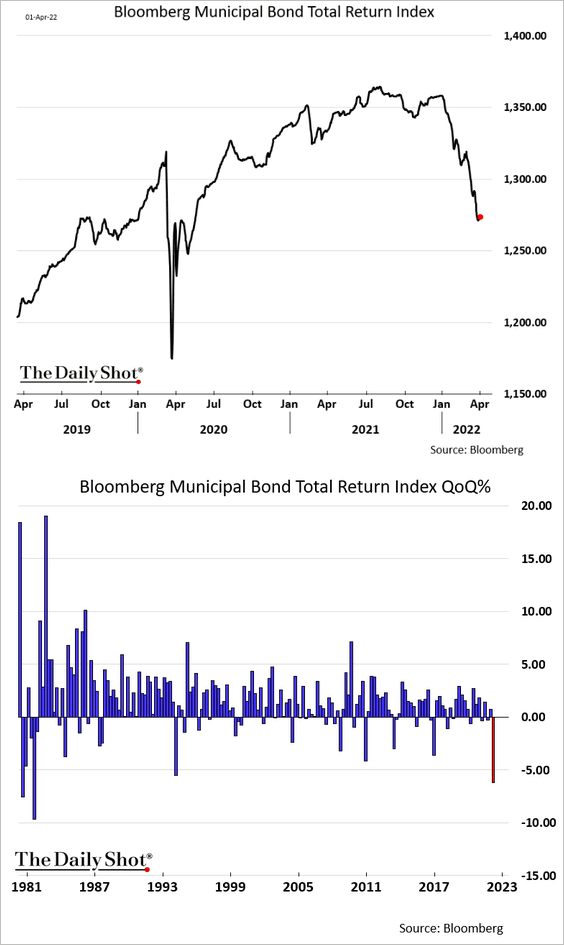
3. Muni bonds also had a lousy quarter (biggest loss since the early 1980s).
Back to Index
Global Developments
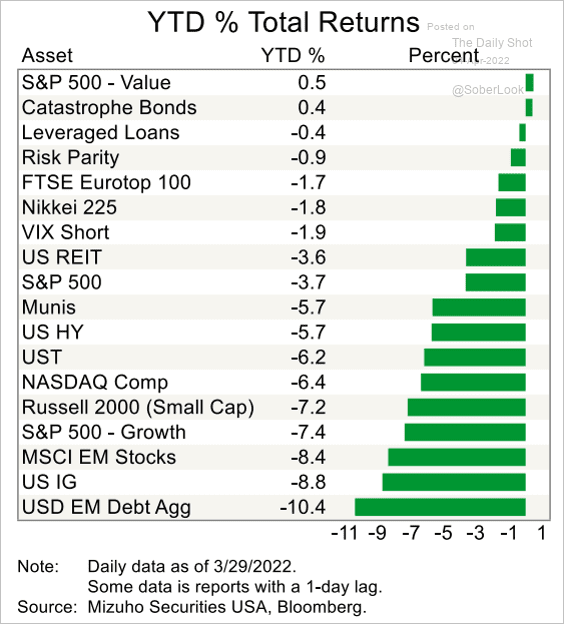
1. Here are the year-to-date returns across different asset classes.
 Source: Mizuho Securities USA
2. Household savings are expected to take a hit this year.
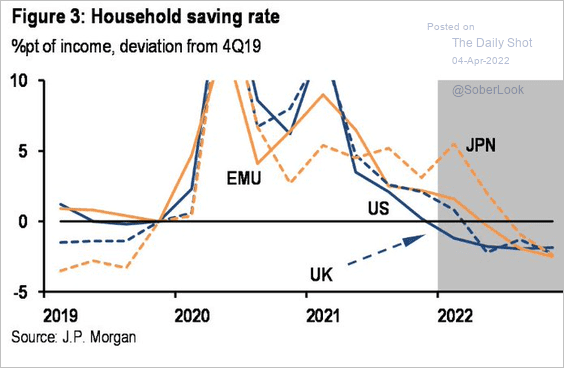 Source: JP Morgan Research
——————–
Food for Thought
1. US drought outlook:
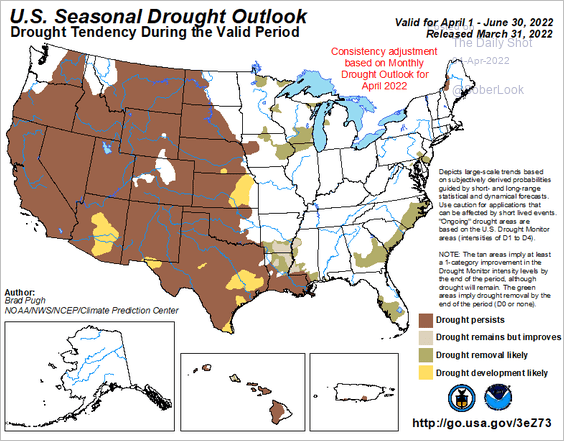 Source: NOAA
2. Unsafe drinking water:
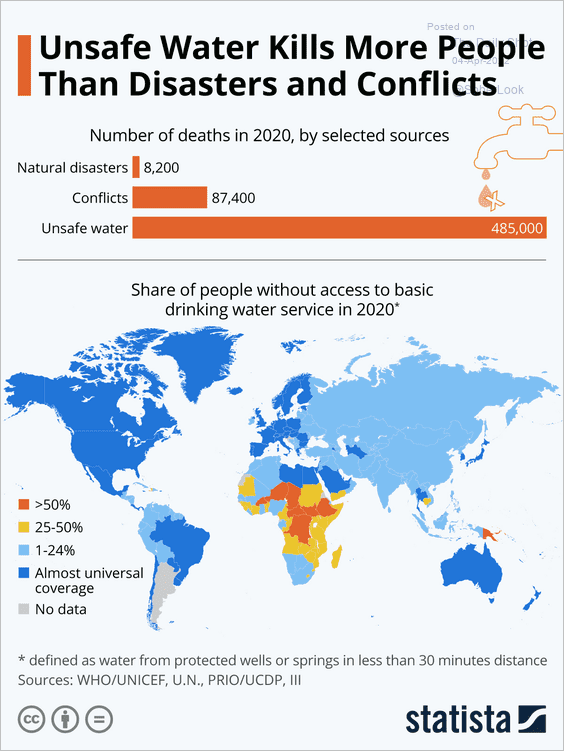 Source: Statista
3. GDP per capita in Russia and China:
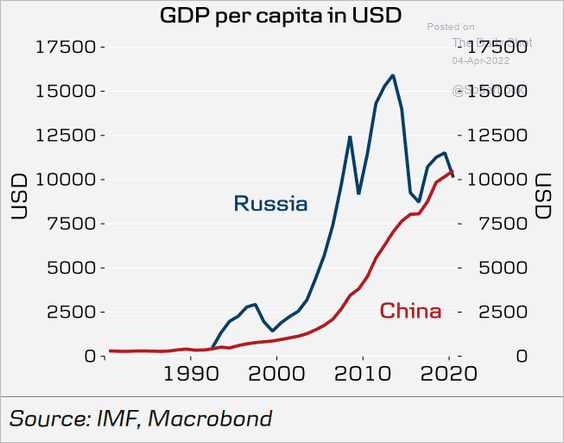 Source: Danske Bank
4. Ukrainian refugees:
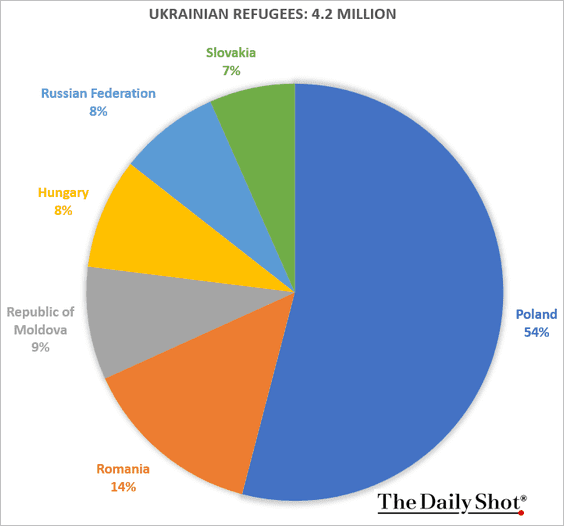 Source: UNHCR
5. Cost breakdown of automotive fuel:
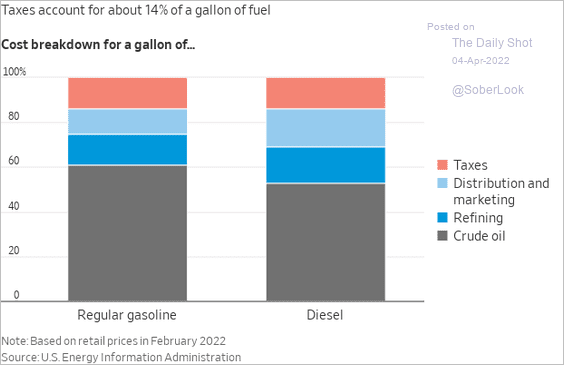 Source: @WSJ Read full article
6. Select consumer spending categories as a share of total consumption:
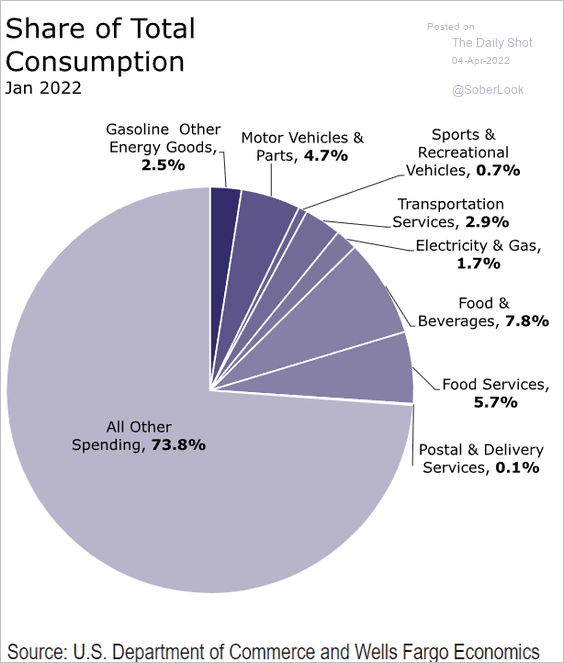 Source: Wells Fargo Securities
7. Berkshire Hathaway’s cash pile:
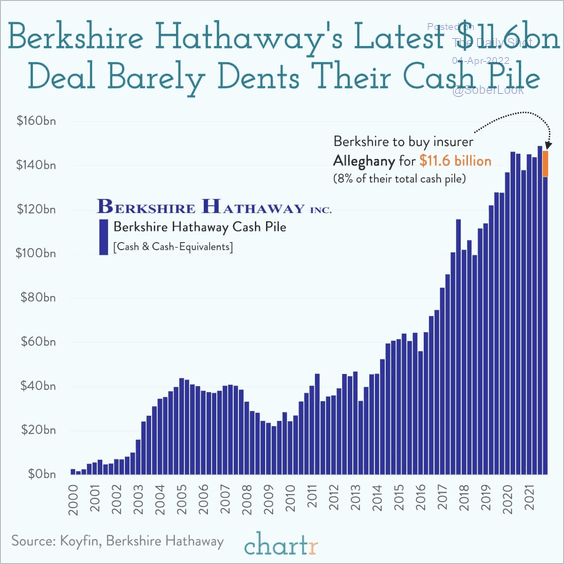 Source: @chartrdaily
8. The Oscars’ viewership over time:
 Source: @chartrdaily
——————–
Back to Index