
The Daily Shot: 11-Apr-22
• Rates
• Credit
• Equities
• Energy
• Commodities
• Cryptocurrency
• Emerging Markets
• China
• Asia – Pacific
• The Eurozone
• Canada
• The United States
• Global Developments
• Food for Thought
Rates
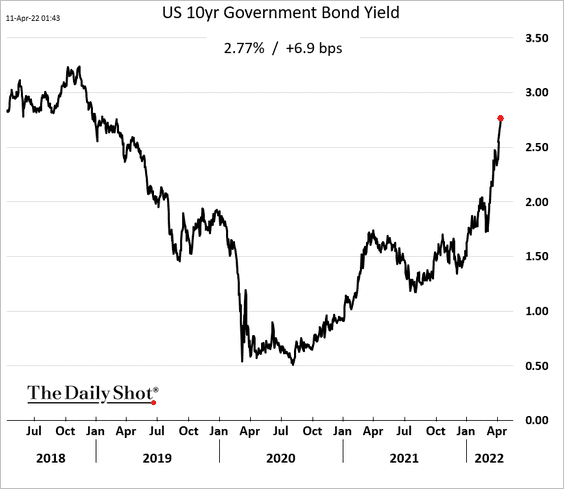
1. The Treasury market selloff resumed this morning, with the 10-year note yield rising above 2.75%.
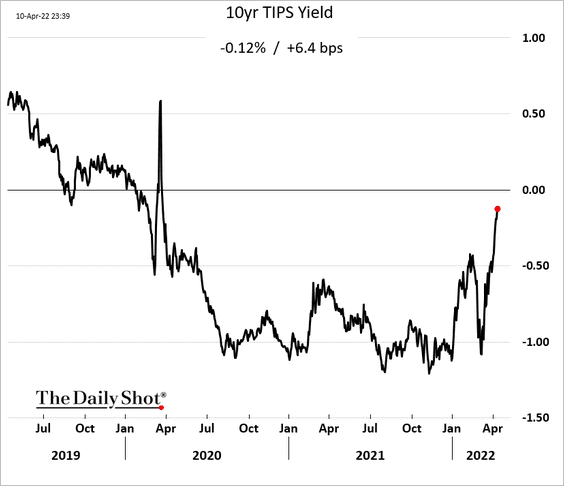
US real rates are surging as well, as the 10-year TIPS yield approaches zero. This trend is particularly troubling for growth stocks.
 Source: Bloomberg Read full article
——————–
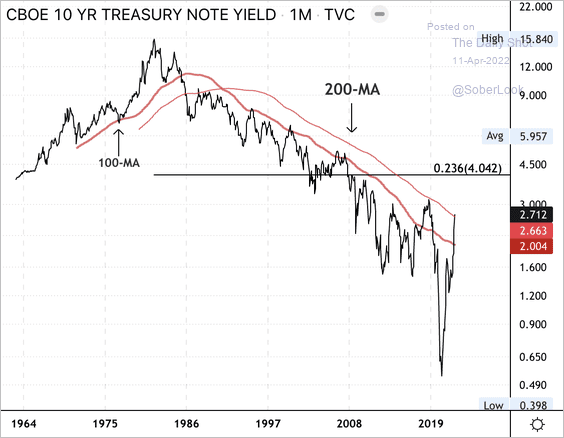
2. The 10-year Treasury yield is testing long-term resistance at its 200-month moving average. The previous attempt at a major trend reversal was in Oct. 2018, which failed to break resistance.
 Source: Dantes Outlook
The iShares 20+ Year Treasury Bond ETF (TLT) is approaching short-term support.
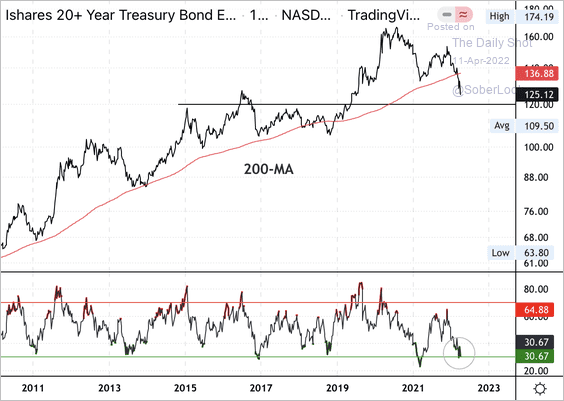 Source: Dantes Outlook
——————–
3. Treasury yields are now well above the long-run (“neutral”) yields (an indication of tightening monetary conditions).
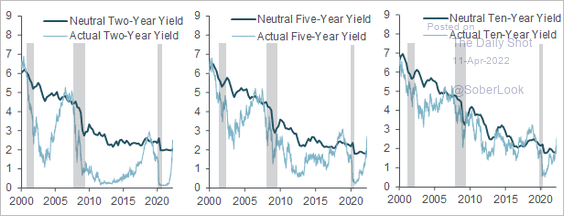 Source: @R_Perli
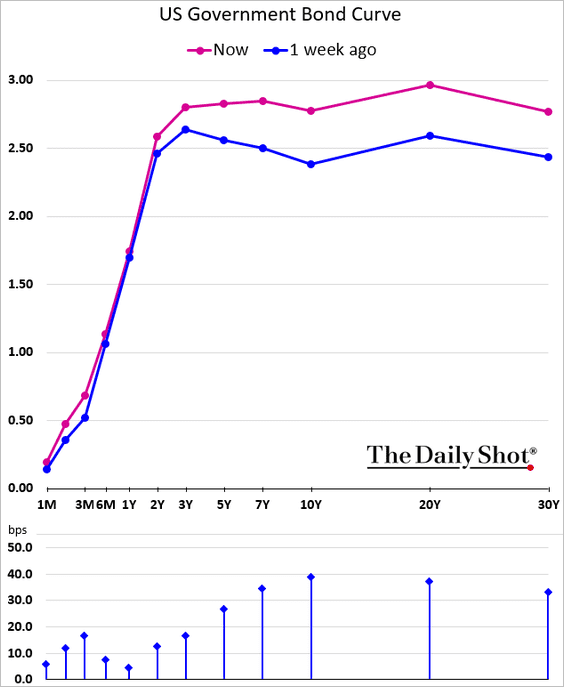
4. The long end of the Treasury curve (30yr – 10yr) has inverted for the first time since 2006.
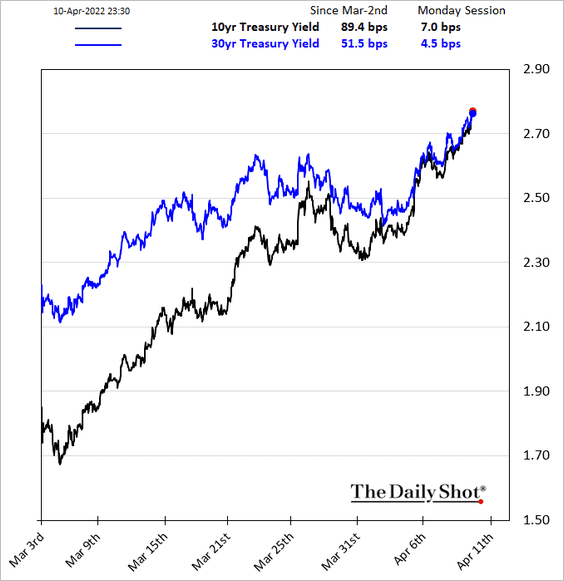
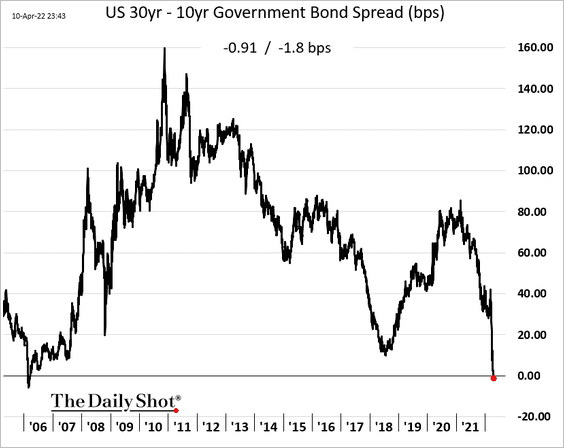
Here is the yield curve.
——————–
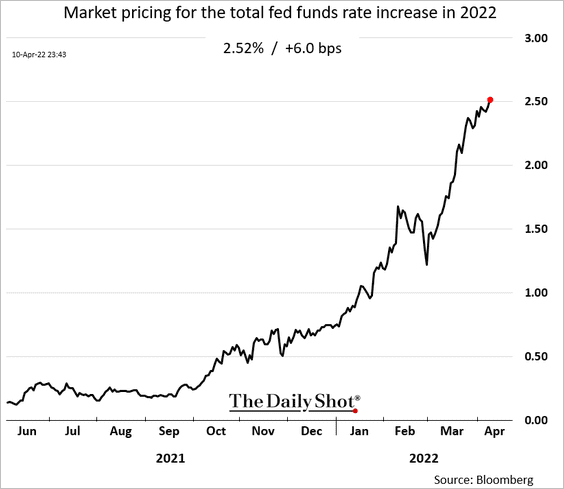
5. The market expectation for this year’s total Fed rate hikes is now above 2.5%.
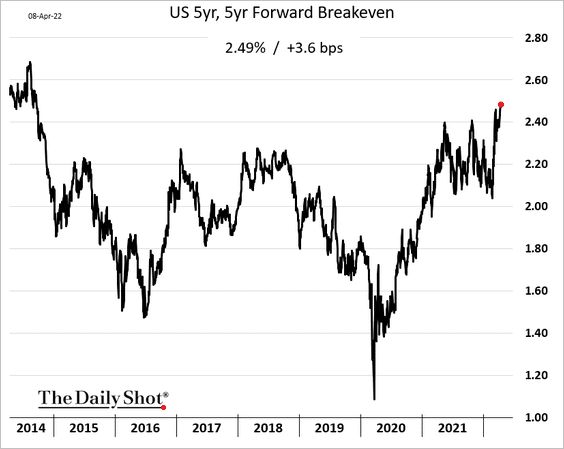
6. Longer-dated inflation expectations are hitting multi-year highs.
Back to Index
Credit
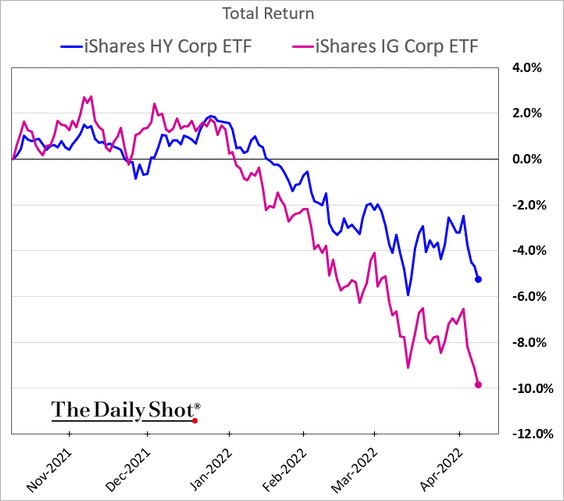
1. Investment-grade corporate debt continues to underperform as Treasuries slump.
2. Leveraged loans (which pay a floating rate coupon) are outperforming (2 charts).
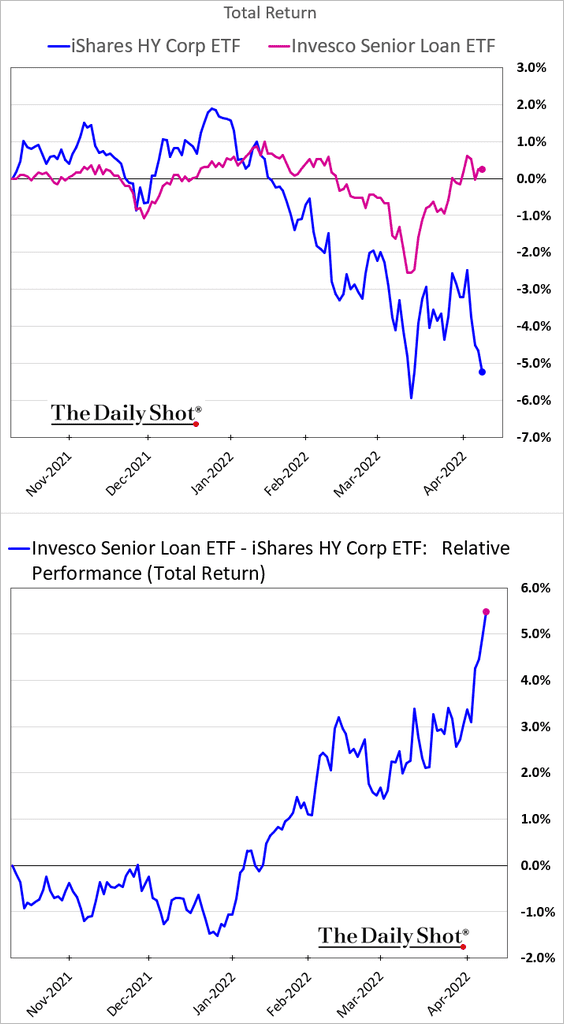
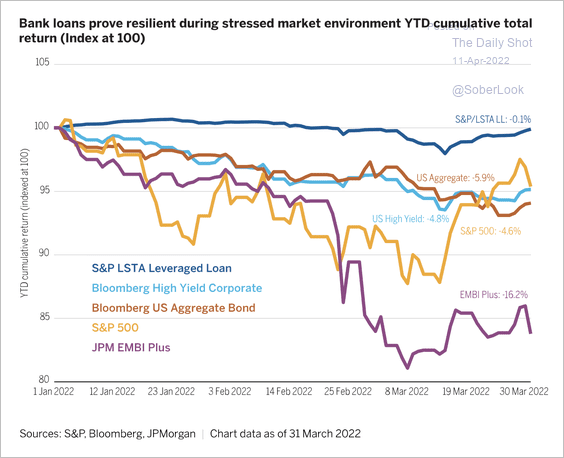 Source: Wellington Management Read full article
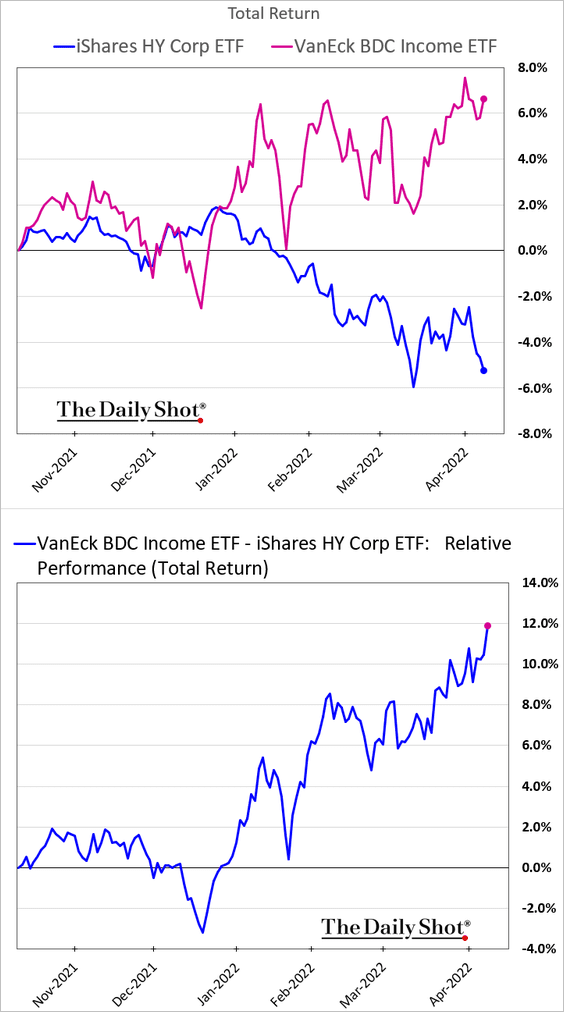
BDCs, which invest mostly in leveraged loans are also doing well.
Leveraged loan fund inflows have been strong.
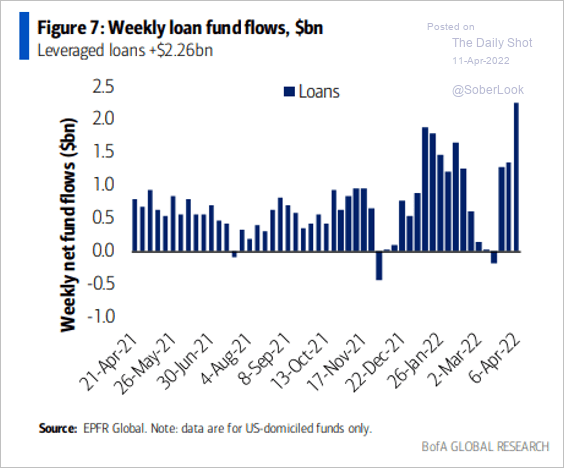 Source: BofA Global Research; @MikeZaccardi
——————–
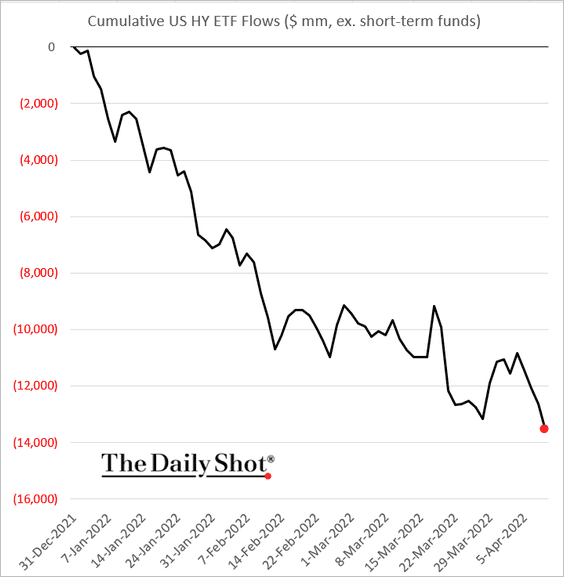
3. Corporate high-yield bond ETFs continue to see outflows.
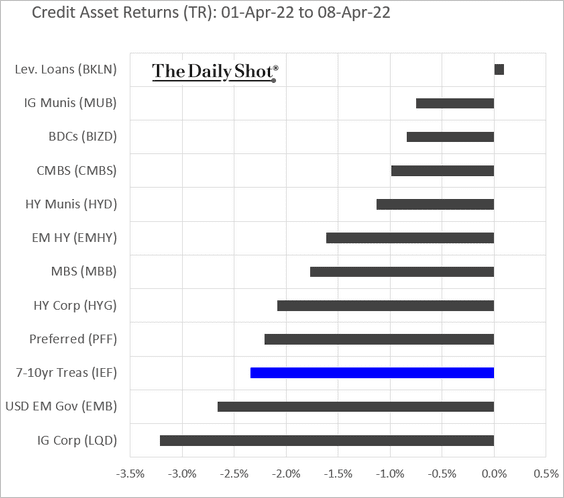
4. Here is last week’s performance across credit asset classes.
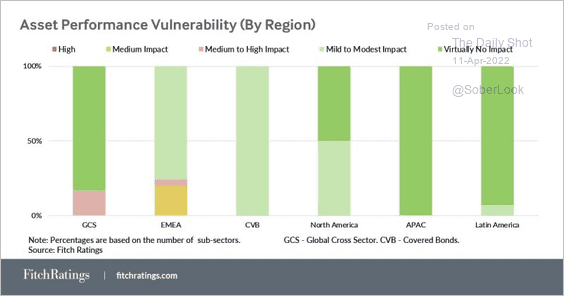
5. The majority of structured finance and covered bond ratings and asset performance would face minimal impact under a more severe stagflation scenario, according to Fitch.
 Source: Fitch Ratings
Back to Index
Equities
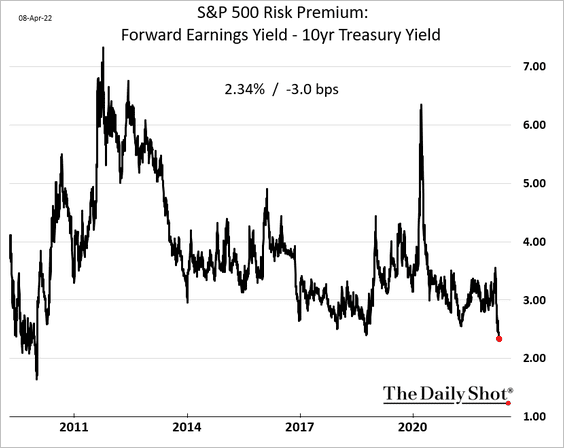
1. US equity risk premium continues to tighten.
2. Did US indices bottom on March 8th?
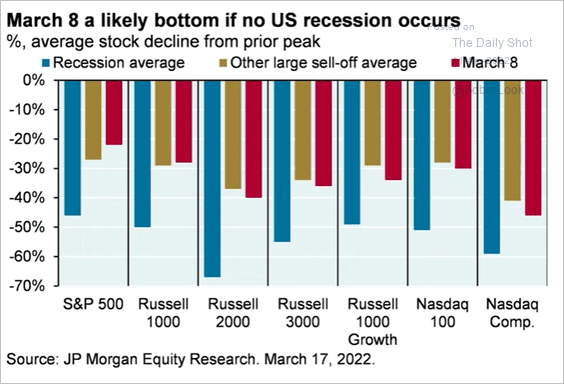 Source: JP Morgan Research; @Callum_Thomas, @SethCL
This chart shows bear market rallies during the 2007-2009 timeframe.
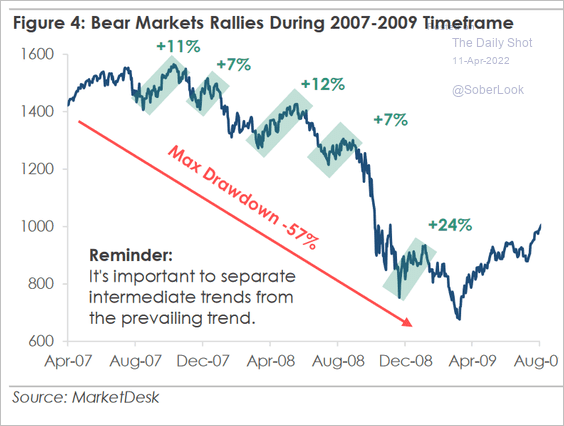 Source: MarketDesk Research
——————–
3. A majority of technical indicators such as market breadth do not point to a healthy market environment.
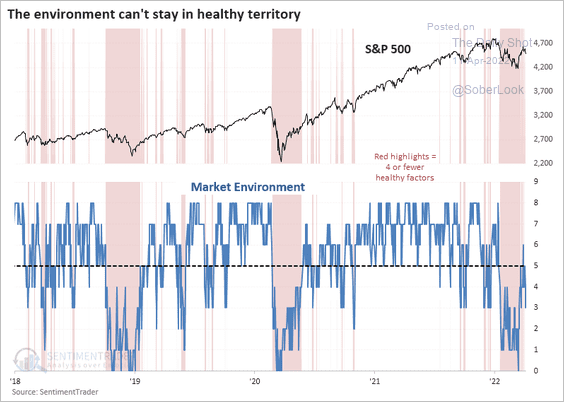 Source: SentimenTrader
Similar to 2018, fewer stocks have participated in the broader uptrend over the past year.
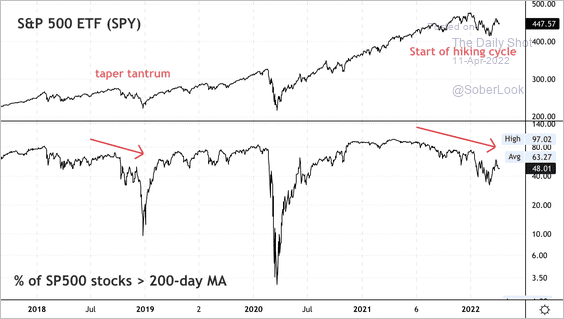 Source: Dantes Outlook
——————–
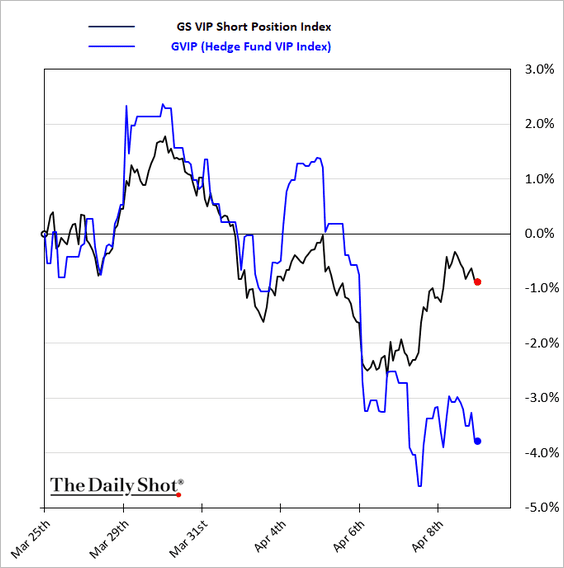
4. Hedge funds’ favorite short picks outperformed popular long bets last week.
5. Next, we have some fund flow data.
• Retail flows jumped last week.
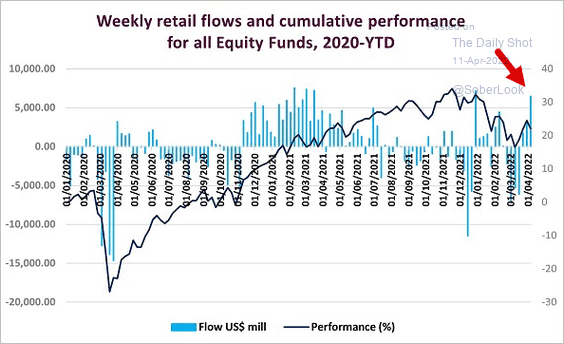 Source: EPFR Global Navigator
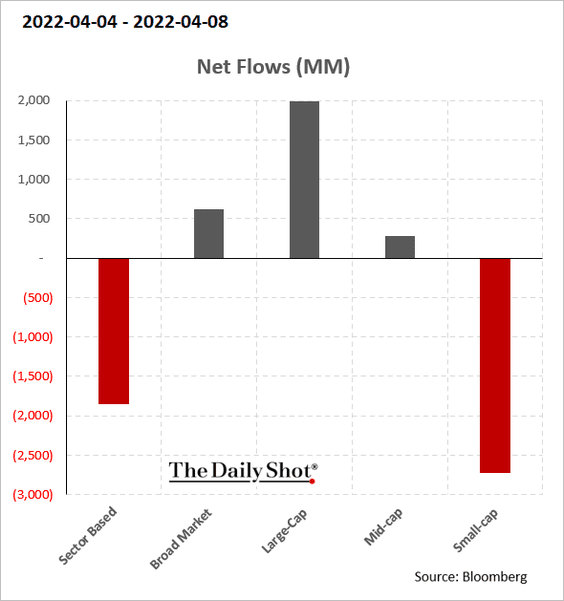
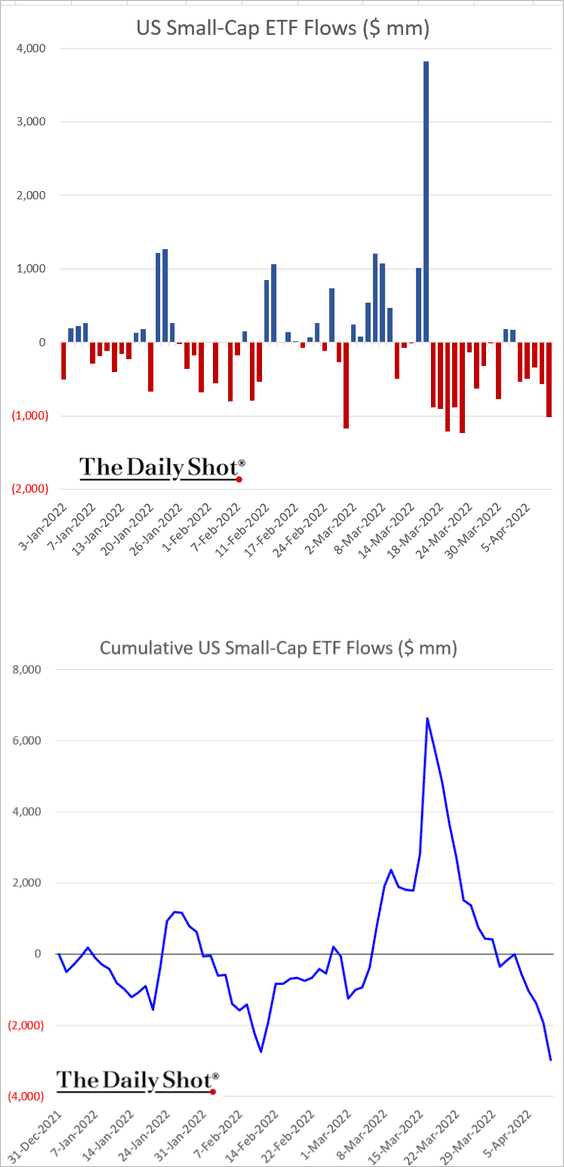
• Small caps continue to see outflows (2 charts).
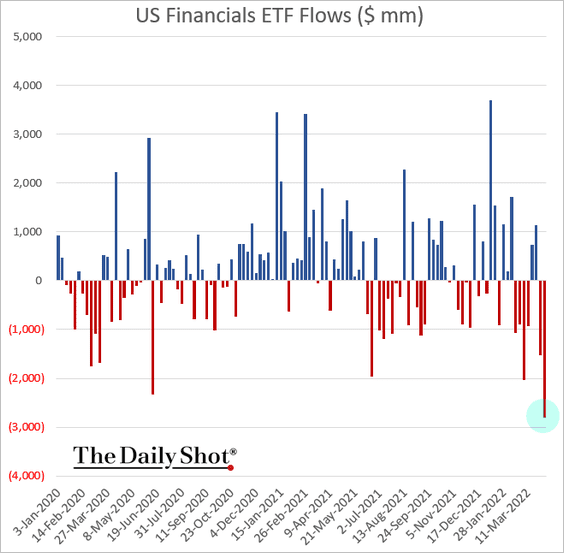
• Investors pulled a substantial amount of capital out of financials ETFs last week (2 charts).
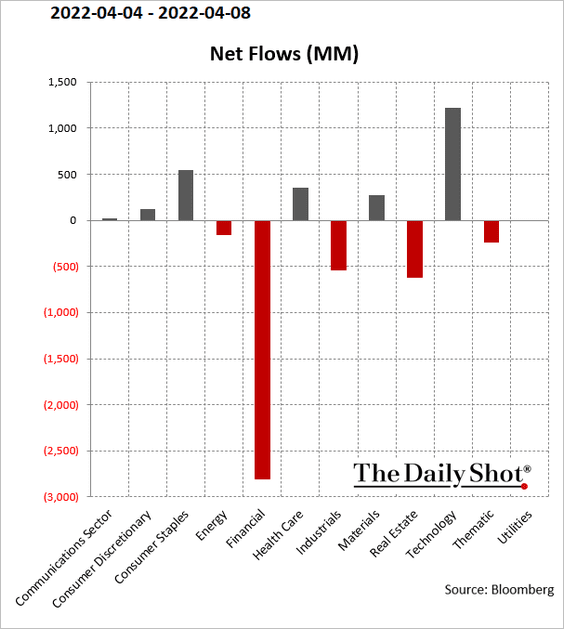
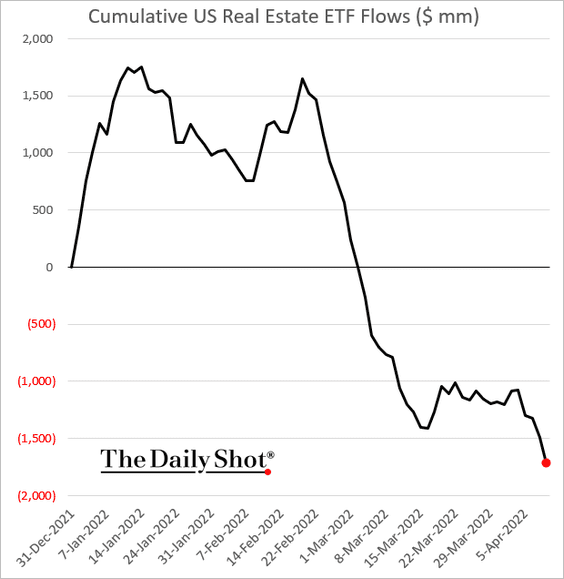
• REIT ETFs continue to see outflows as rates climb.
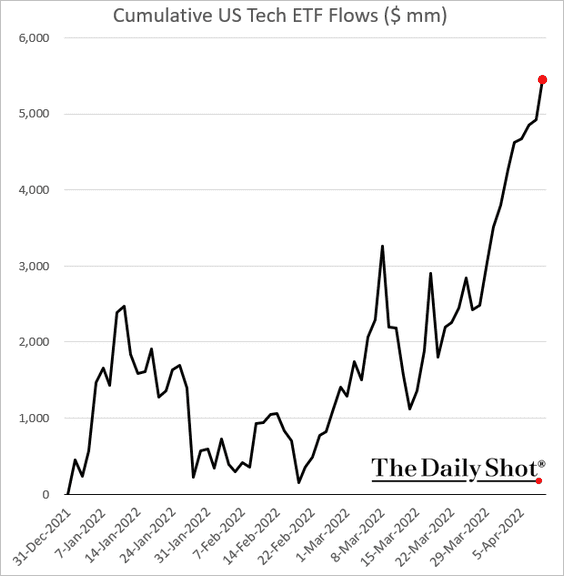
• Tech-sector ETFs keep getting inflows.
• The largest transportation-focused ETF was slammed with outflows last week, …
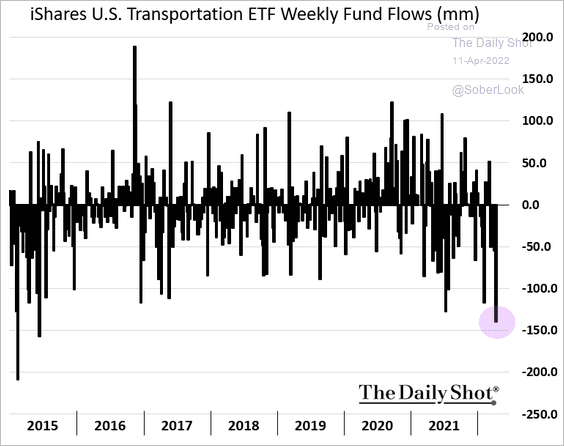
… as underperformance worsens.
![]()
Downside momentum in transport stocks is the most severe since the March 2020 crash.
![]() Source: SentimenTrader
Source: SentimenTrader
——————–
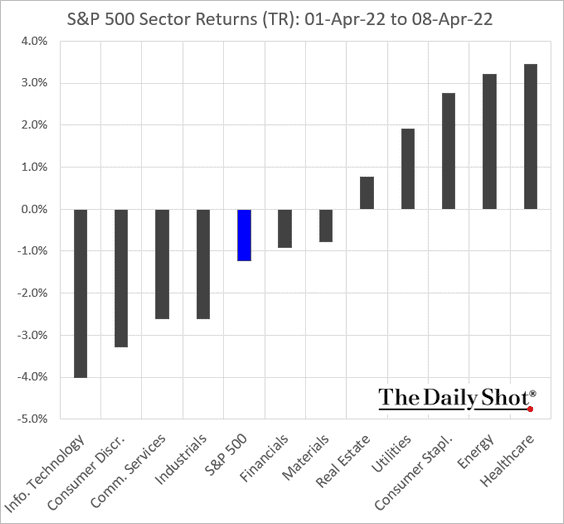
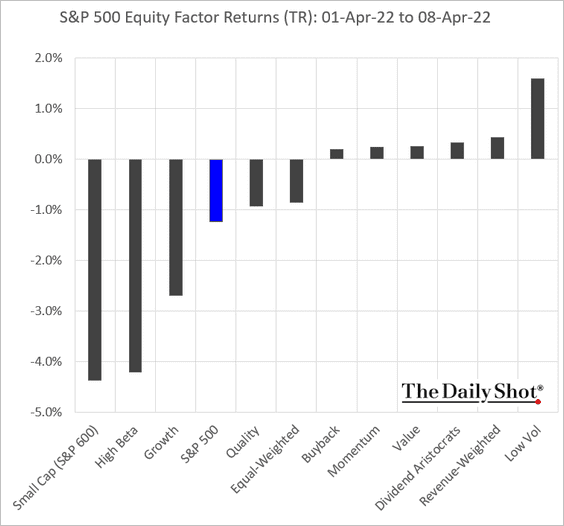
6. Finally, let’s take a look at last week’s performance.
• Sectors:
• Equity factors:
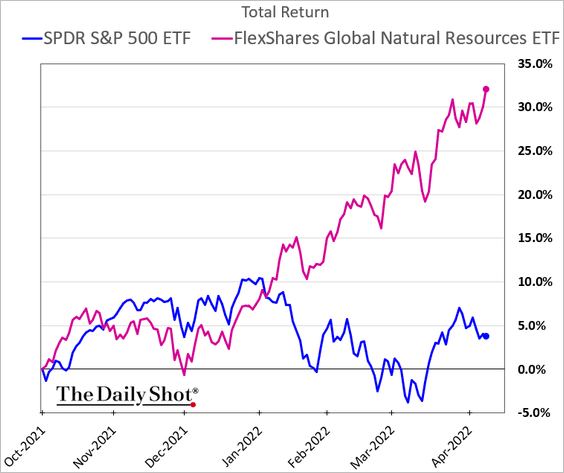
• Thematic ETFs:
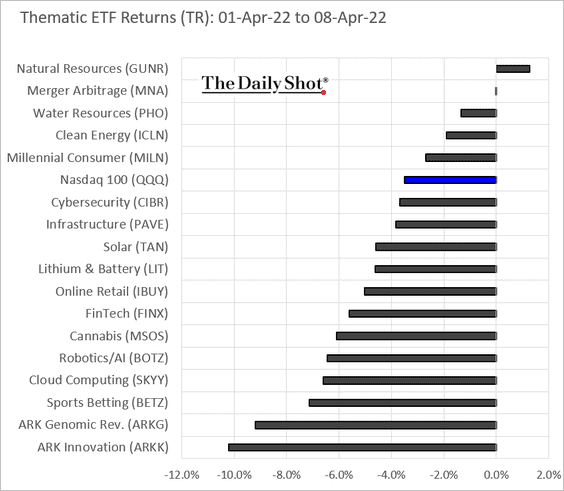
By the way, here is the best performer in the chart above – the natural resources ETF (GUNR).
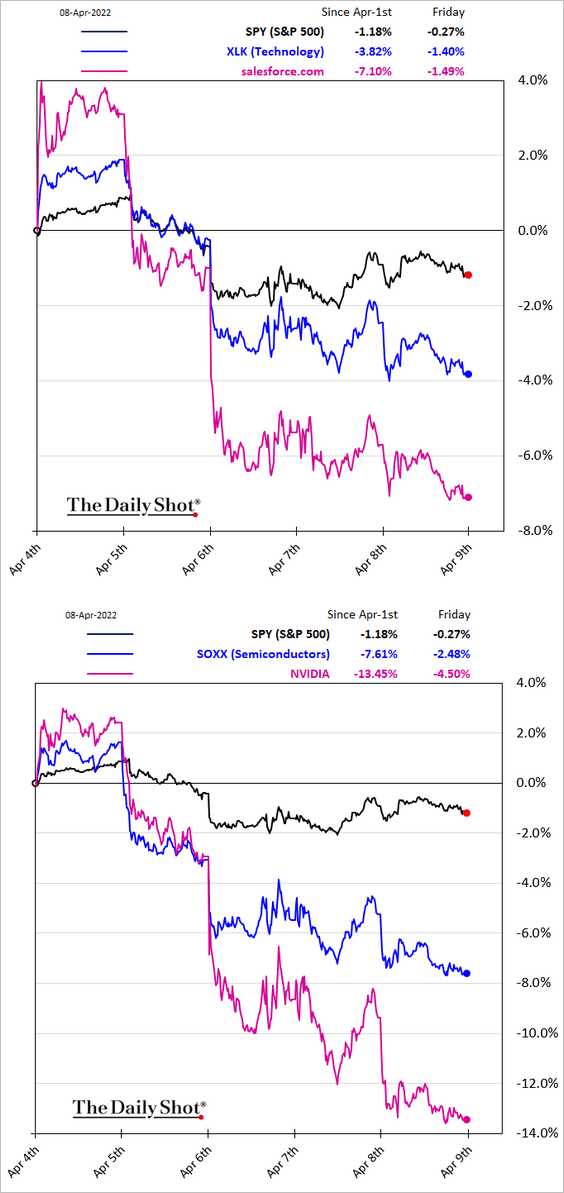
• The largest US-based tech firms:
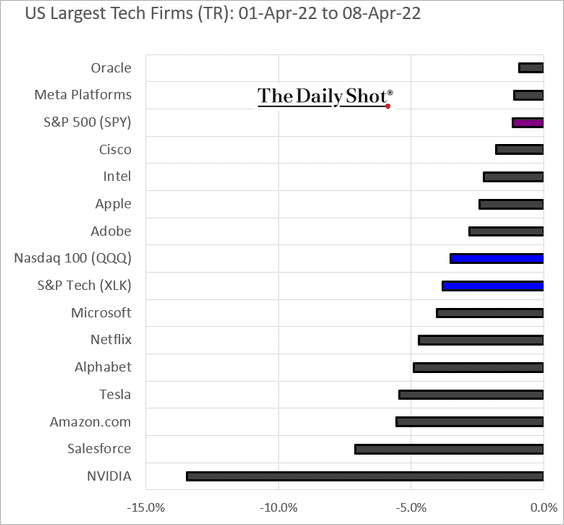
Here is last week’s performance of tech and semiconductor shares.
 Source: Barron’s Read full article
Back to Index
Energy
1. Russian gas flows going through Ukraine slowed last week.
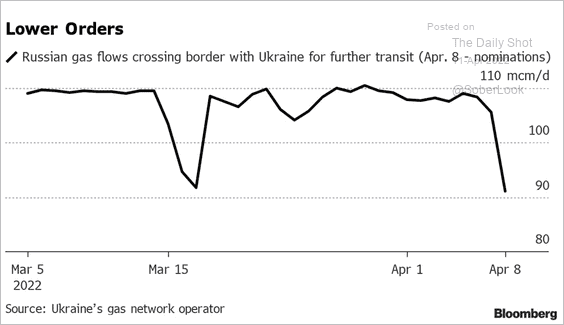 Source: BloombergQuint Read full article
2. Crude oil futures open interest deteriorated this year.
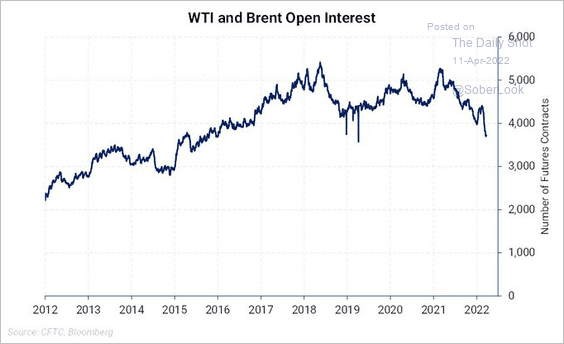 Source: @nhillman_energy
3. Here are the largest oil firms’ writedowns of Russia-based assets.
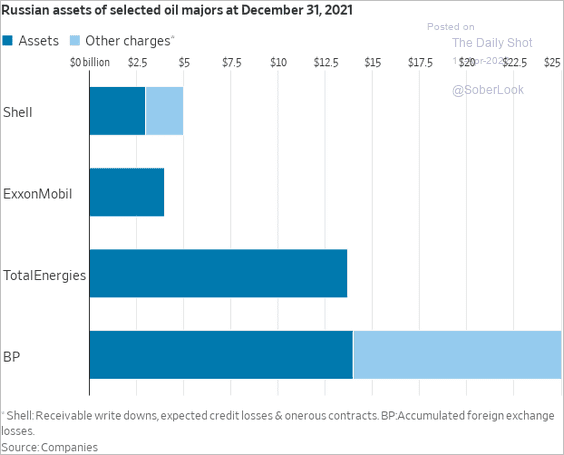 Source: @WSJ Read full article
4. Distillates outperformed other energy commodities this year.
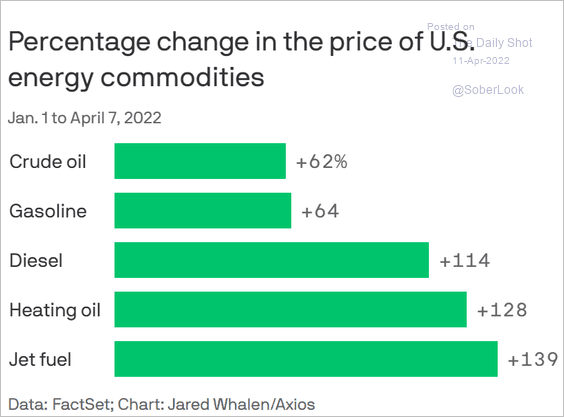 Source: @axios Read full article
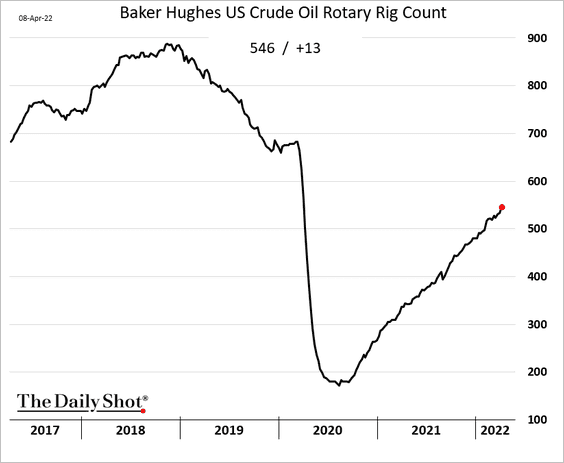
5. US rigs increased by 13 last week as the recovery continues.
Back to Index
Commodities
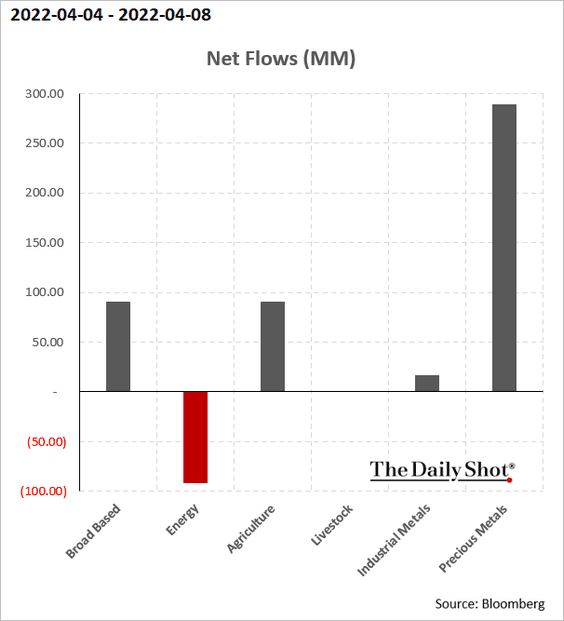
1. Precious metals keep seeing fund inflows.
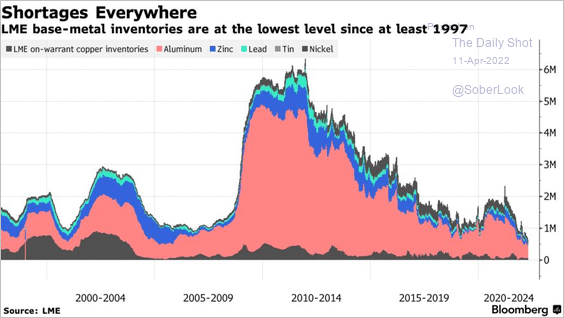
2. LME inventories of industrial metals have been declining.
 Source: Bloomberg Read full article
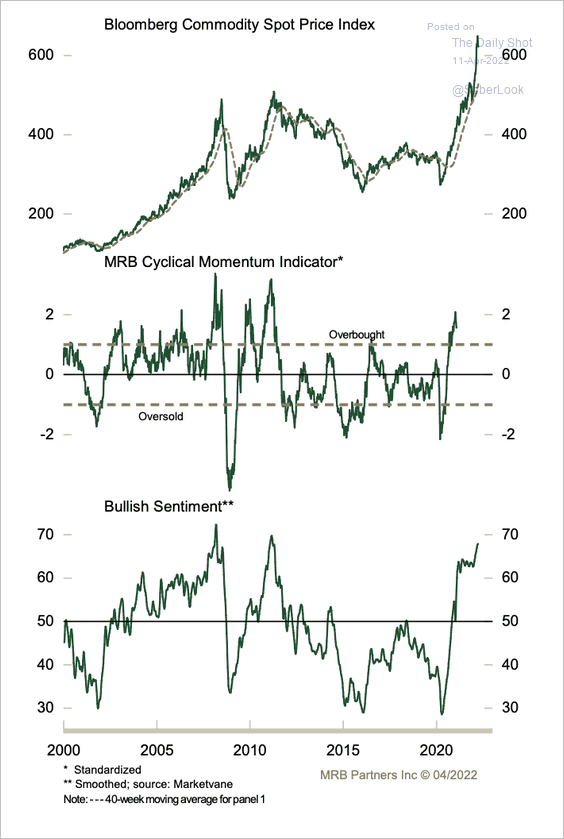
3. Technical indicators suggest that the Bloomberg Commodity Index is extremely overbought.
 Source: MRB Partners
4. Sugar futures surged last week, …
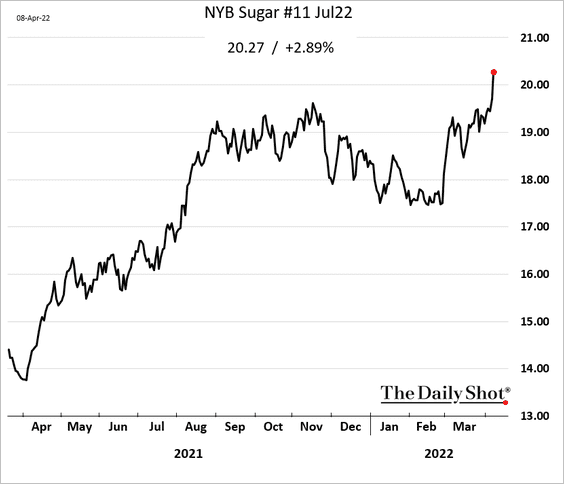
… as backwardation increased.
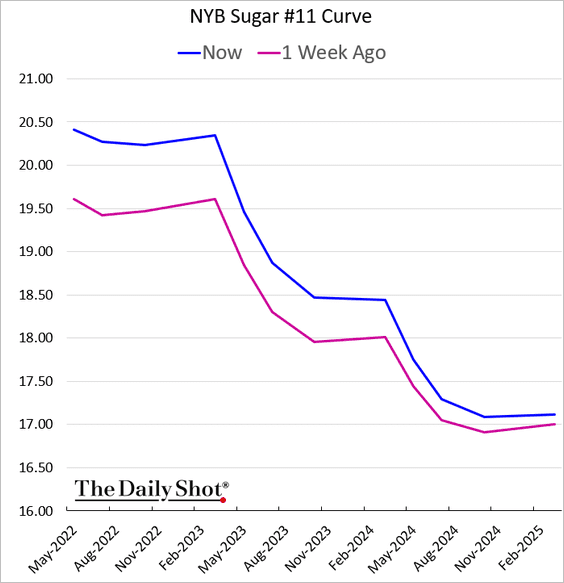
——————–
5. Farmland prices continue to rally.
 h/t Walter
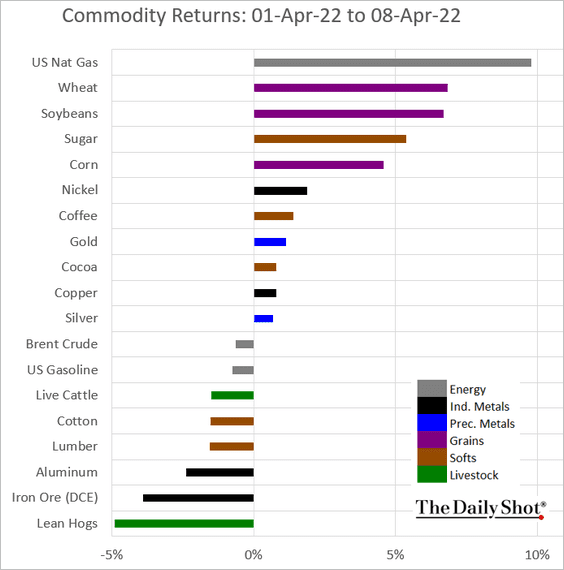
6. Finally, we have last week’s returns across key commodity markets.
Back to Index
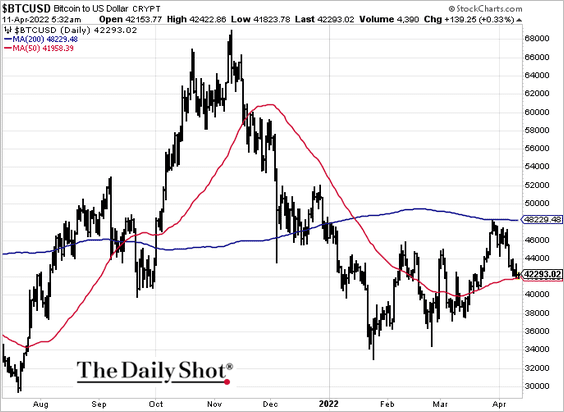
Cryptocurrency
1. Cryptos are weaker as rates surge.
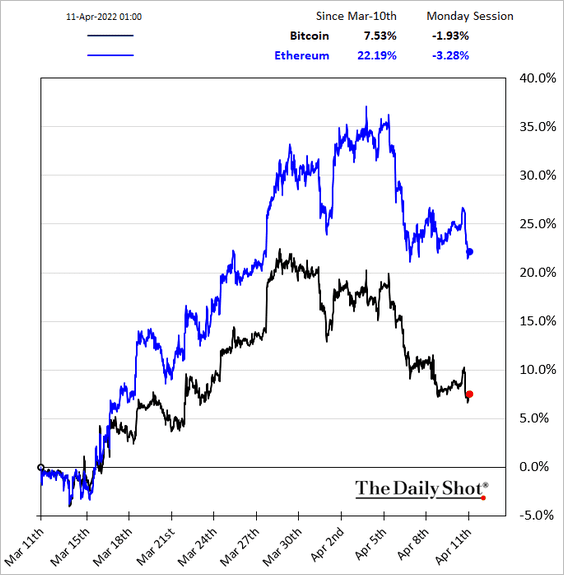
Bitcoin hit support at the 50-day moving average.
——————–
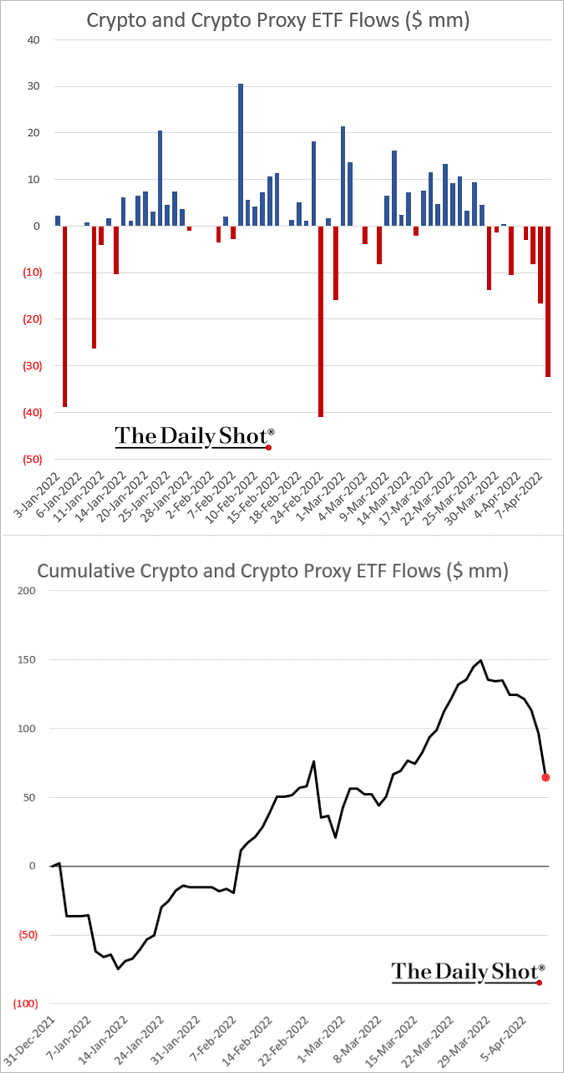
2. Crypto ETFs saw some outflows last week.
Back to Index
Emerging Markets
1. Let’s begin with Russia.
• S&P Global downgraded Russia to “selective default” as Moscow paid dollar-denominated debt coupon in rubles. By the way, the last time Russia defaulted on its foreign debt was in 1917.
S&P Global Ratings:
• It is our understanding that the Russian government made coupon and principal payments on its U.S. dollar-denominated Eurobonds in rubles when those payments were due on April 4, 2022.
• We currently don’t expect that investors will be able to convert those ruble payments into dollars equivalent to the originally due amounts, or that the government will convert those payments within a 30-day grace period, in part because we think sanctions on Russia are likely to be further increased in the coming weeks, hampering Russia’s willingness and technical abilities to honor the terms and conditions of its obligations to foreign debtholders.
• While it is also our understanding that funds transferred by the Russian government for debt service payments on its local currency bonds (OFZ) to Russian domestic accounts might not be available to some or all nonresident bondholders, definitive information on the payment process is currently not available to us.
• Therefore, we lowered our unsolicited foreign currency issuer credit ratings on Russia to ‘SD/SD’ (selective default) from ‘CC/C’. Our unsolicited local currency ‘CC/C’ issuer credit ratings on Russia remained on CreditWatch with negative implications.
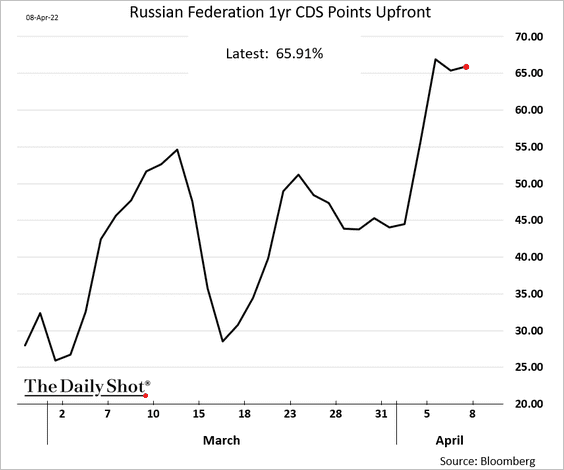
• CDS upfront points are holding above 65% of par.
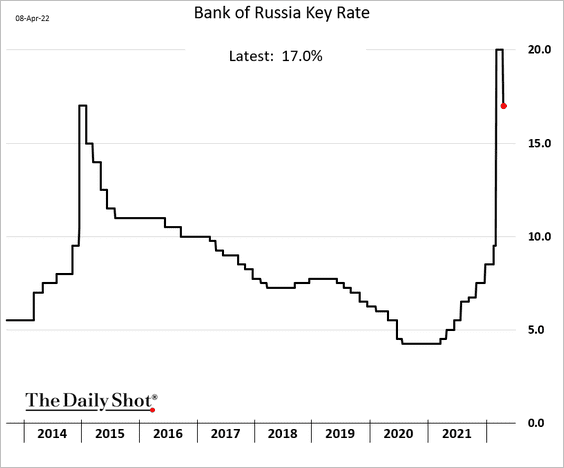
• The central bank unexpectedly cut rates as the ruble rebounded.
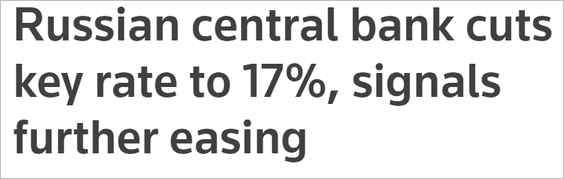 Source: Reuters Read full article
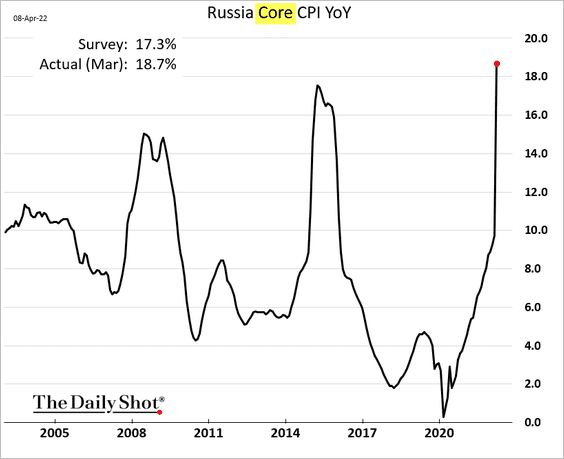
• The core CPI is up almost 19% year-over-year.
——————–
2. The RBI spent quite a bit of its FX reserves to defend the rupee in March.
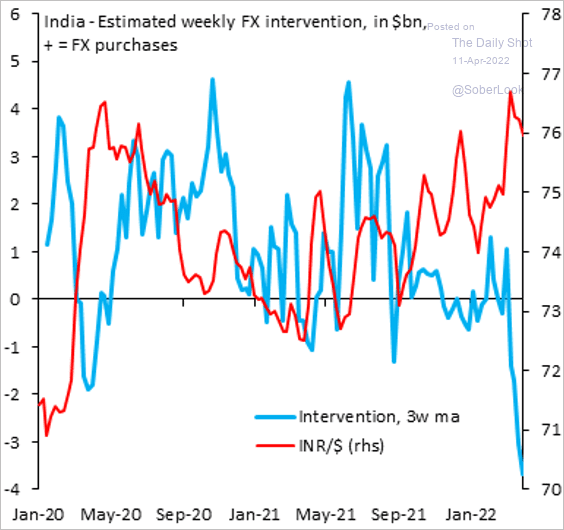 Source: @SergiLanauIIF
Markets are pricing 69 basis points of RBI rate hikes over the next 3 months.
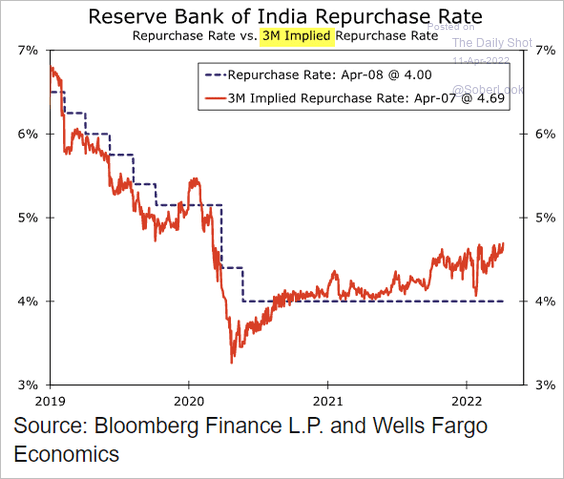 Source: Wells Fargo Securities
——————–
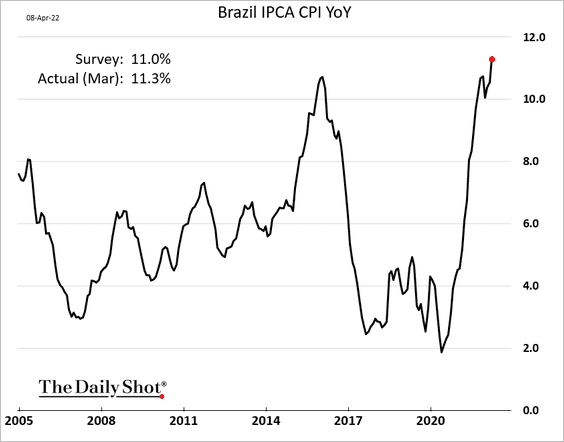
3. Brazil’s CPI is above 11%.
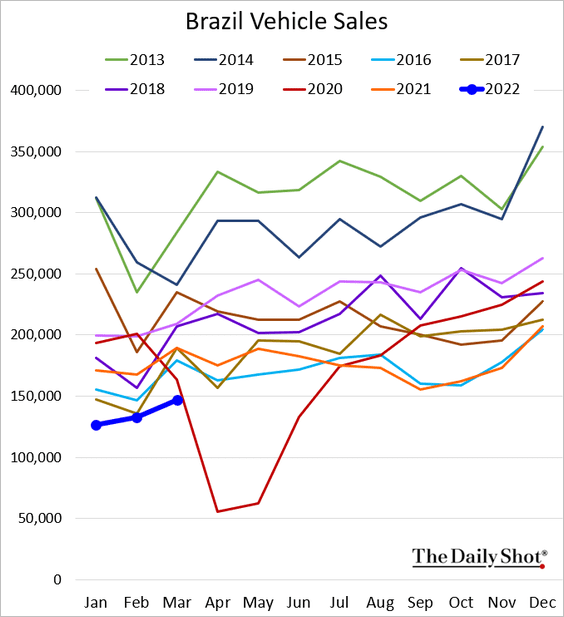
Vehicle sales remain soft.
——————–
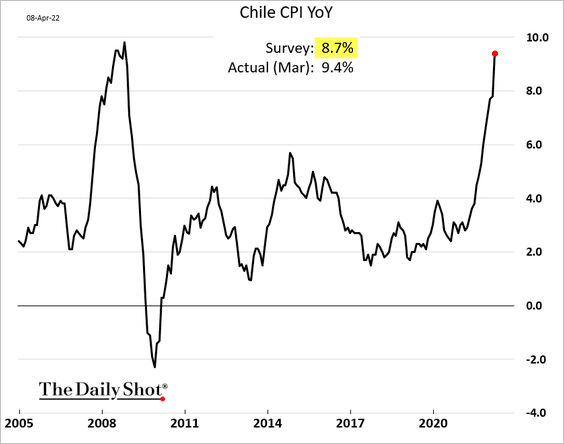
4. Chile’s CPI report was a shocker – well above forecasts.
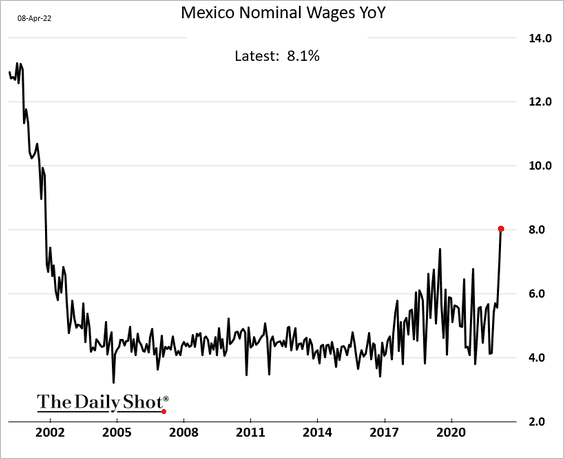
5. Mexican nominal wage growth picked up momentum.
6. Hard-currency bond funds continue to see capital inflows.
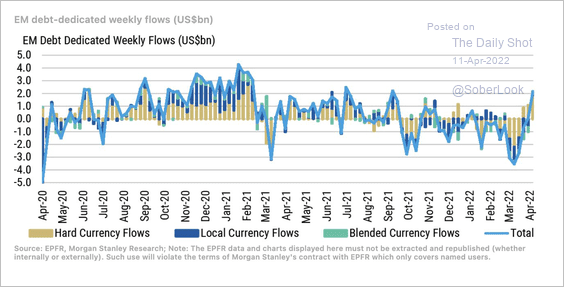 Source: @acemaxx, @MorganStanley
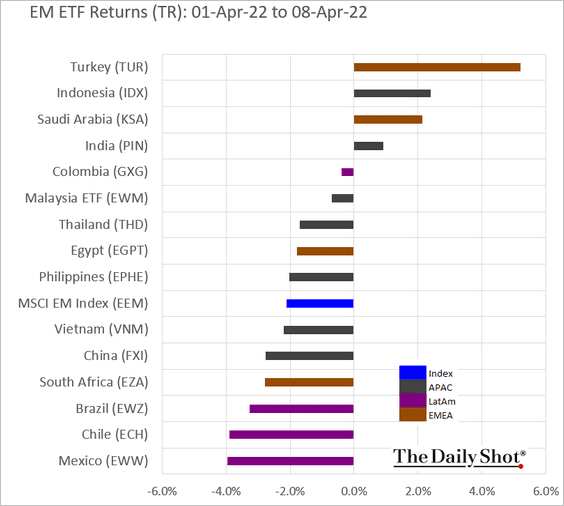
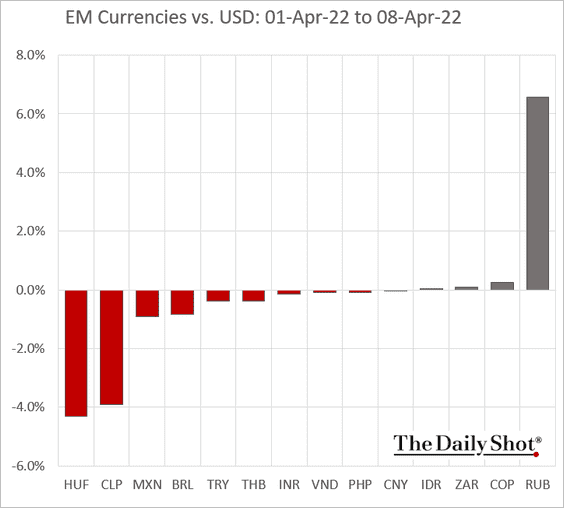
7. Next, we have some performance data from last week.
• Equity ETFs:
• EM currencies:
Back to Index
China
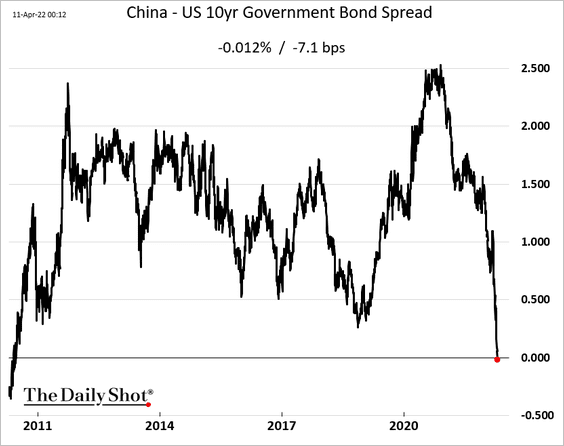
1. The spread between China’s and US 10-year bond yields is now negative.
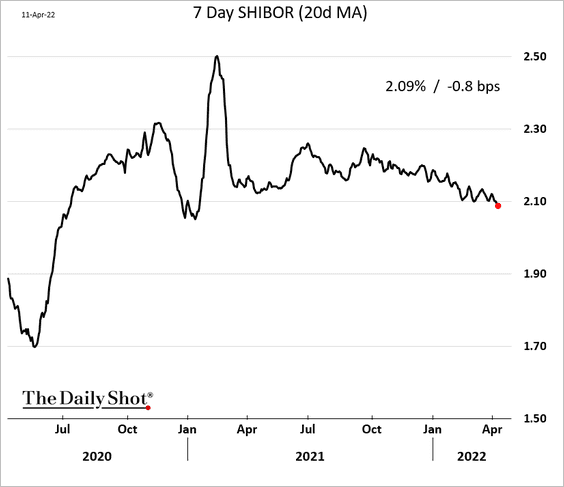
2. China’s short-term rates have been drifting lower.
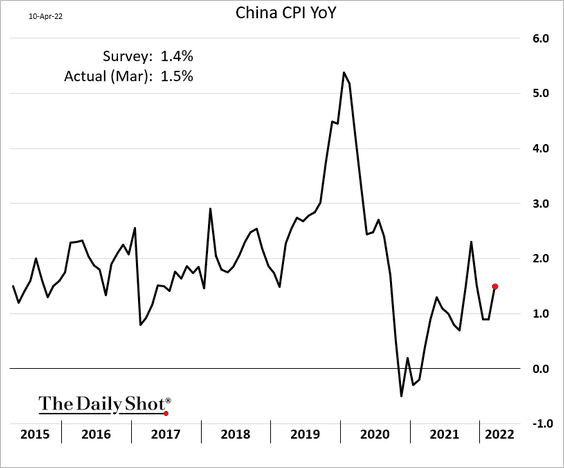
3. Last month’s CPI report was a bit firmer than expected.
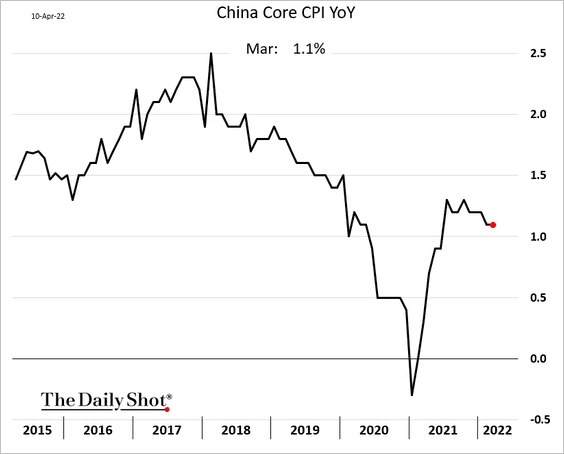
The core CPI held steady.
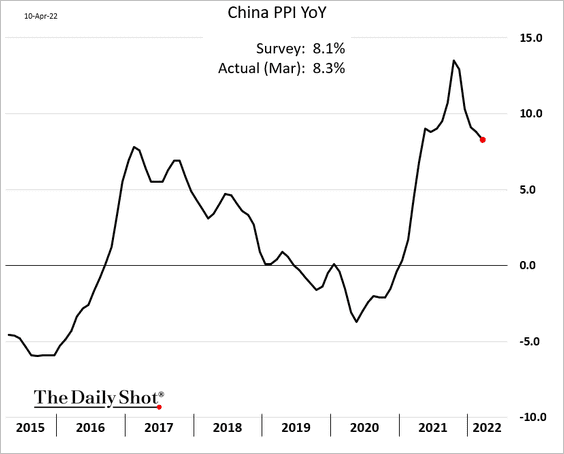
The PPI, which is moderating, also topped forecasts.
——————–
4. COVID cases continue to surge.
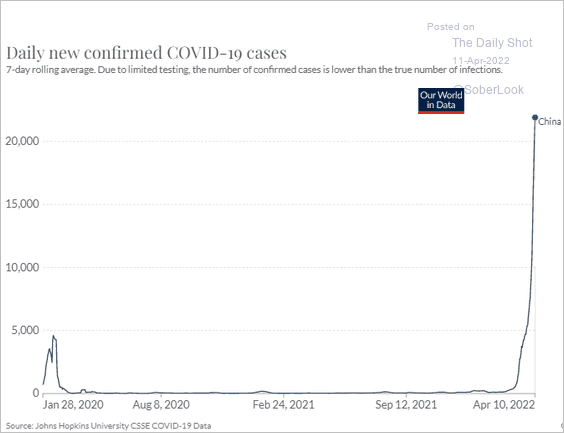 Source: Our World in Data
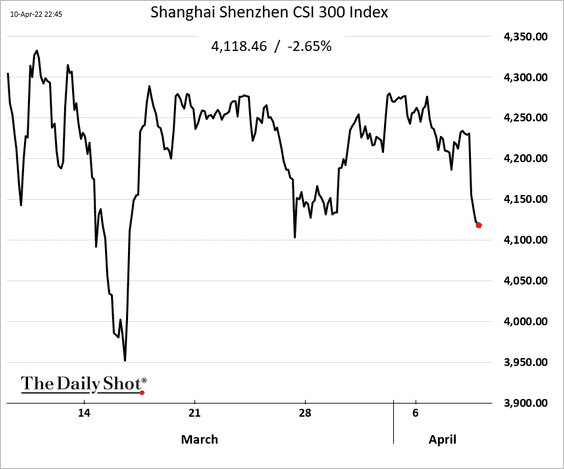
5. Stocks sold off today.
6. Service-sector PMI reports point to weakness in retail sales.
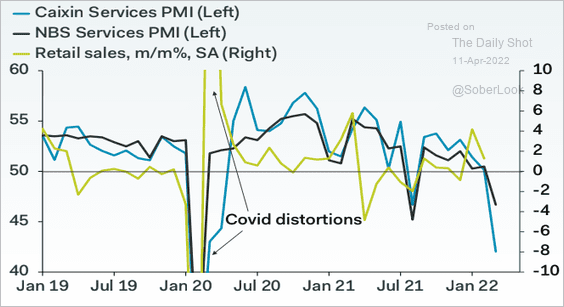 Source: Pantheon Macroeconomics
7. Lowy Institute has significantly downgraded its growth forecast for China.
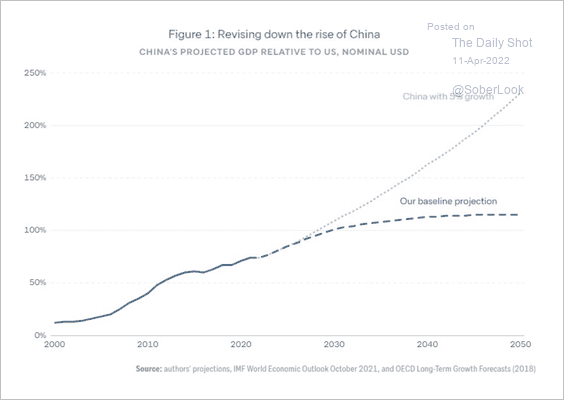 Source: Lowy Institute
Back to Index
Asia – Pacific
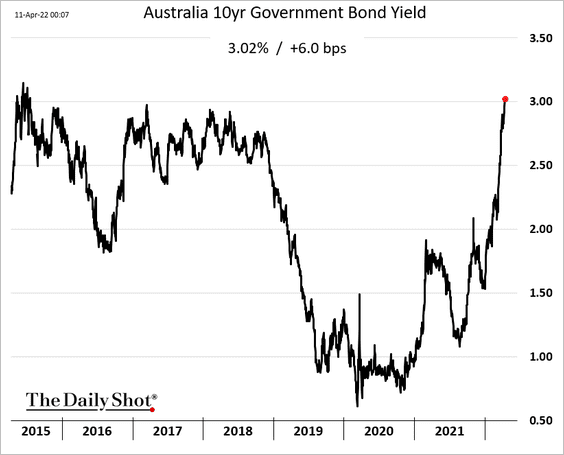
1. Australia’s 10-year bond yield hit 3% for the first time since 2015.
Separately, Australia’s job vacancies are extremely high as a share of the total labor force across states and territories. Will this increase pressure on the RBA to aggressively raise rates?
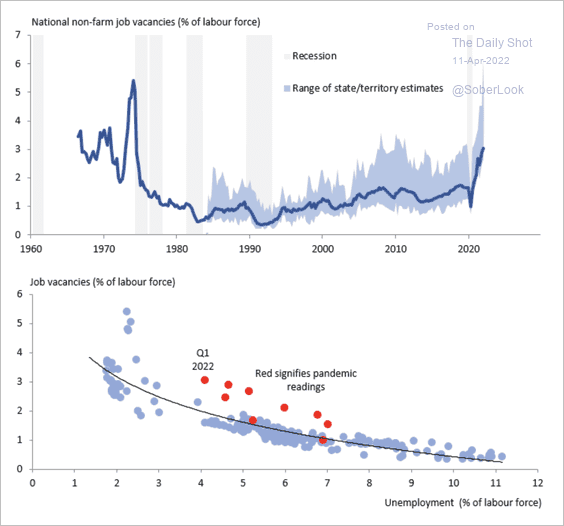 Source: Coolabah Capital Read full article
——————–
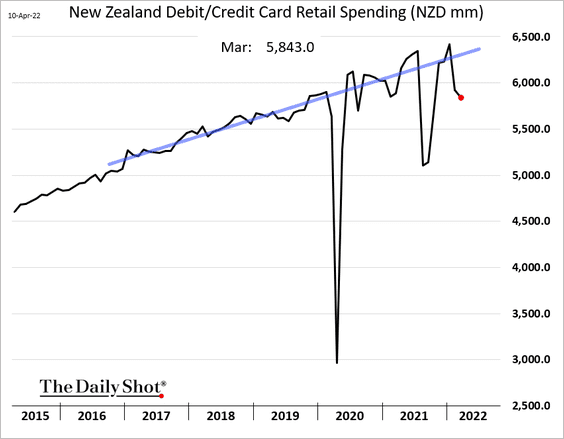
2. New Zealand’s card spending weakened further last month as sentiment slumps.
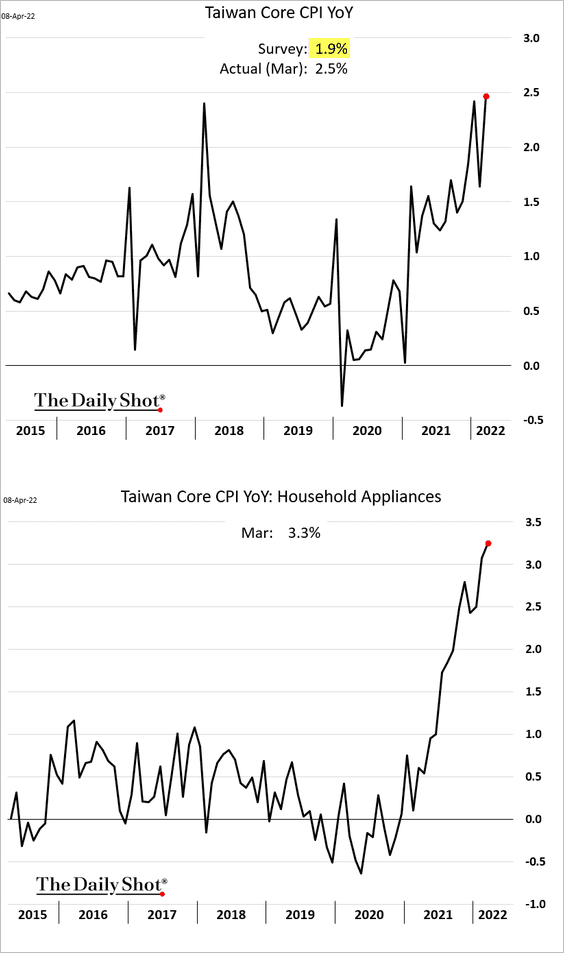
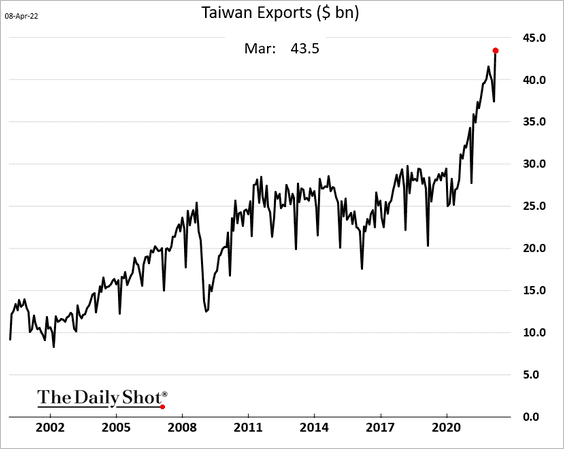
3. Taiwan’s core CPI surprised to the upside.
Exports hit a record high.
——————–
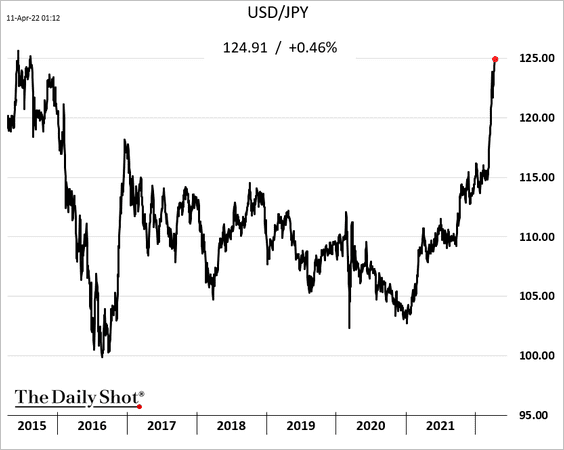
4. Dollar-yen is nearing 125.
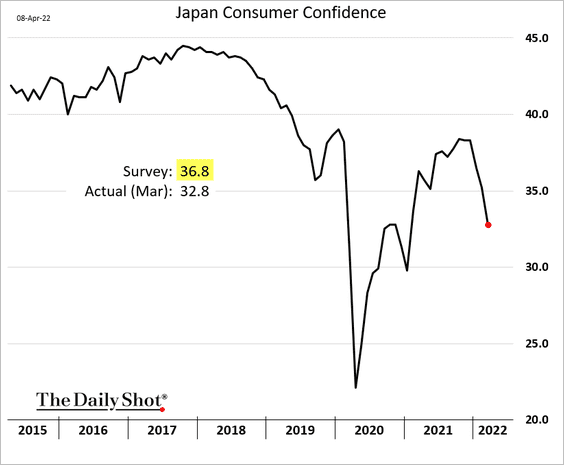
5. Japan’s consumer confidence deteriorated last month amid rising consumer prices.
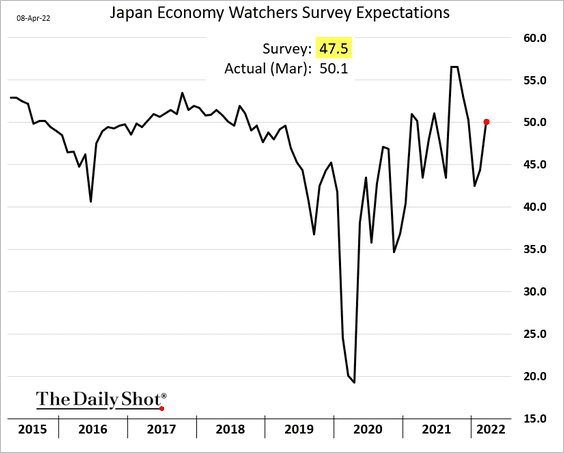
But the Economy Watchers Expectations index showed improvement.
Back to Index
The Eurozone
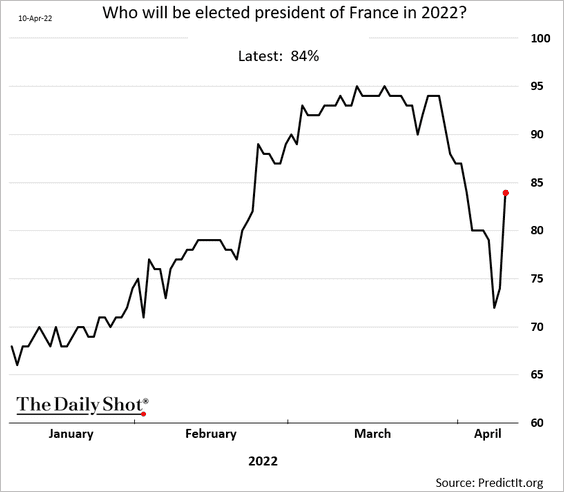
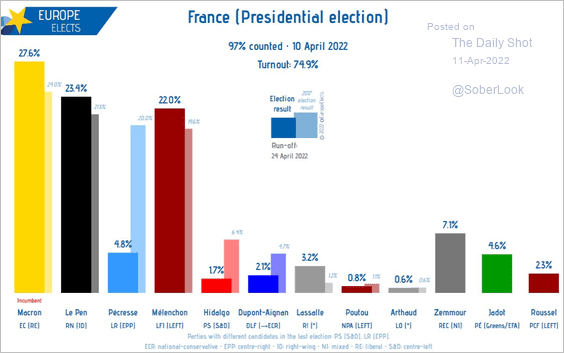
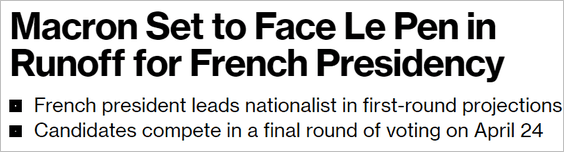
1. Macron performed a bit better than expected in the first round of elections.
 Source: @EuropeElects
 Source: Bloomberg Read full article
His odds of holding on to the presidency increased in the betting markets.
But will he be able to consolidate the left vote?
 Source: @VPatelFX
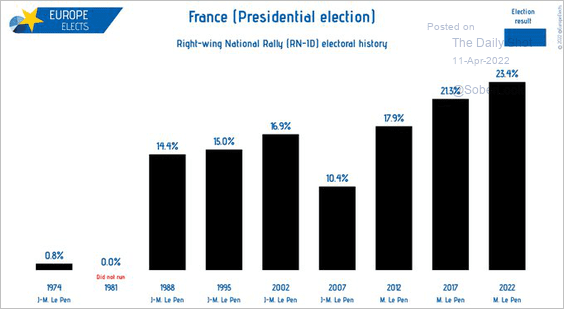
• The right-wing National Rally continues to gain support.
 Source: @EuropeElects
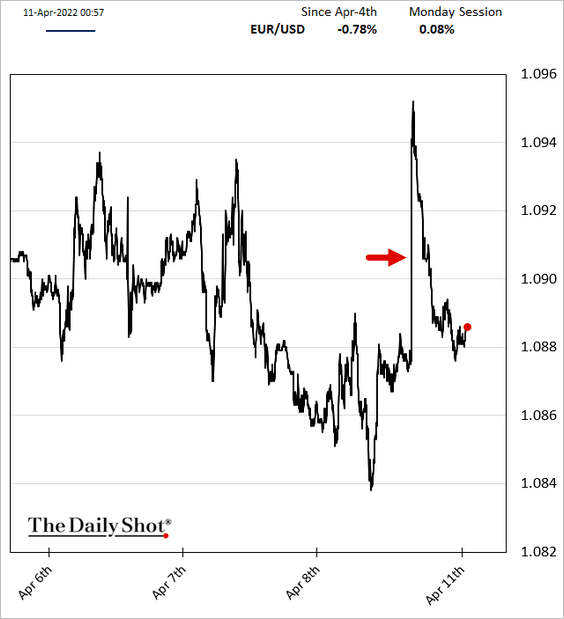
• The euro jumped but retreated immediately after.
——————–
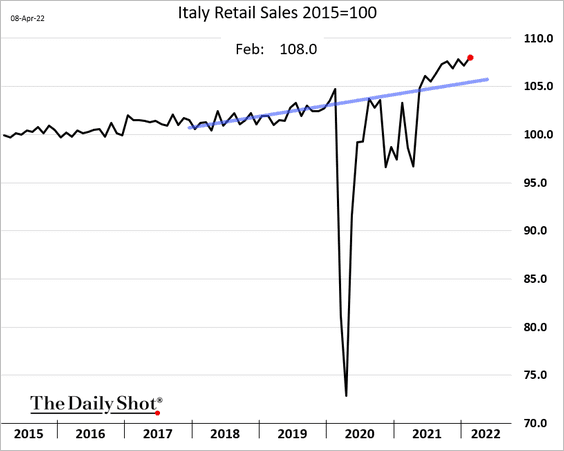
2. Italian retail sales were very strong in February.
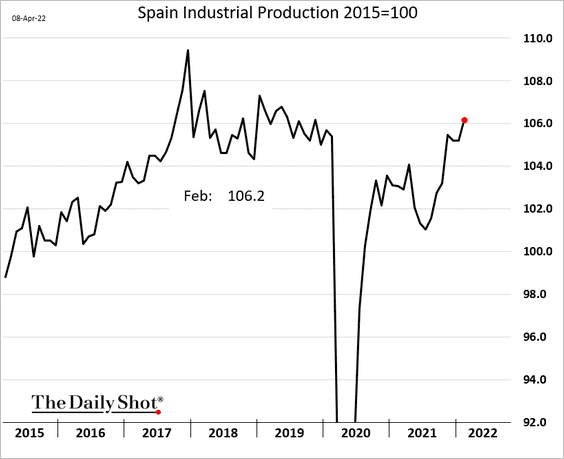
3. Spain’s industrial production is now above pre-COVID levels.
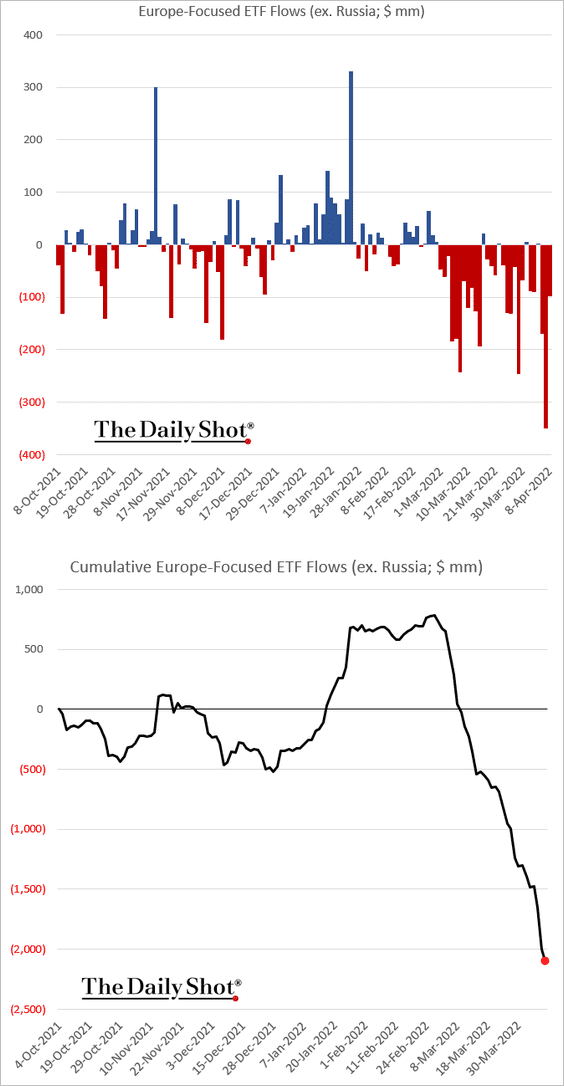
4. Europe-focused ETFs continue to see outflows.
Back to Index
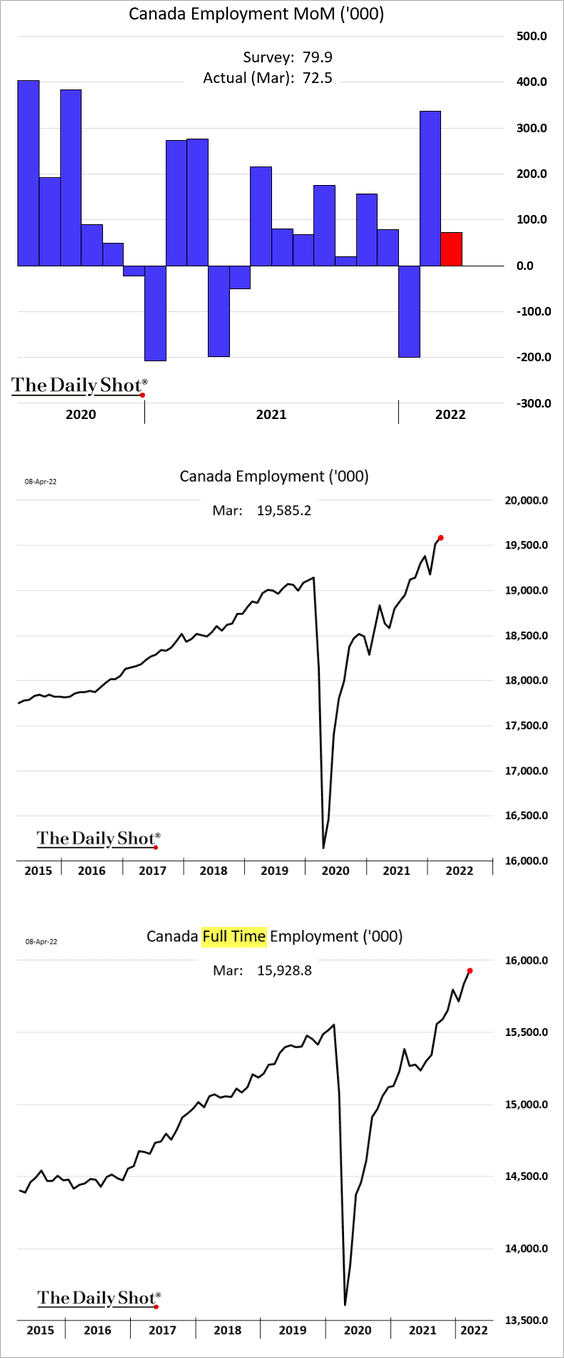
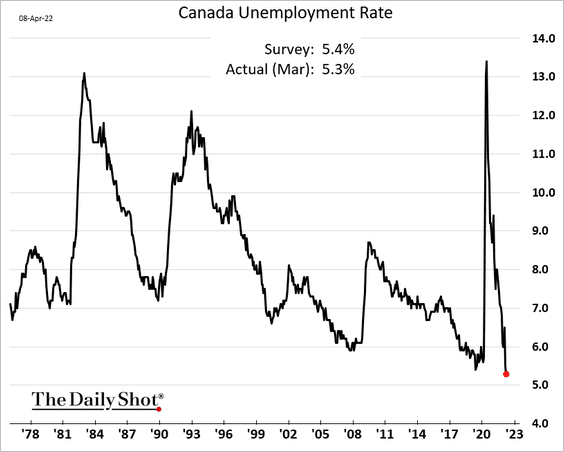
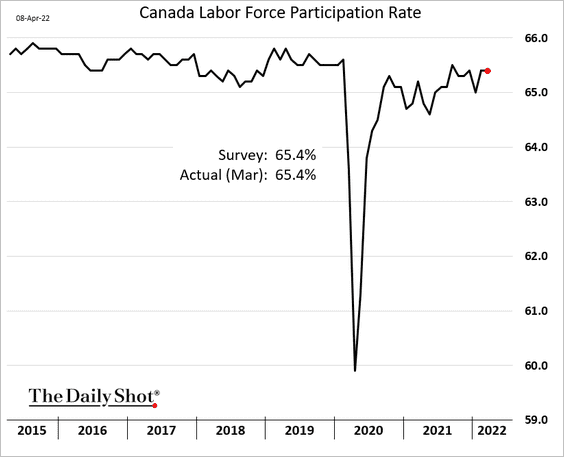
Canada
1. Job growth remained strong last month.
• The unemployment rate hit a new low.
• Labor force participation is holding steady.
——————–
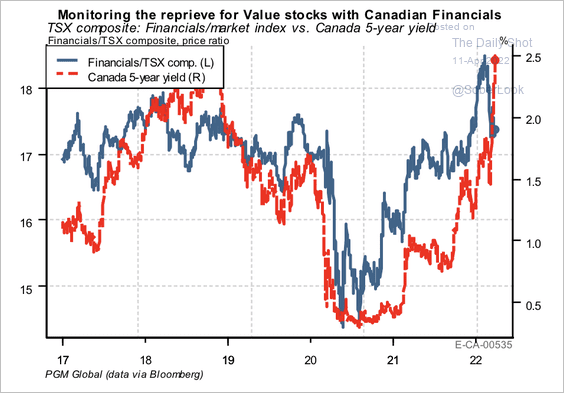
2. Similar to the US, TSX financial stocks have underperformed despite rising yields over the past few weeks.
 Source: PGM Global
Back to Index
The United States
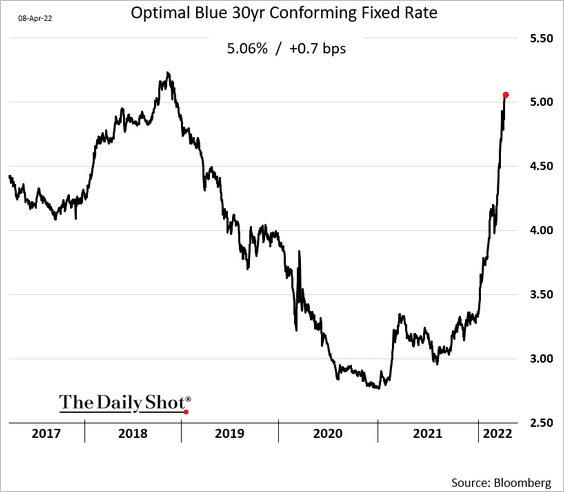
1. Mortgage rates are now firmly above 5% as Treasury yields surge.
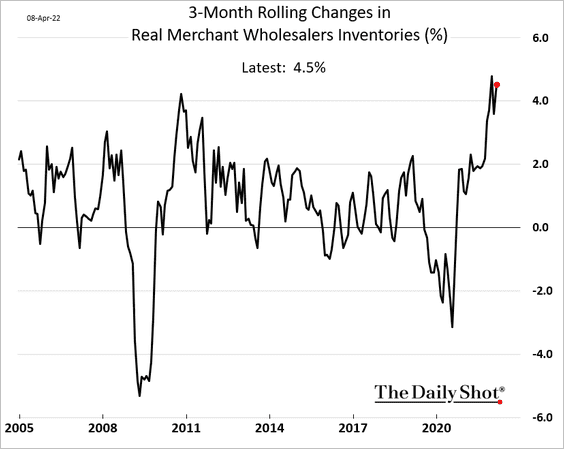
2. US wholesale inventory growth has been remarkably strong.
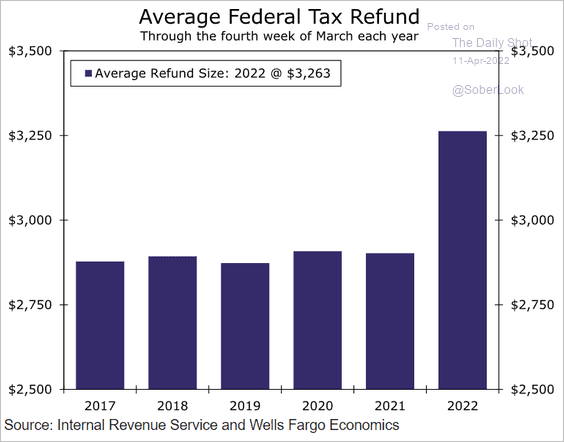
3. So far, federal tax refunds have been much higher in 2022 than in previous years.
 Source: Wells Fargo Securities
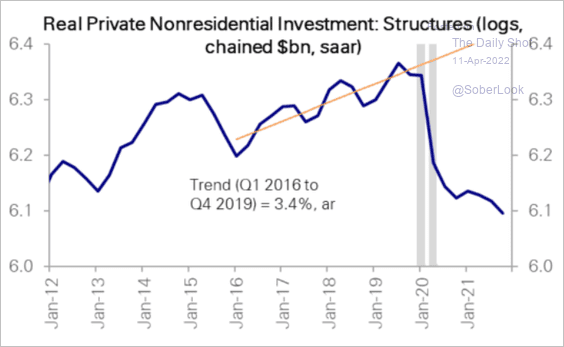
4. As we saw earlier, private nonresidential construction spending has been lagging. Here is private nonresidential investment adjusted for inflation.
 Source: Deutsche Bank Research
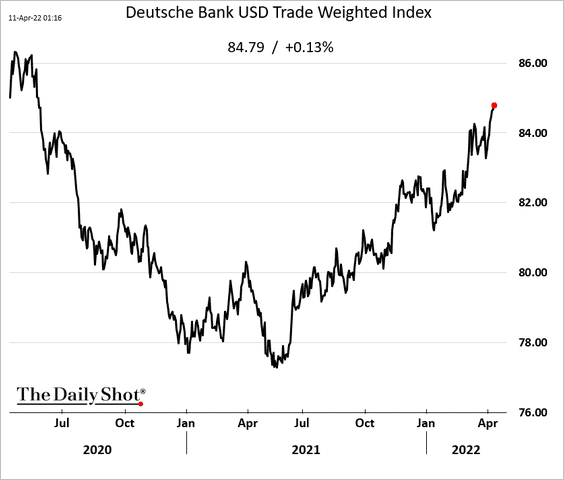
5. The US dollar continues to rally with yields and Fed rate hike expectations.
Back to Index
Global Developments
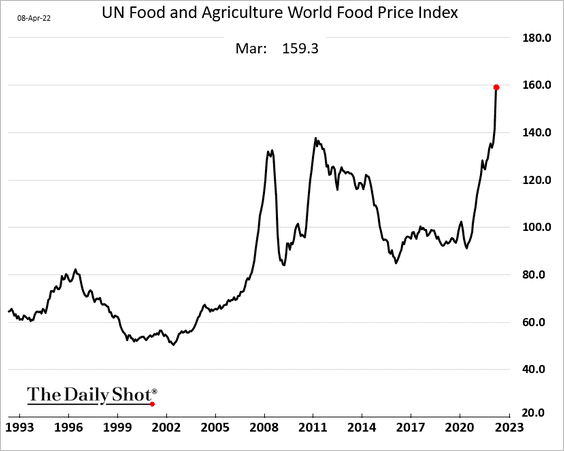
1. Global food prices surged in March.
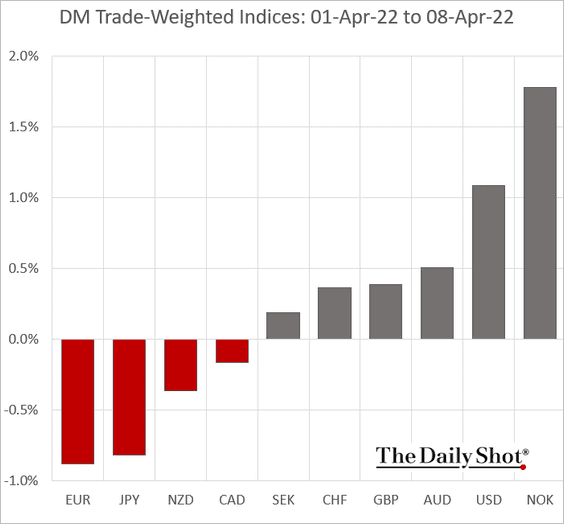
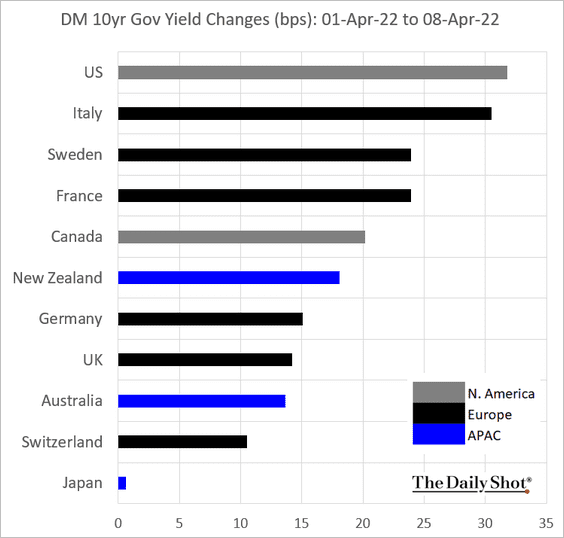
2. Next, we have some DM (advanced economies) performance data from last week.
• Trade-weighted currency indices:
• Bond yields:
——————–
Food for Thought
1. Increases in office vacancy rates in 2021:
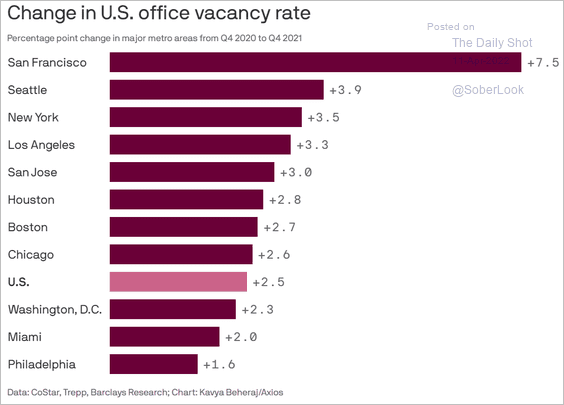 Source: @axios Read full article
2. Cost of inflation in 2022:
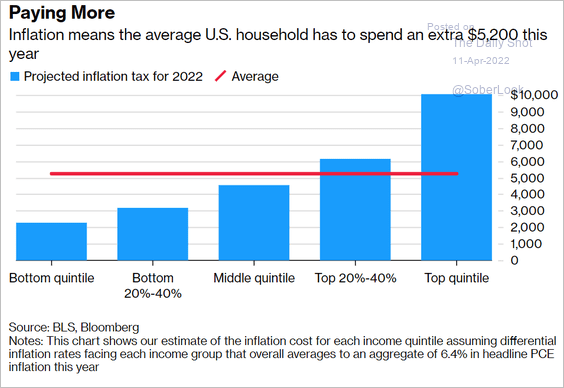 Source: Bloomberg Read full article
3. GDP by freedom indicator:
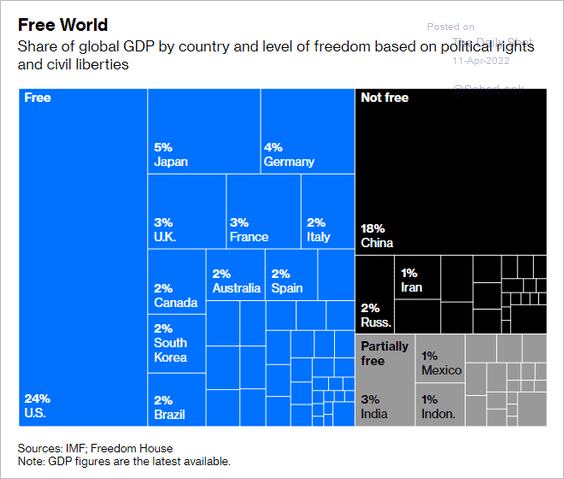 Source: @bopinion Read full article
4. Most loved and hated global figures:
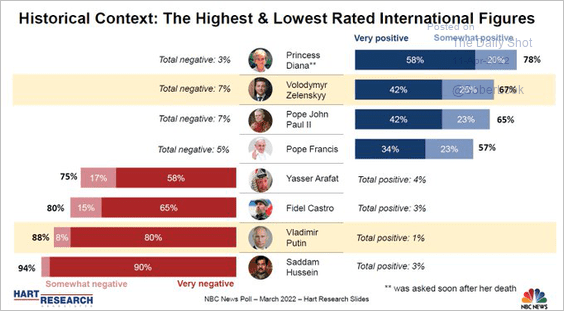 Source: @bpmehlman, @jeffhorwitt, @nbcnews
5. Years of life lost due to obesity:
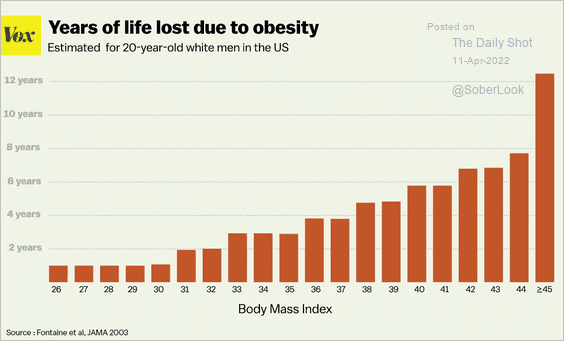 Source: VOX Read full article
6. Americans’ views on the economy:
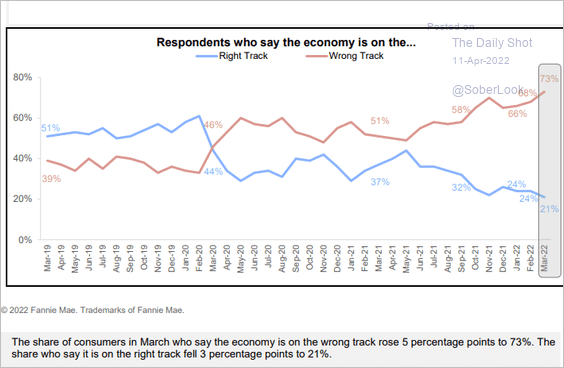 Source: Fannie Mae
7. Evolution of the alphabet:

——————–
Back to Index