
The Daily Shot: 11-Jul-22
• The United States
• Canada
• The United Kingdom
• The Eurozone
• Japan
• Asia – Pacific
• China
• Emerging Markets
• Cryptocurrency
• Commodities
• Energy
• Equities
• Alternatives
• Credit
• Rates
• Global Developments
• Food for Thought
The United States
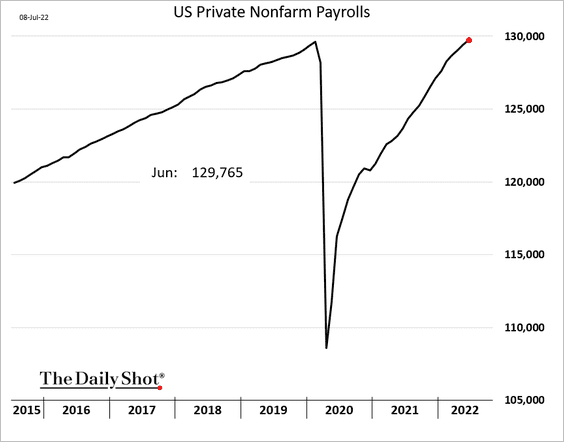
1. The June payrolls report surprised to the upside, nearing full recovery (2nd panel).
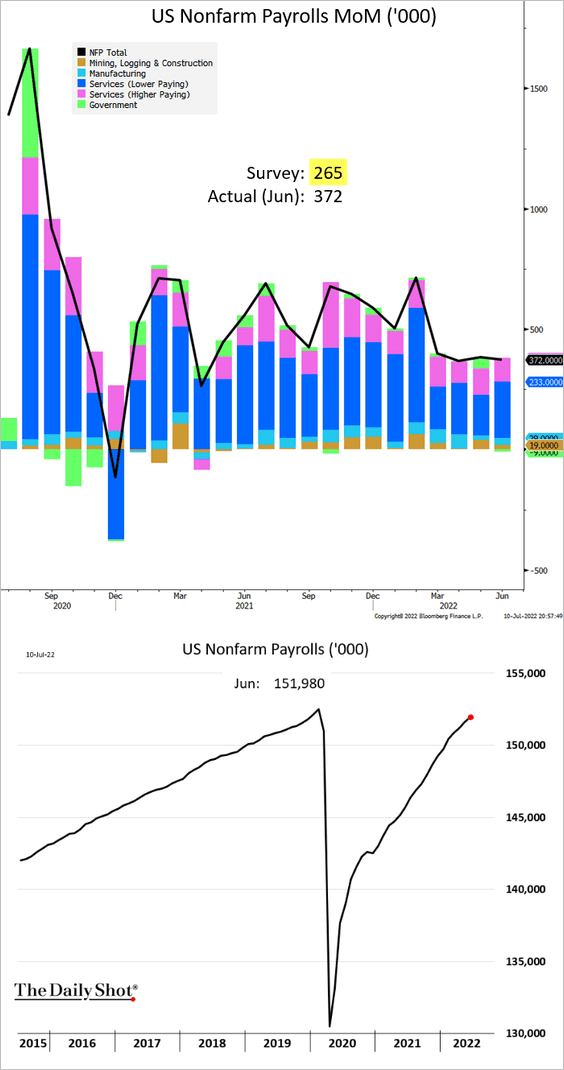 Source: @TheTerminal, Bloomberg Finance L.P.
• While we’ve seen signs of softer economic growth, the payrolls figures are not signaling a recession for now.
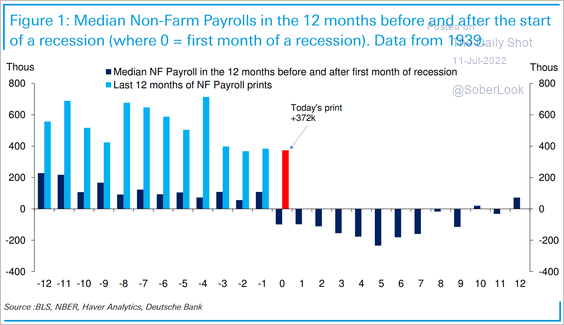 Source: Deutsche Bank Research
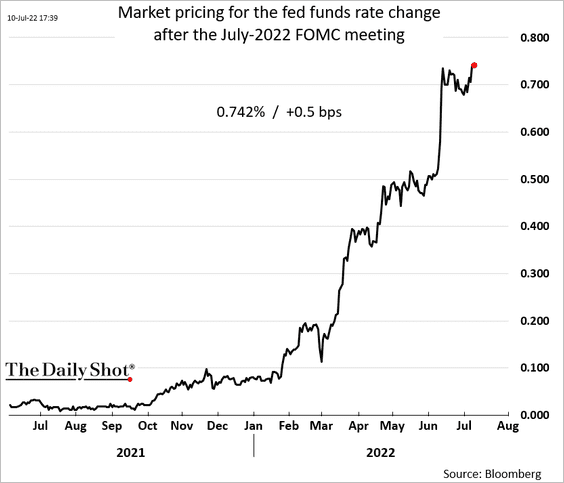
• This jobs report sealed a 75 bps Fed rate hike this month.
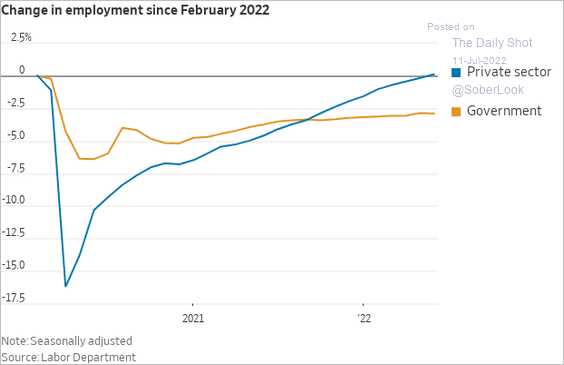
• The gains in private hiring were even stronger, …
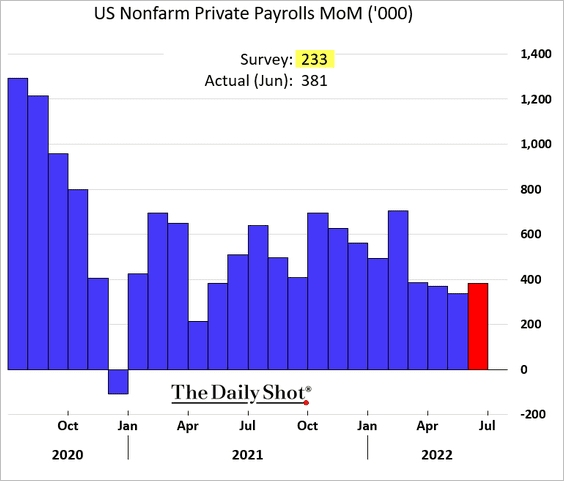
… with private payrolls now above the pre-COVID peak.
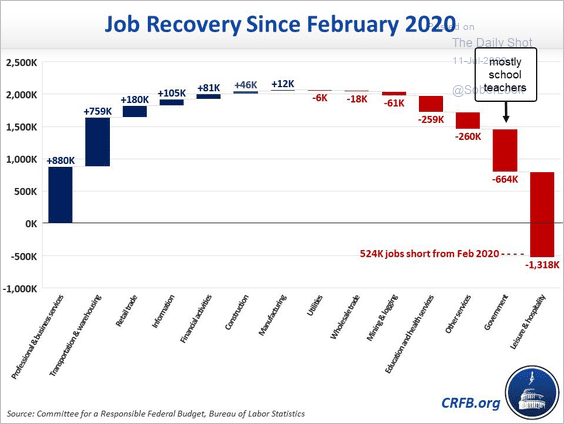
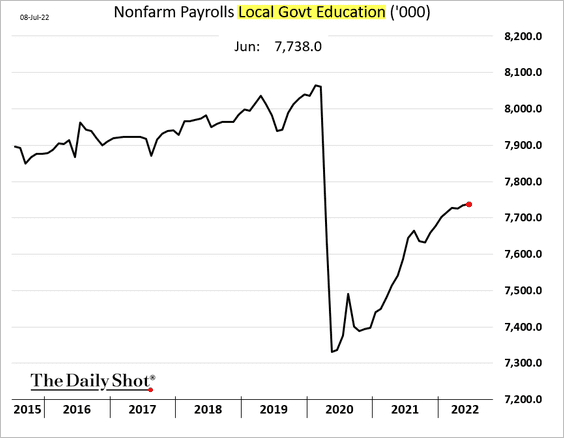
Public sector job gains have been lagging the private sector. A substantial component of this divergence has been public school teachers.
 Source: @WSJ Read full article
 Source: @MarcGoldwein, @katekgen, @BudgetHawks
Many educators do not wish to return to work.
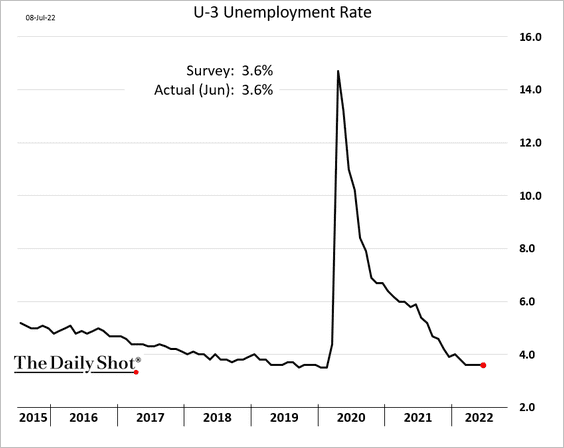
• The unemployment rate held steady.
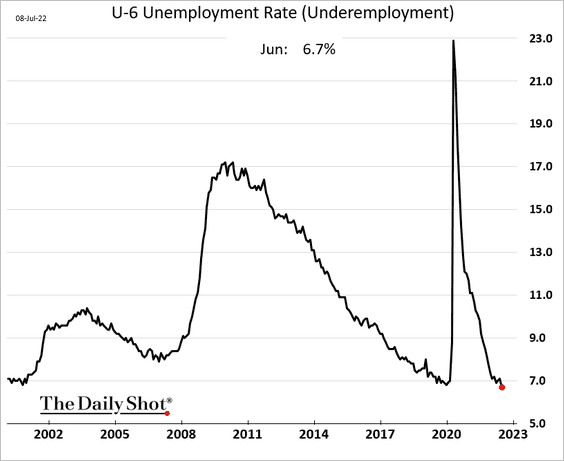
But the U-6 measure of underemployment hit a record low. It’s another indication of tightness in the labor market.
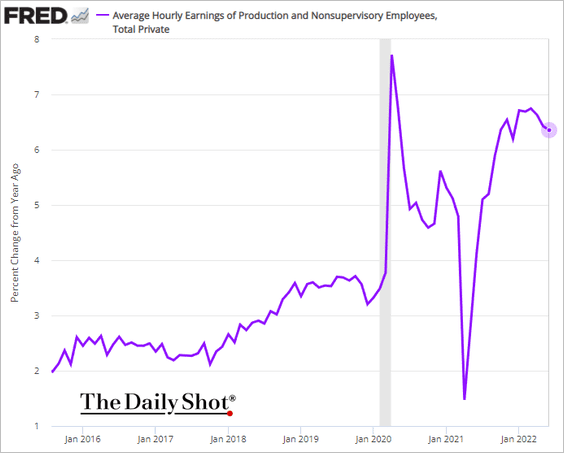
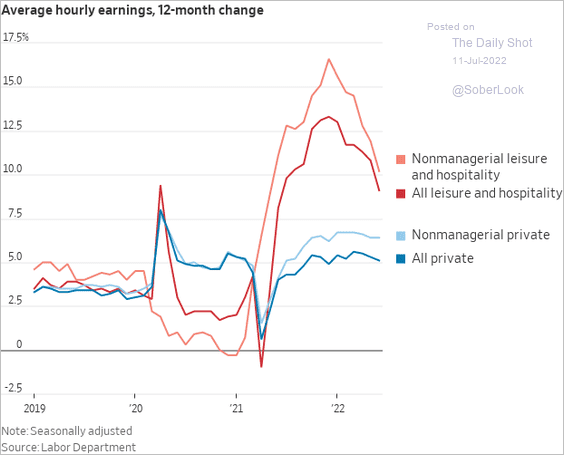
• Wage growth for nonsupervisory workers appears to have peaked. The leisure & hospitality sector saw a substantial slowdown (2nd chart).
 Source: @WSJ Read full article
• Employee hours have been moderating.
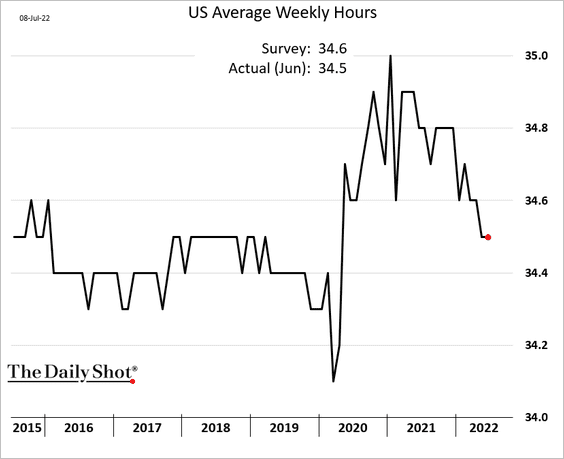
We will have more updates on the labor market tomorrow.
——————–
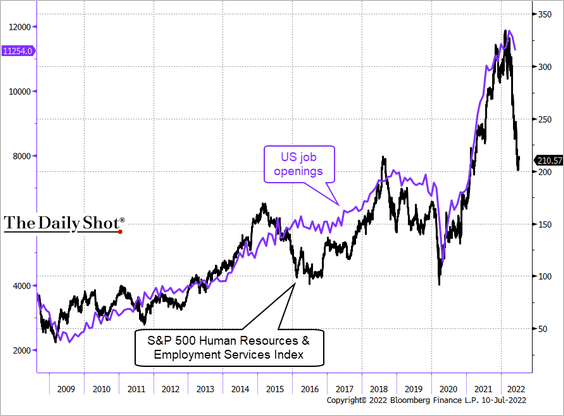
2. Despite the strength in the jobs data, the stock market is telling us that demand for labor is slowing.
 Source: @TheTerminal, Bloomberg Finance L.P., h/t Ken
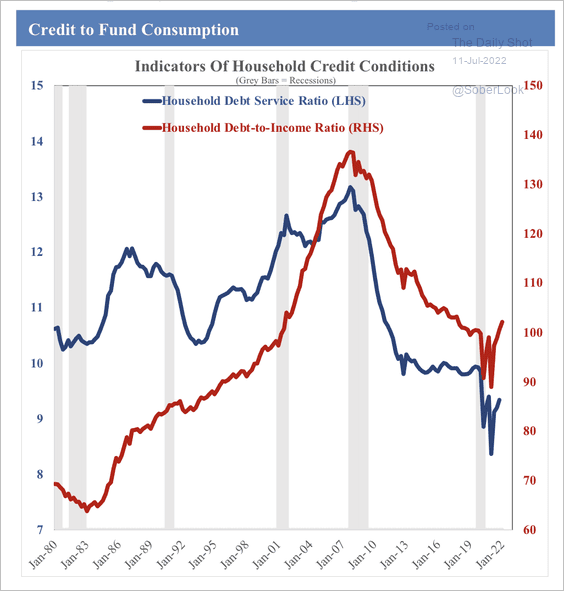
3. Credit card balances increased again in May but at a slower rate.
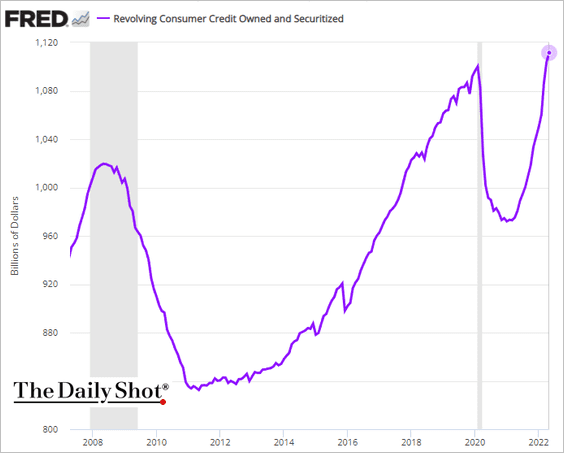
Household debt remains relatively low, which could support consumption growth.
 Source: SOM Macro Strategies
——————–
4. Retailers see slower sales but are still doing quite well.
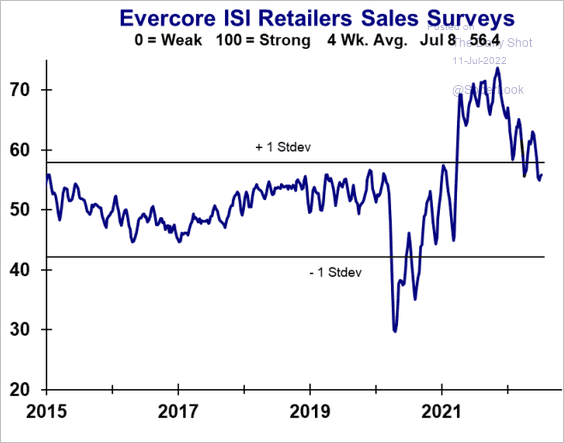 Source: Evercore ISI Research
Back to Index
Canada
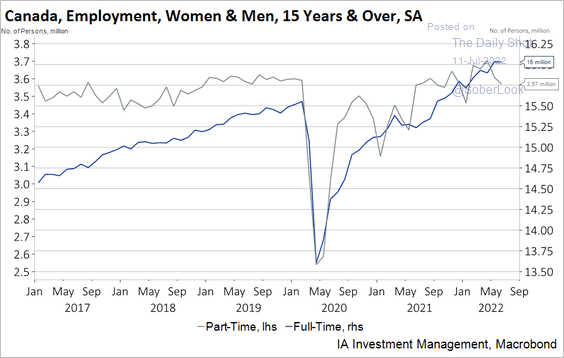
1. The employment report was disappointing, showing a loss of 43k jobs last month.
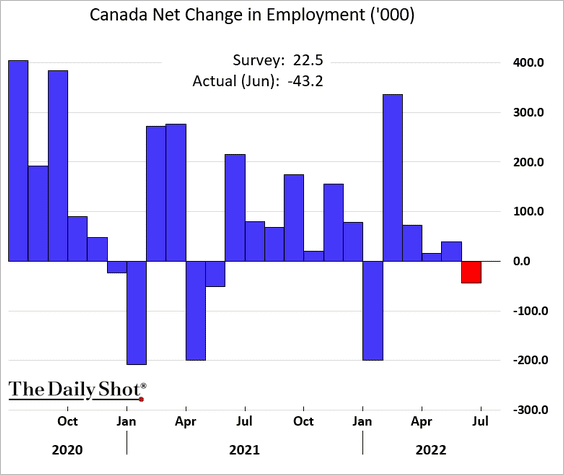
• Most of the losses were in part-time jobs.
 Source: Industrial Alliance Investment Management Inc.
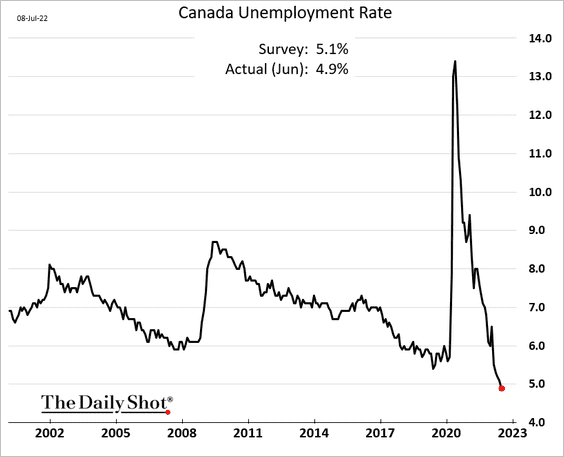
• The unemployment rate hit a new low. The labor market is tight.
• The participation rate declined.
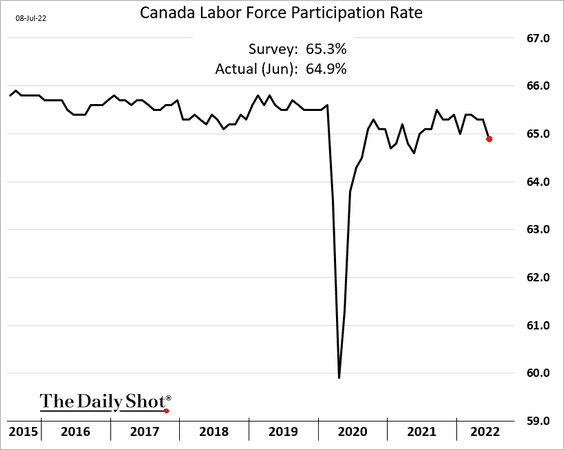
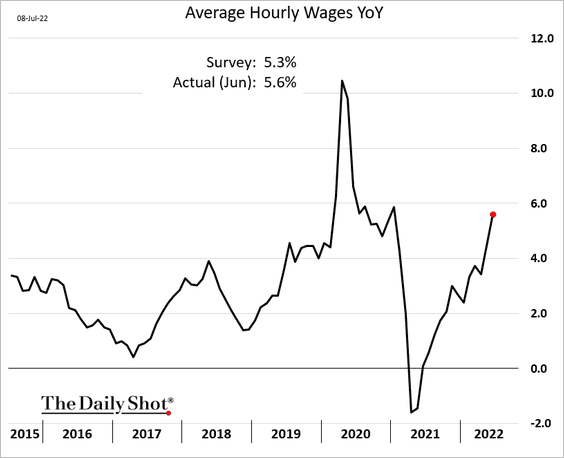
• Wage growth surprised to the upside. The BoC is going to focus on the labor market tightness and rising wage growth.
——————–
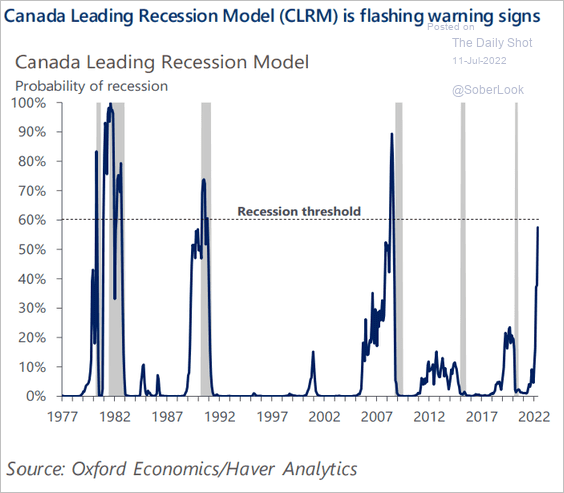
2. Recession risks are rising, according to a model from Oxford Economics.
 Source: Oxford Economics
Back to Index
The United Kingdom
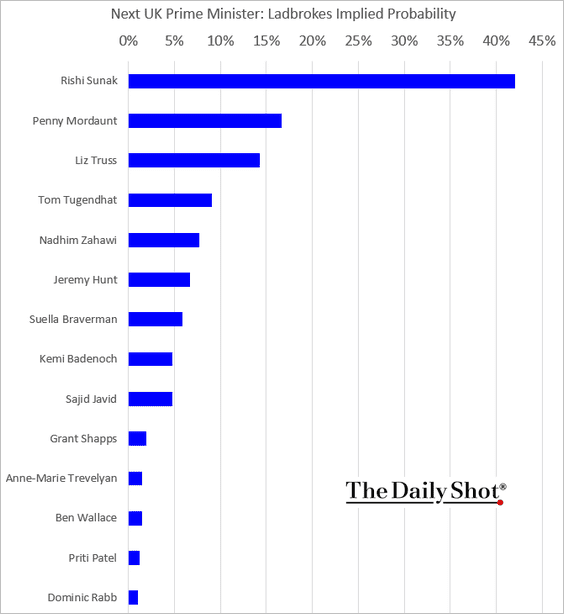
What are the betting markets telling us about who will replace Boris Johnson (2 charts)?
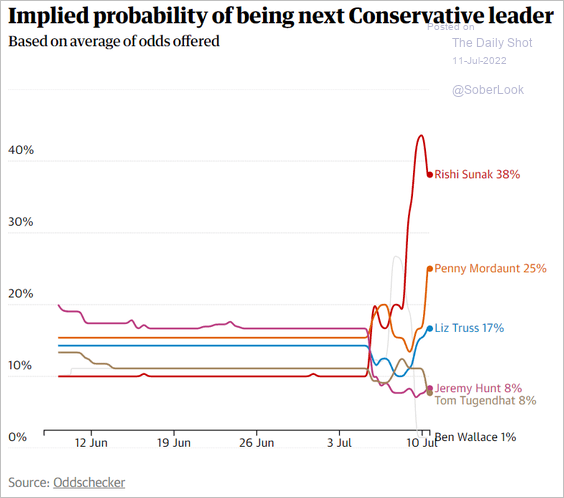 Source: The Guardian Read full article
Separately, this chart shows parliament voting intentions over time.
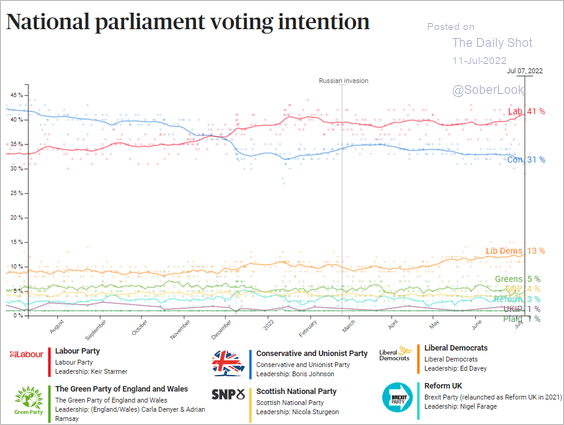 Source: Politico
Back to Index
The Eurozone
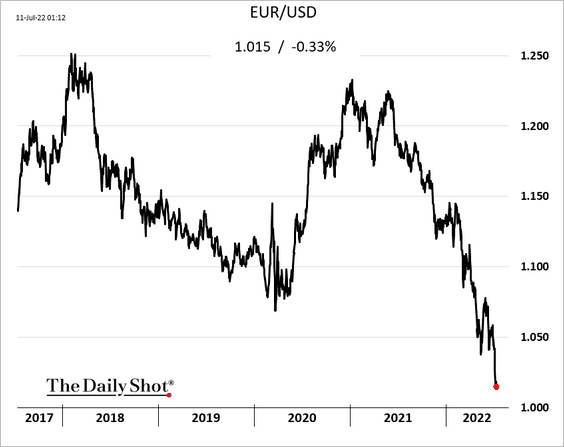
1. The euro continues to hit multi-year lows vs. USD.
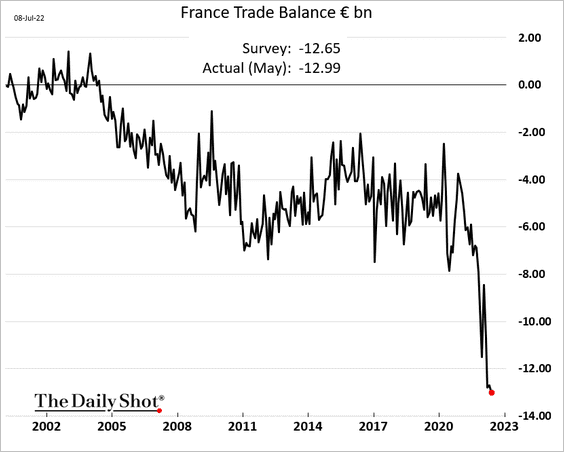
2. The French trade deficit hit a new record due to growing energy costs.
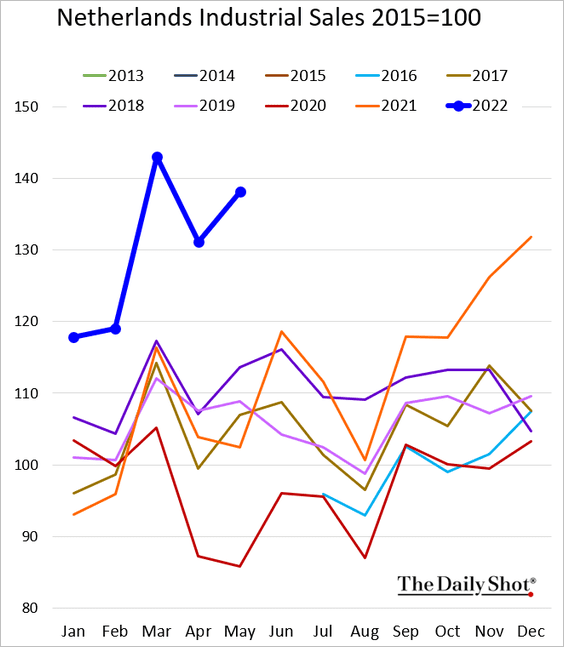
3. Dutch industrial sales remain elevated.
4. Recession probability is climbing, according to Deutsche Bank.
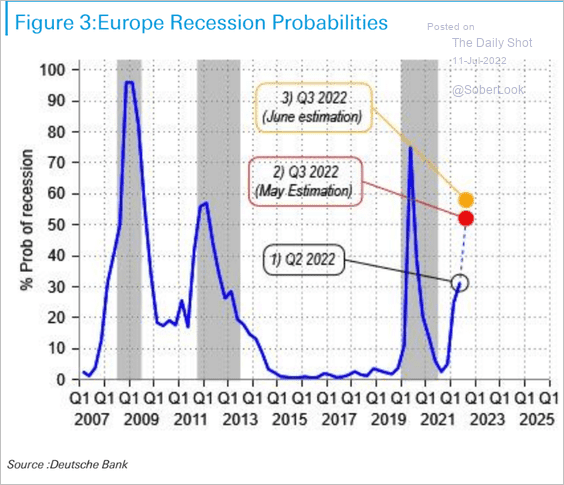 Source: Deutsche Bank Research
5. This chart shows the debt distribution by country (% of GDP).
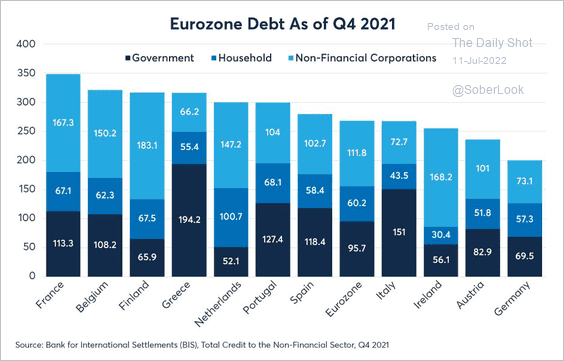 Source: BIS
Back to Index
Japan
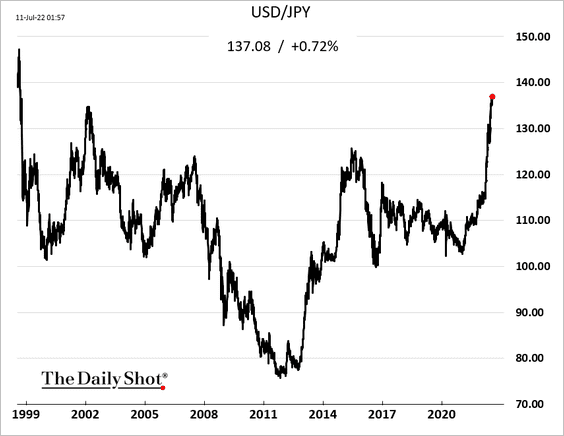
1. The yen hit a 24-year low vs. USD. The ruling coalition’s election gains suggest that the accommodative monetary policy is here to stay.
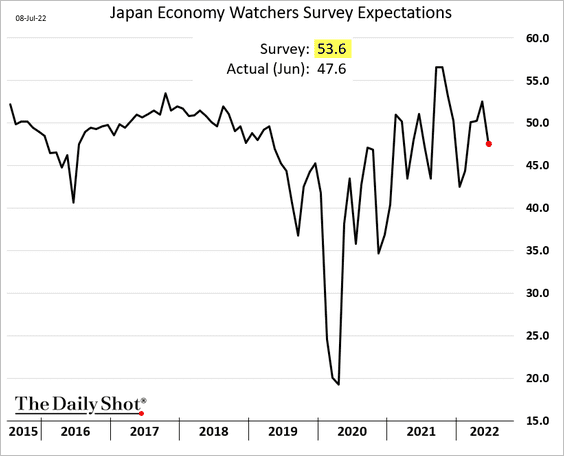
2. The Economy Watchers expectations index surprised to the downside.
3. Household spending has been losing momentum.
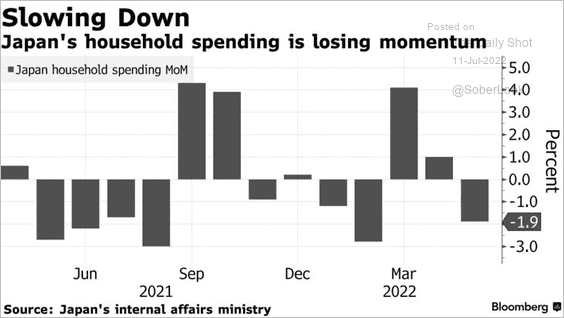 Source: @markets, @MollySmithNews Read full article
Back to Index
Asia – Pacific
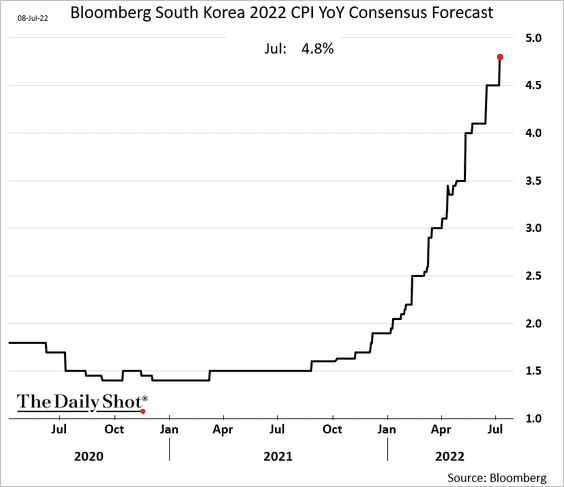
1. Economists continue to boost South Korea’s CPI forecasts for 2022.
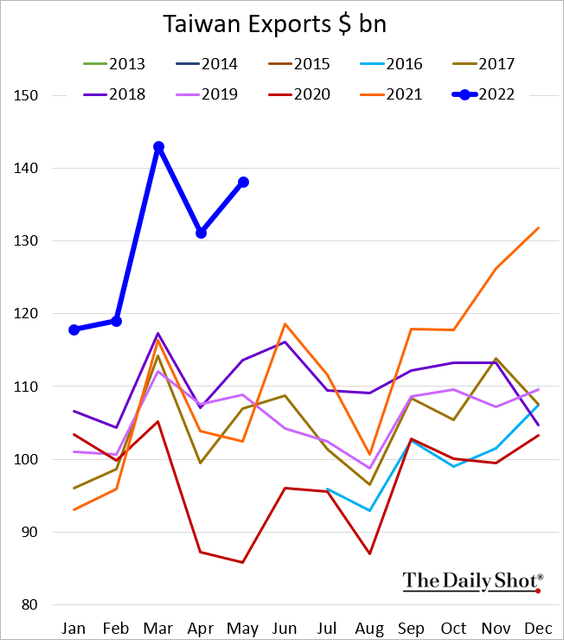
2. Taiwan’s exports remain very strong.
3. Residential construction intentions in New Zealand have declined.
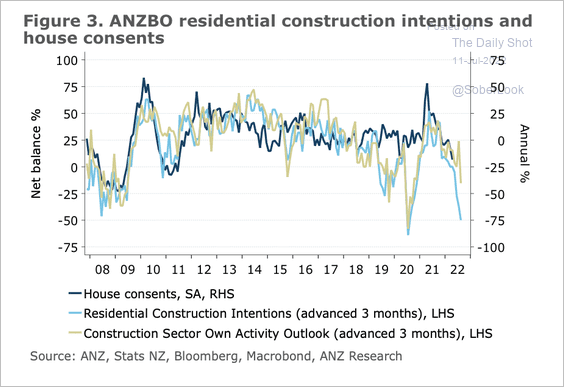 Source: @ANZ_Research
New Zealand house prices are vulnerable to a sharp fall.
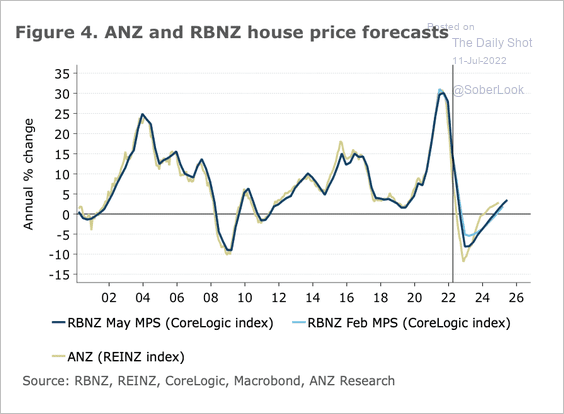 Source: @ANZ_Research
Back to Index
China
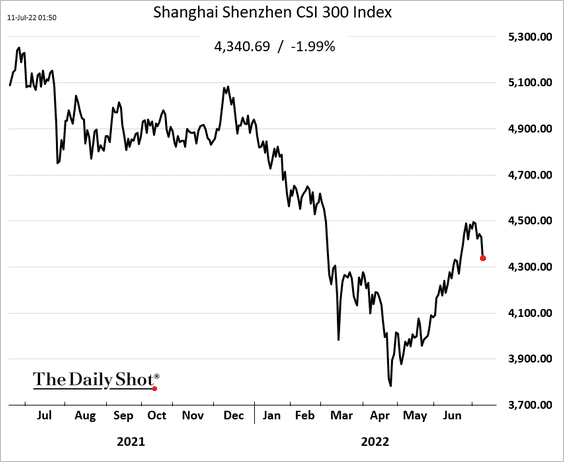
1. The stock market rally has stalled amid new COVID flareups and more anti-tech regulatory action.
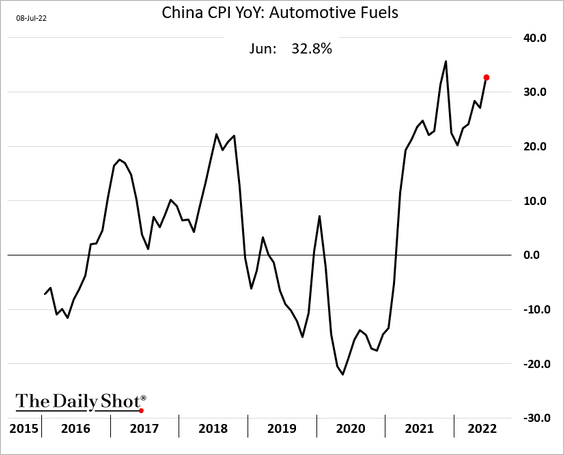
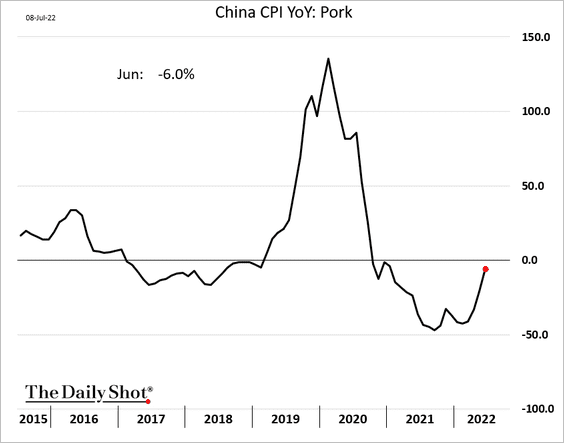
2. The June CPI was a bit higher than expected, boosted by food and fuel.
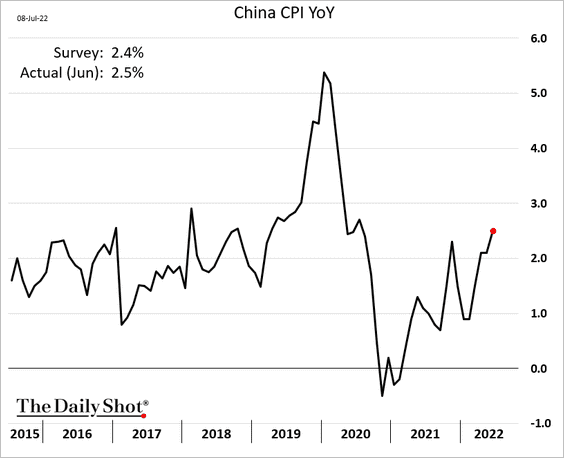
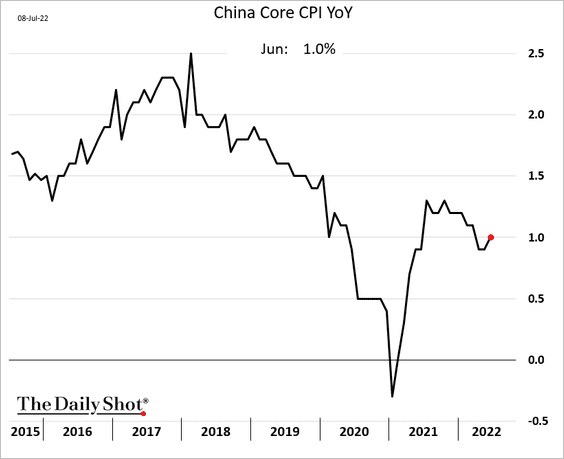
The core CPI ticked up as well.
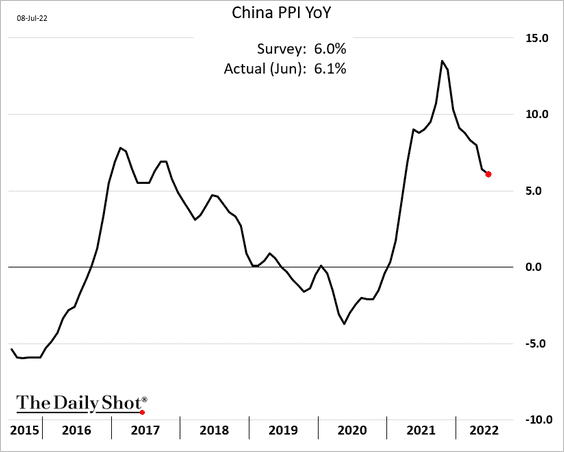
The PPI is moderating, but the June report also topped expectations.
——————–
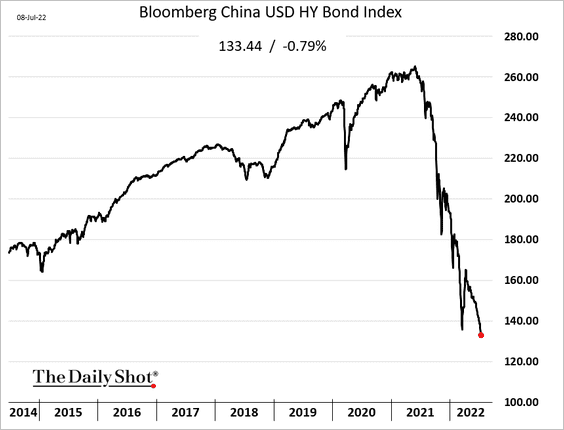
3. USD-denominated HY bond prices are hitting multi-year lows, led by leveraged developers.
Developer downgrades continue to account for a majority of rating actions at Fitch.
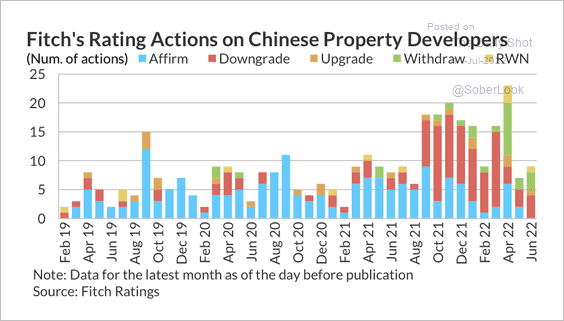 Source: Fitch Ratings
——————–
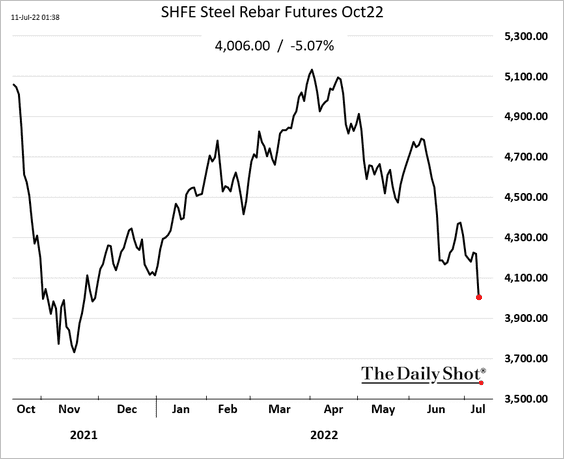
4. Steel prices are down sharply amid slower housing demand.
5. Online sales slumped this year.
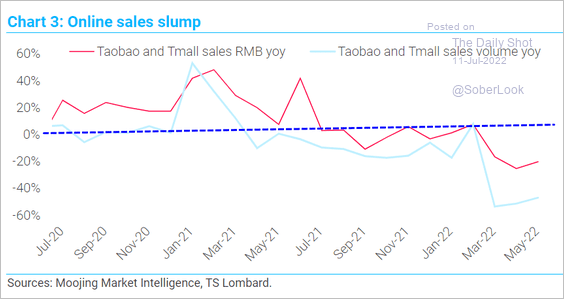 Source: TS Lombard
6. Total lending to corporates accelerated since last year, but was entirely driven by short-term credit demand.
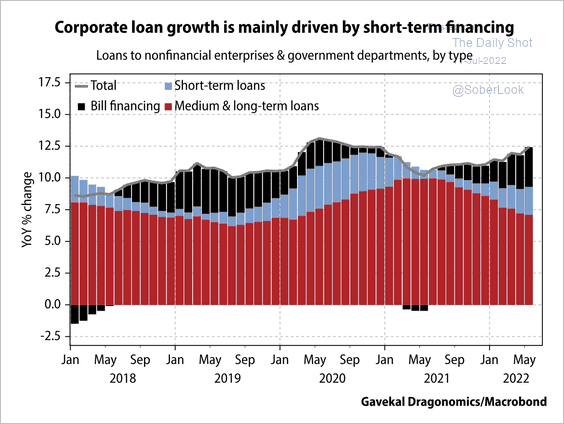 Source: Gavekal Research
Back to Index
Emerging Markets
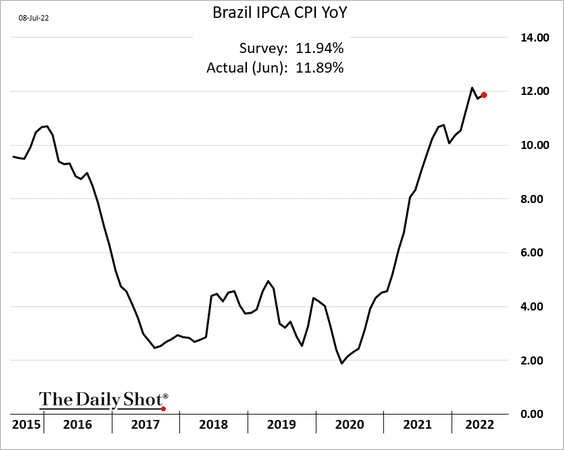
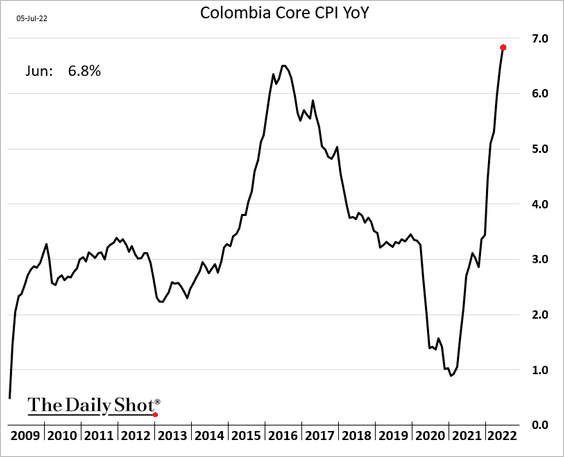
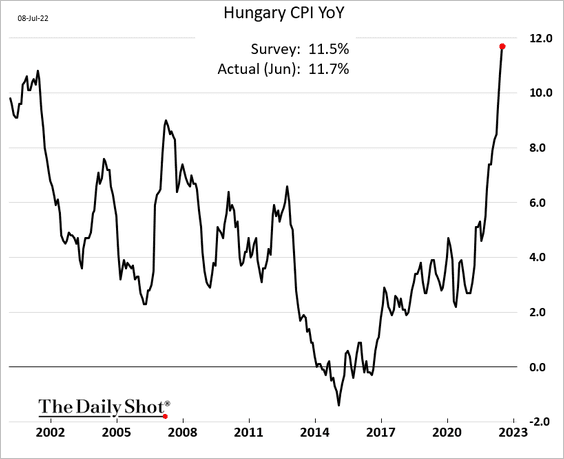
1. Let’s begin with some inflation data.
• Brazil’s CPI (still holding near 12%):
• Chile’s core CPI (nearing 10%):
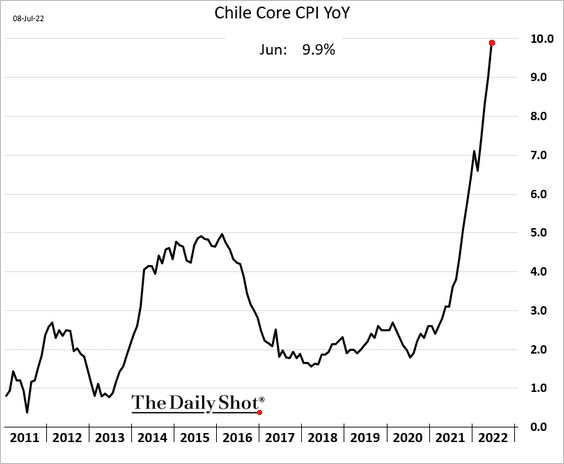
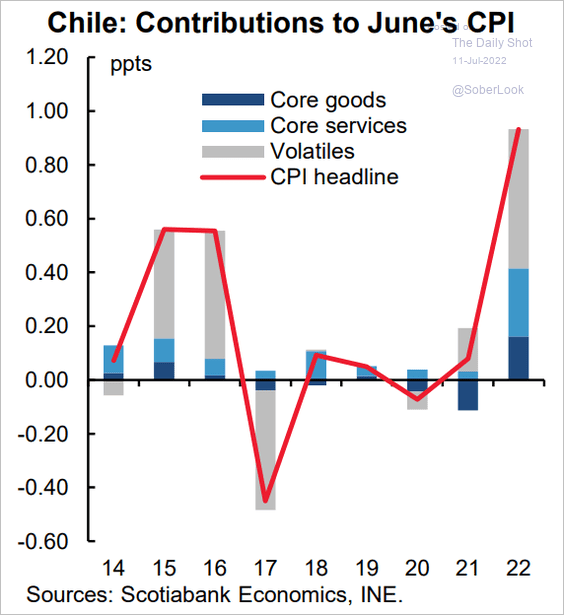 Source: Scotiabank Economics
• Colombia’s CPI:
• Hungary’s CPI:
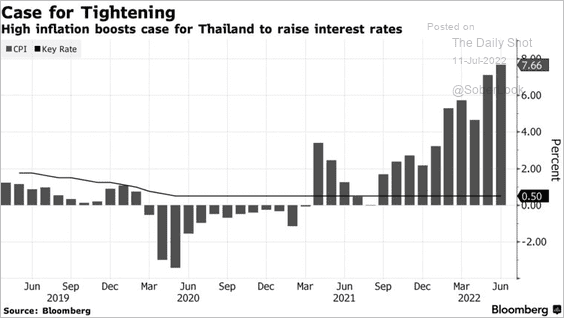
• Thailand’s CPI (rate hikes are coming):
 Source: @markets, @MollySmithNews Read full article
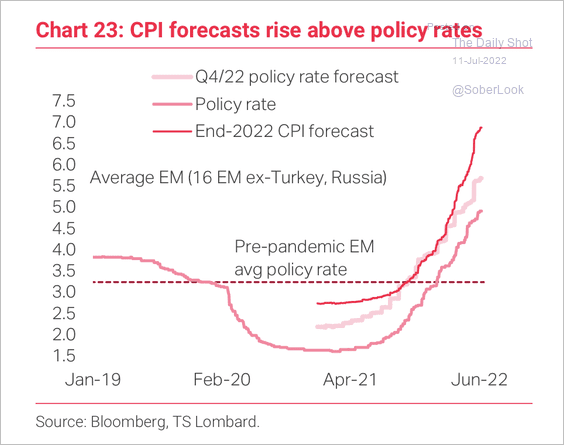
• On average, CPI forecasts have risen above policy rates.
 Source: TS Lombard
——————–
2. This chart shows the quarterly losing streaks in the MSCI EM (equity) Index.
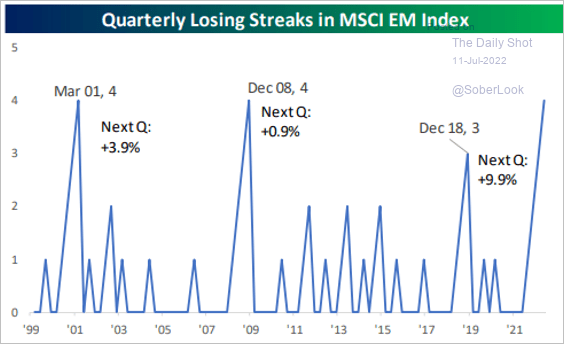 Source: @bespokeinvest Read full article
3. Foreigners pulled capital out of EM (ex-China) equity last month.
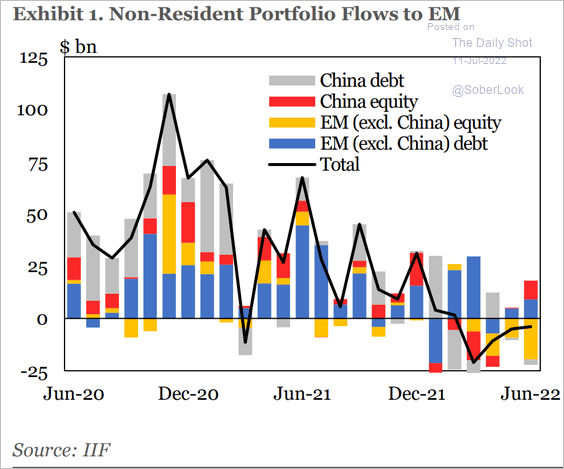 Source: IIF
4. Which central banks are ahead/behind the curve?
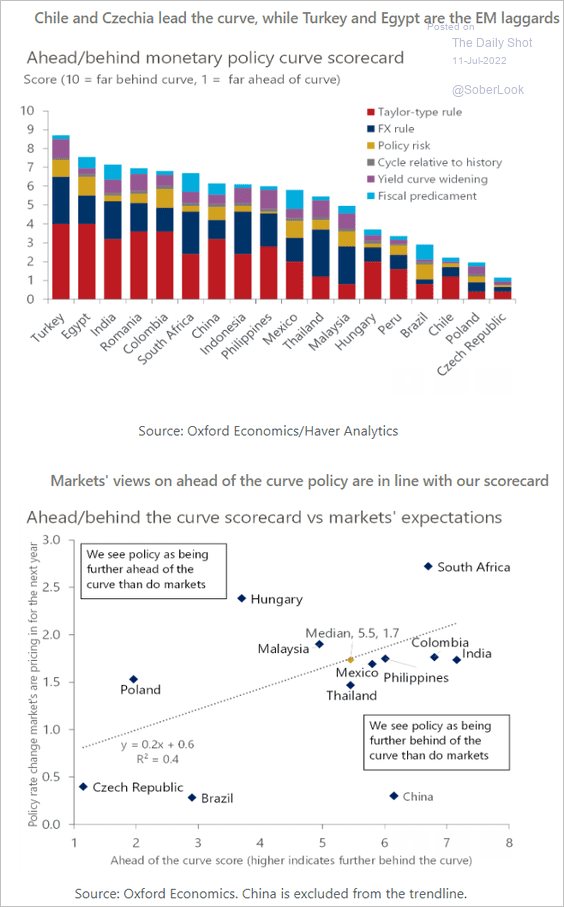 Source: Oxford Economics
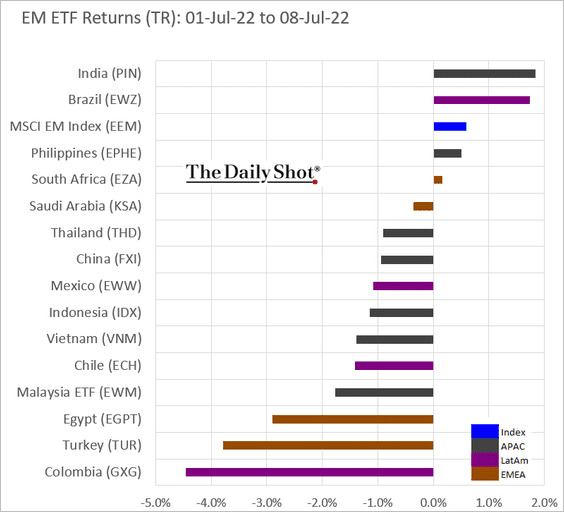
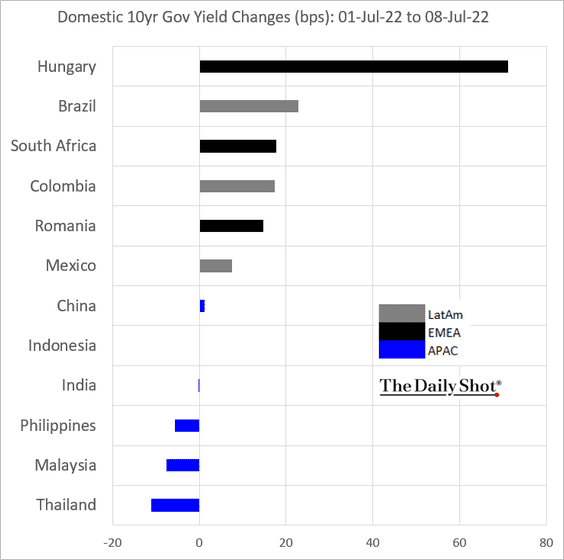
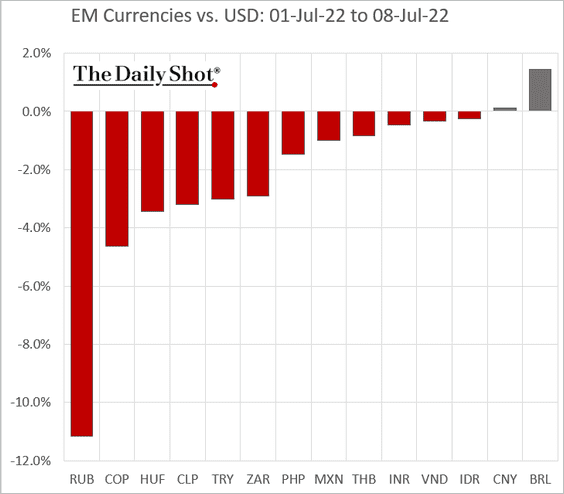
5. Finally, we have last week’s performance data.
• Equity ETFs:
• Domestic debt yields:
• EM currencies:
Back to Index
Cryptocurrency
1. Bitcoin’s Fear & Greed Index is starting to rise from “extreme fear” lows.
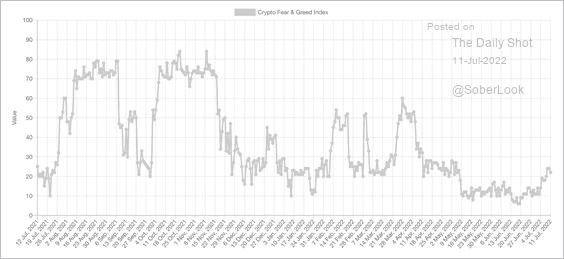 Source: Alternative.me
2. Tether has seen a significant decline in its dominance of the stablecoin market. Circle’s USDC, however, has captured a larger market share over the past year.
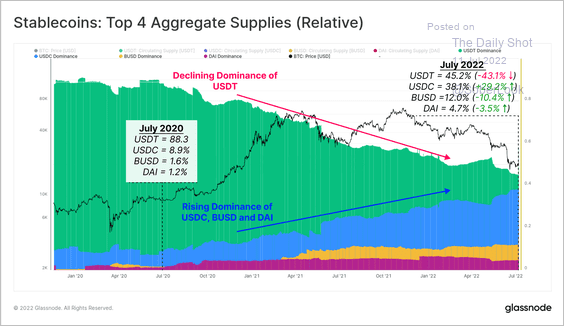 Source: @glassnode
3. Most major cryptos are down over the past month, although Litecoin’s LTC token has outperformed.
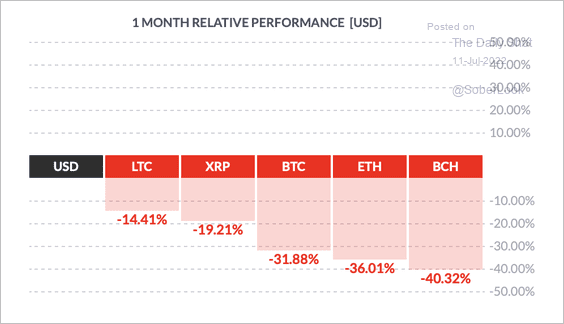 Source: FinViz
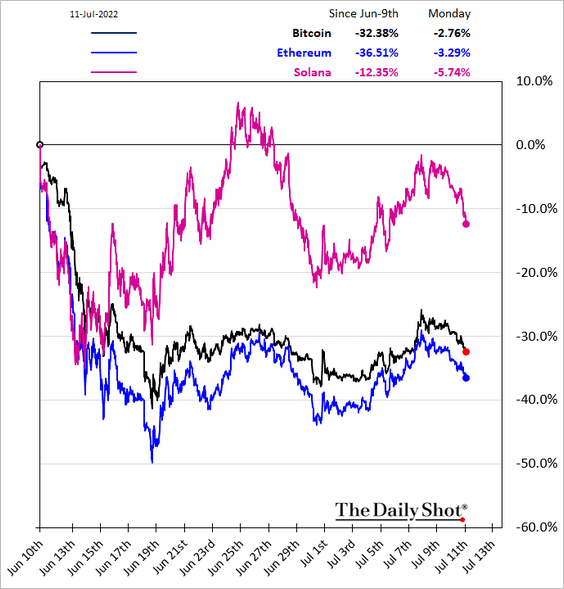
Solana also outperformed over the past month.
——————–
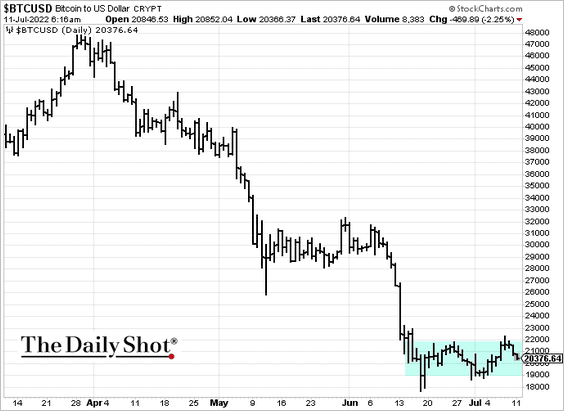
4. Bitcoin has been range-bound.
Back to Index
Commodities
1. Speculative accounts are holding their bets against copper futures.
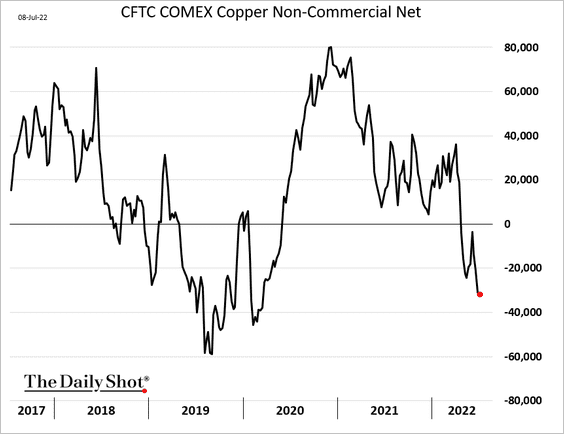
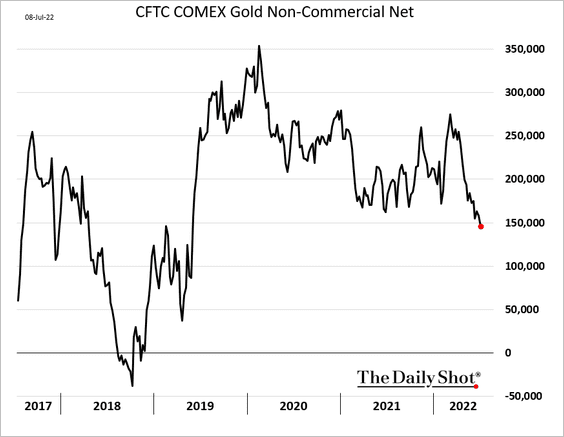
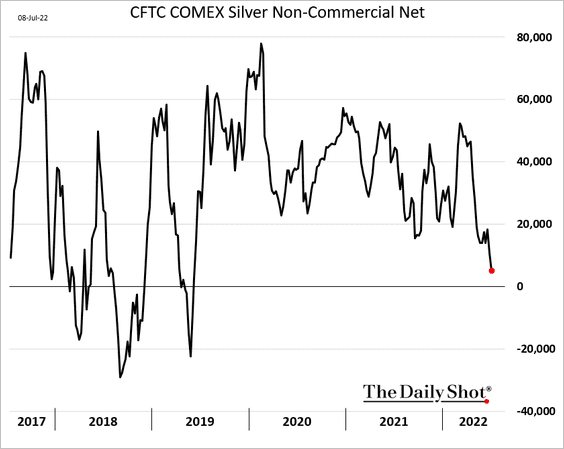
Speculators are also reducing their bets on precious metals.
——————–
2. US grains are rebounding as supply concerns resurface.
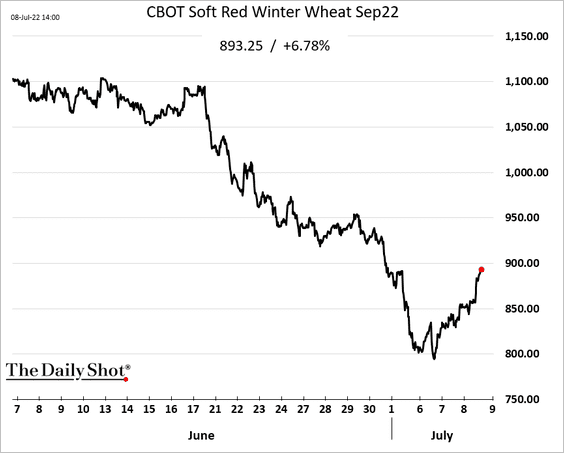
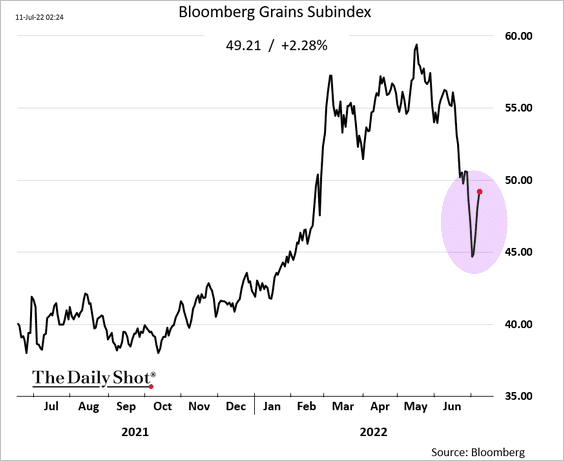
The weather isn’t cooperating.
 Source: NOAA
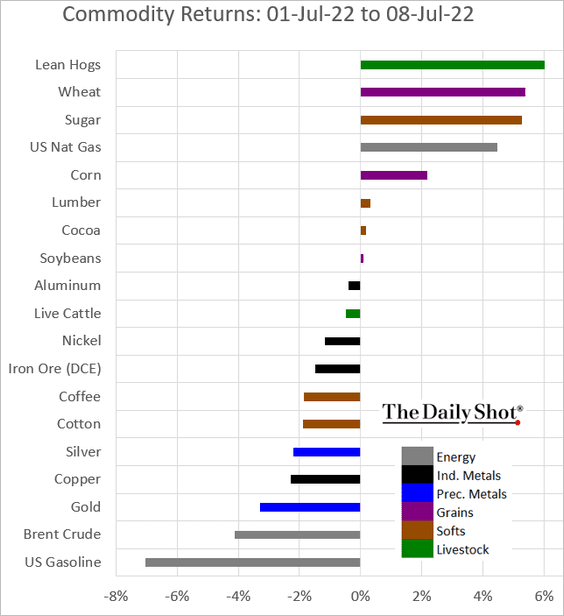
——————–
3. This chart shows last week’s performance across key commodity markets.
Back to Index
Energy
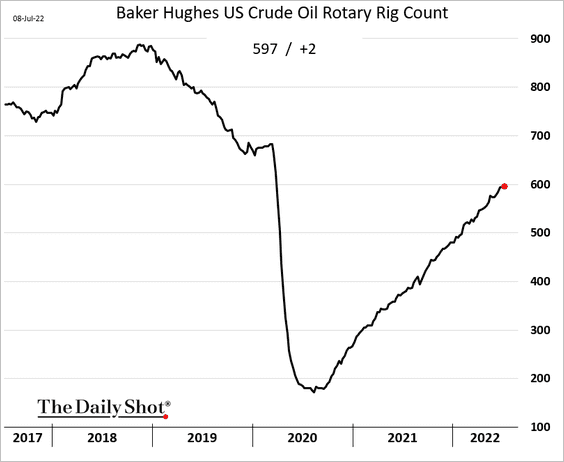
1. The US rig count is nearing 600.
2. Global oil inventories remain very tight.
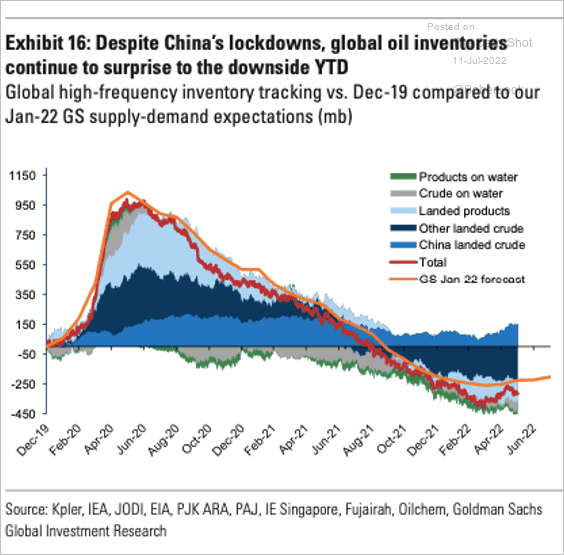 Source: Goldman Sachs
3. Asia, the Middle East, and Africa account for over 80% of new refining capacity to come online by 2025.
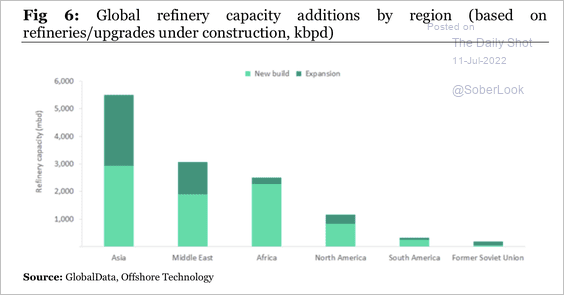 Source: Longview Economics
4. Refined product output has risen in the US but declined in Europe.
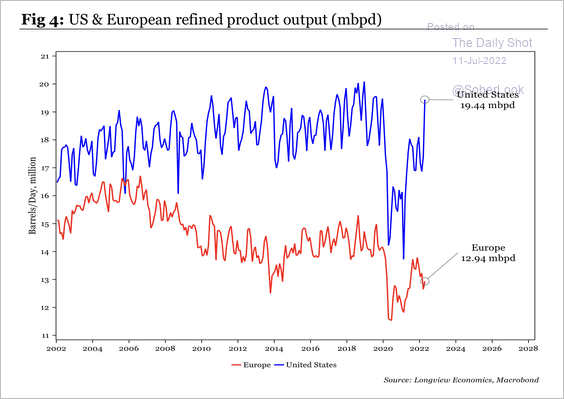 Source: Longview Economics
• US refined products exports hit a record high.
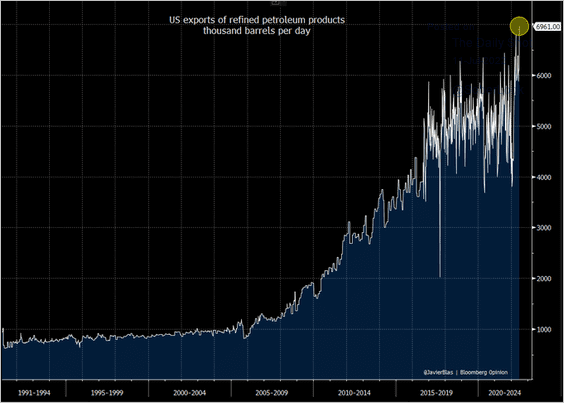 Source: @JavierBlas, @EIAgov
• US refinery utilization is nearing full capacity.
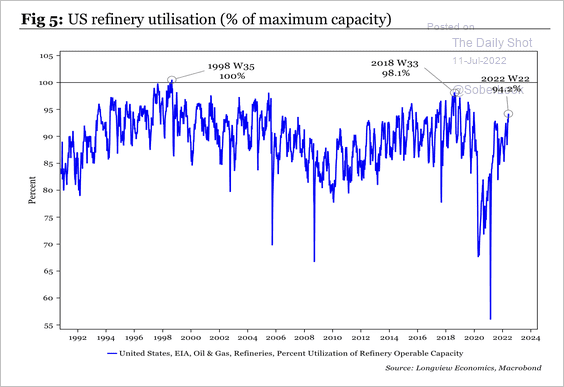 Source: Longview Economics
——————–
5. Arab Light Crude is trading at a premium to Brent.
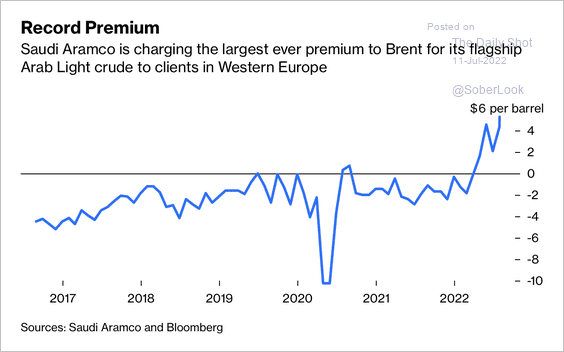 Source: @JavierBlas, @opinion Read full article
6. Russia’s Gazprom output has been running at multi-year lows. The company’s business in Europe has all but disappeared and export volumes have collapsed, according to REA.
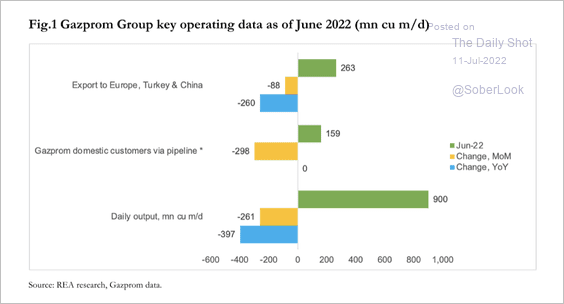 Source: Nadia Kazakova; Renaissance Energy Advisors
7. This chart shows BloombergNEF’s LNG supply/demand projections.
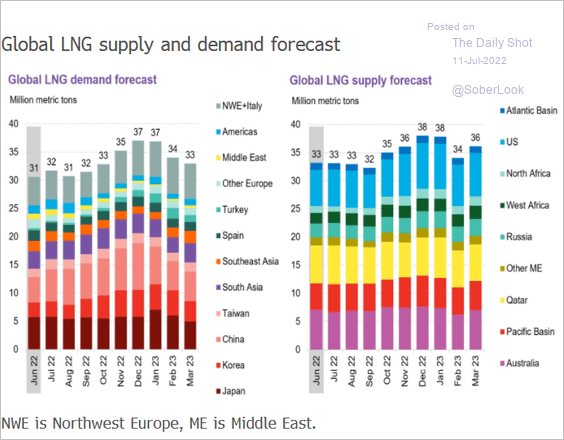 Source: @BloombergNEF Read full article
Back to Index
Equities
1. Global stocks and US futures are lower this morning as the US dollar hits a multi-year high.
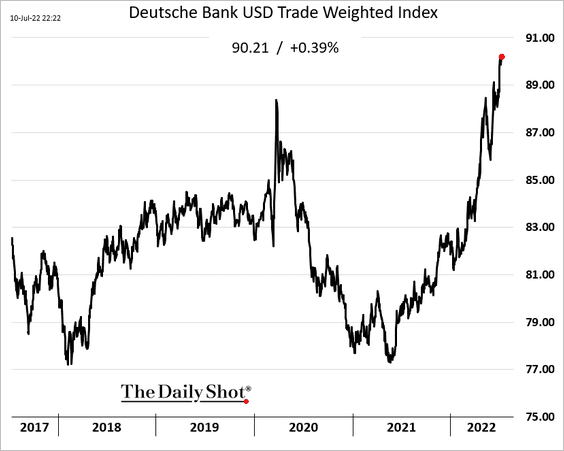
A stronger US dollar means softer corporate earnings ahead.
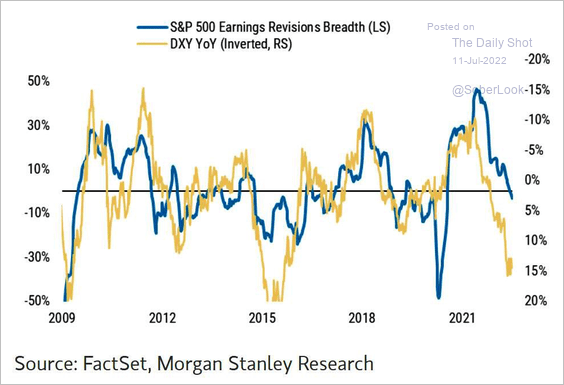 Source: Morgan Stanley Research
——————–
2. The market sees the current business cycle ending soon as Deutsche Bank’s “end of cycle” basket outperforms.
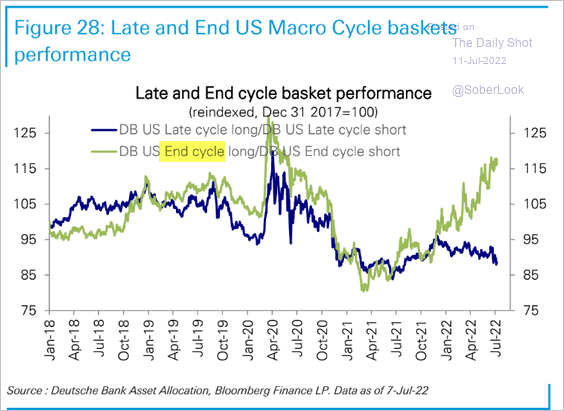 Source: Deutsche Bank Research
3. Is the fourth bear-market rally about to end?
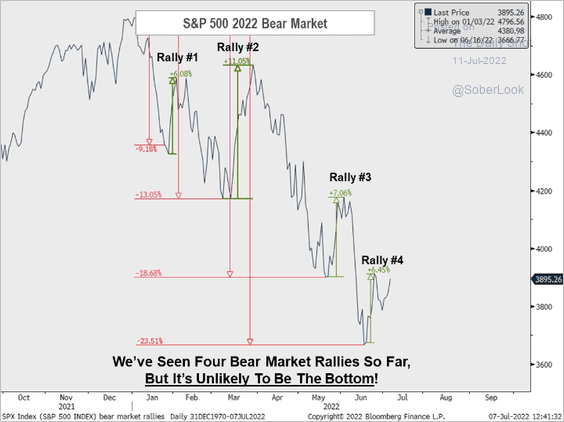 Source: Piper Sandler
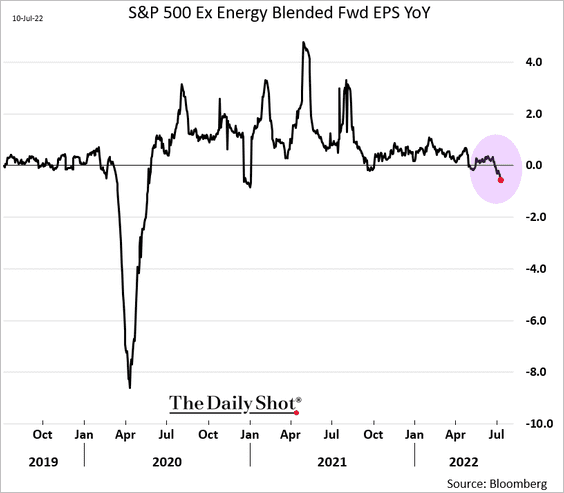
4. The pullback in earnings estimates has been modest so far.
But corporate guidance points to further deterioration.
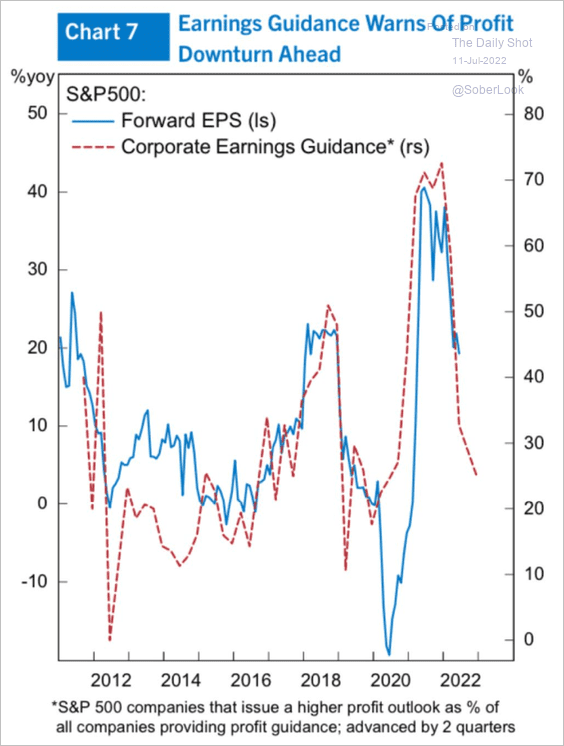 Source: Alpine Macro
——————–
5. This chart shows the cycles of US equity outperformance (EAFE = Europe, Australasia, and the Middle East).
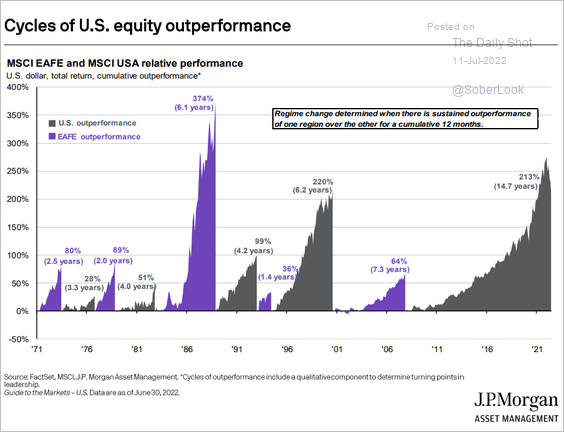 Source: J.P. Morgan Asset Management
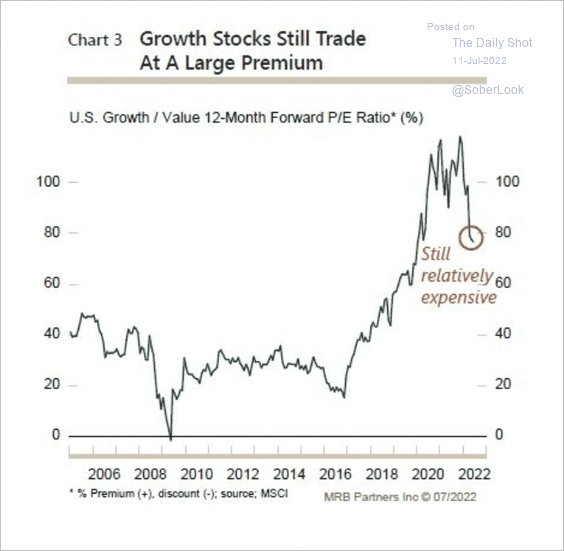
6. Growth stocks appear to be oversold, but valuations are still stretched (2 charts).
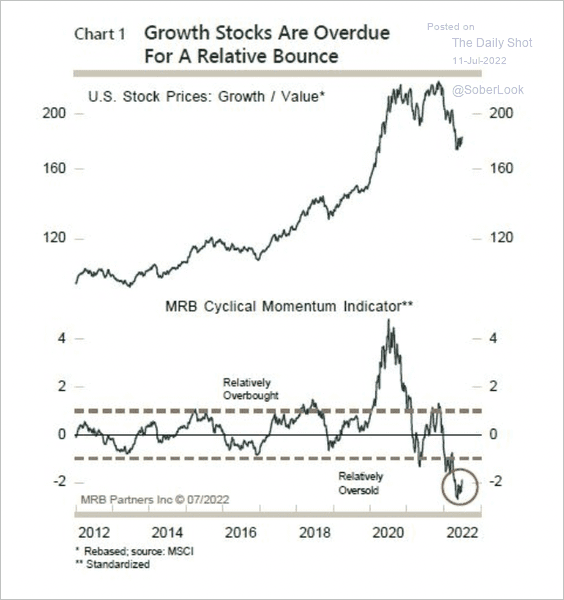 Source: MRB Partners
 Source: MRB Partners
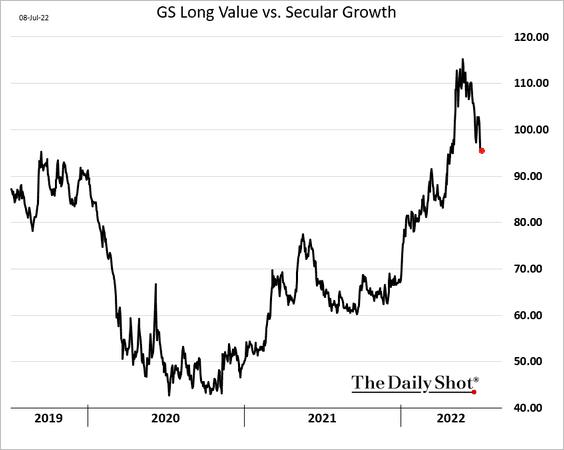
Here is Goldman’s value vs. secular growth index.
——————–
7. The stock-bond correlation could return if inflation were to accelerate, according to PGM Global.
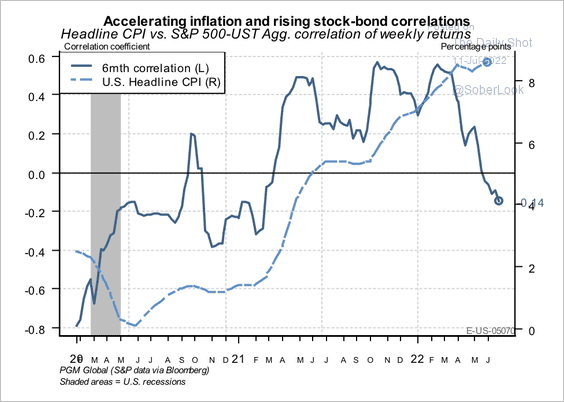 Source: PGM Global
This chart shows 12-month and 5-year rolling stock-bond correlations. The last time correlations rose along with inflation was in the 1970s.
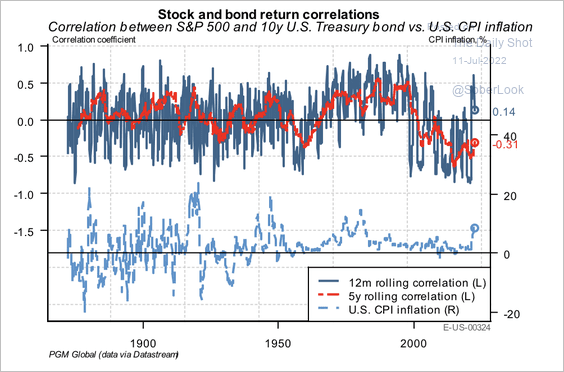 Source: PGM Global
During inflationary periods, stock valuations tend to contract because the Fed raises rates. However, this can be offset by relatively greater earnings expansion, which could produce positive returns for stocks in rate-hike cycles.
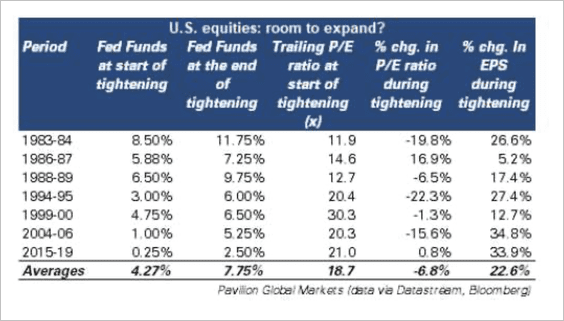 Source: PGM Global
——————–
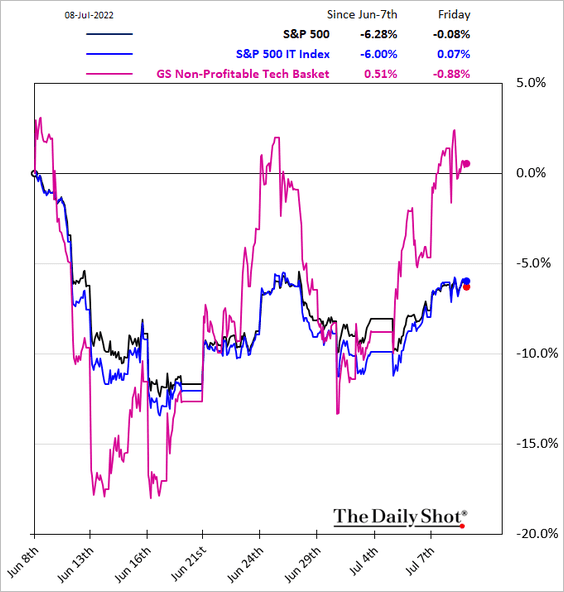
8. Speculative tech stocks have outperformed the broader market this month.
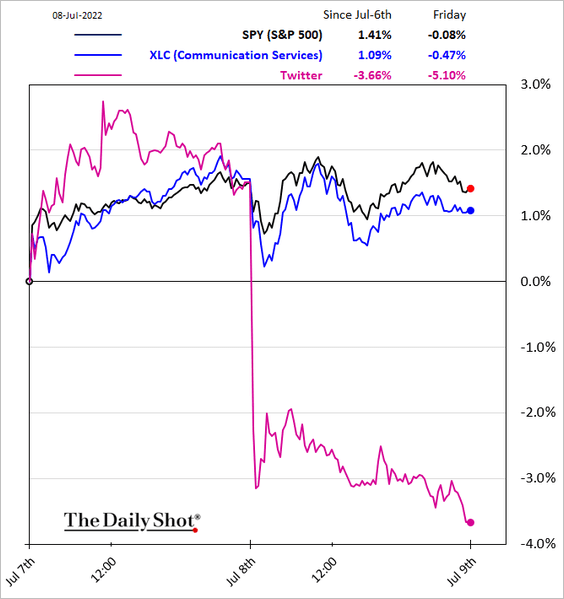
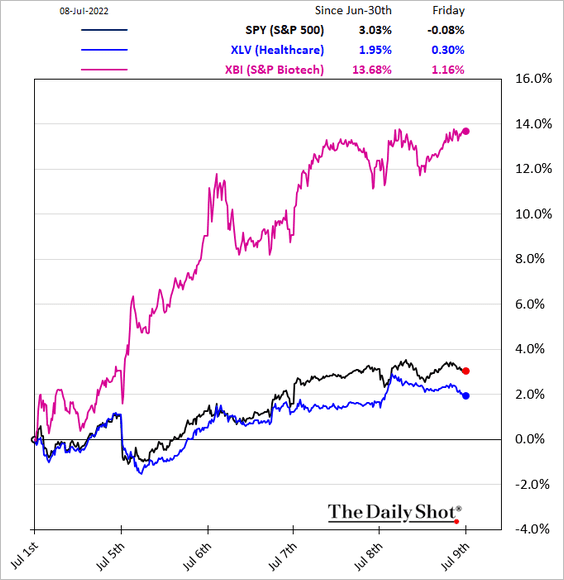
9. Next, we have a couple of sector performance charts.
• Twitter pulled down the Communication Services index on Friday.
• Biotech shares have been surging on M&A activity.
——————–
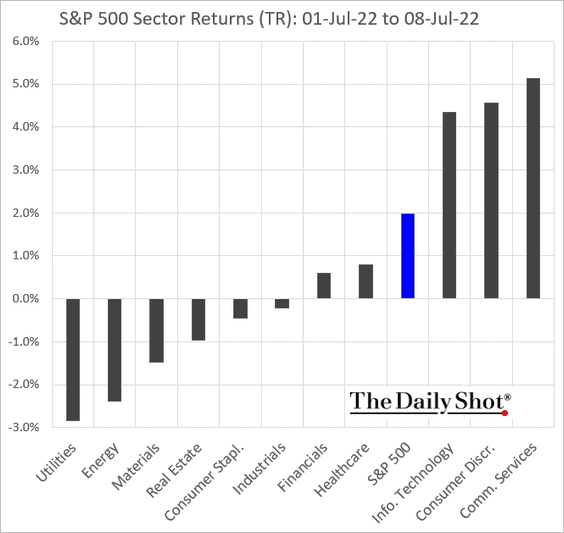
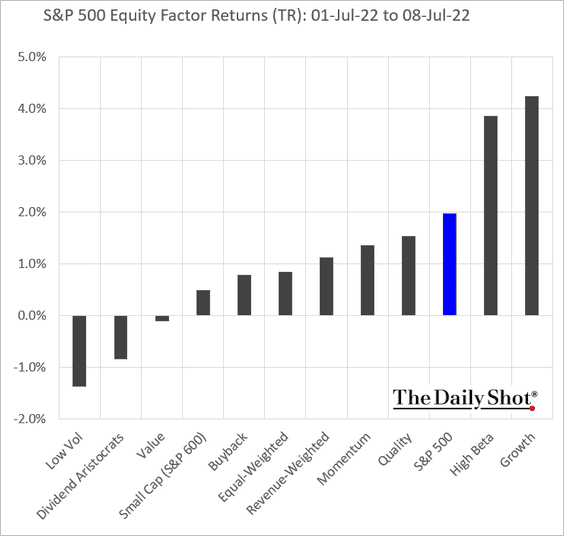
10. Finally, we have some performance data from last week.
• Sectors:
• Equity factors:
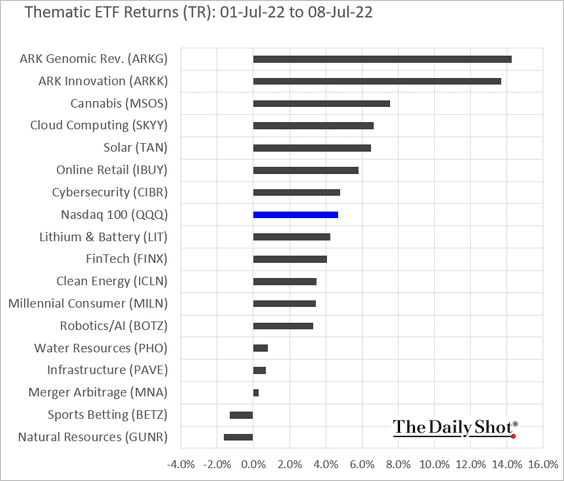
• Thematic ETFs:
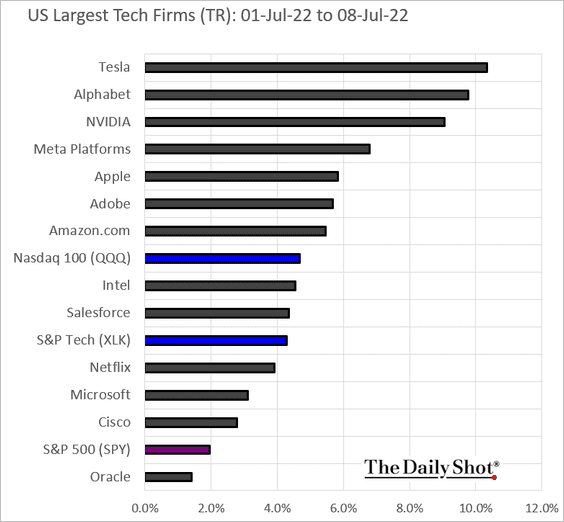
• Largest tech firms:
Back to Index
Alternatives
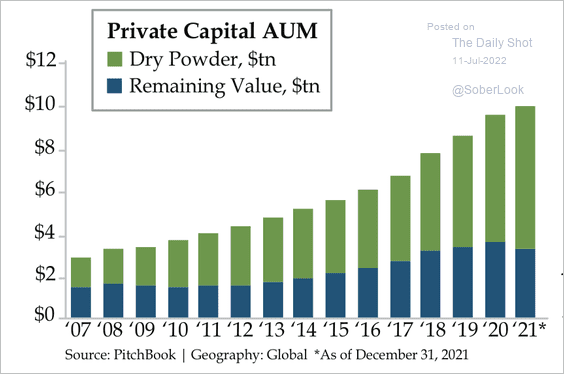
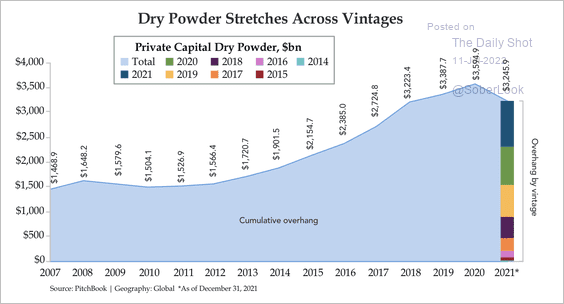
1. There is still a large amount of dry powder in private markets (2 charts).
 Source: Quill Intelligence
 Source: Quill Intelligence
——————–
2. There has been a large increase in deal size over the past year, commanding high valuations.
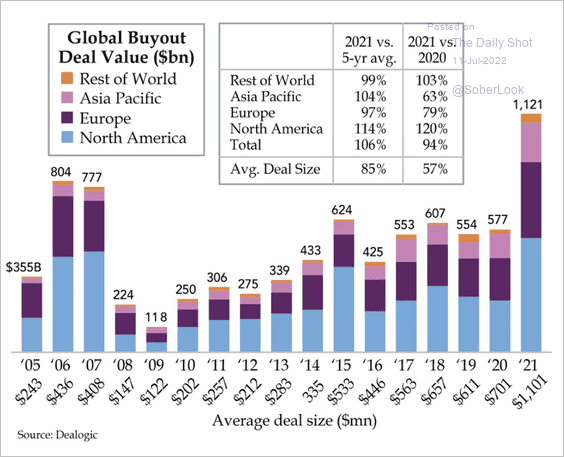 Source: Quill Intelligence
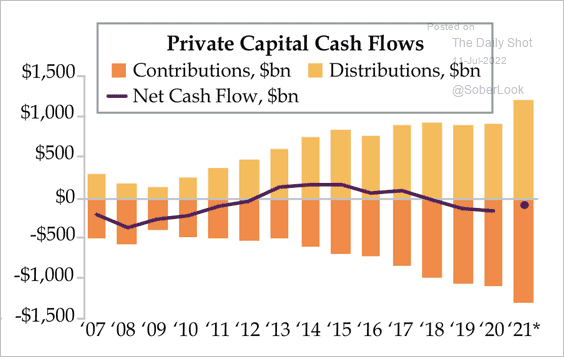
3. Net capital cash flow in private markets has turned negative over the past few years.
 Source: Quill Intelligence
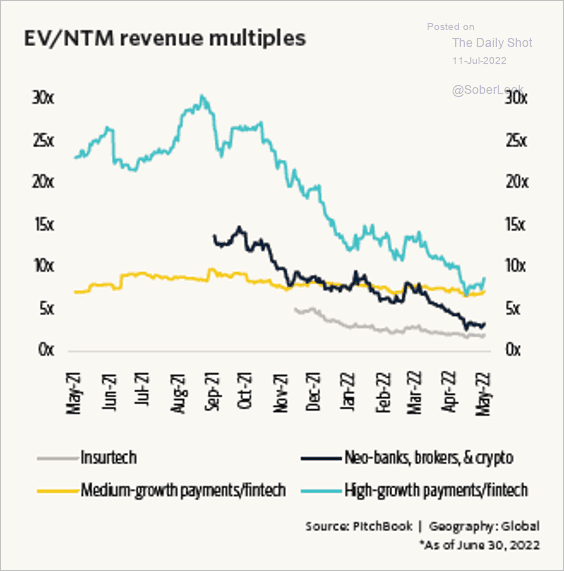
4. Valuations of privately held fintech companies have been compressed.
 Source: PitchBook
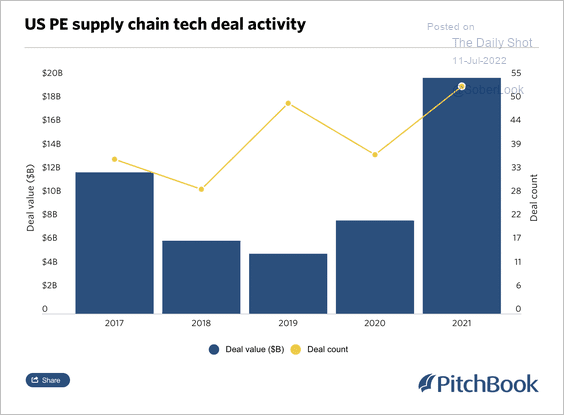
5. There has been a steady rise in US private equity deal value in supply chain technology.
 Source: PitchBook Read full article
6. VC funding slowed in Q2.
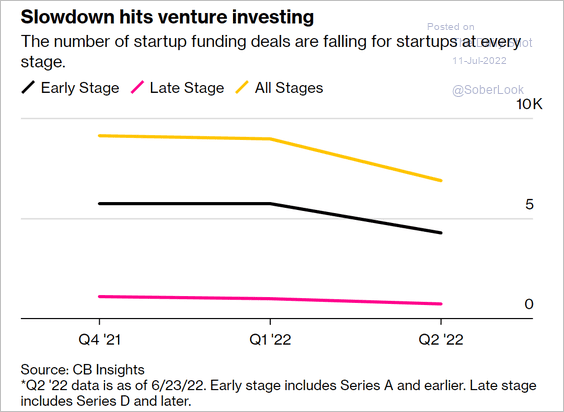 Source: Bloomberg Read full article
7. The next two charts show the VC industry’s ownership of unicorns.
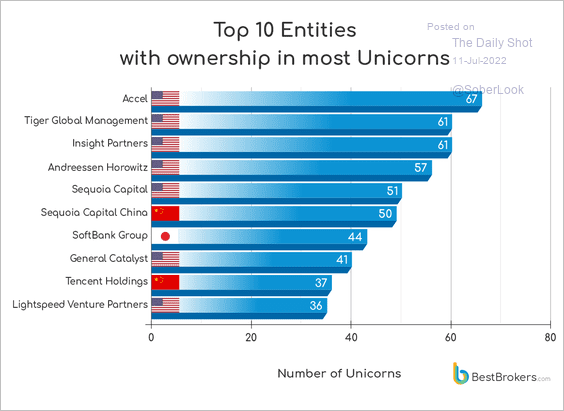 Source: Best Brokers
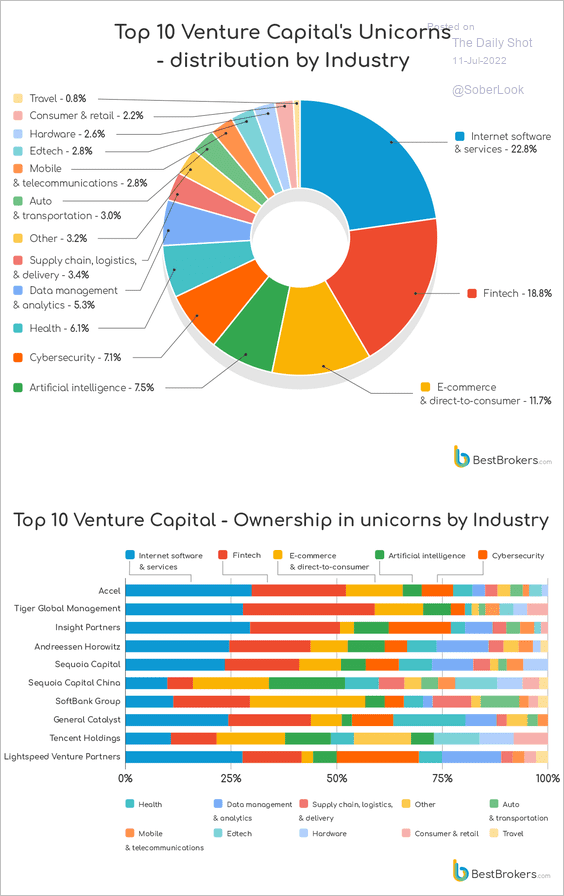 Source: Best Brokers
——————–
8. Equity long/short funds have dominated new launches over the past 18 months, mostly in North America.
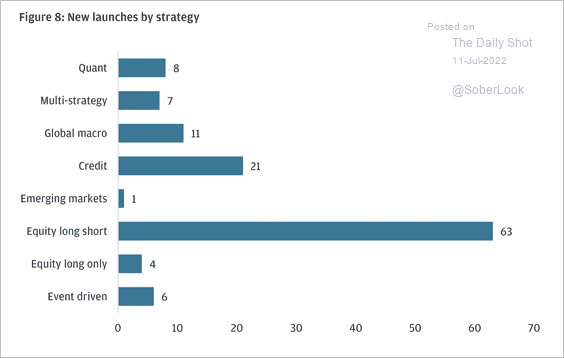 Source: JPMorgan Capital Advisory
Here is a breakdown of average management fees by sector.
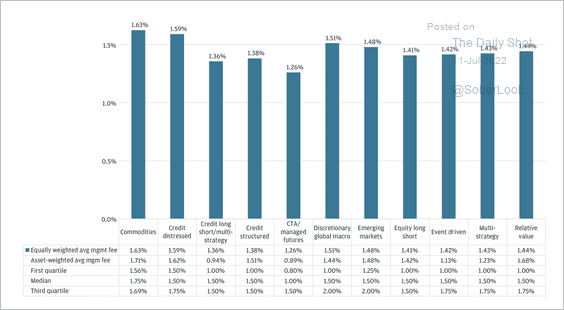 Source: JPMorgan Capital Advisory
The average hedge fund management fee has declined over the past decade.
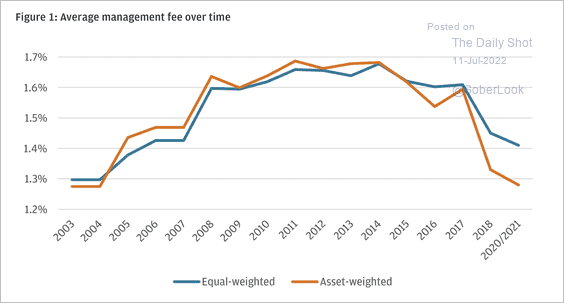 Source: JPMorgan Capital Advisory
Performance fees are also lower.
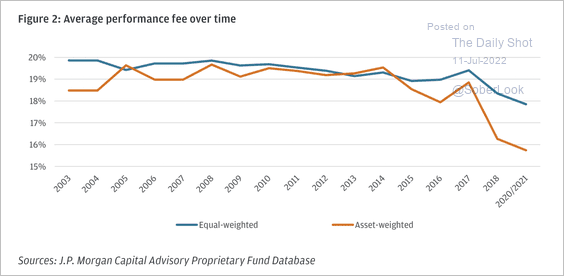 Source: JPMorgan Capital Advisory
And this chart shows average performance fees by sector. CTAs/managed futures have faced the most persistent downward pressure on performance fees, driven by some of the largest funds not charging a performance fee, according to JPMorgan.
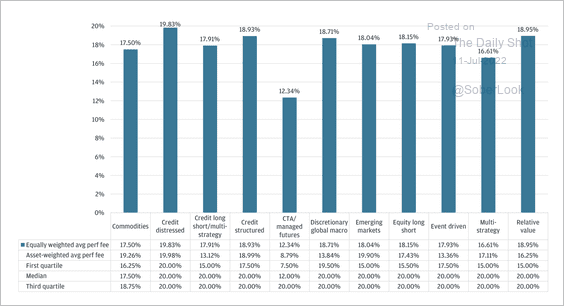 Source: JPMorgan Capital Advisory
——————–
9. Pension plans are allocating more to alternatives, …
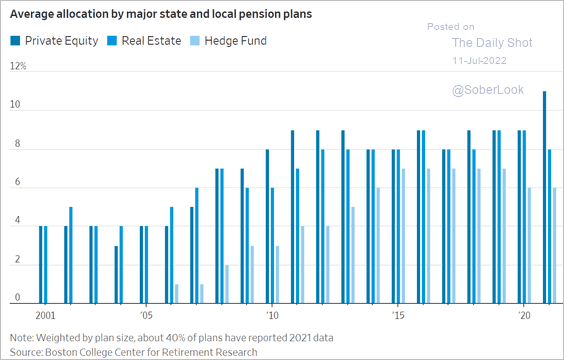 Source: @WSJ Read full article
… with some pensions leveraging their investments.
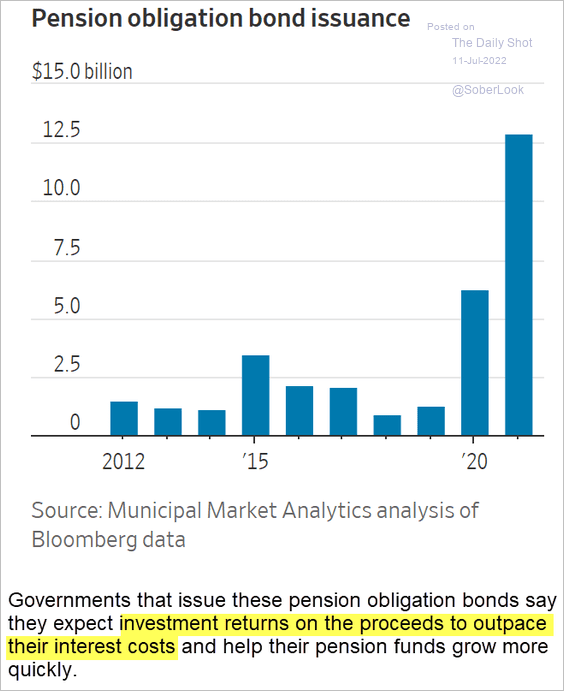 Source: @WSJ Read full article
Back to Index
Credit
1. US corporate debt has been outperforming Eurozone bonds (chart shows the difference in spreads).
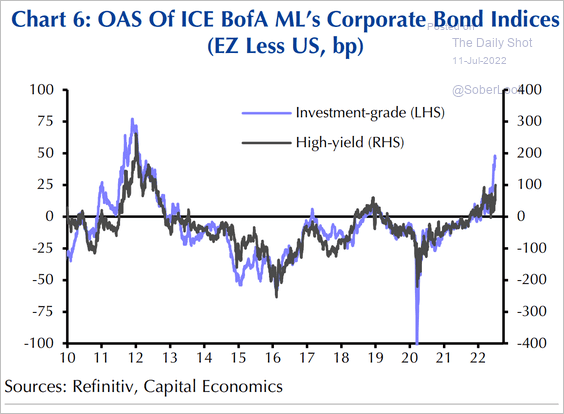 Source: Capital Economics
Here are cumulative fund flows.
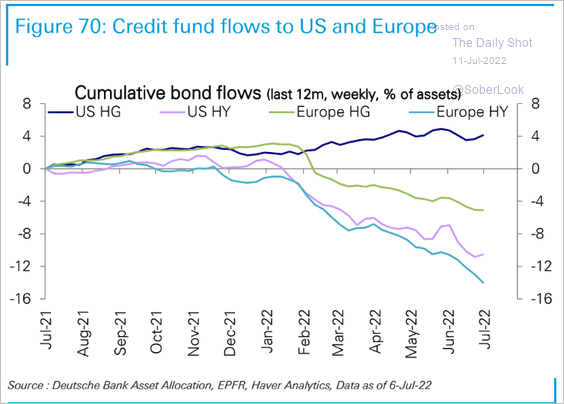 Source: Deutsche Bank Research
——————–
2. CCC bonds have been underperforming.
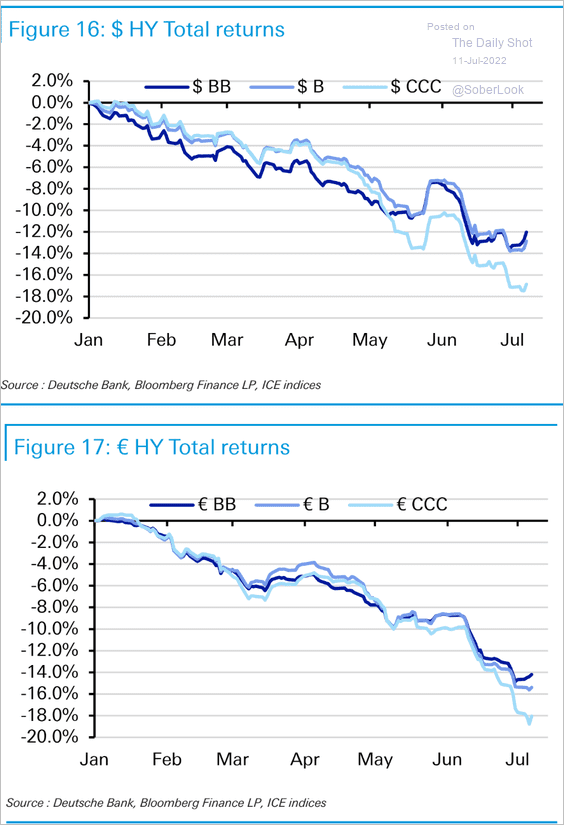 Source: Deutsche Bank Research
3. New corporate bond issuance has slowed sharply (4 charts).
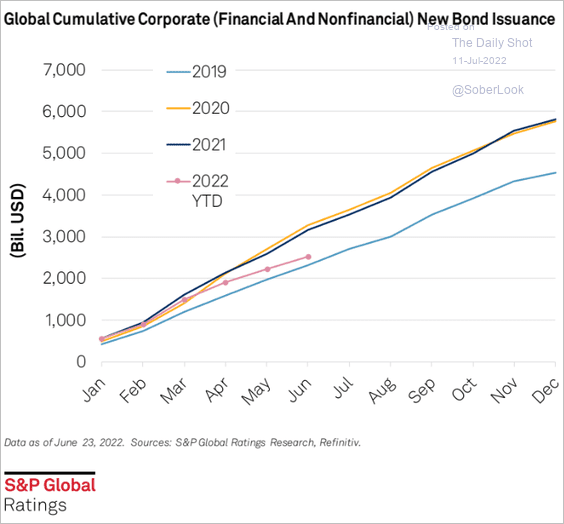 Source: S&P Global Ratings
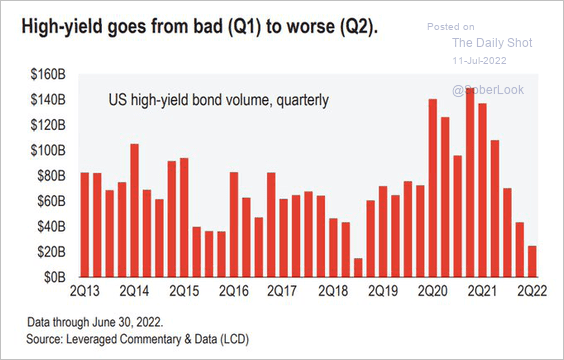 Source: @lcdnews
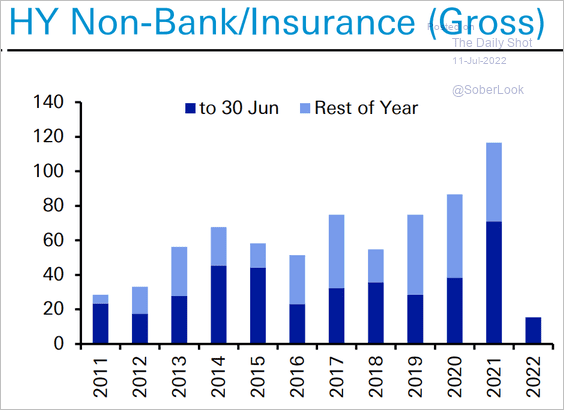 Source: Deutsche Bank Research
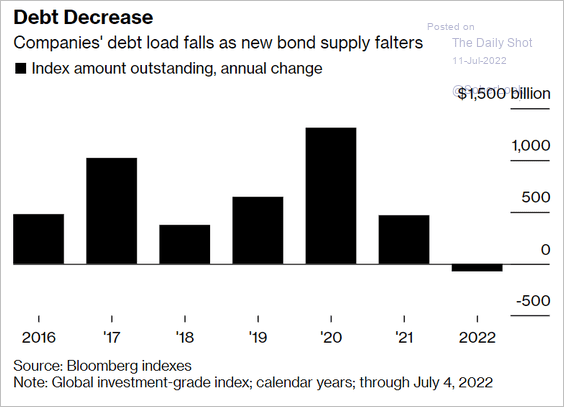 Source: Bloomberg Read full article
——————–
4. Muni debt looks attractive.
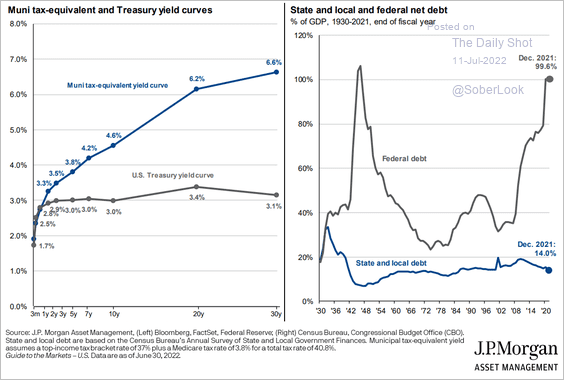 Source: J.P. Morgan Asset Management
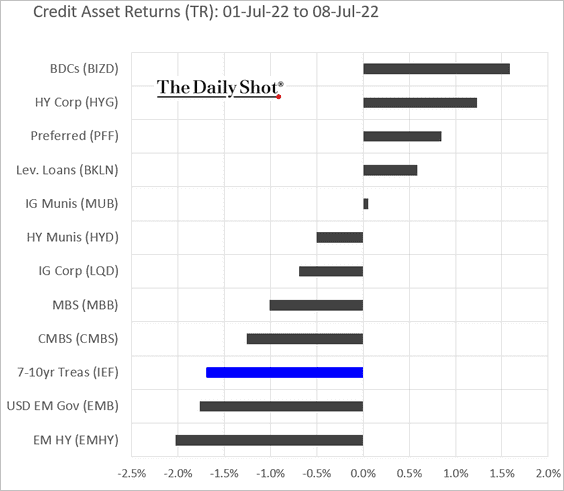
5. Finally, we have last week’s performance by asset class.
Back to Index
Rates
1. Is the rally in yields taking another pause?
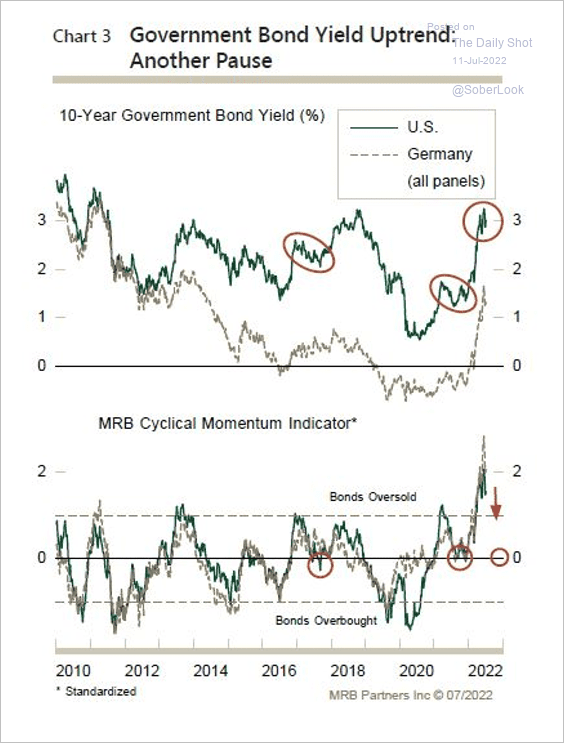 Source: MRB Partners
2. Bond funds saw substantial inflows last week.
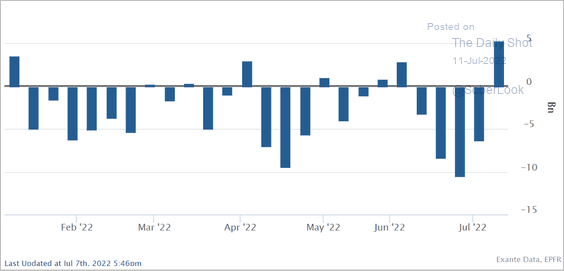 Source: @jnordvig, @ExanteData
3. The US yield curve is currently inverted. But the market no longer sees the curve inverted one year out. Is it pricing a rebound in economic activity?
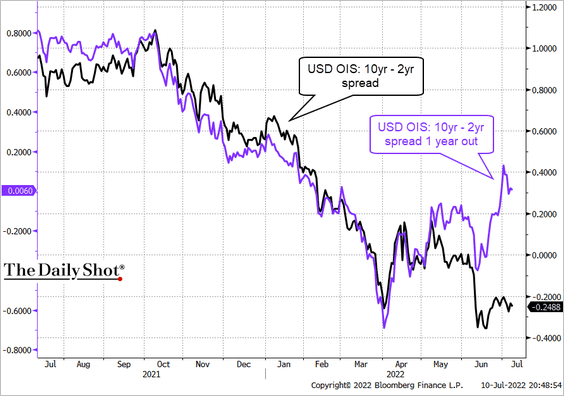 Source: @TheTerminal, Bloomberg Finance L.P., h/t @Marcomadness2
Back to Index
Global Developments
1. Central banks’ balance sheets are expected to shrink.
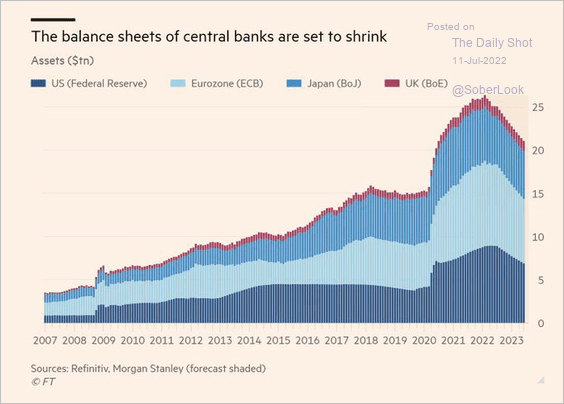 Source: @colbyLsmith, @katie_martin_fx Read full article
2. Supply chain pressures have been easing but are a long way from normalizing.
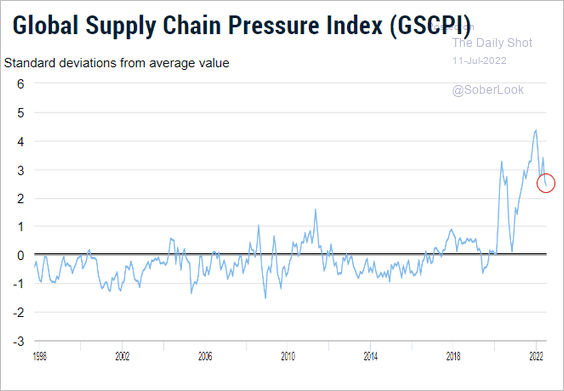 Source: NY Fed
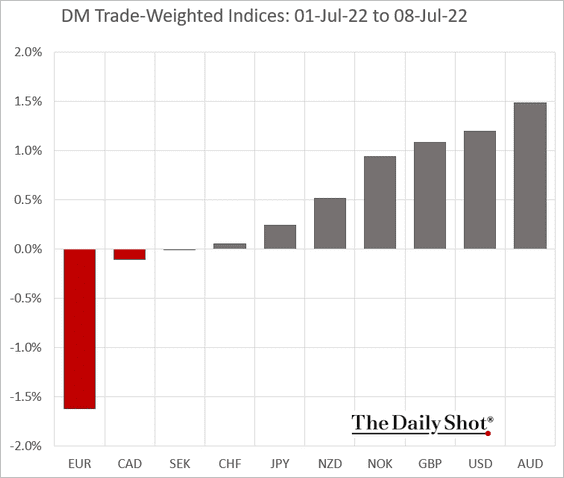
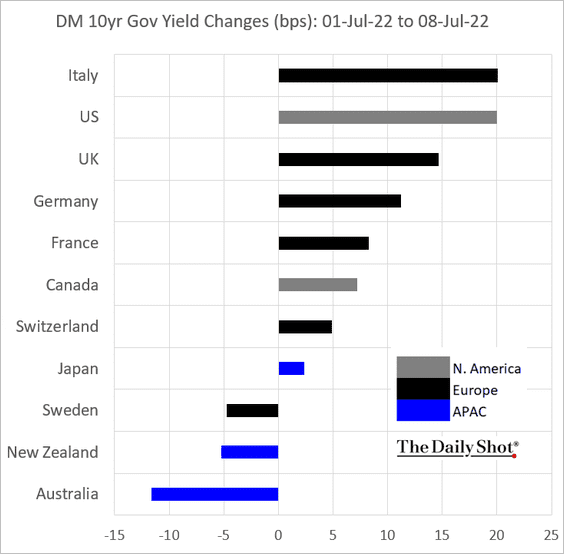
3. Next, we have some performance data from last week for advanced economies.
• Trade-weighted currency indices:
• Sovereign bond yields:
——————–
Food for Thought
1. Skills emphasized in CEO job listings:
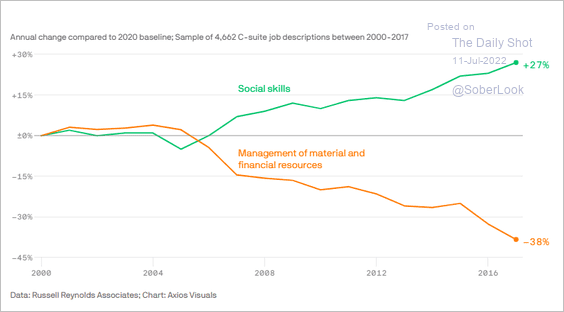 Source: @axios Read full article
2. Childcare costs:
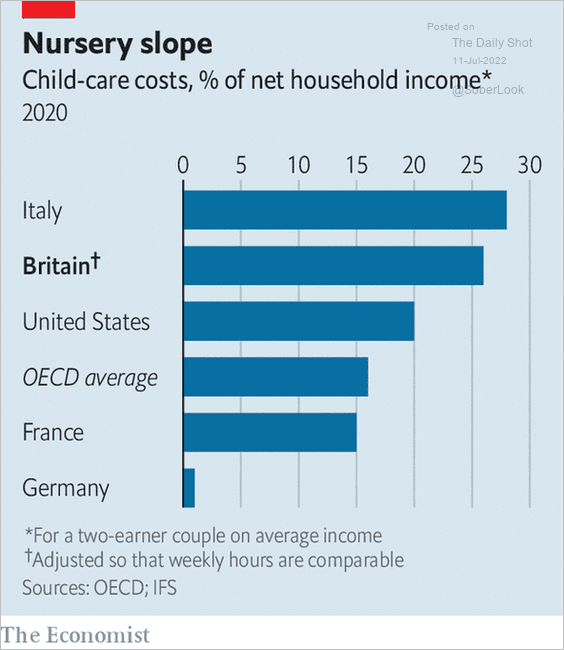 Source: @AlexSelbyB Read full article
3. Trade among high-income countries:
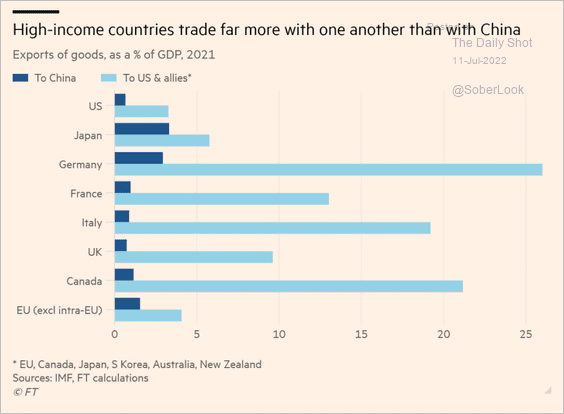 Source: @financialtimes Read full article
4. US young men and women identifying as liberal:
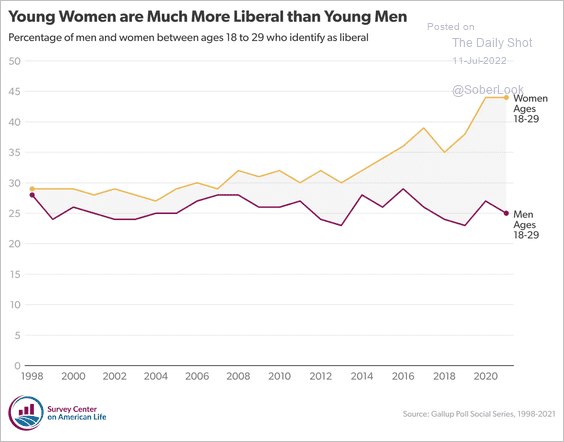 Source: American Storylines Read full article
5. Life expectancy over time in select countries:
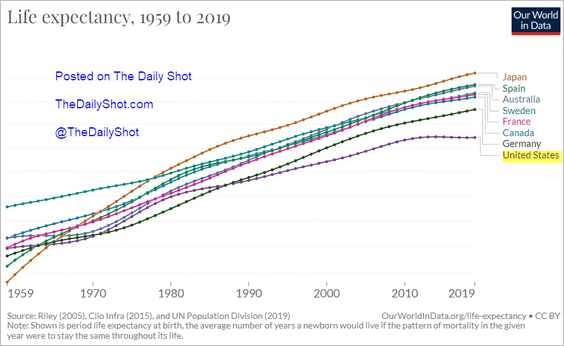 Source: Our World In Data
6. Enslaved population in 1860:
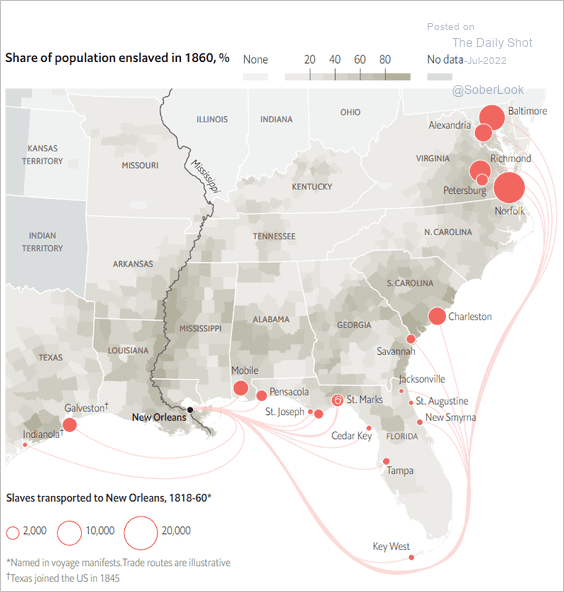 Source: The Economist Read full article
7. A map of the observable universe:
 Source: Visual Capitalist Read full article
——————–
Back to Index