
The Daily Shot: 28-Jul-22
• The United States
• The United Kingdom
• The Eurozone
• Asia – Pacific
• China
• Emerging Markets
• Commodities
• Energy
• Equities
• Rates
• Global Developments
• Food for Thought
The United States
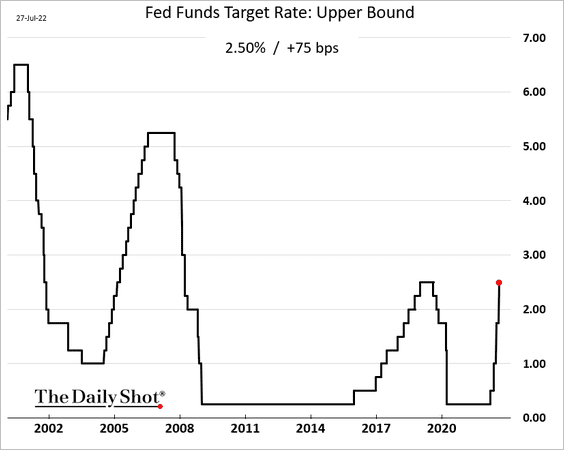
1. As expected, the Fed raised rates by 75 bps.
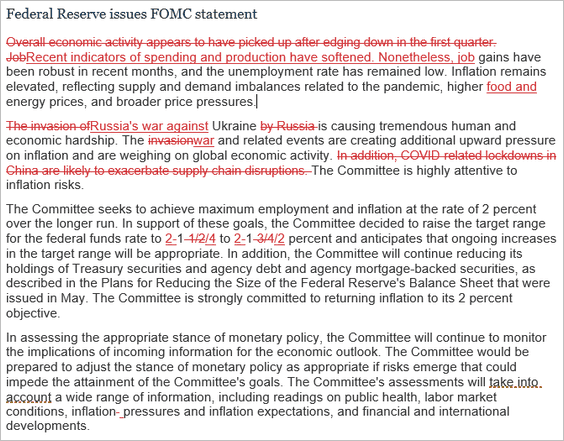
The FOMC acknowledged the recent loss of economic momentum.
 Source: @GregDaco, @EY_US Read full article
Powell did not signal any shifts in the central bank’s inflation battle.
… we would get to a moderately restrictive level by the end of this year, by which I mean somewhere between 3 and 3.5 percent, and … the committee sees further rate increases in 2023.
The FOMC wants to keep economic growth below its potential for a while in order to cool inflationary pressures.
We actually think we need a period of growth below potential in order to create some slack.
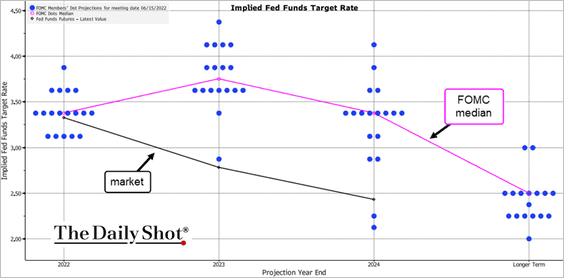
As far as guidance, the Fed Chair pointed to the June dot plot.
… the best data-the only data point I have for you is the June SEP, which, I think, is just the most recent thing that the committee has done. Since then, inflation has come in higher. Economic activity has come in weaker than expected.
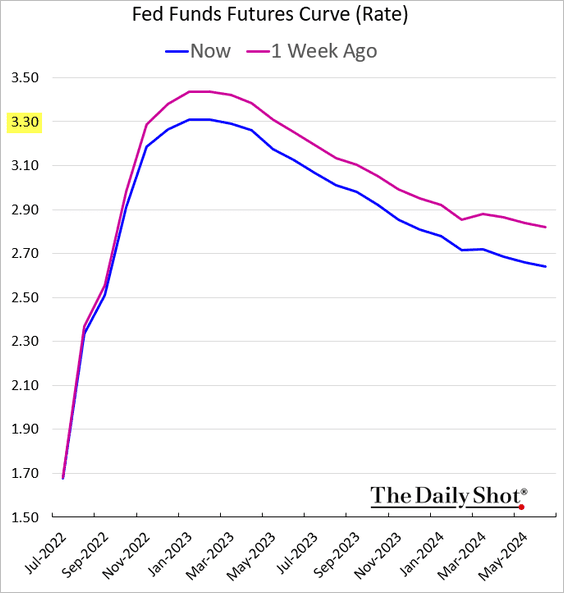
The market interpreted Powell’s comments as being a bit on a dovish side, with hopes rising that the economic slowdown will force the Fed to pause (even though there is little evidence of that from the comments). Market pricing is now well below the FOMC’s dot plot – a trajectory that looks too dovish, given the broad and entrenched inflationary pressures.
 Source: @TheTerminal, Bloomberg Finance L.P.
• The market still sees a 50 bps rate hike in September, with a 36% chance of a 75 bps hike.
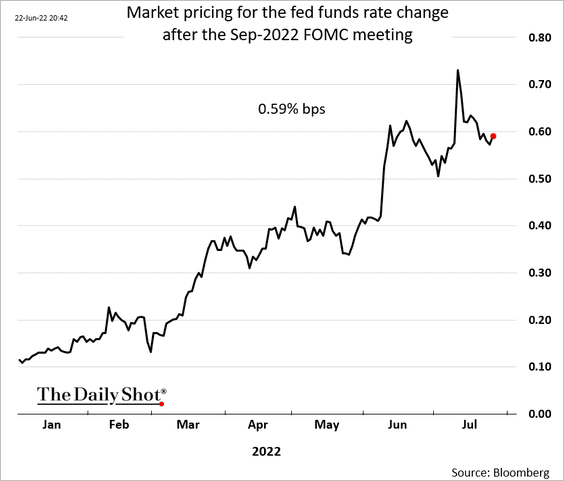
But the year-end pricing is dropping toward 3.3%.
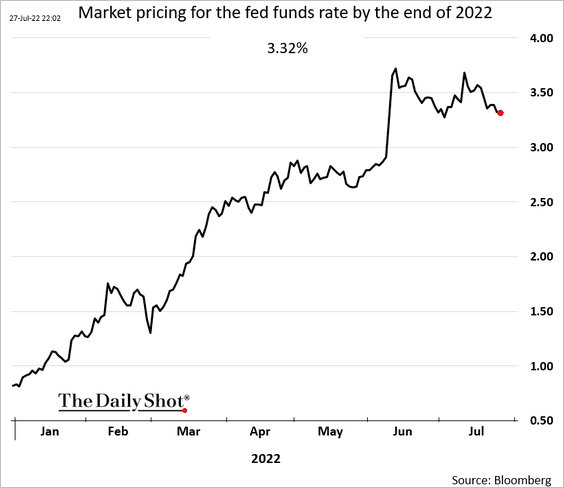
And that’s it. The market expects the US central bank to be done hiking by the end of 2022.
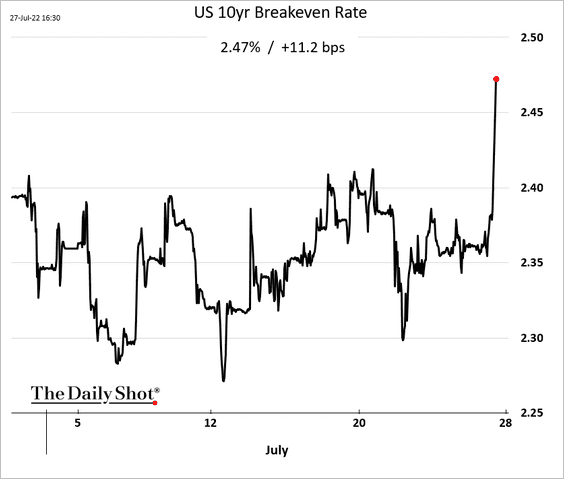
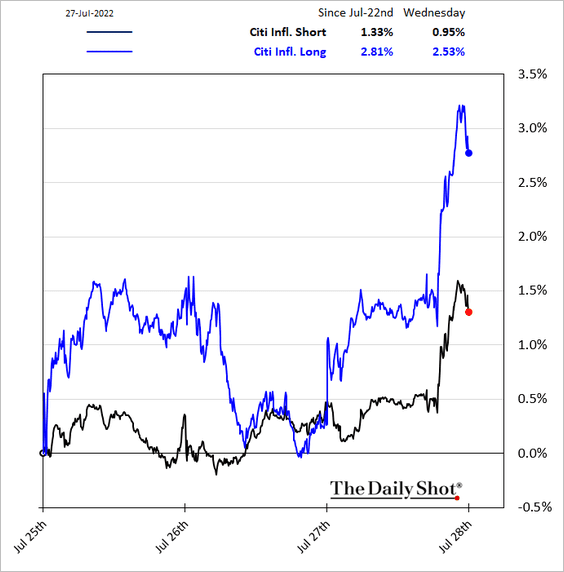
• Inflation expectations jumped in response to the supposedly “friendlier” Federal Reserve.
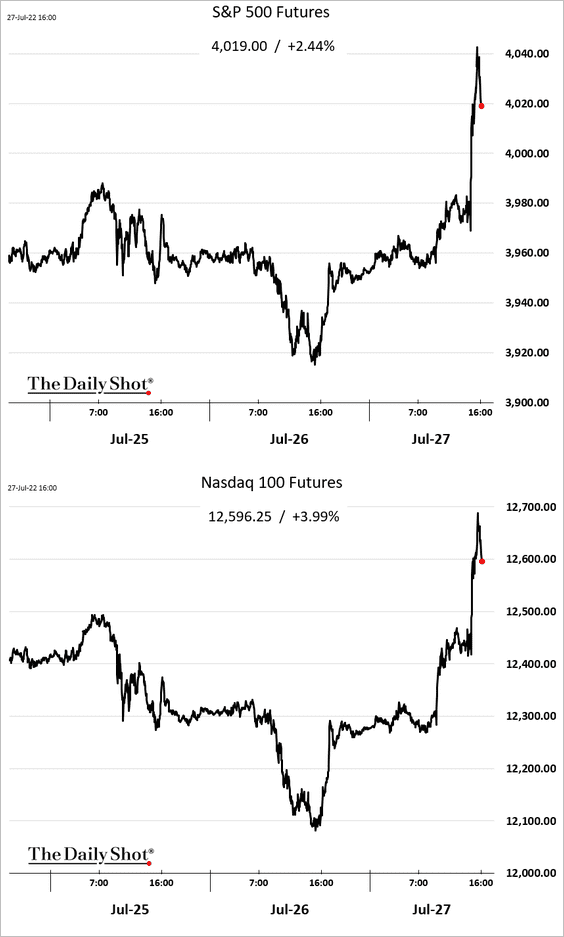
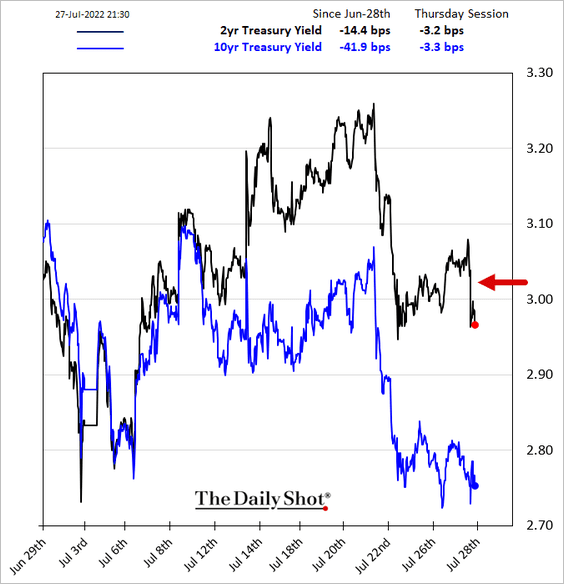
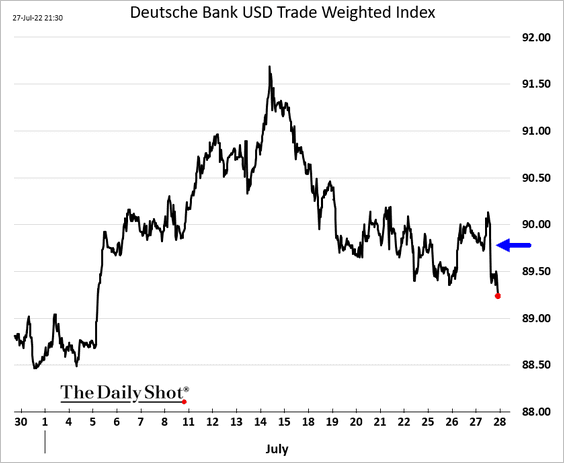
• Here are some additional market reactions.
– Equities:
– Treasury yields:
– The US dollar:
——————–
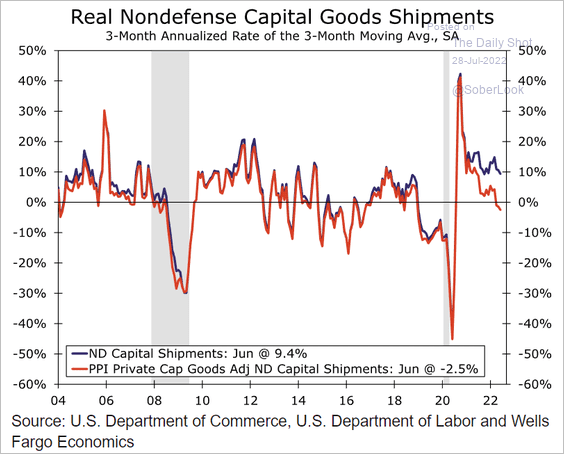
2. Durable goods orders were better than expected in June.
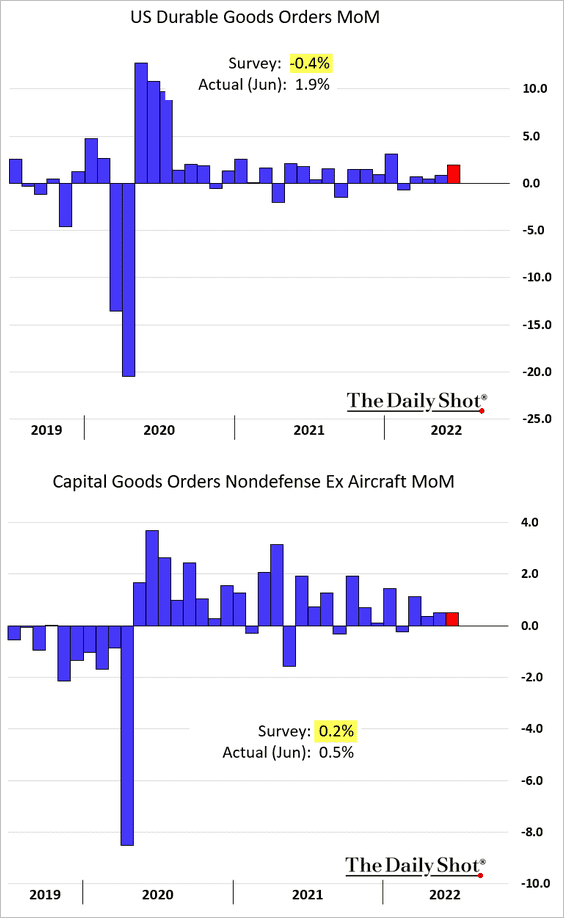
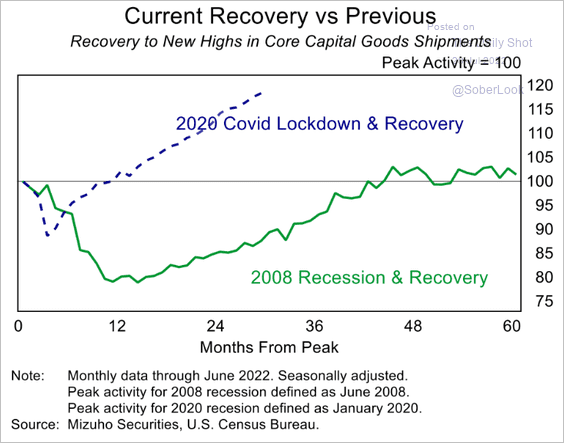
Capital goods shipments have been exceptionally strong, pointing to robust business investment.
 Source: Mizuho Securities USA
However, adjusted for inflation, capital goods shipments are now declining.
 Source: Wells Fargo Securities
——————–
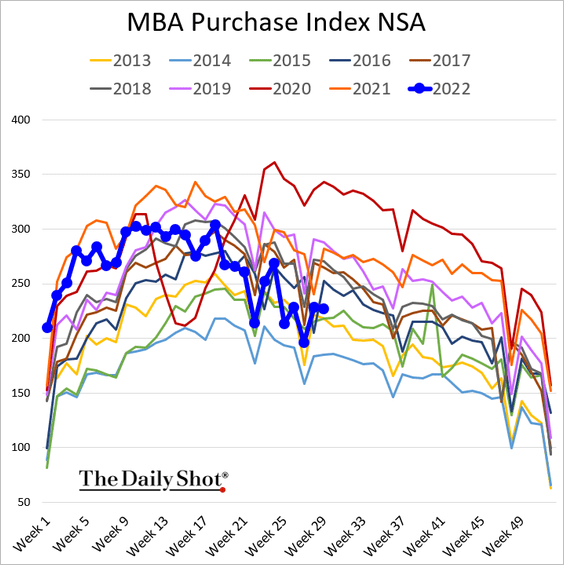
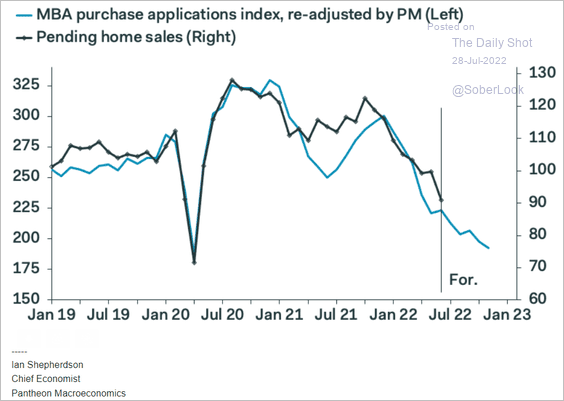
3. Next, we have some updates on the housing market.
• Mortgage applications remain soft, running well below 2016 levels.
• June pending home sales were 20% below last year’s levels. The second panel shows the year-over-year changes.
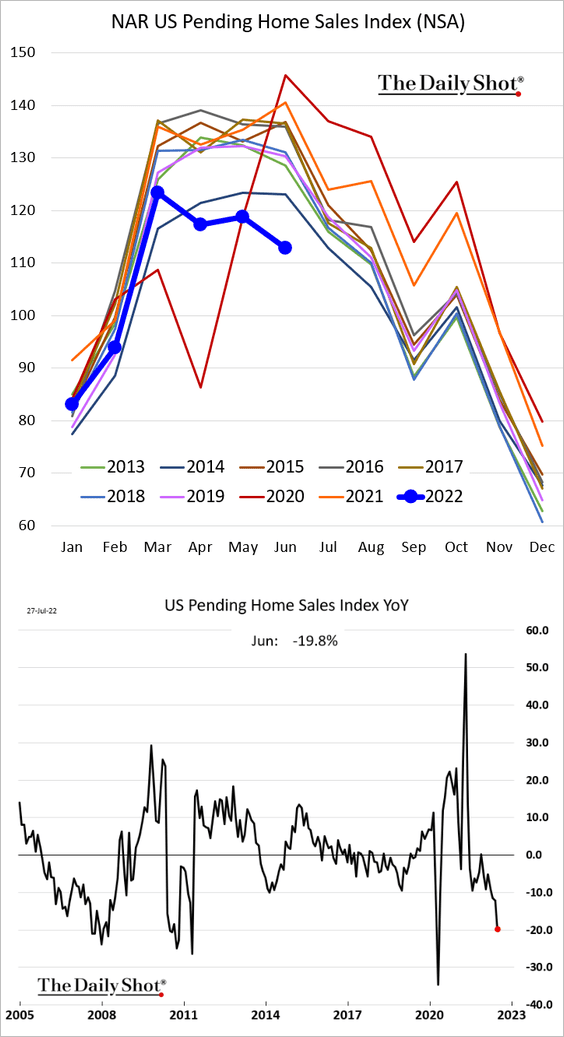
And given the weakness in mortgage applications, we should expect further declines.
 Source: Pantheon Macroeconomics
• Housing valuations look rich relative to rent.
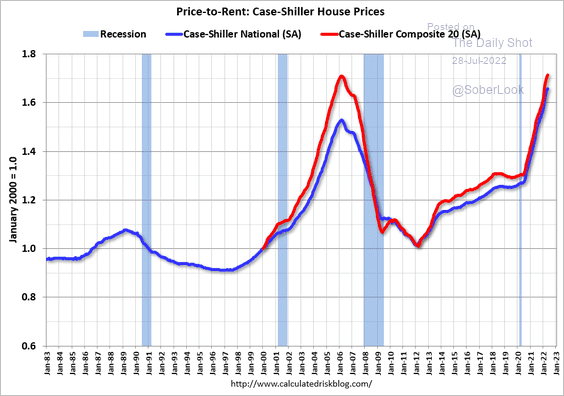 Source: Calculated Risk
• Housing supply growth slowed relative to household formation after the 2008 financial crisis.
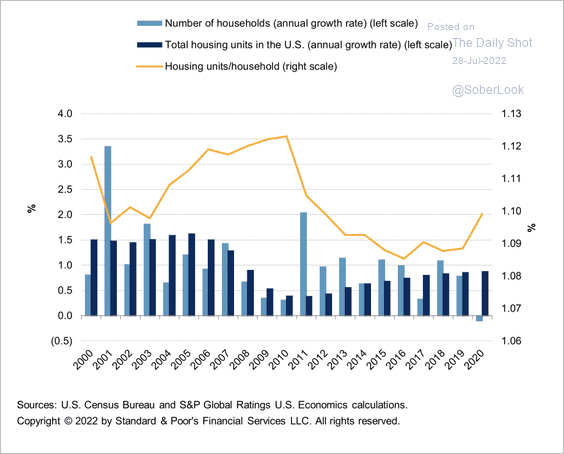 Source: S&P Global Ratings
——————–
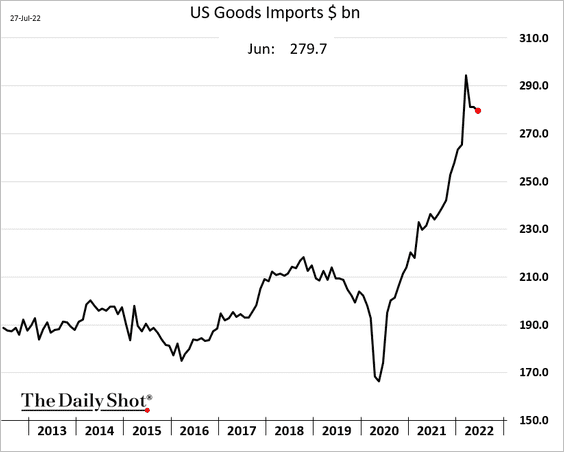
4. The trade deficit shrank more than expected in June, …
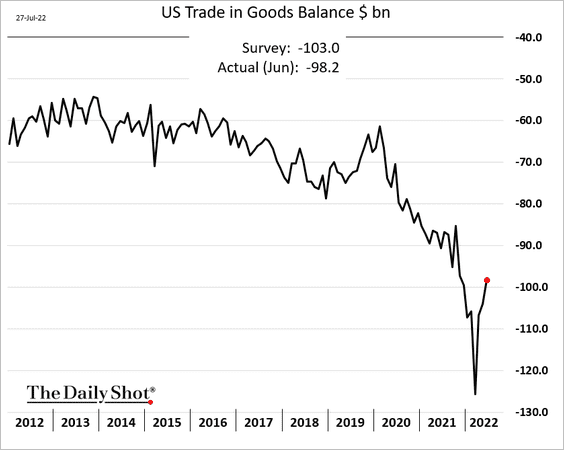
… as imports eased.
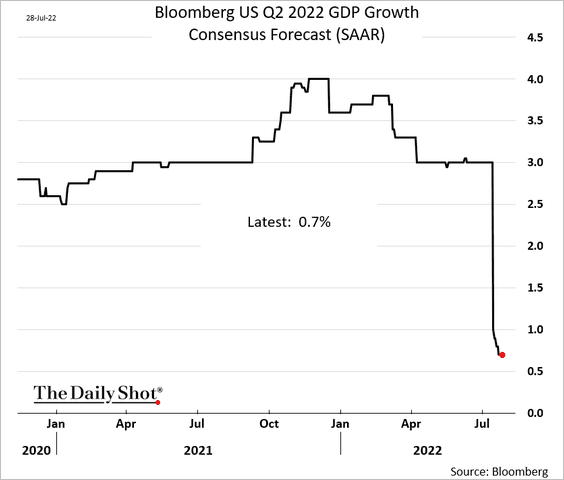
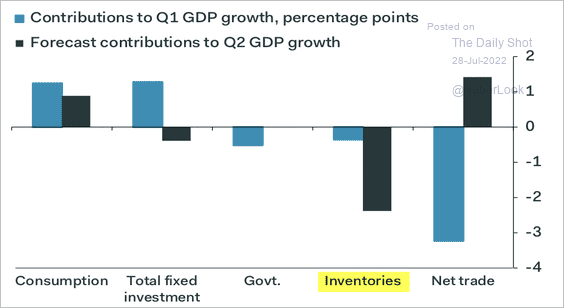
5. A smaller trade deficit gave the GDPNow Q2 growth estimate a boost. But the Atlanta Fed’s model still shows a contraction.
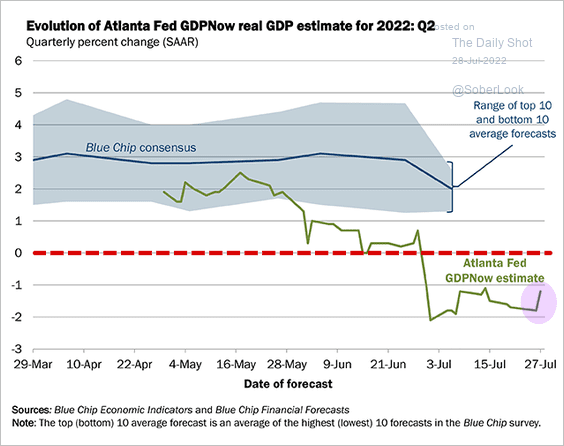 Source: @AtlantaFed
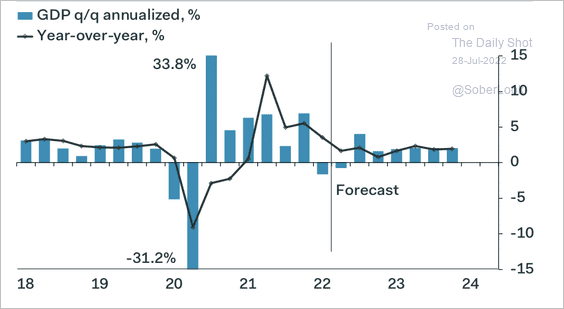
A possibility of a technical recession (second quarter of negative growth) is very real. The Q2 weakness was almost entirely driven by inventory adjustments. Here are some estimates.
• Consensus:
• Morgan Stanley (a very small increase):
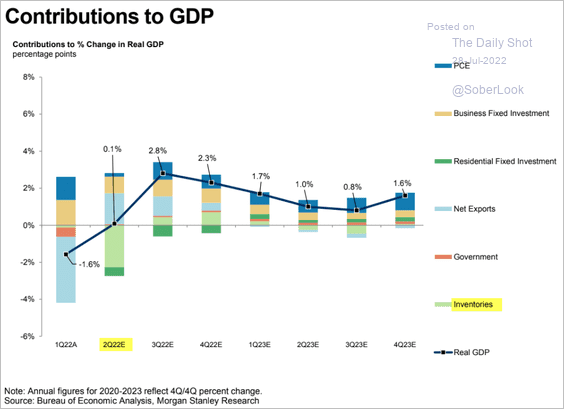 Source: Morgan Stanley Research
• Pantheon Macroeconomics (a small decline):
 Source: Pantheon Macroeconomics
 Source: Pantheon Macroeconomics
——————–
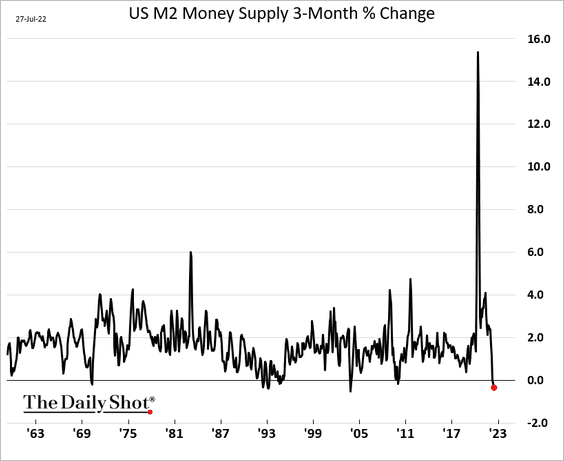
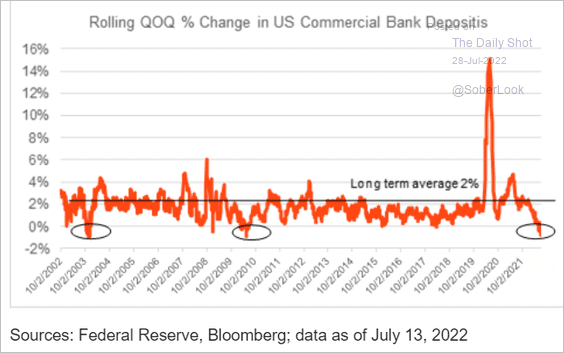
6. We continue to see contracting liquidity in the US, which will remain a headwind for growth and should put downward pressure on inflation (with a substantial lag).
 Source: BlackRock Investment Institute
Back to Index
The United Kingdom
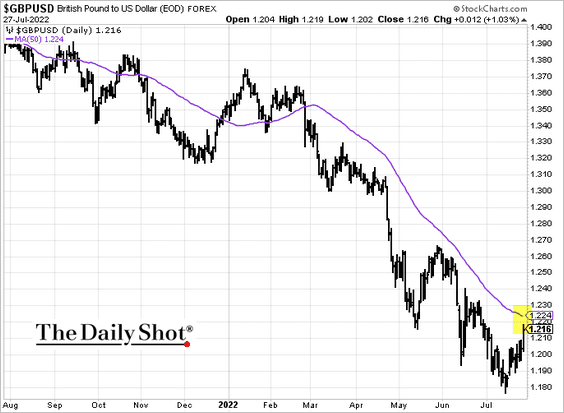
1. The pound is nearing its 50-day moving average.
2. This scatterplot shows UK job vacancies per unemployed worker vs. consumer confidence – a massive dislocation due to high inflation.
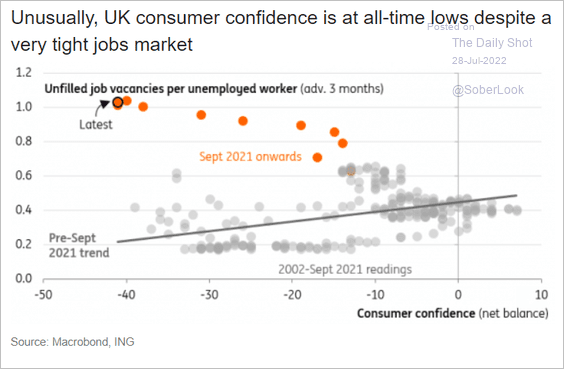 Source: ING
Back to Index
The Eurozone
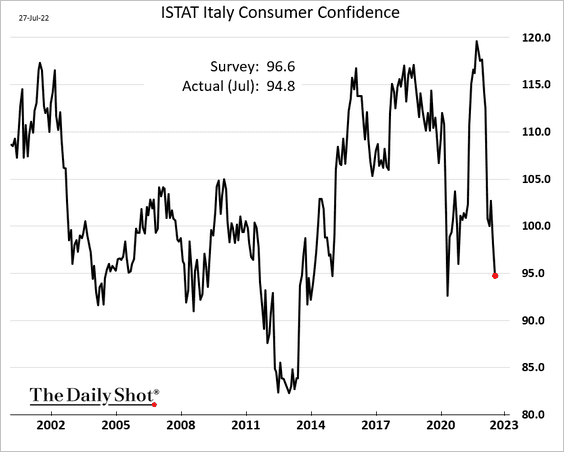
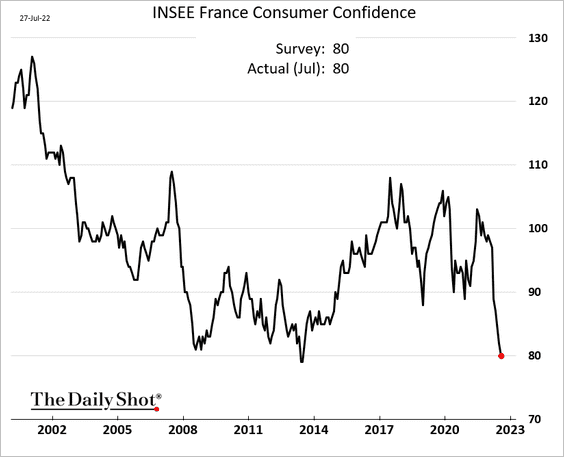
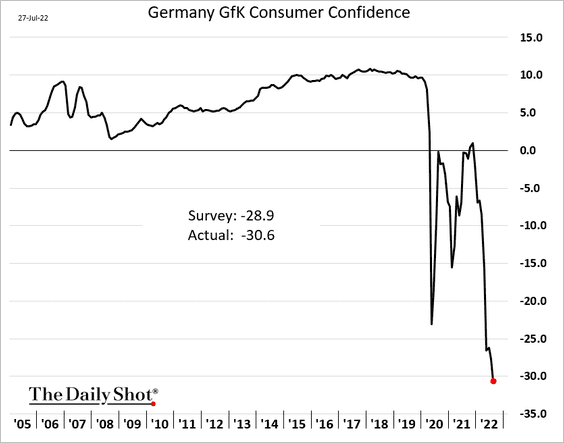
1. Consumer confidence continues to deteriorate.
• Italy:
• France:
• Germany:
——————–
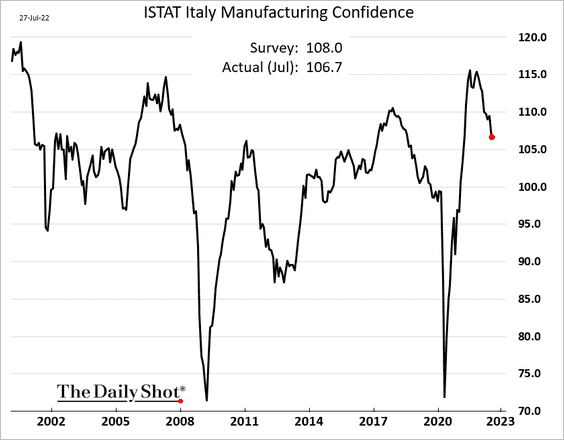
2. Italian manufacturing confidence is rolling over.
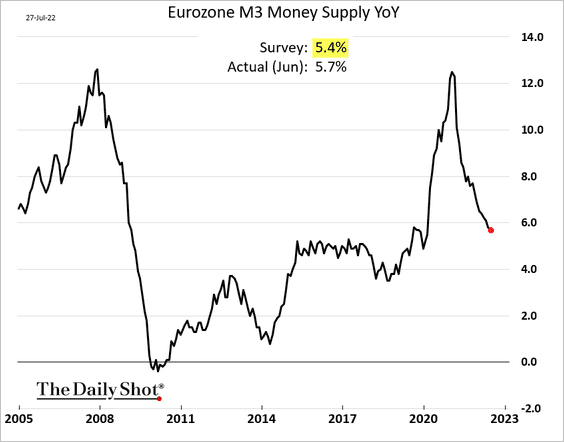
3. The growth slowdown in the broad money supply has paused.
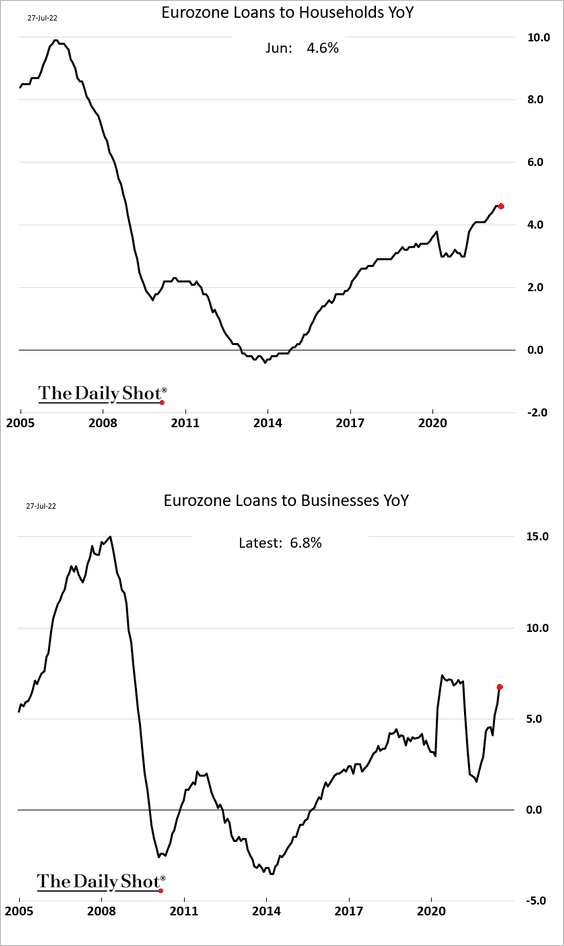
Loan growth has been trending higher.
——————–
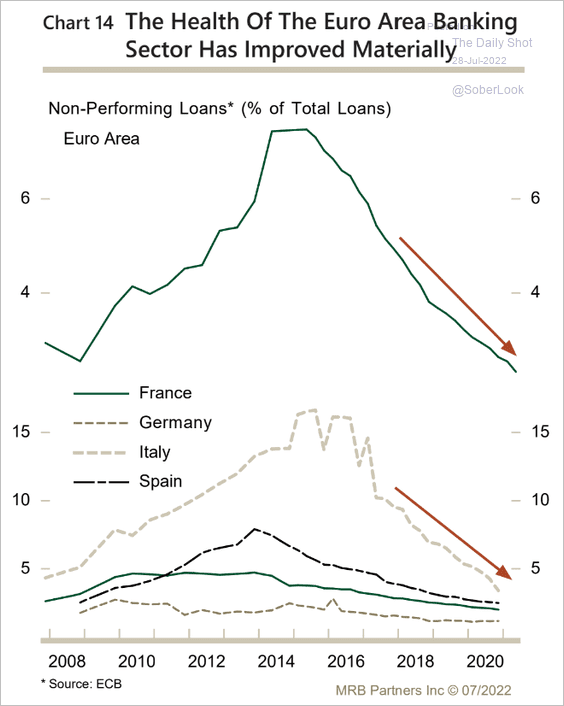
4. The banking system is relatively healthy.
 Source: MRB Partners
Back to Index
Asia – Pacific
1. Japan’s corporate credit spreads have been widening rapidly.
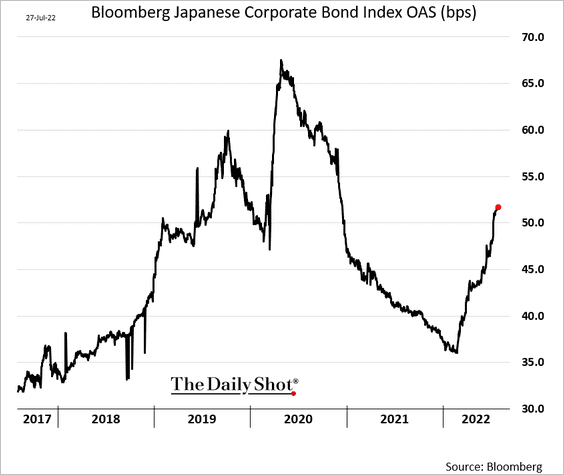 h/t @ayaitomisawa Read full article
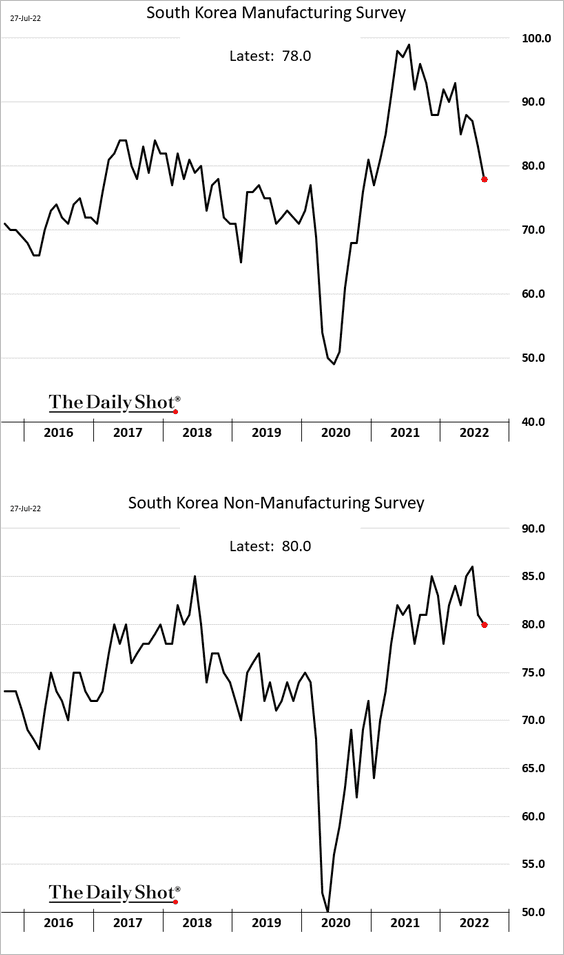
2. South Korea’s manufacturing growth is slowing.
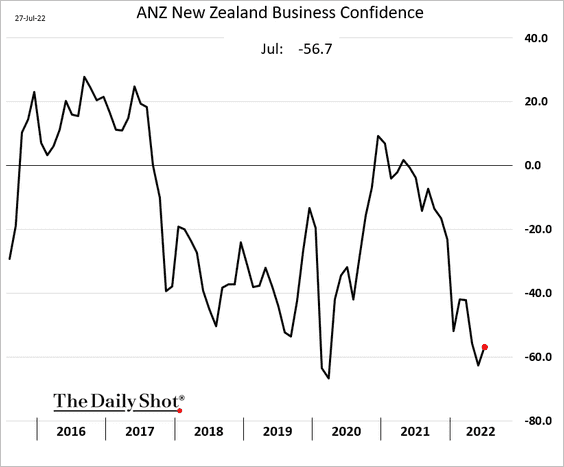
3. New Zealand’s business confidence has stabilized.
The nation’s residential construction sector is under pressure.
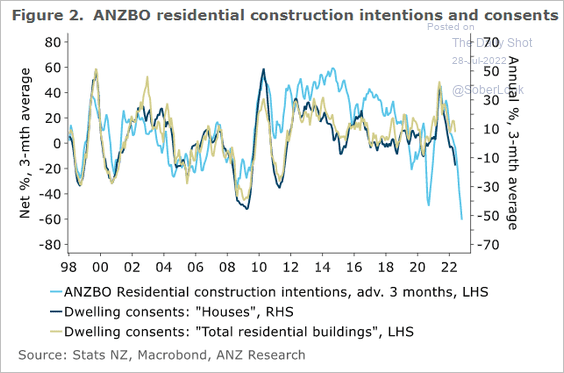 Source: @ANZ_Research
——————–
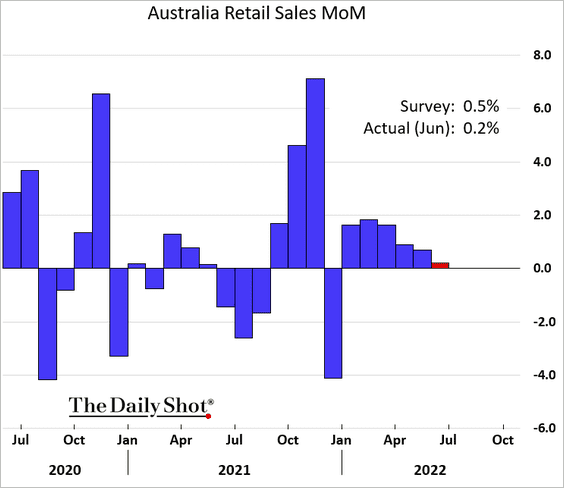
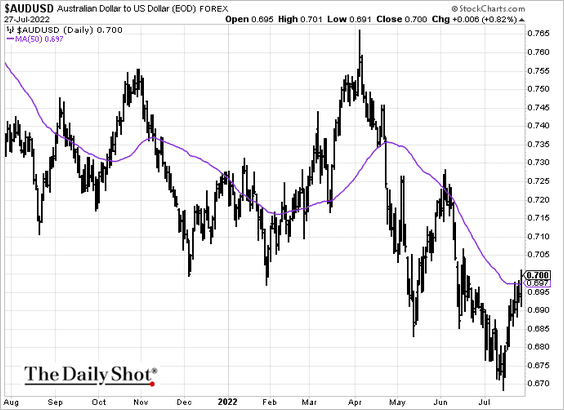
4. Australia’s retail sales were weaker than expected.
The Aussie dollar has breached the 50-day moving average.
Back to Index
China
1. Is the IMF underestimating China’s growth projections for next year?
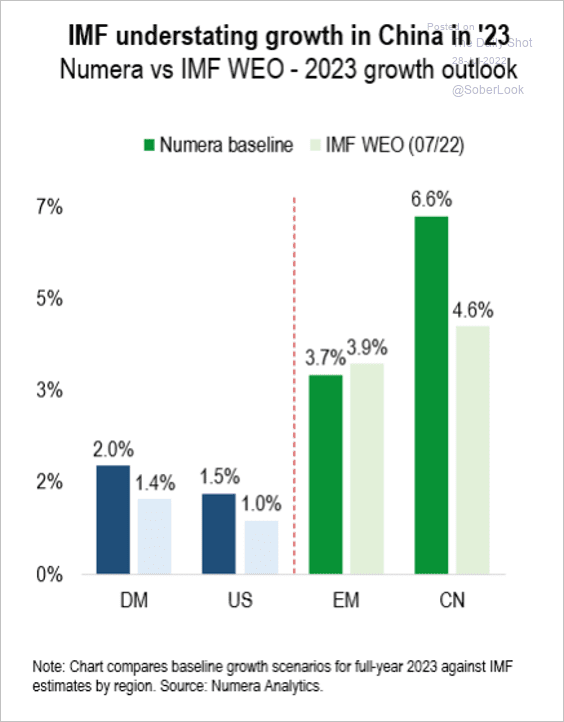 Source: Numera Analytics
2. The strength in industrial profits has been limited to state-controlled companies. The private sector is struggling.
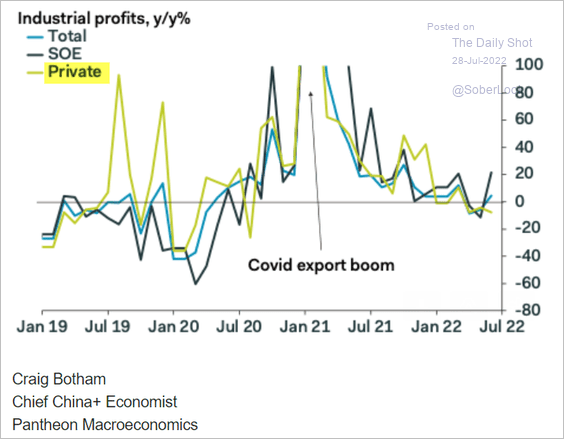 Source: Pantheon Macroeconomics
3. COVID restrictions haven’t been severe recently, considering a new wave of outbreaks.
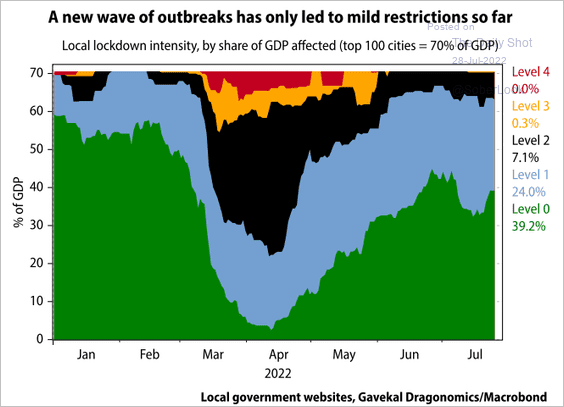 Source: Gavekal Research
4. China’s working-age population has peaked.
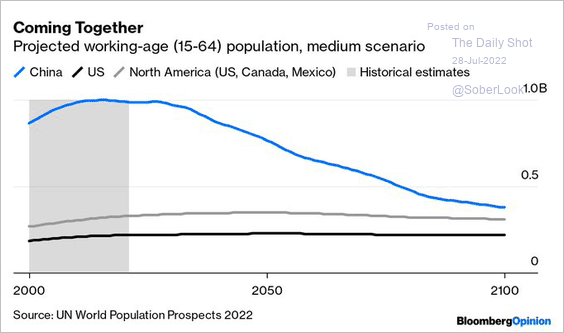 Source: @foxjust Read full article
Back to Index
Emerging Markets
1. Is Pakistan headed for default? The sovereign credit default swap spread has blown out.
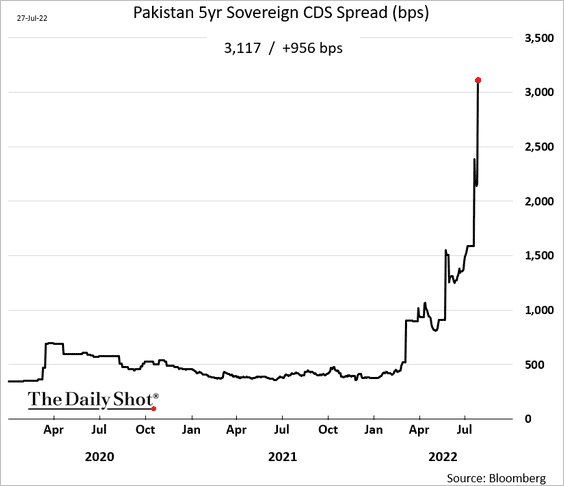
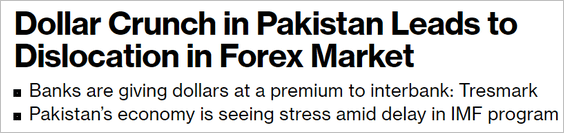 Source: Bloomberg Read full article
——————–
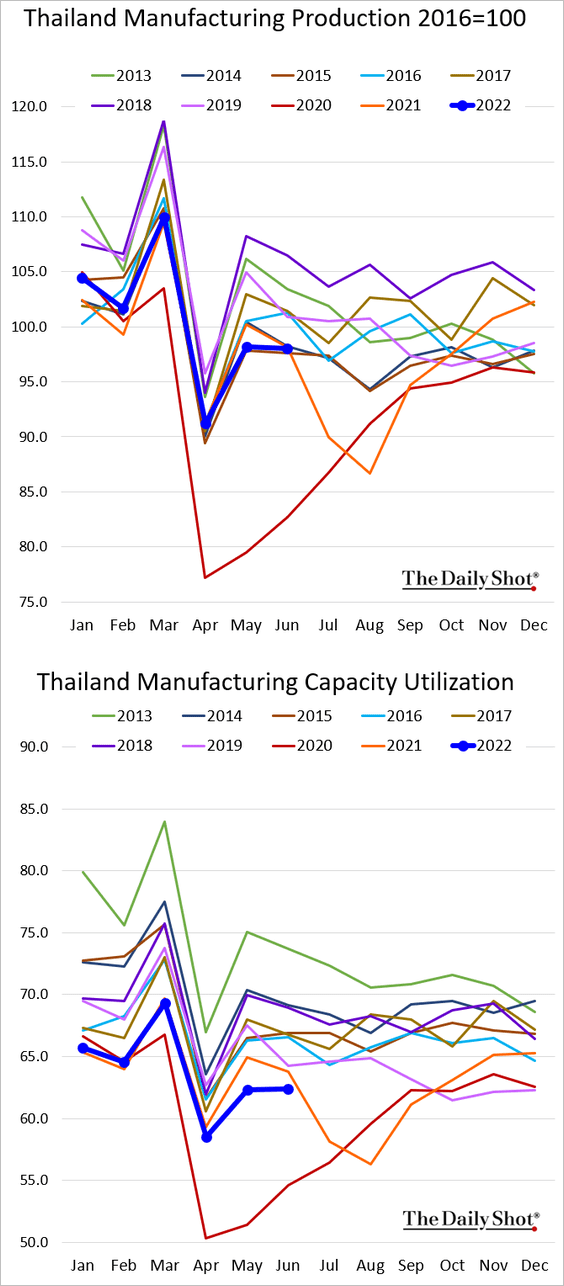
2. Thailand’s manufacturing activity remains soft relative to recent years.
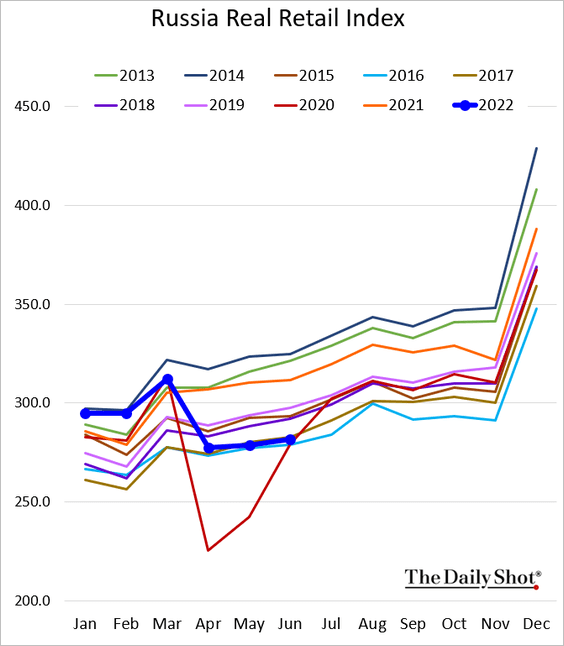
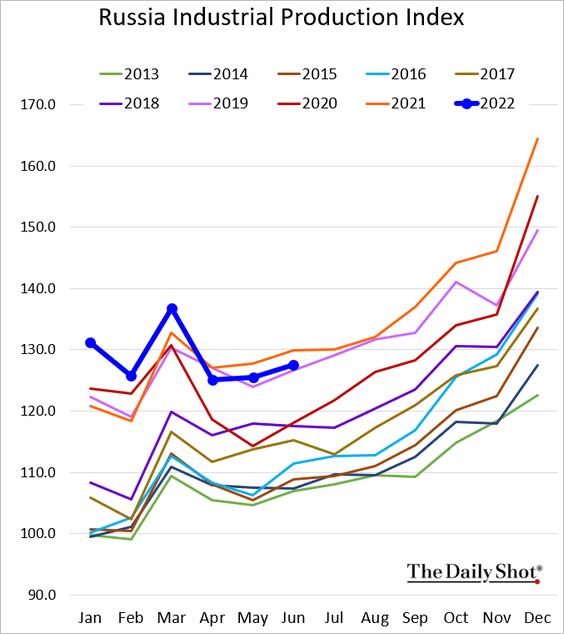
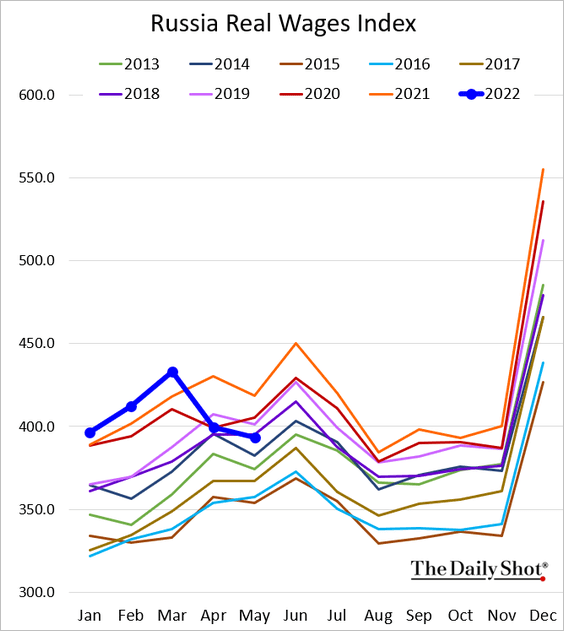
3. Next, we have some indicators from Russia. Please note that in the current environment, economic data from Russia’s Federal Service of State Statistics should be taken with a grain of salt.
• Retail sales:
• Industrial production:
• Real wages:
——————–
4. Mexican trade deficit widened sharply (well above estimates), …
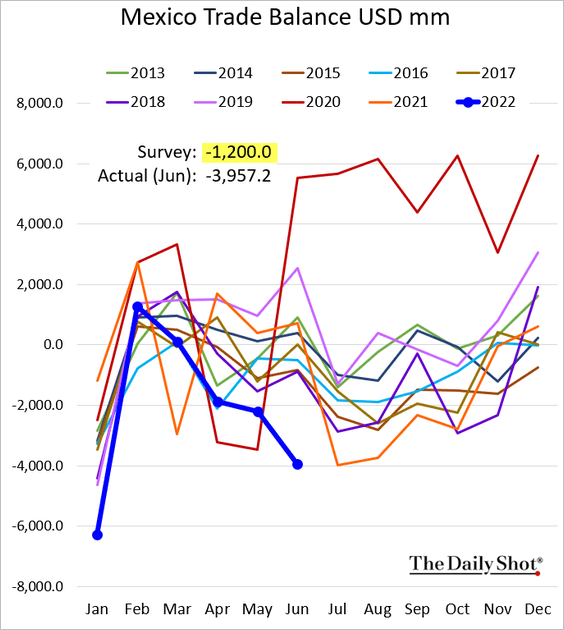
… driven by a surge in imports.
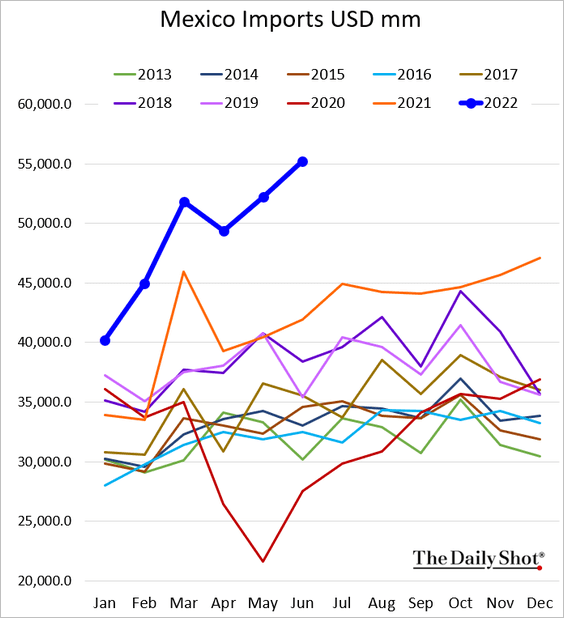
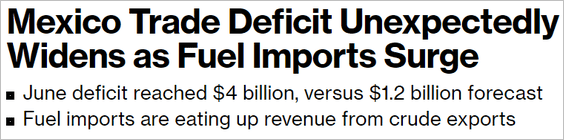 Source: Bloomberg Read full article
——————–
5. Is the average EM core inflation rate starting to peak?
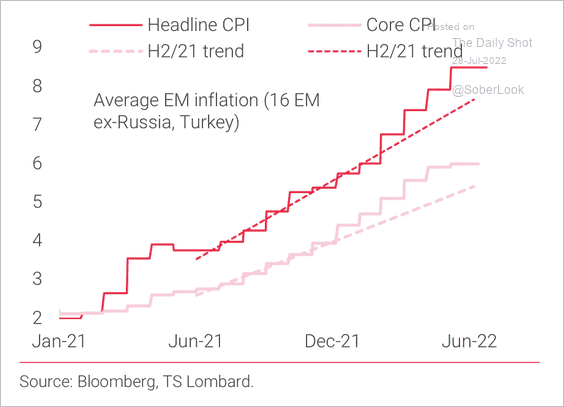 Source: TS Lombard
6. Emerging markets saw substantial outflows from equities in recent months.
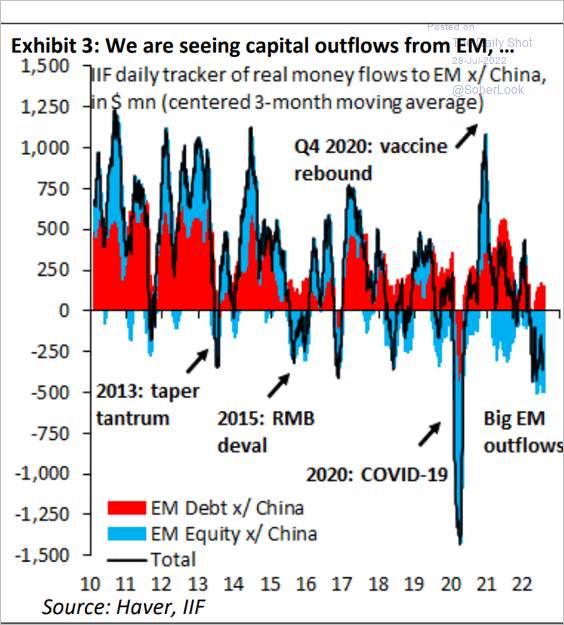 Source: IIF
Back to Index
Commodities
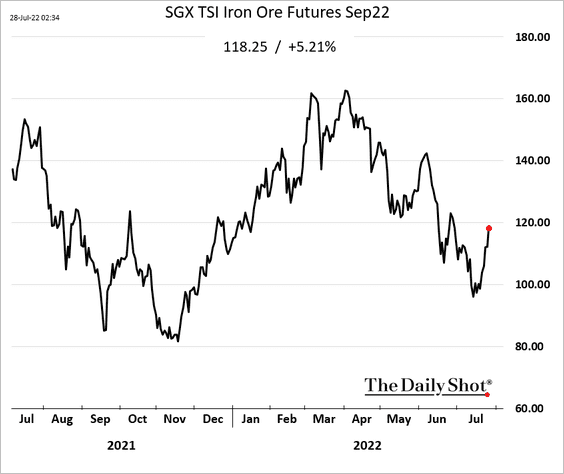
1. Iron ore continues to rebound after China’s property market bailout announcement.
2. Future looks bright for copper, according to Numera Analytics.
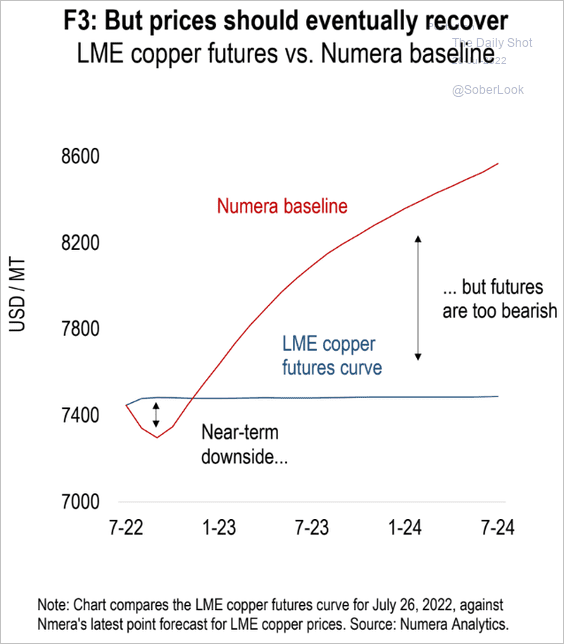 Source: Numera Analytics
3. The inverse correlation between gold and the 10-year Treasury real yield broke down this year, which typically precedes bearish reversals in the precious metal.
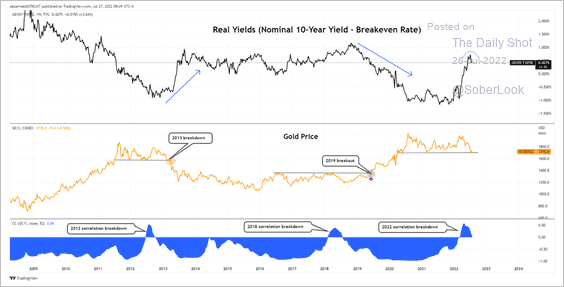 Source: Aazan Habib, Paradigm Capital
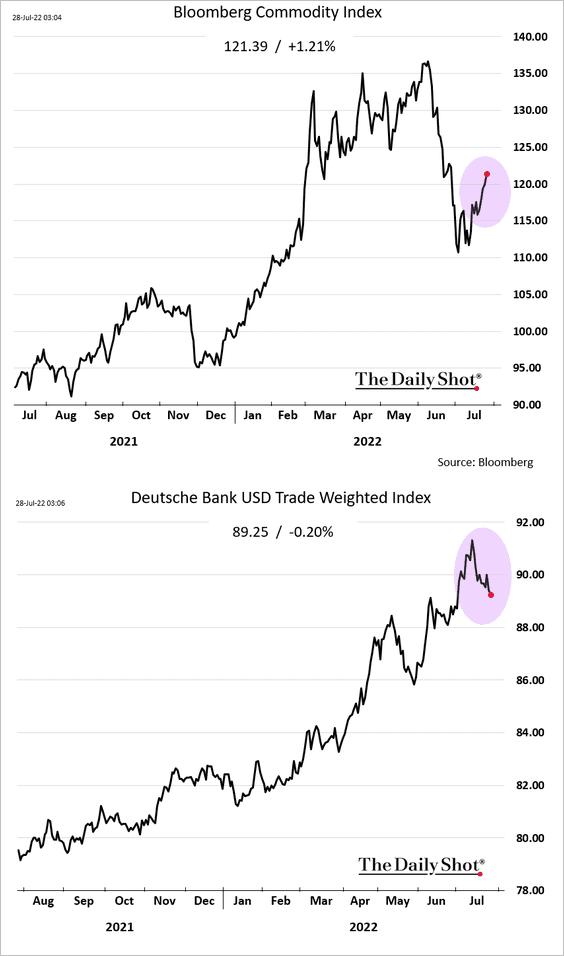
4. Bloomberg’s broad commodity index is rebounding as the US dollar rally stalls.
Back to Index
Energy
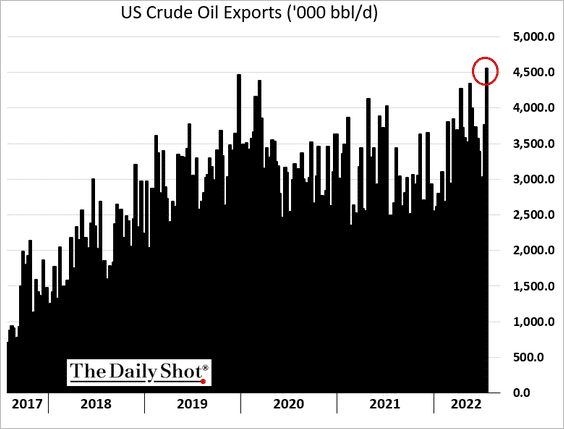
1. US oil exports hit a record last week.
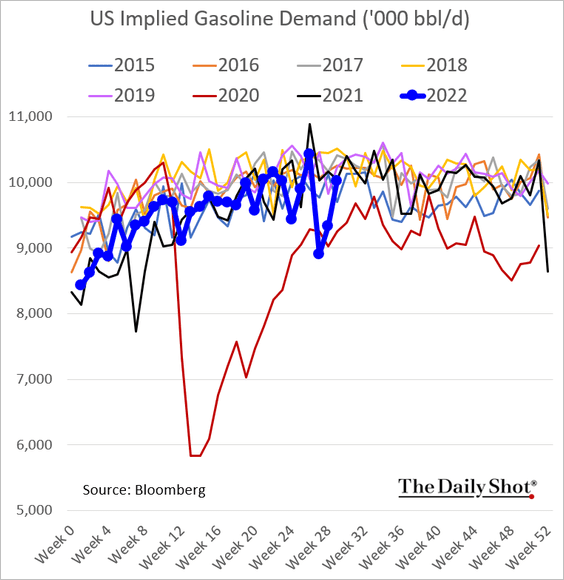
2. US gasoline demand has rebounded.
3. US crude and refined products inventories were down across the board last week.
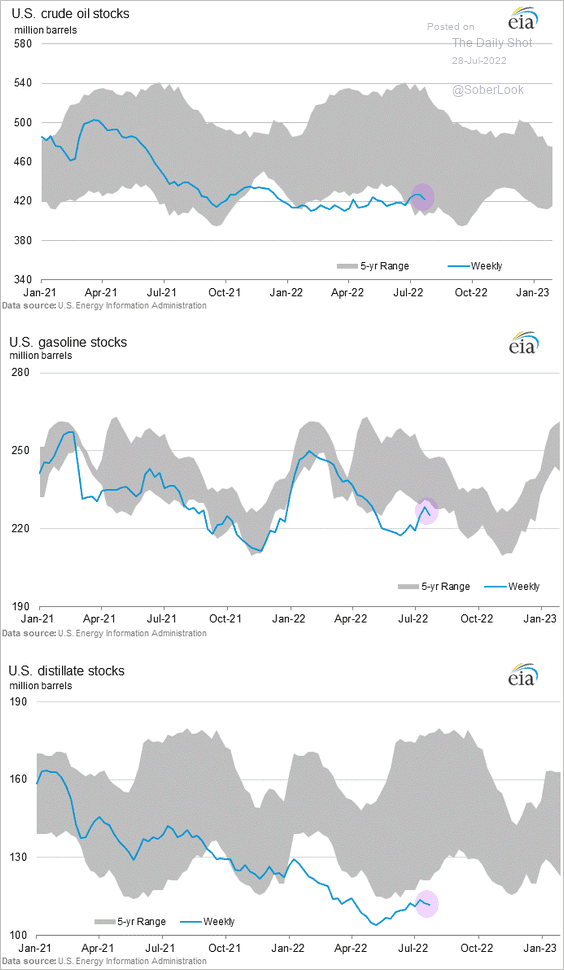
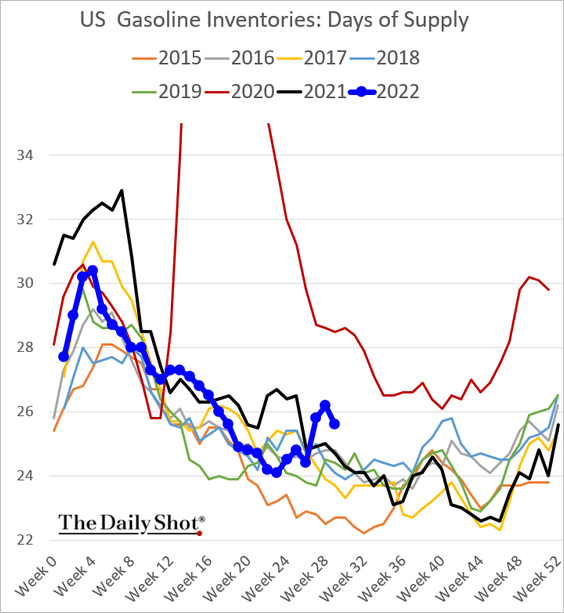
Measured in number of days, US gasoline inventories are still elevated.
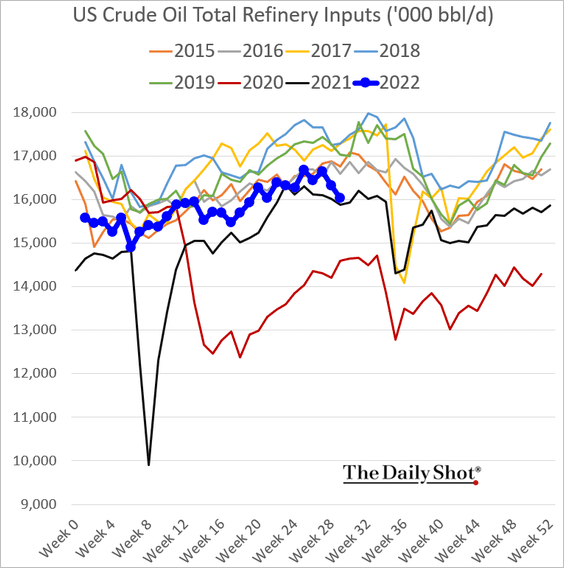
4. Refinery runs have deteriorated.
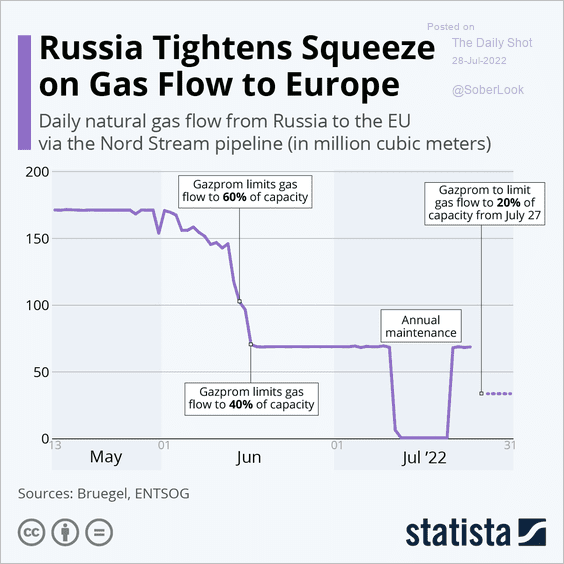
5. Russia’s squeeze on European natural gas markets …
 Source: Statista
… has nothing to do with maintenance issues.
 Source: Reuters Read full article
Back to Index
Equities
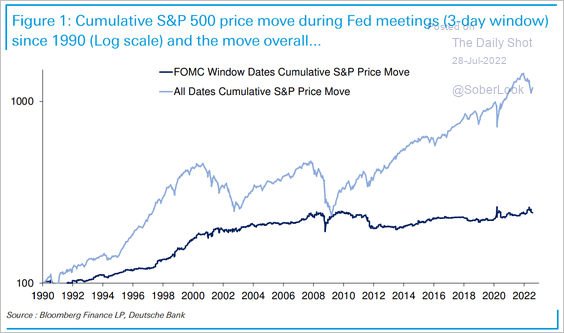
1. The markets are betting on a more “friendly” Federal Reserve. Too much enthusiasm? The S&P 500 has been flat during past FOMC decisions (over a three-day window) since the financial crisis, according to Deutsche Bank.
 Source: Deutsche Bank Research
2. Inflation-sensitive stocks outperformed.
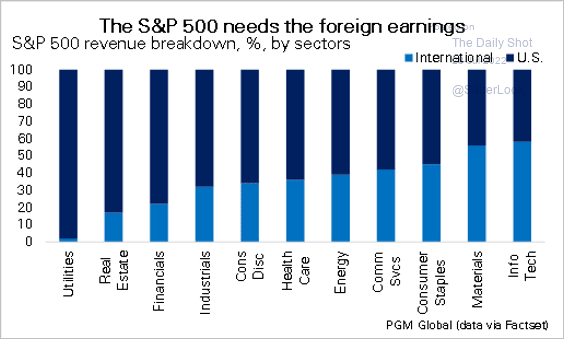
3. Foreign earnings are important for the S&P 500.
 Source: PGM Global
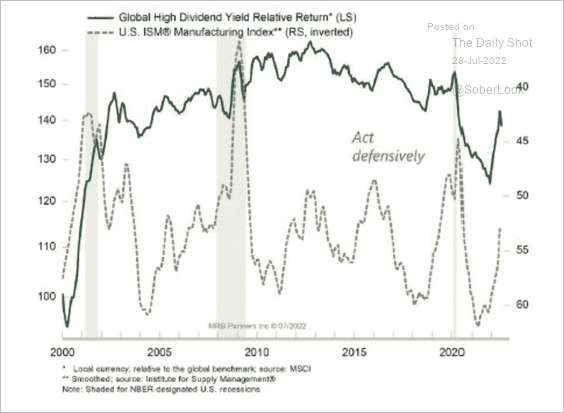
4. High dividend stocks typically outperform when manufacturing growth slows.
 Source: MRB Partners
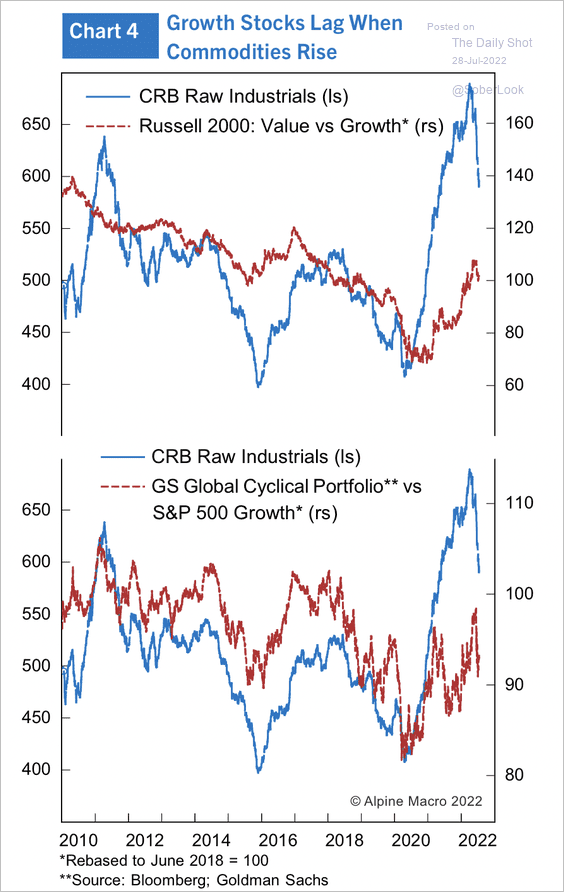
5. Growth stocks underperform value and cyclical stocks when commodity prices are rising.
 Source: Alpine Macro
6. The recent drawdown (through June 15th) has been low relative to other bear markets.
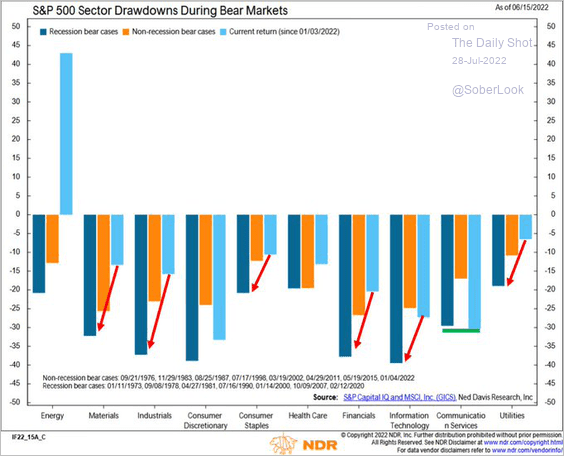 Source: @DayHagan_Invest, h/t @pav_chartbook
7. Retail investors are rotating back into single stocks.
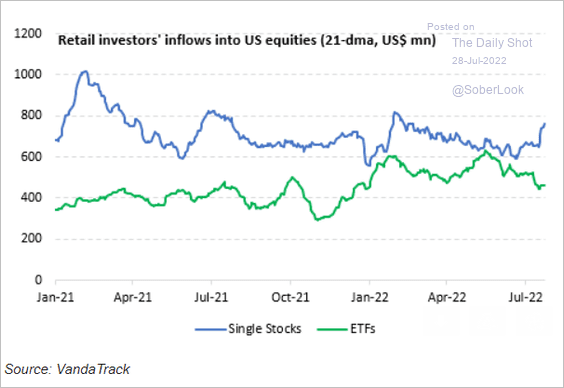 Source: Vanda Research
8. Options on VIX have been getting cheaper as investors give up bets on big shifts in volatility.
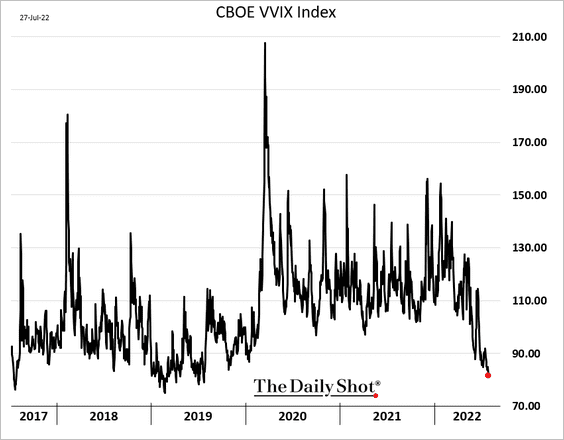
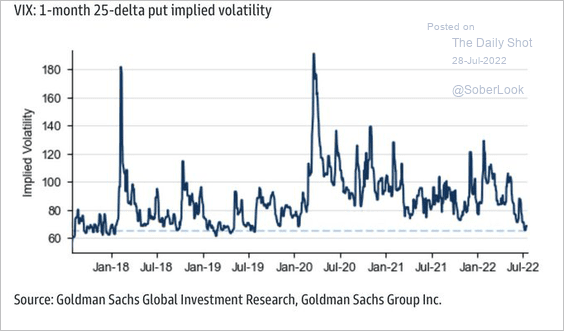 Source: Goldman Sachs; @therobemrich
Back to Index
Rates
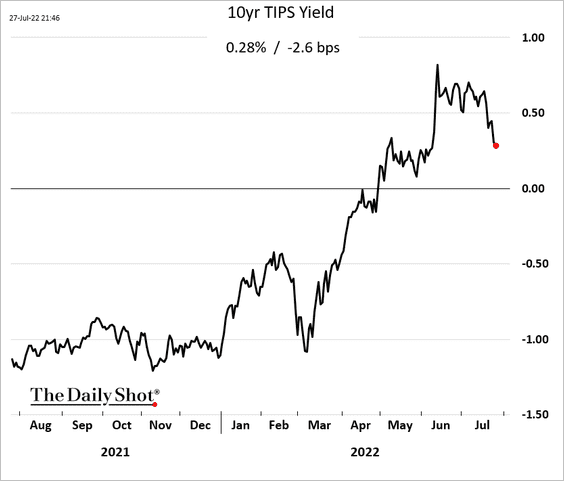
1. Real yields continue to move lower, which tends to help growth stocks.
2. The weighted average maturity of outstanding Treasury securities hit the highest level in decades as the share of T-bills declines.
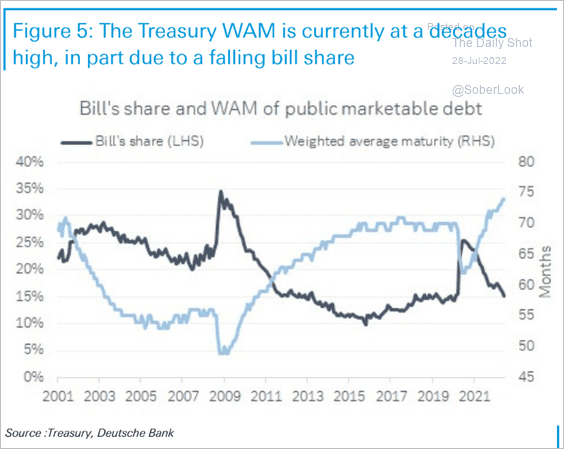 Source: Deutsche Bank Research
3. Mortgage-backed securities’ duration has peaked.
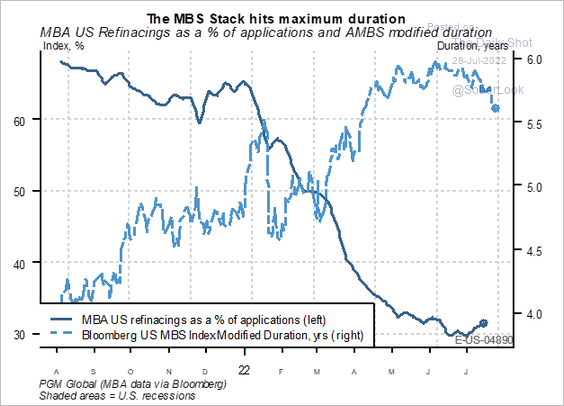 Source: Hugo Ste-Marie, Portfolio & Quantitative Strategy Global Equity Research, Scotia Capital
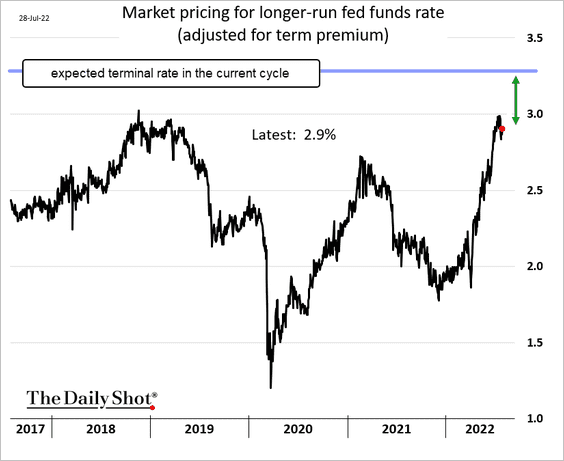
4. The markets don’t expect the Fed’s maximum rate to be too restrictive (less than 50 bps above the neutral rate).
Back to Index
Global Developments
1. The World Economics SMI report points to a contraction in global business activity this month.
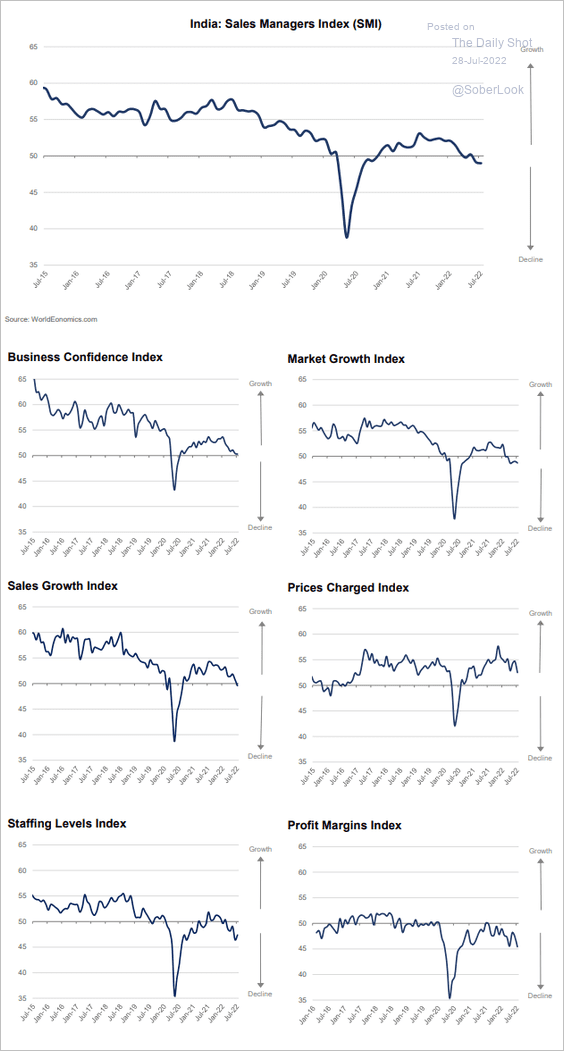 Source: World Economics
2. It’s been a rough year for bonds. This chart shows the regional attribution of fixed-income fund flows.
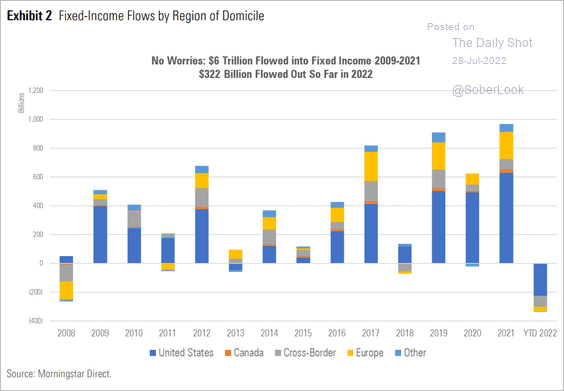 Source: Morningstar
——————–
Food for Thought
1. Confidence in newspapers and TV news:
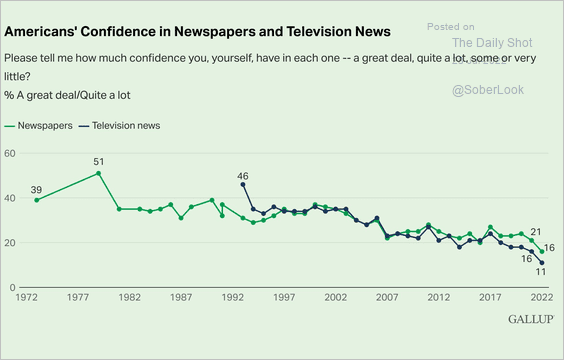 Source: @GallupNews Read full article
2. Global plastic waste by category:
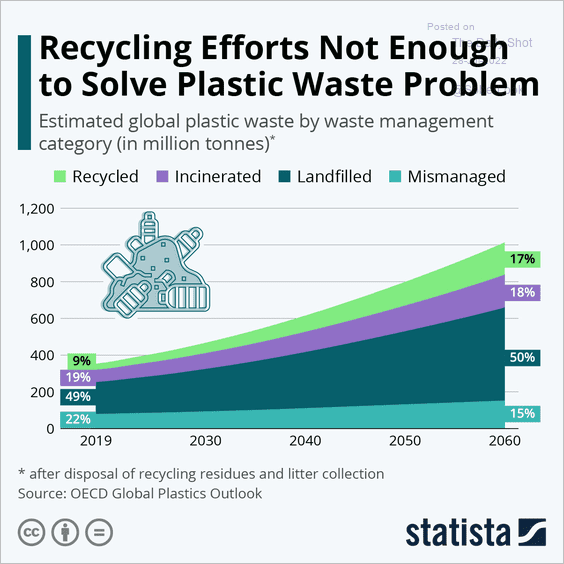 Source: Statista
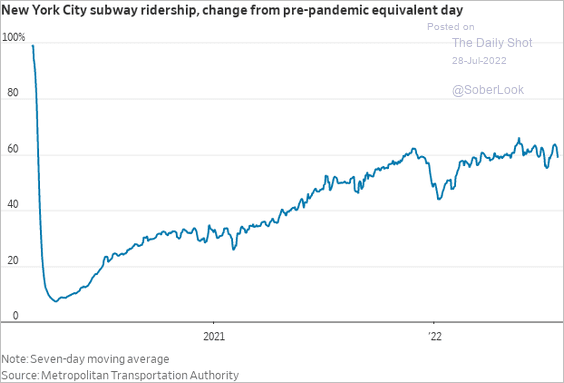
3. NYC subway ridership relative to pre-COVID levels:
 Source: @WSJ Read full article
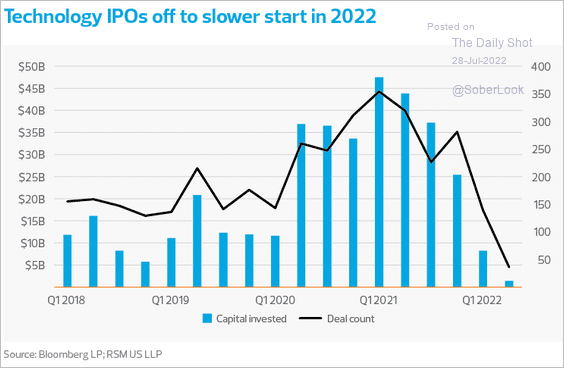
4. Tech IPOs:
 Source: RSM
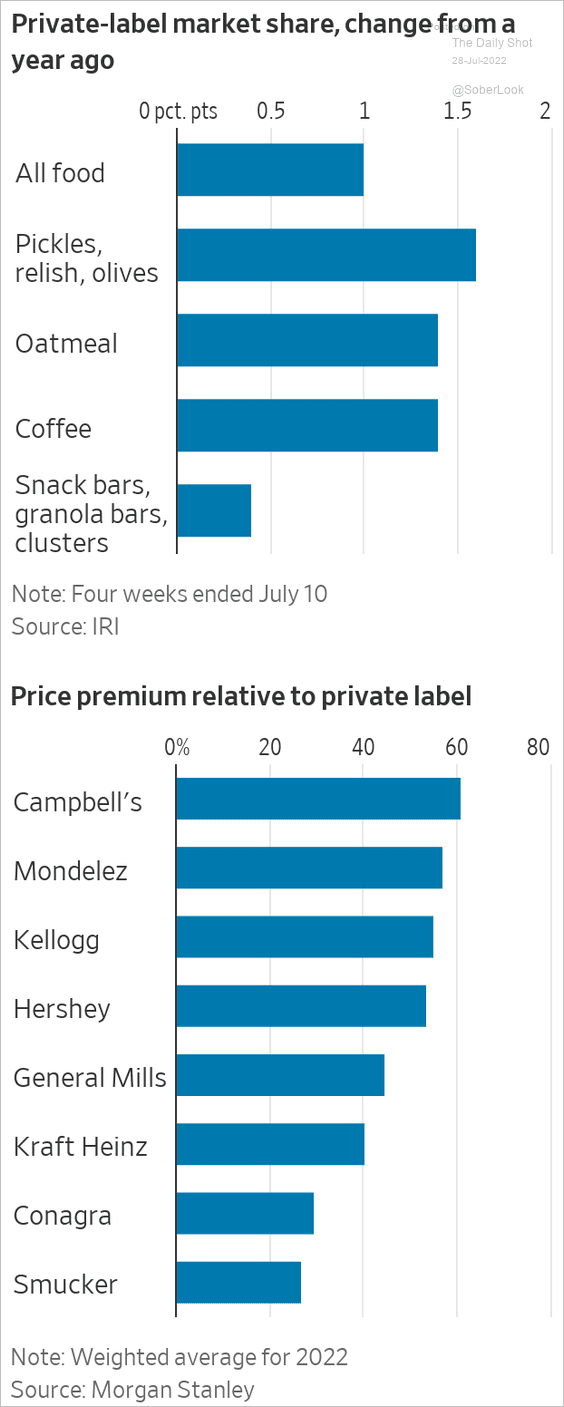
5. Americans shifting to store brands:
 Source: @WSJ Read full article
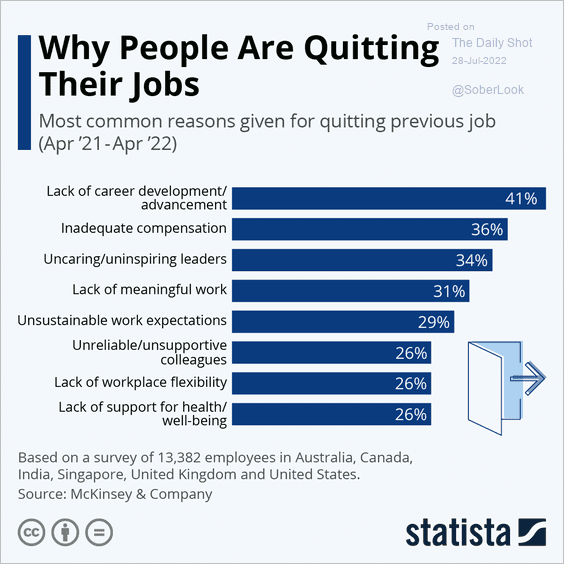
6. Reasons for quitting the previous job:
 Source: Statista
7. Beer taxes in Europe:
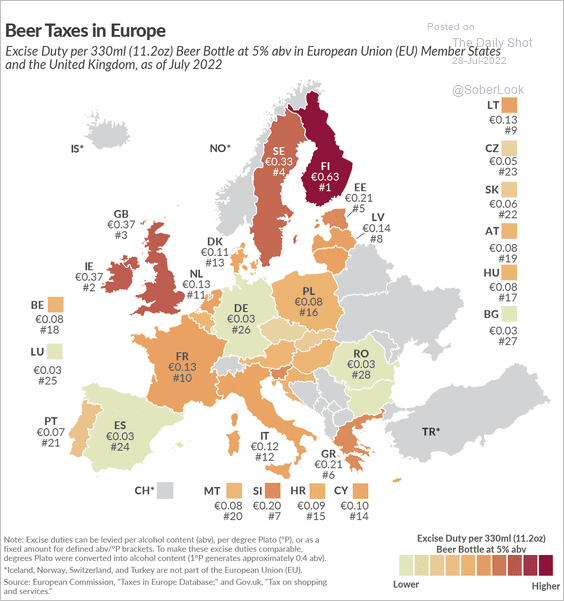 Source: @TaxFoundation Read full article
——————–
Back to Index