
The Daily Shot: 01-Aug-22
• The United States
• The United Kingdom
• The Eurozone
• Europe
• Asia – Pacific
• China
• Emerging Markets
• Cryptocurrency
• Commodities
• Energy
• Equities
• Credit
• Rates
• Food for Thought
The United States
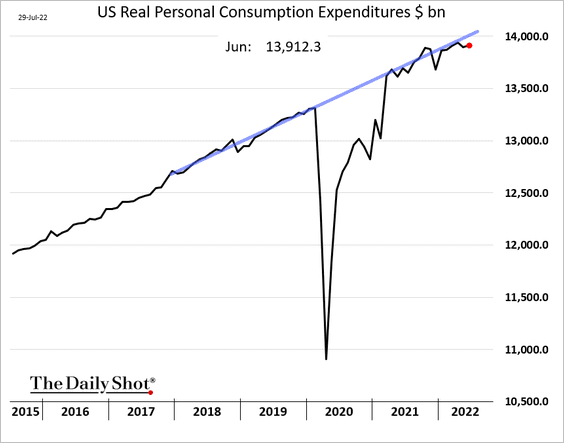
1. Consumer spending growth is below the pre-COVID trend but is not crashing. Households continue to spend despite deteriorating sentiment.
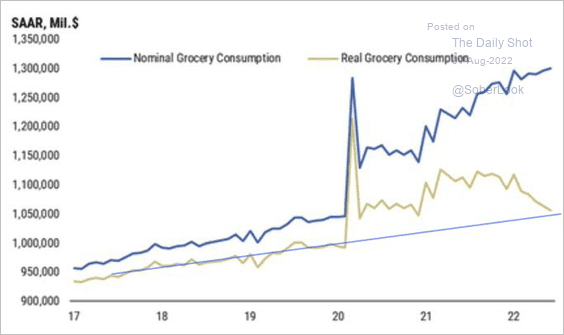
• Real grocery spending is returning to its pre-COVID trend.
 Source: Morgan Stanley Research; @MichaelAArouet
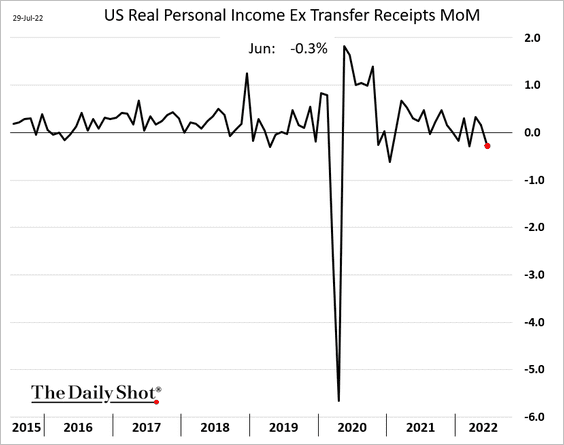
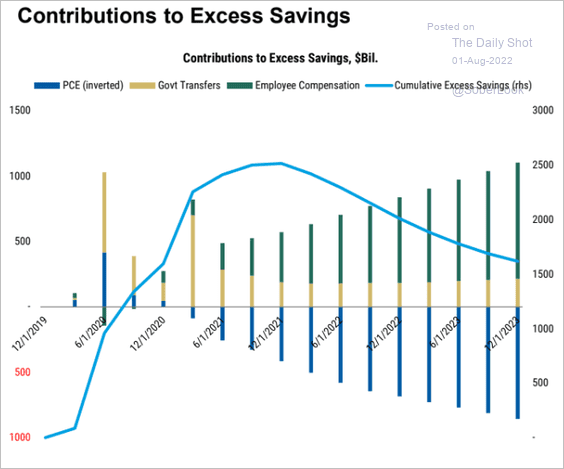
• Incomes (excluding government payments) declined in June.
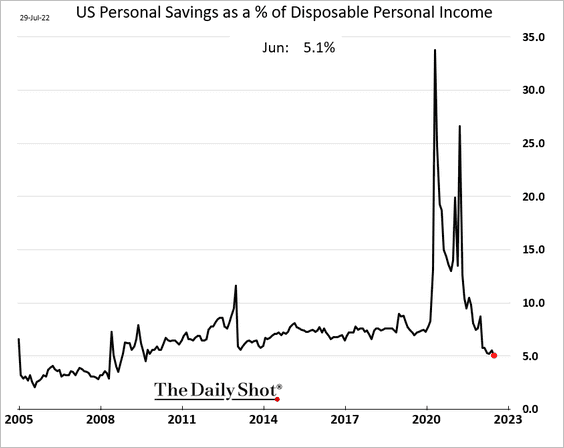
• Savings as a share of disposable income continue to fall.
This chart shows the drivers of excess savings in the US.
 Source: Morgan Stanley Research
——————–
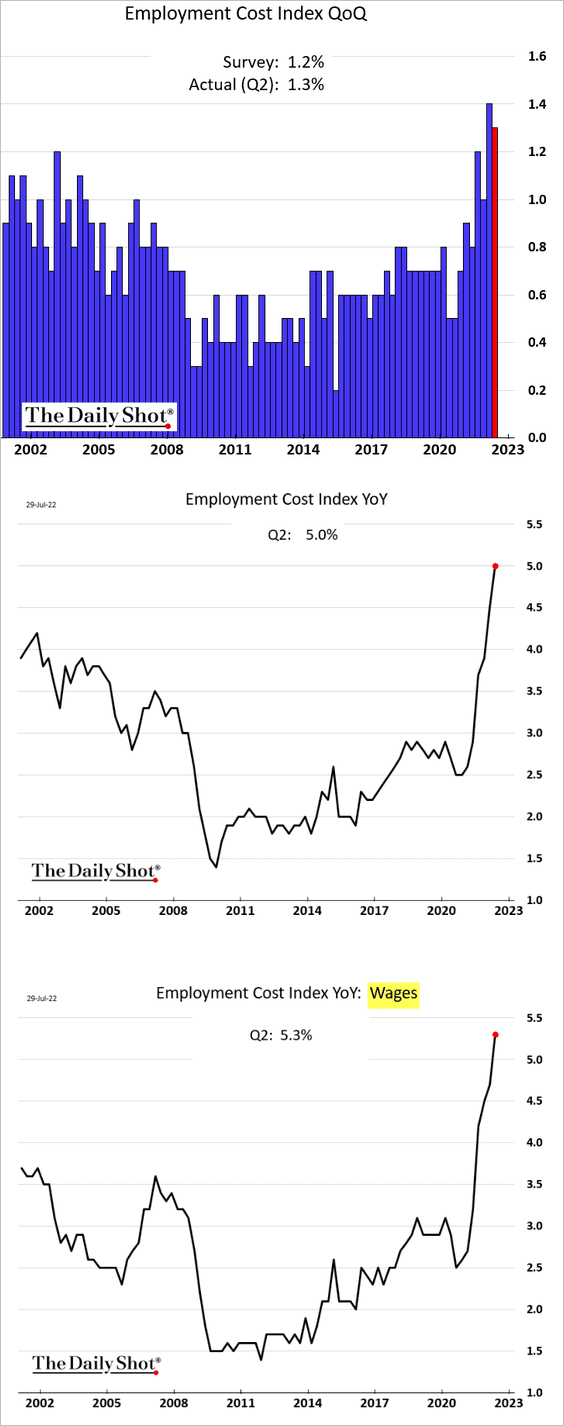
2. Employment costs continue to surge. Companies have been able to pass higher costs to their customers, but many are getting pushback these days. Margins are coming under pressure.
3. Next, we have some updates on inflation.
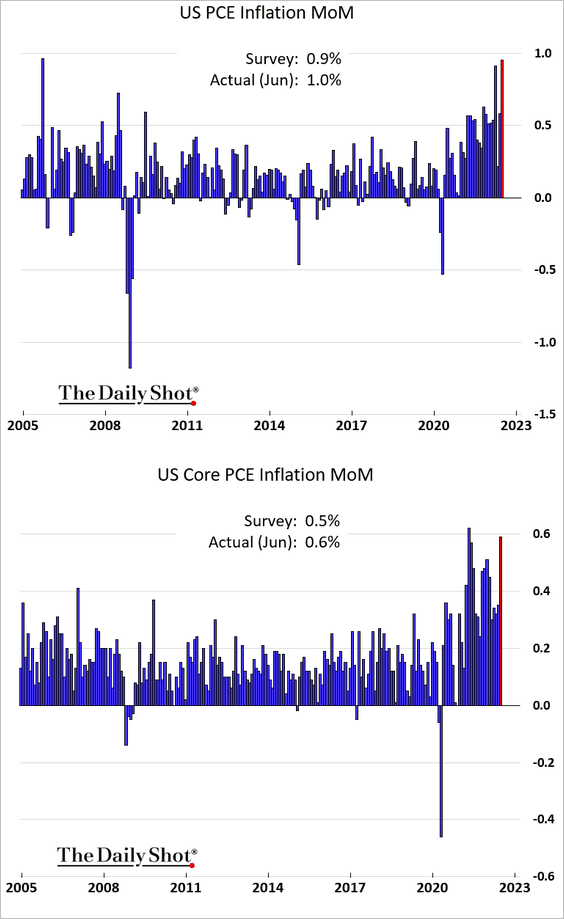
• The PCE inflation index, the Fed’s preferred measure, climbed by the highest percentage in years in June. The core PCE inflation also accelerated.
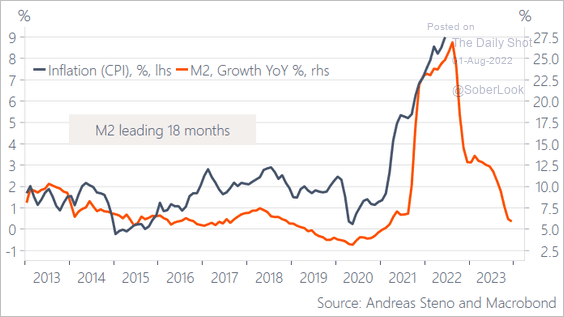
• Tighter liquidity should ease price pressures.
 Source: @AndreasSteno
• The Cleveland Fed’s CPI estimate for July shows inflation cooling.
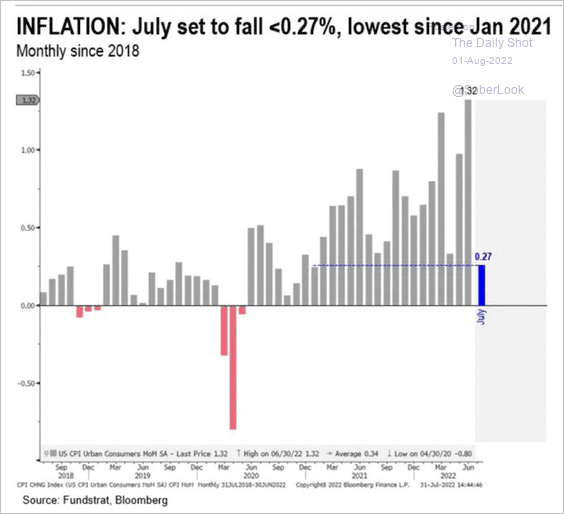 Source: @carlquintanilla, @ClevelandFed, @fundstrat
——————–
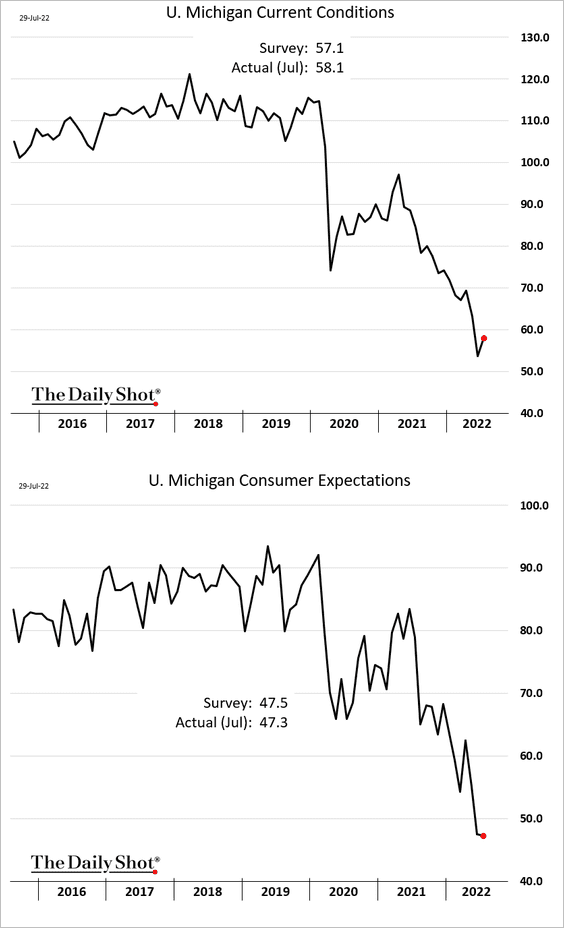
4. The updated University of Michigan consumer sentiment index showed a divergence: an improvement in current conditions but further deterioration in expectations.
5. Business sentiment among US public companies is deteriorating as well.
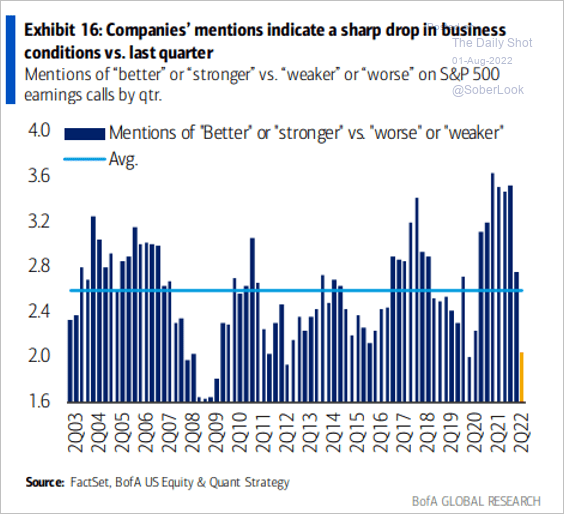 Source: BofA Global Research
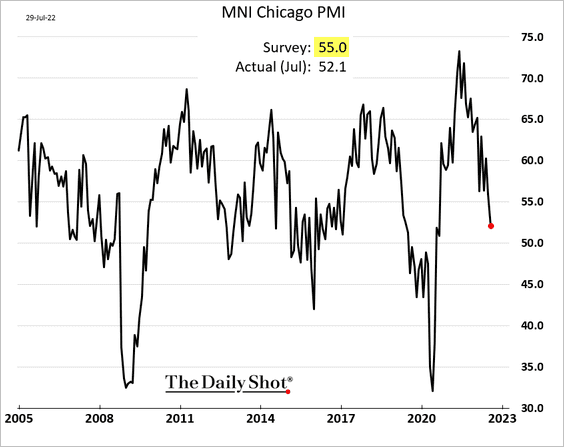
6. The MNI Chicago PMI surprised to the downside, pointing to softer Midwest business activity.
Will the ISM Manufacturing PMI (at the national level) show a contraction in July (PMI < 50)?
• ISM vs. regional Fed indicators:
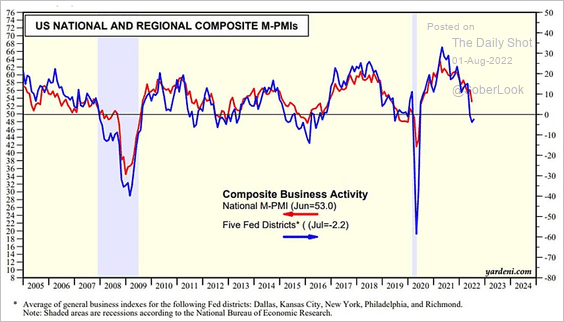 Source: Yardeni Research
• ISM vs. global central banks’ rate changes:
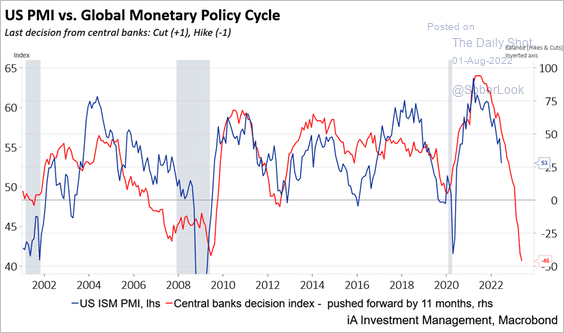 Source: Industrial Alliance Investment Management
——————–
7. The Atlanta Fed’s GDPNow model starts the estimate at 2.1% for the Q3 GDP growth.
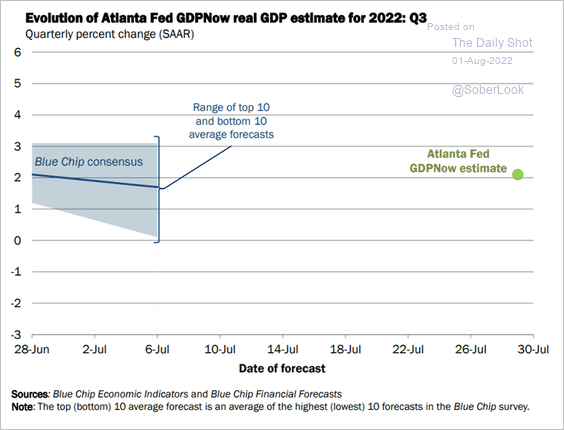 Source: @AtlantaFed Read full article
8. US financial conditions are easing again. That’s not what the Fed wants to see.
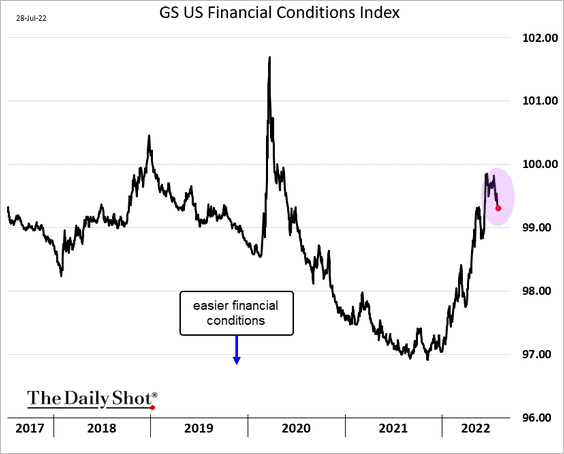
By the way, the St. Louis Fed Financial Stress Index, which could be viewed as a measure of financial conditions, hit the lowest level on record (no stress).
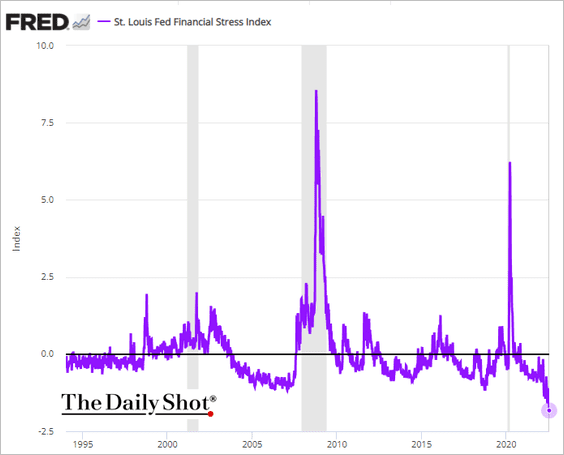 h/t @WillieDelwiche
Back to Index
The United Kingdom
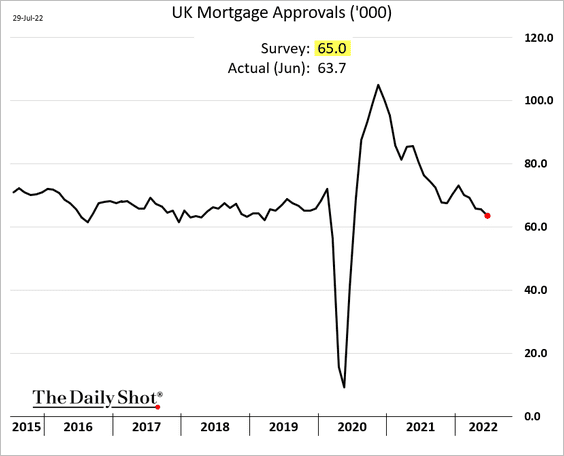
1. Consumer credit topped forecasts for June.
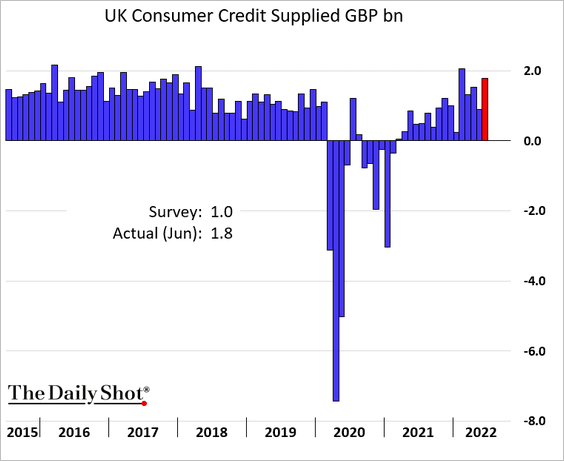
But mortgage applications surprised to the downside.
——————–
2. This chart shows changes in pay for self-employed workers in the pandemic era.
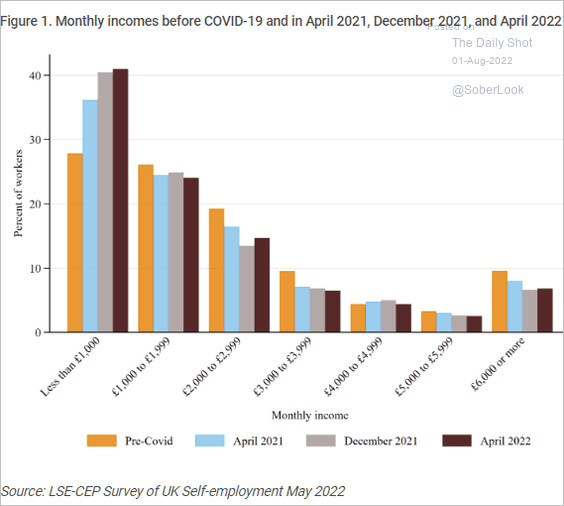 Source: LSE Read full article
What has been driving economic inactivity (workers staying out of the labor force)?
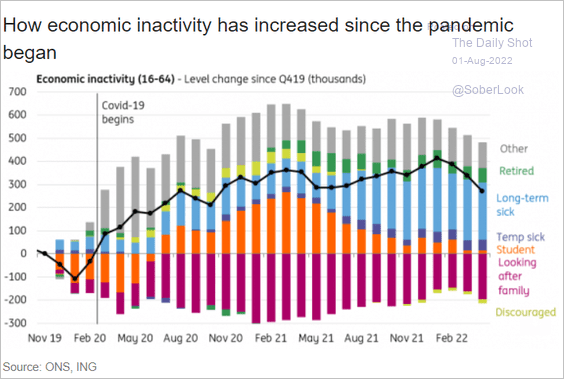 Source: ING
——————–
3. Liz Truss is expected to win the Conservative Party leadership election, according to the betting markets.
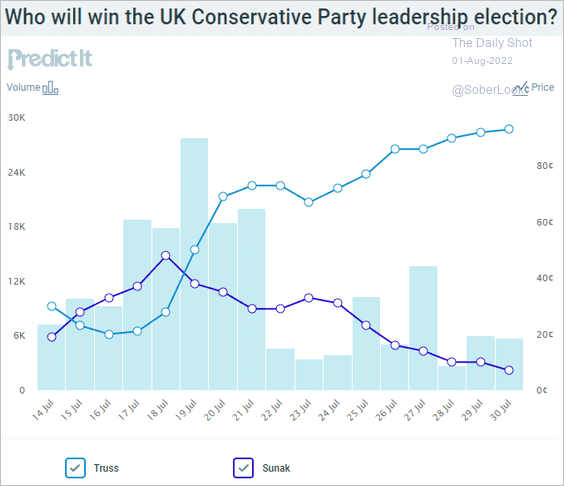 Source: @PredictIt
Back to Index
The Eurozone
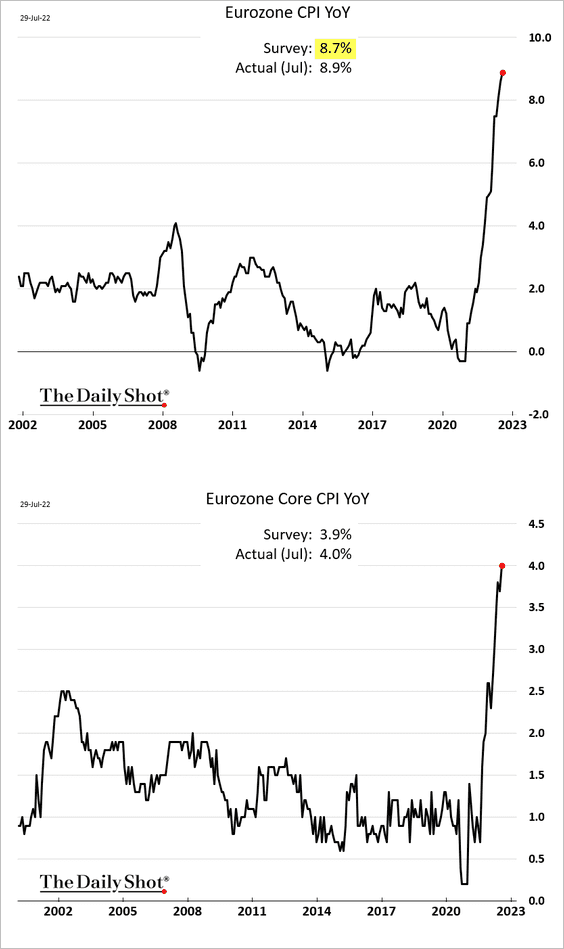
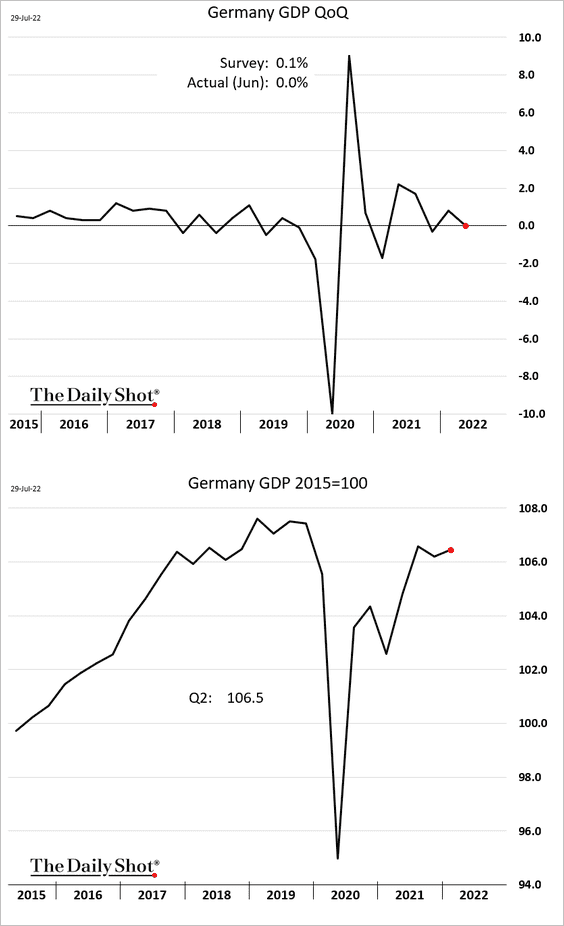
1. Last week, we saw Germany’s inflation topping forecasts. Other than Italy, other euro-area economies also saw upside surprises in the July CPI reports.
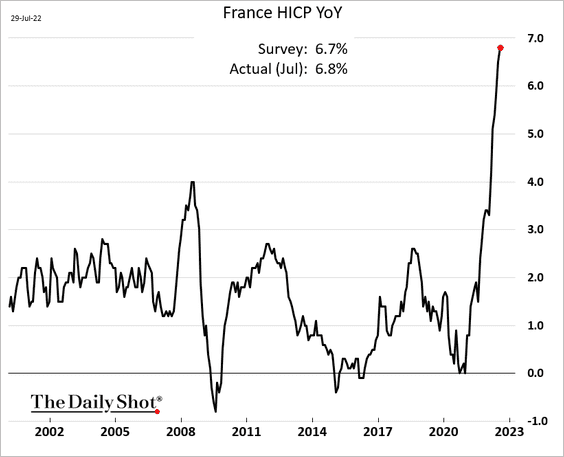
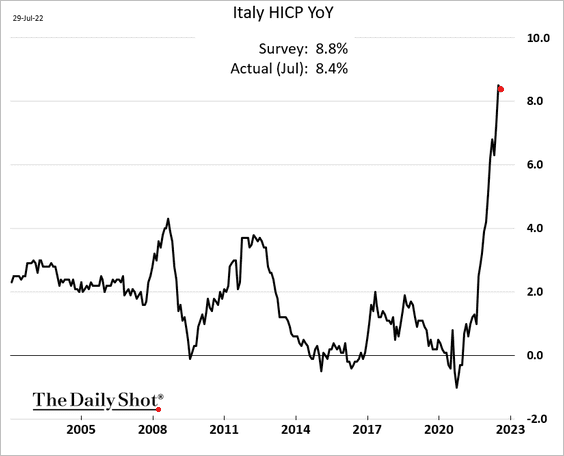
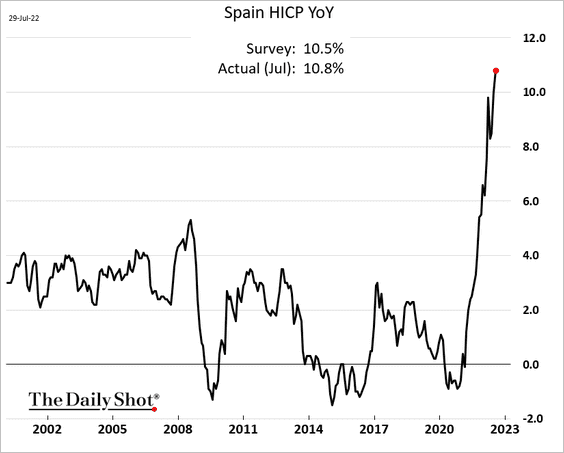
Here is the situation at the Eurozone level. Painful …
——————–
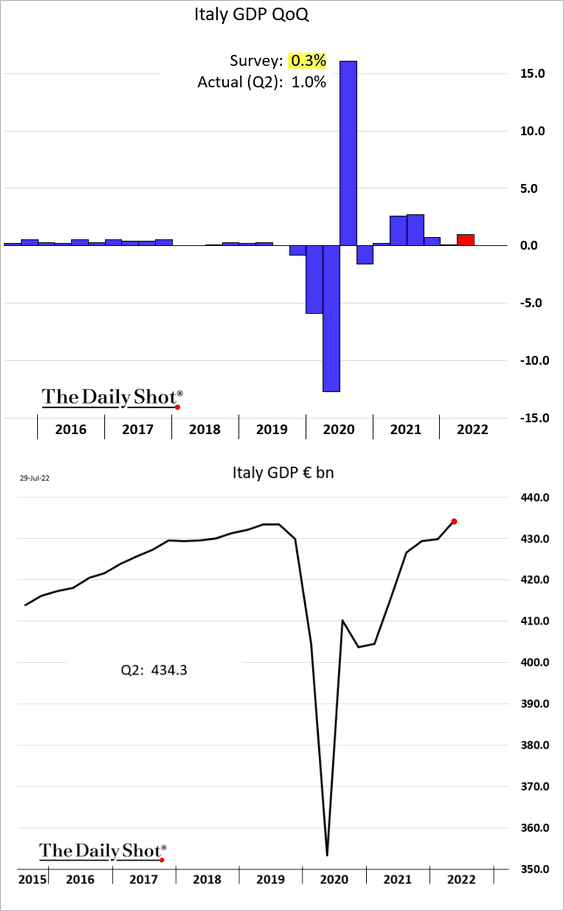
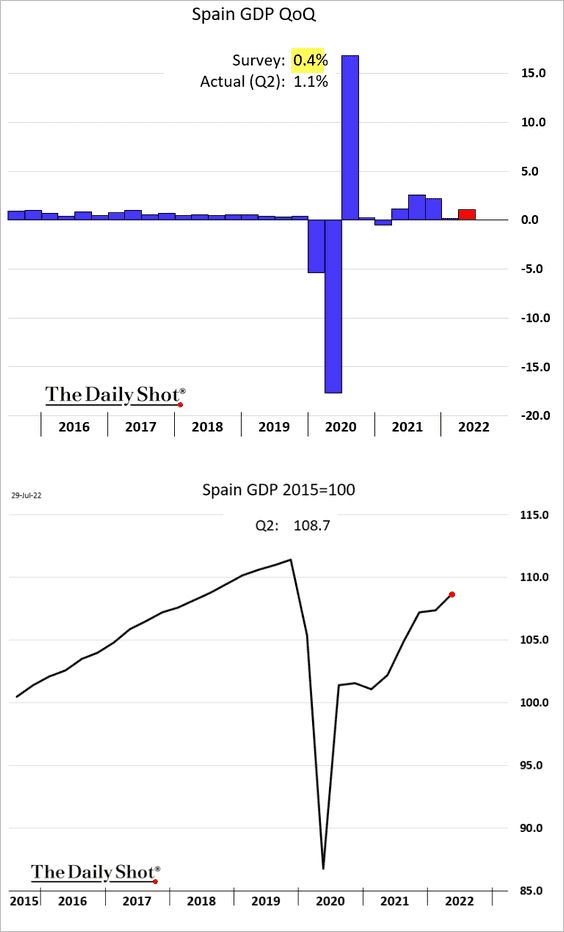
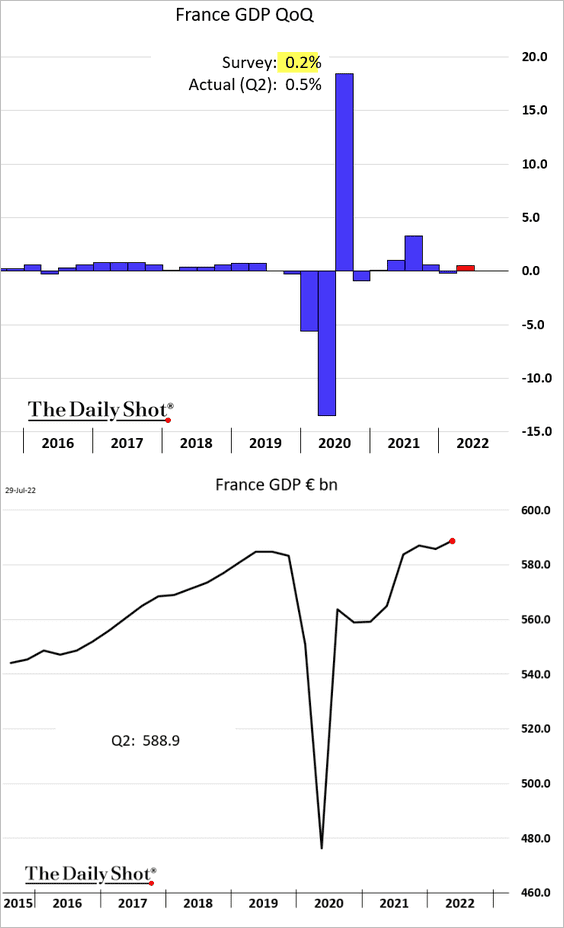
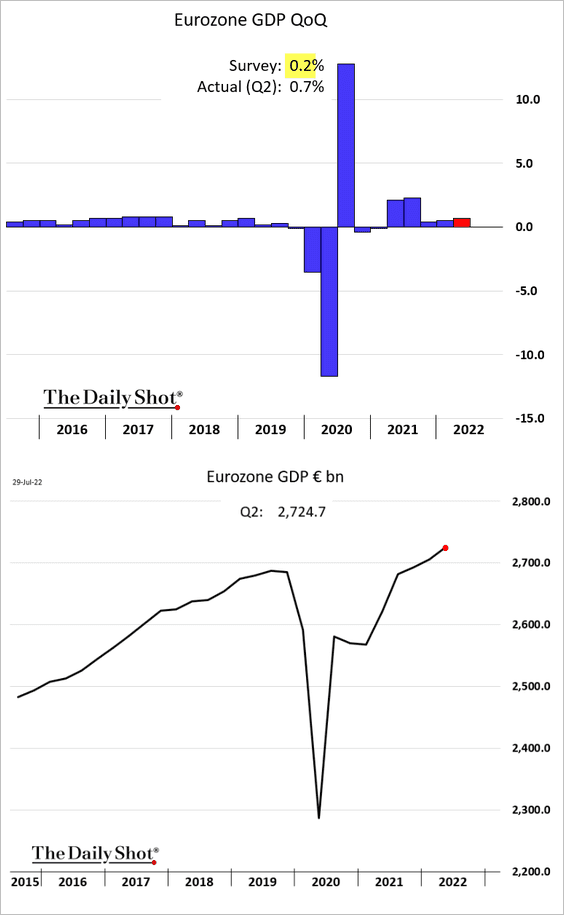
2. Other than Germany, euro-area Q2 GDP growth surprised to the upside.
• Italy:
• Spain:
• France:
• Germany:
• The Eurozone:
——————–
3. German unemployment climbed in July.
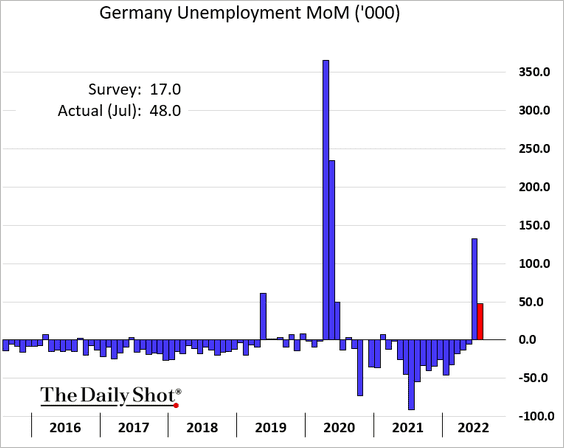
 Source: Reuters Read full article
——————–
4. Euro-area exports are at risk as competitiveness deteriorates.
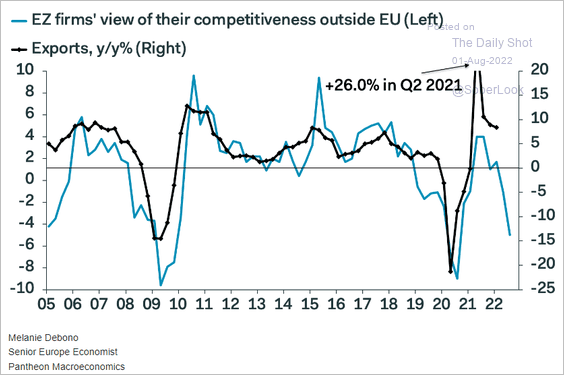 Source: Pantheon Macroeconomics
Germany’s labor costs have been outpacing Eurozone peers.
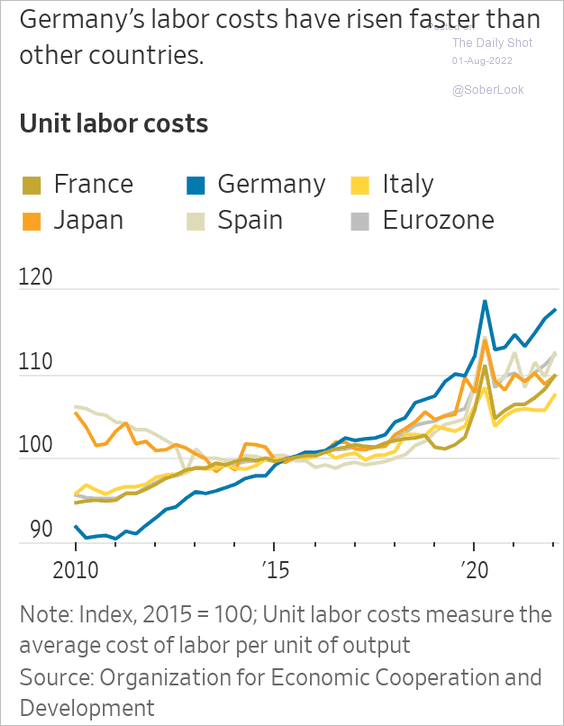 Source: @WSJ Read full article
——————–
5. The Sentix survey of investor expectations signals recessionary conditions six months ahead (2 charts).
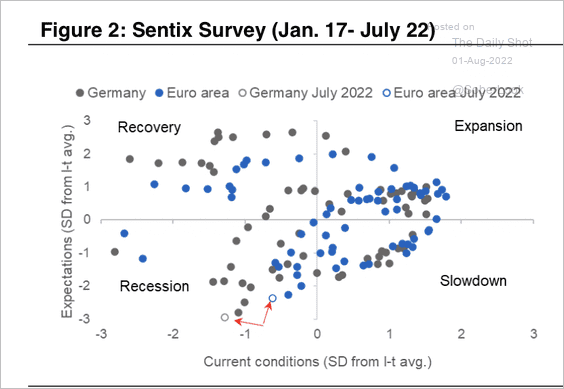 Source: Citi Private Bank
 Source: Citi Private Bank
——————–
6. Elevated natural gas prices are expected to keep the euro under pressure.
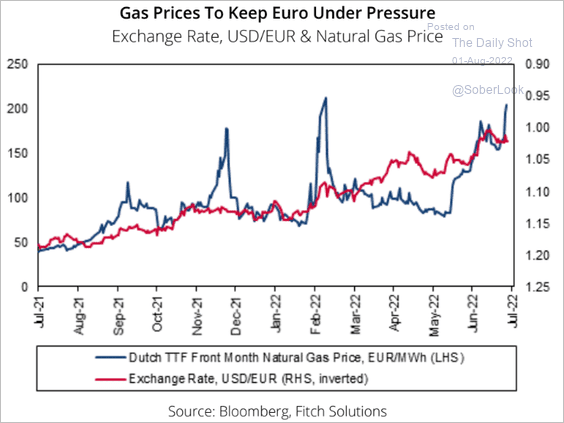 Source: Fitch Solutions Macro Research
Back to Index
Europe
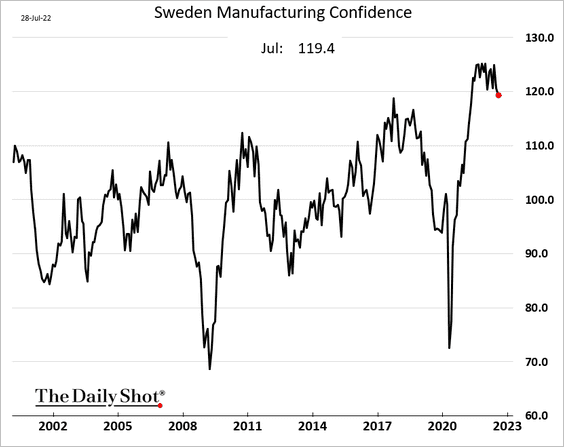
1. Let’s begin with Sweden.
• Q2 GDP growth (better than expected):
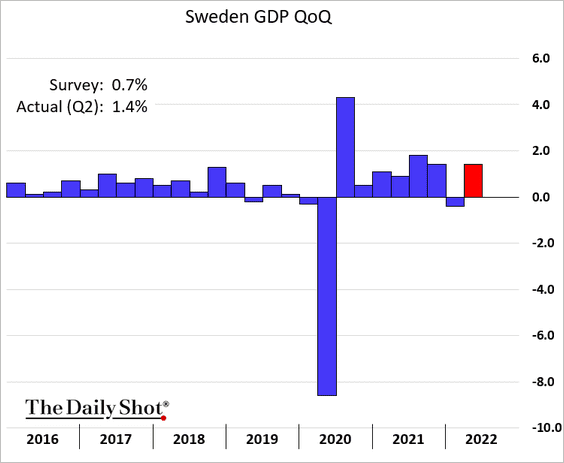
• Growth forecast from Nordea:
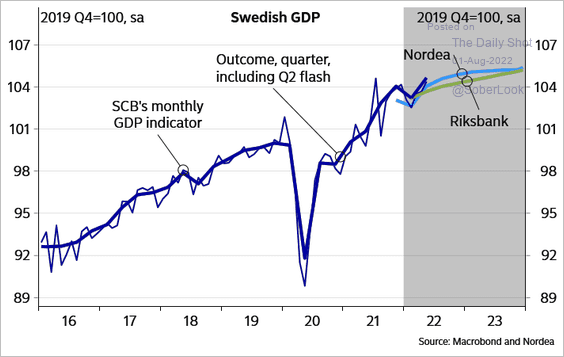 Source: Nordea Markets
• Manufacturing confidence:
• Consumer confidence (record low):
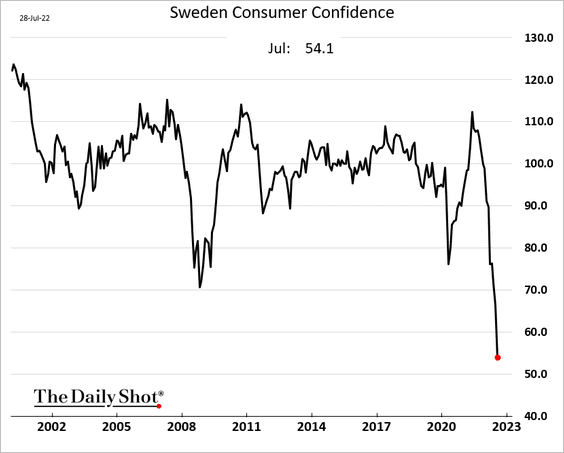
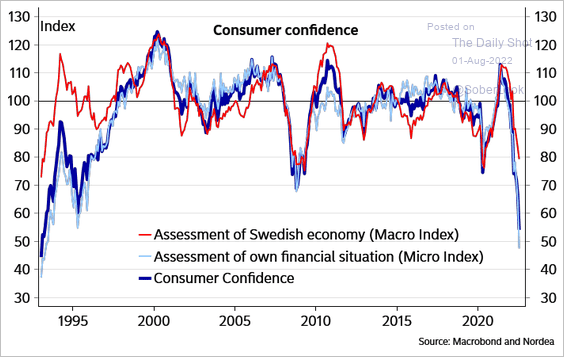 Source: Nordea Markets
• Household inflation expectations:
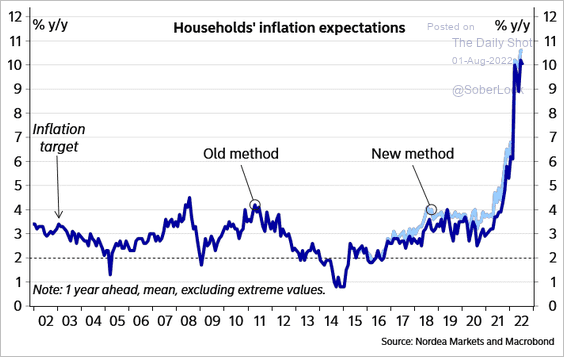 Source: Nordea Markets
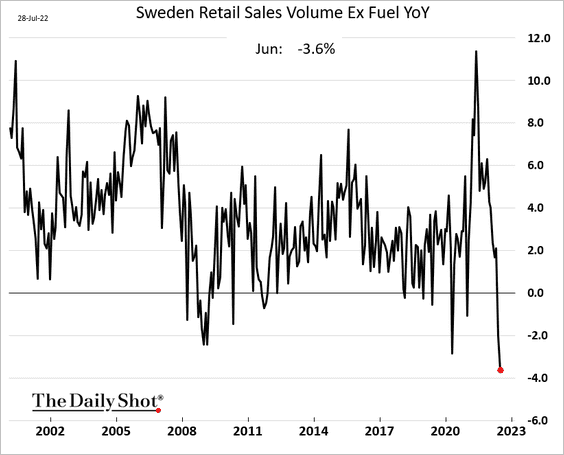
• Retail Sales:
• Purchasing pharmaceuticals online:
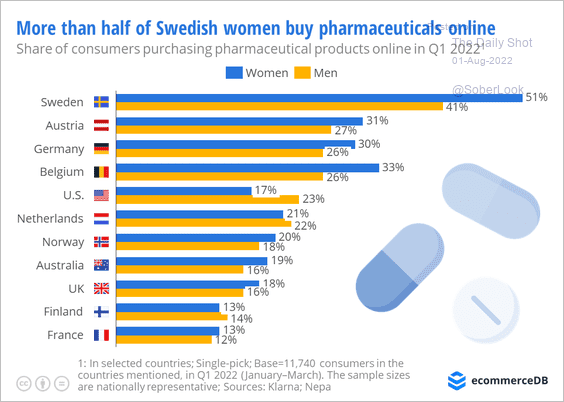 Source: EcommerceDB Read full article
——————–
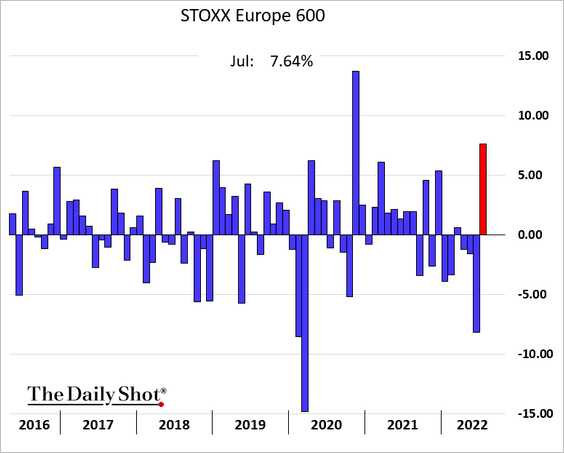
2. It was a good month for European shares.
3. This chart shows first-time asylum applicants.
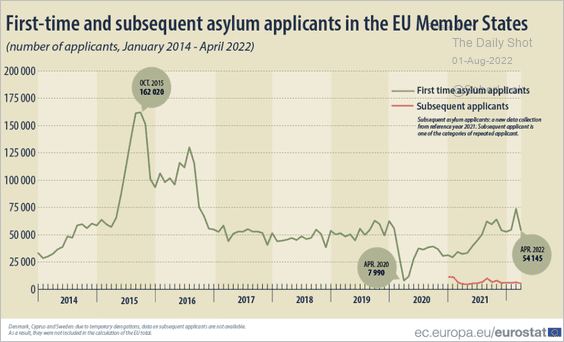 Source: Eurostat Read full article
Back to Index
Asia – Pacific
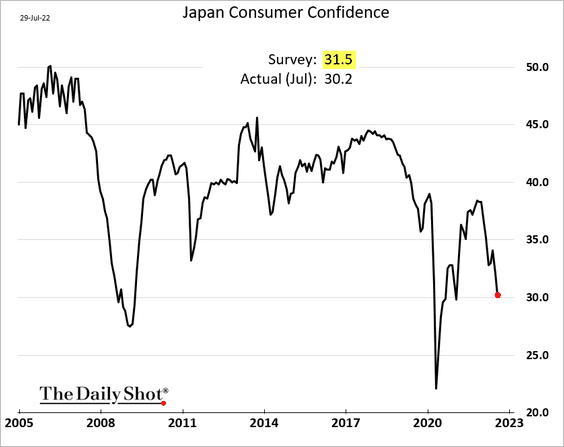
1. Japan’s consumer confidence surprised to the downside.
2. Taiwanese and South Korean equity markets are pricing in a deep slump in global chip sales (2 charts).
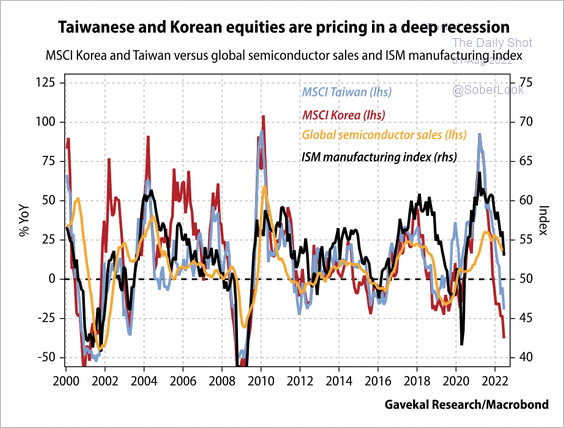 Source: Gavekal Research
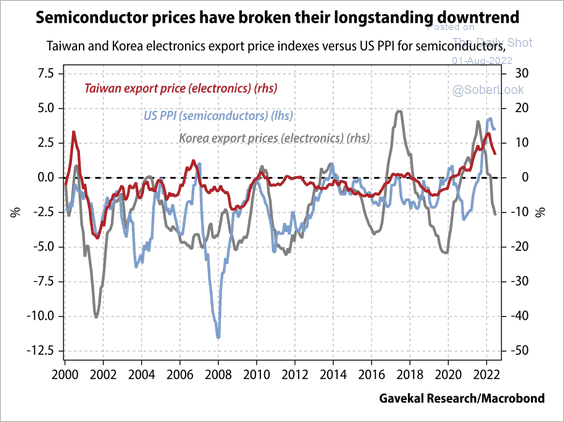 Source: Gavekal Research
• The July PMI reports showed contracting factory activity in South Korea …
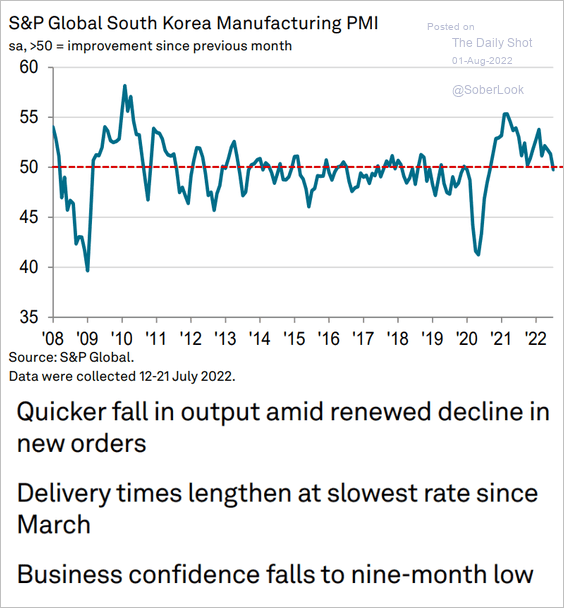 Source: S&P Global PMI
… and Taiwan.
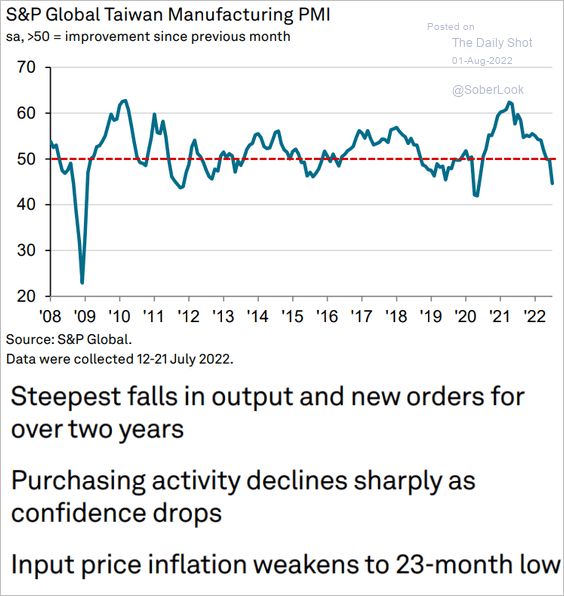 Source: S&P Global PMI
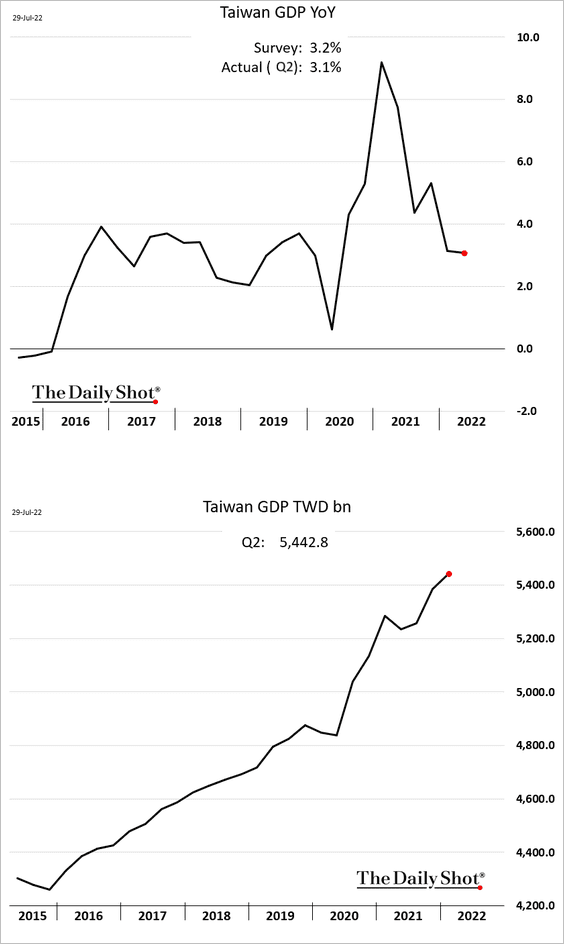
• Taiwan’s GDP growth remained robust in Q2.
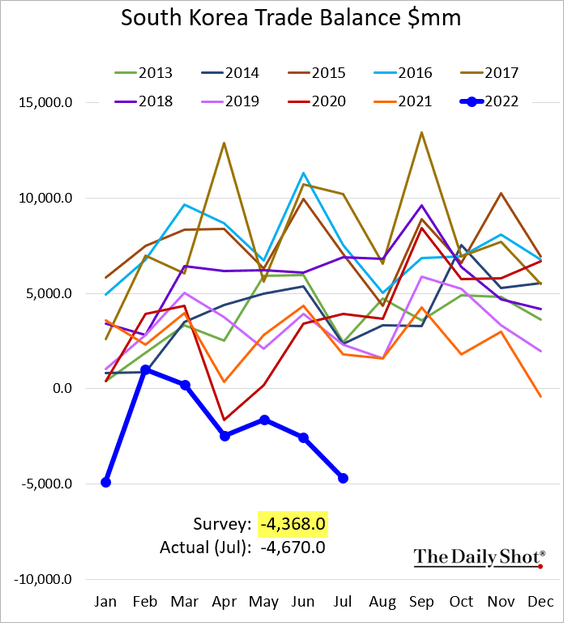
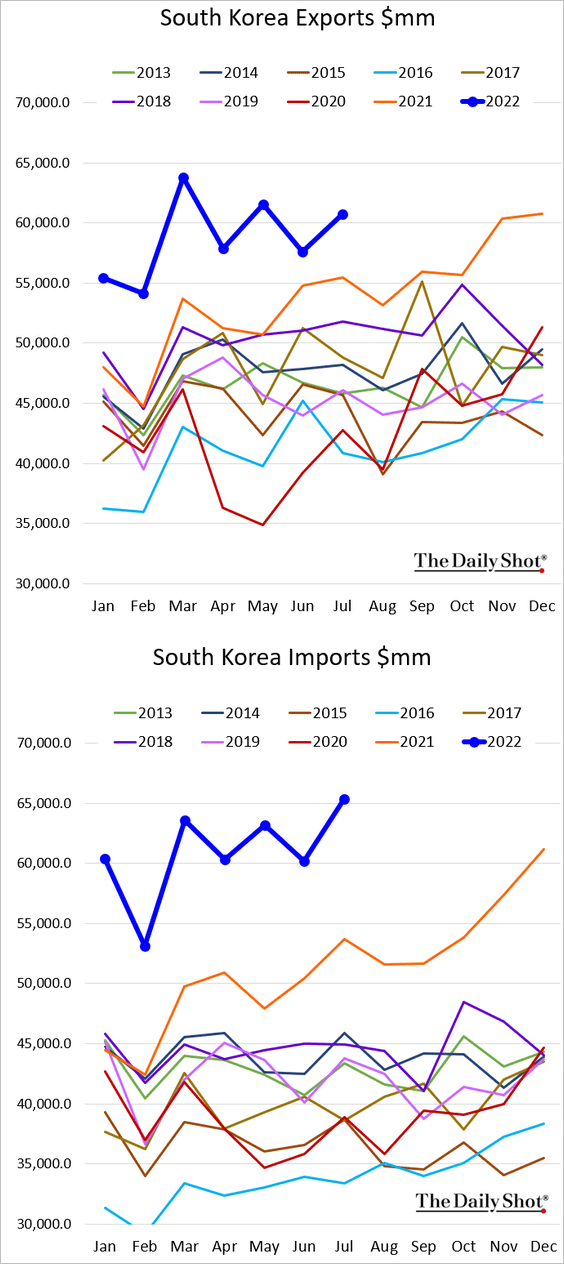
• South Korea’s trade deficit has blown out as energy costs surge.
——————–
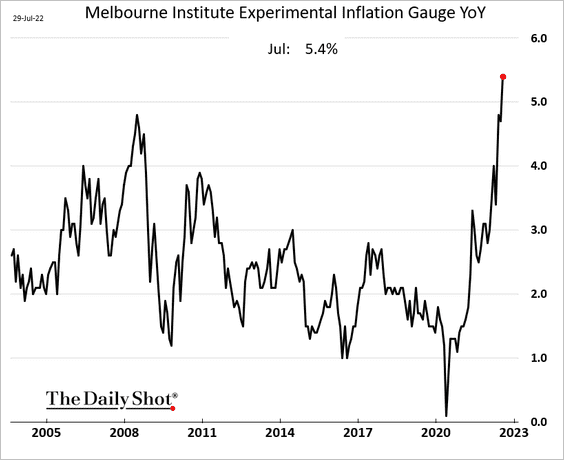
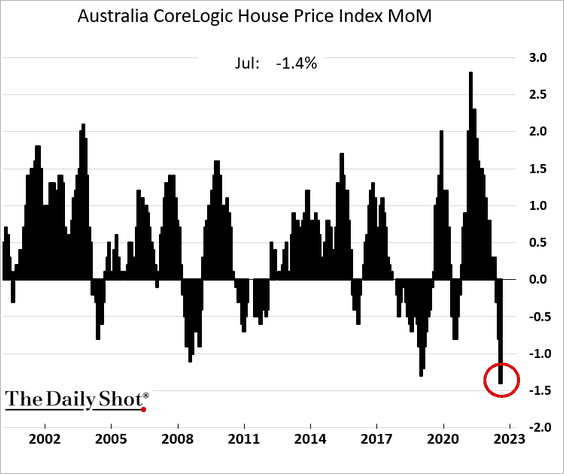
3. Australia’s price pressures continue to worsen.
Home prices declined by most in decades in July,
Back to Index
China
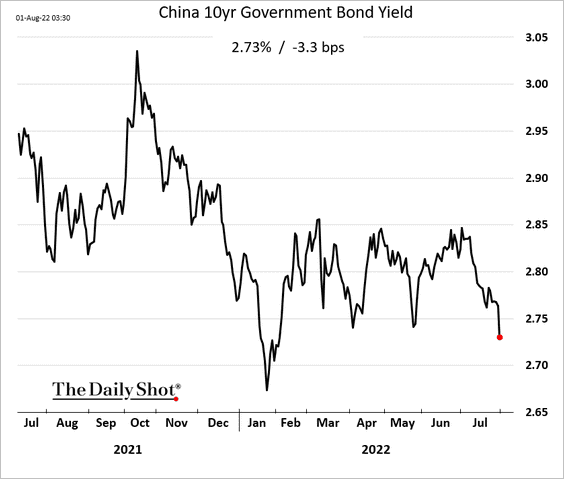
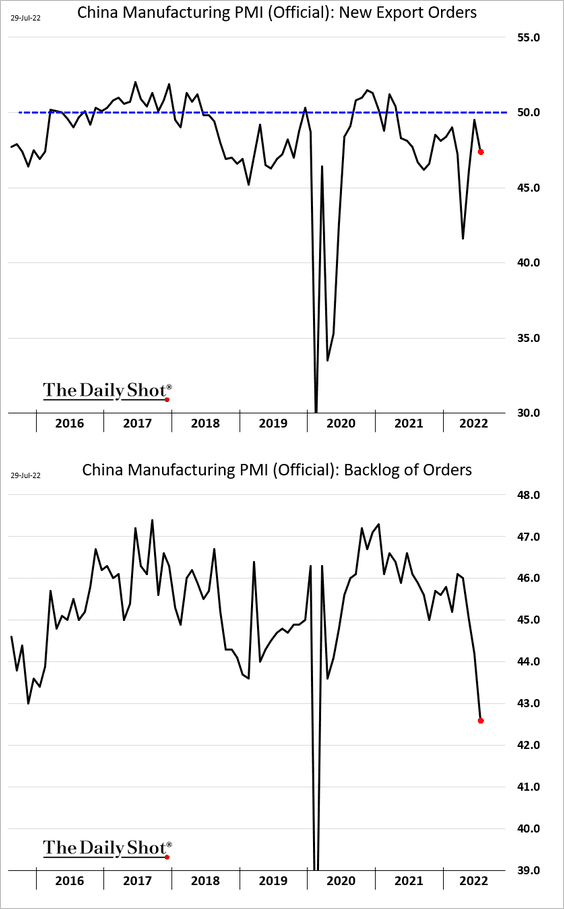
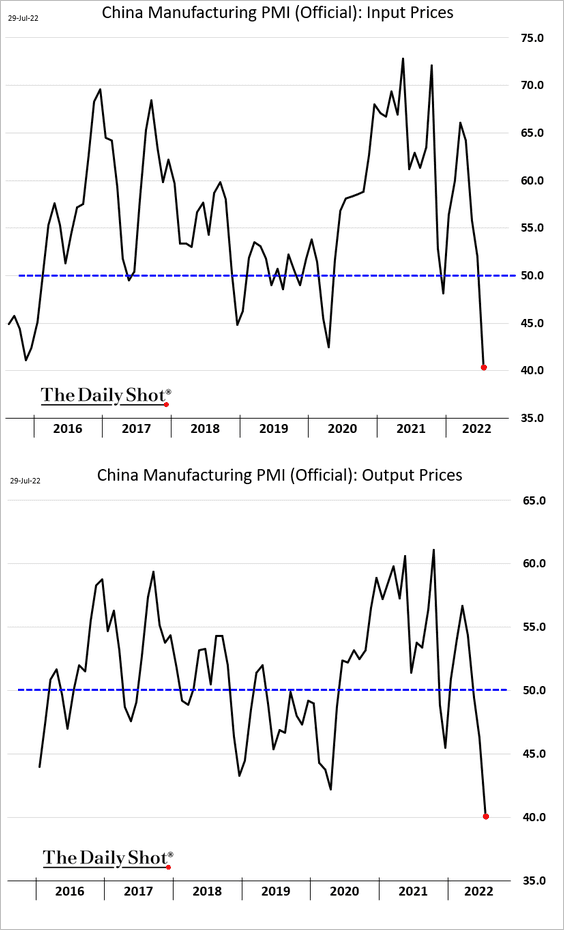
1. China’s official manufacturing PMI unexpectedly showed a contraction in factory activity in July.
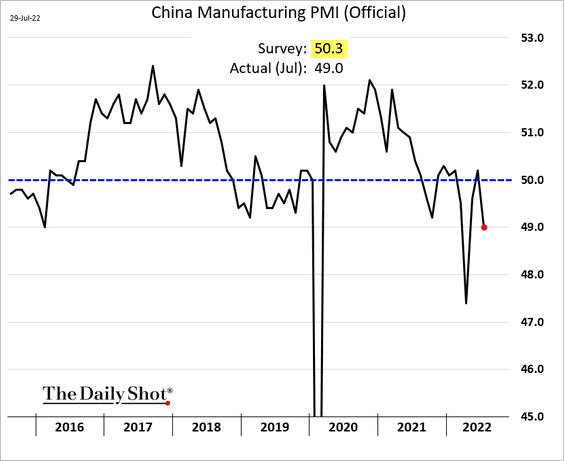
 Source: Reuters Read full article
• Bond yields dropped.
– New export orders and the backlog of orders are shrinking.
– Prices are falling rapidly.
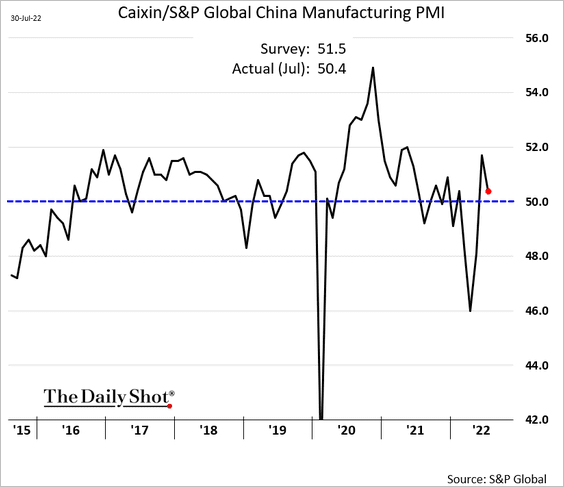
• The S&P Global PMI also declined but held in growth territory.
• Non-manufacturing growth remains robust.

——————–
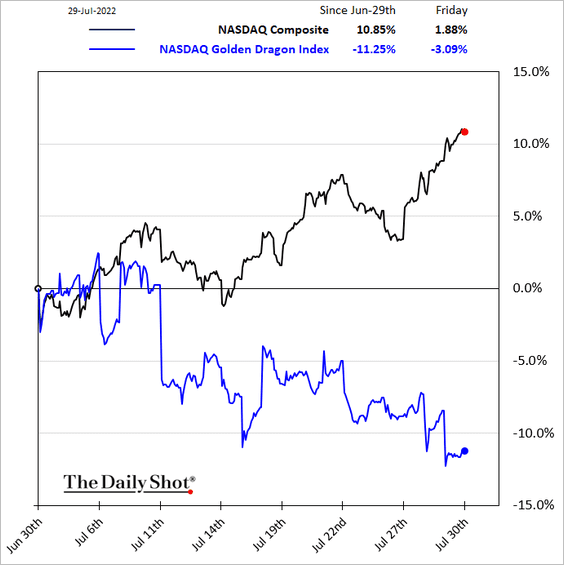
2. US-listed Chinese shares are struggling.
 Source: Reuters Read full article
——————–
3. Evergrande’s creditors are fighting for scraps.
 Source: Bloomberg Read full article
• Bonds trade at 8 cents on the dollar.
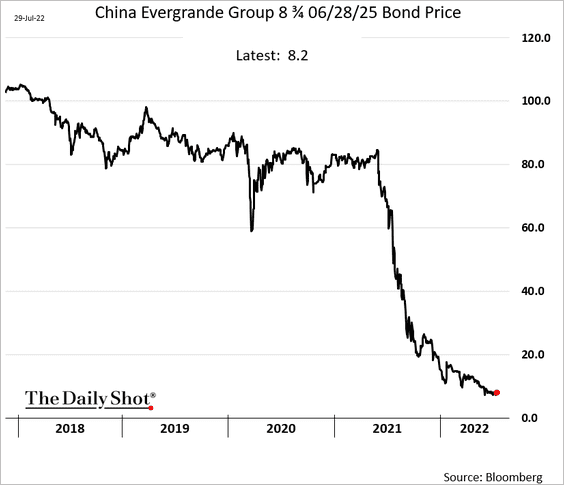
• Sales are down 93%.
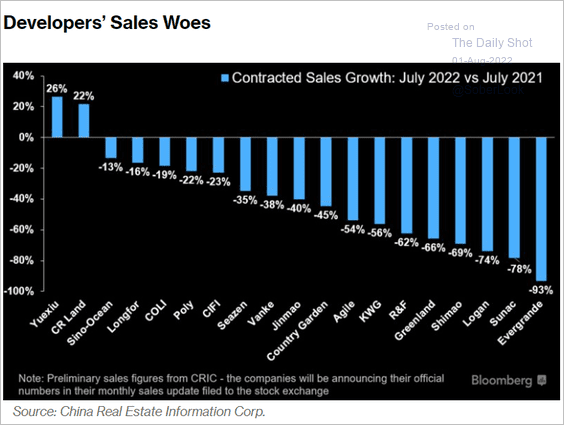 Source: Kristy Hung; @markets Read full article
——————–
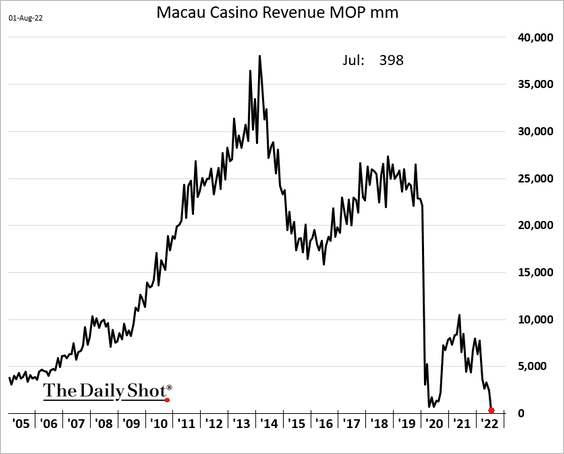
4. Macau casino activity has collapsed.
Back to Index
Emerging Markets
1. Let’s run through Asian PMI reports.
• India (surprisingly strong):
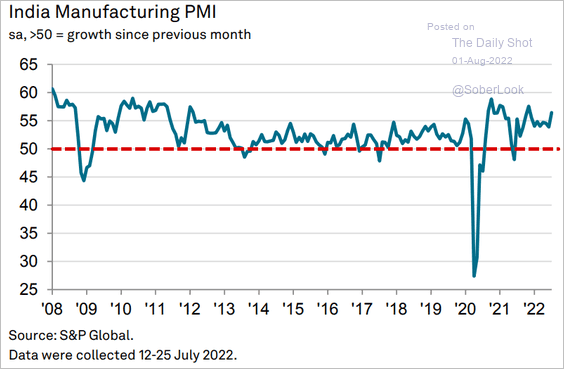 Source: S&P Global PMI
• Thailand (stronger growth):
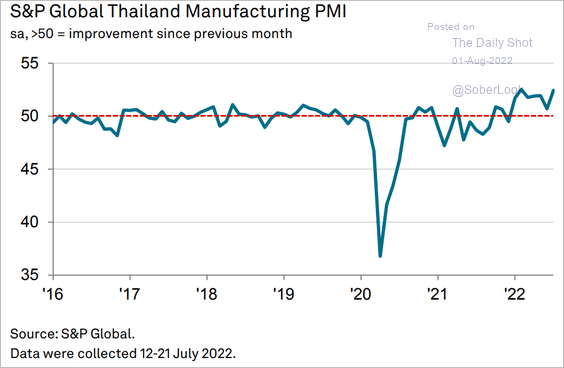 Source: S&P Global PMI
• Malaysia (barely in growth mode):
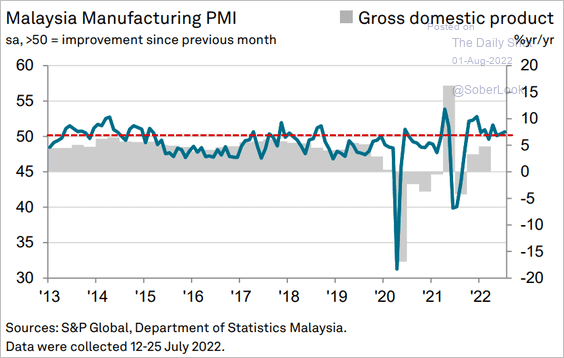 Source: S&P Global PMI
• The Philippines (stalling):
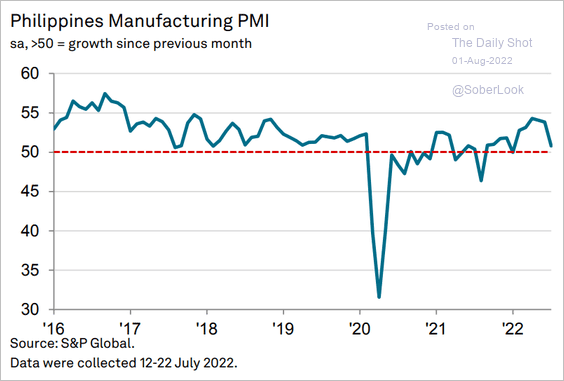 Source: S&P Global PMI
• Vietnam (slowing):
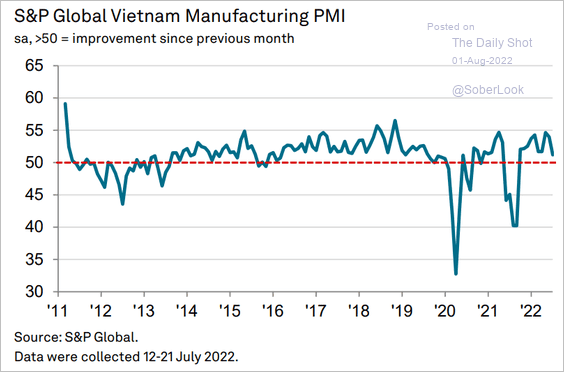 Source: S&P Global PMI
• ASEAN (stable):
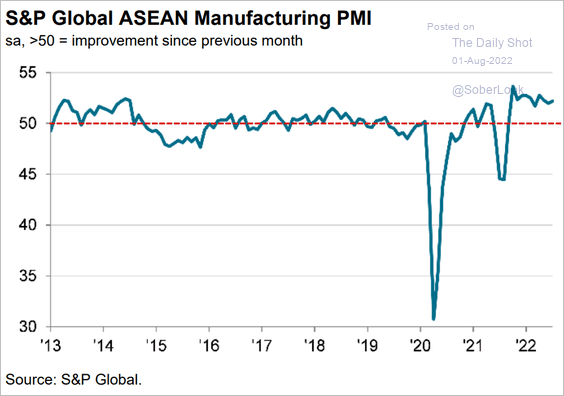 Source: S&P Global PMI
——————–
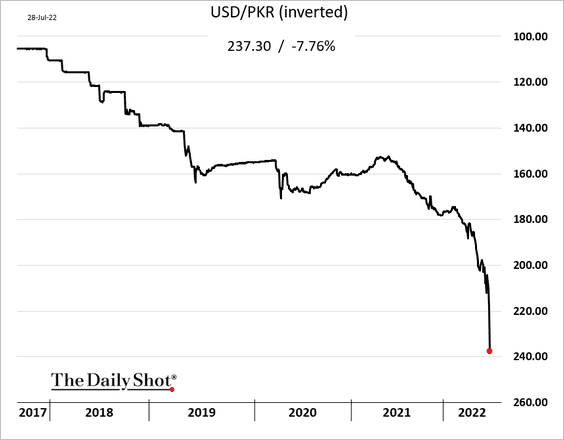
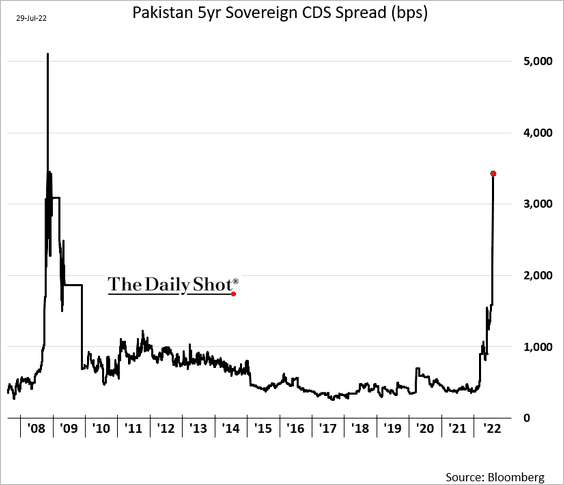
2. Pakistan needs the IMF to speed up the bailout.
 Source: Nikkei Asia Read full article
• The rupee:
• CDS spread:
——————–
3. Next, we have some performance data for July.
• Currencies:
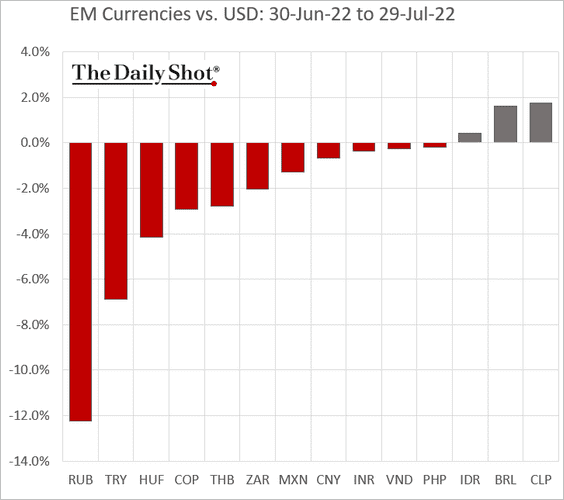
 Source: Scotiabank Economics
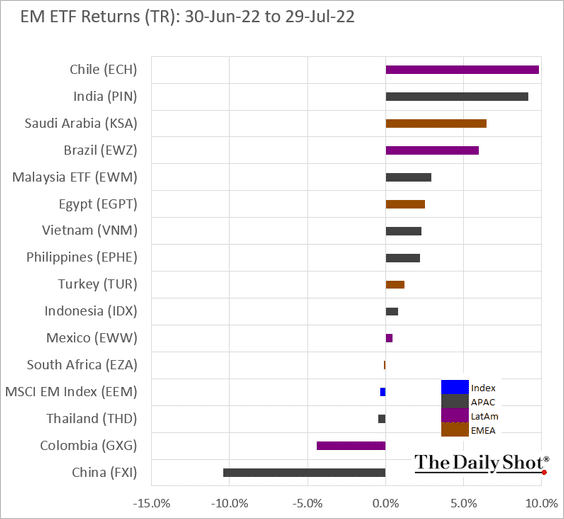
• Equity ETFs:
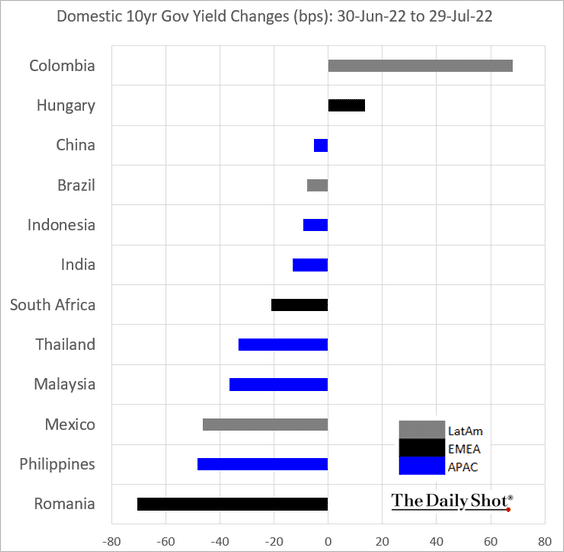
• Bond yields:
Back to Index
Cryptocurrency
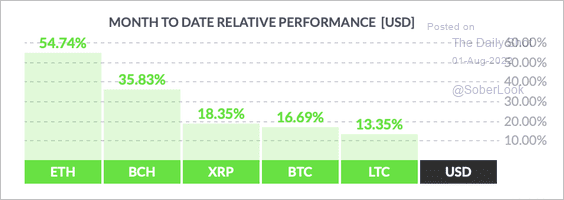
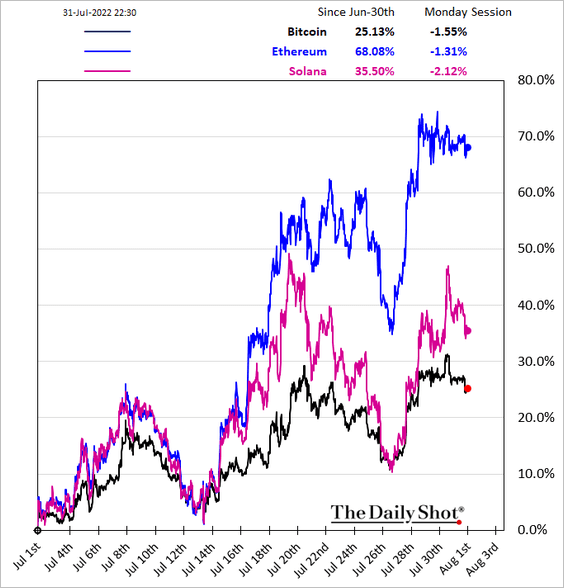
1. July was a strong month for cryptos, with ether (ETH) in the lead among the top tokens.
 Source: FinViz
——————–
2. Bitcoin’s put/call ratio declined sharply over the past week.
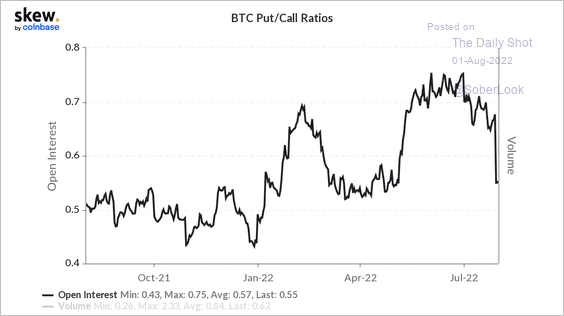 Source: Skew
3. By some measures, bitcoin’s mining difficulty is starting to decline, which means it takes less computing power to verify transactions on the blockchain compared.
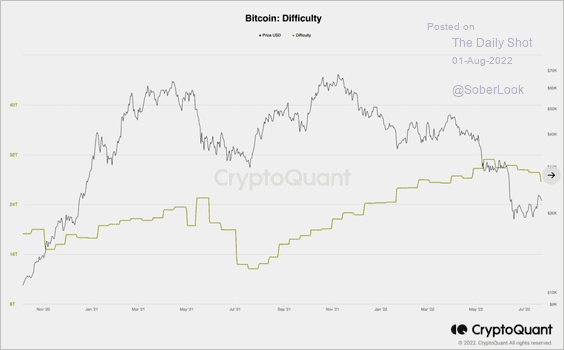 Source: @cryptoquant_com
Back to Index
Commodities
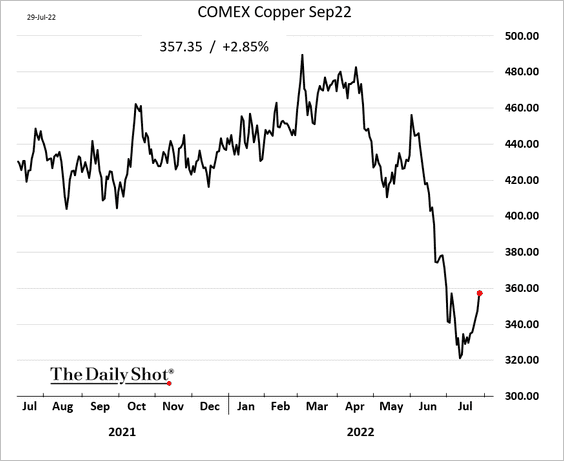
1. Industrial metals are rebounding.
2. COMEX gold futures held support around $1,675.
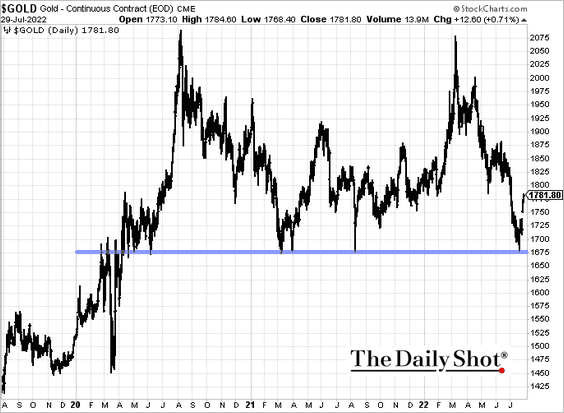 h/t @allstarcharts
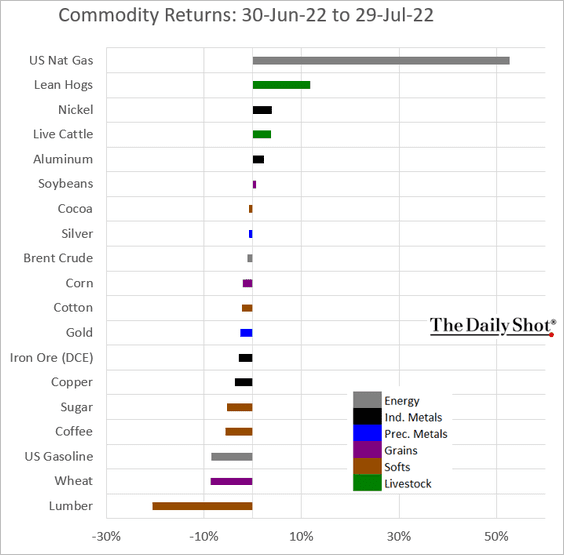
3. Here are the July returns across key commodity markets.
Back to Index
Energy
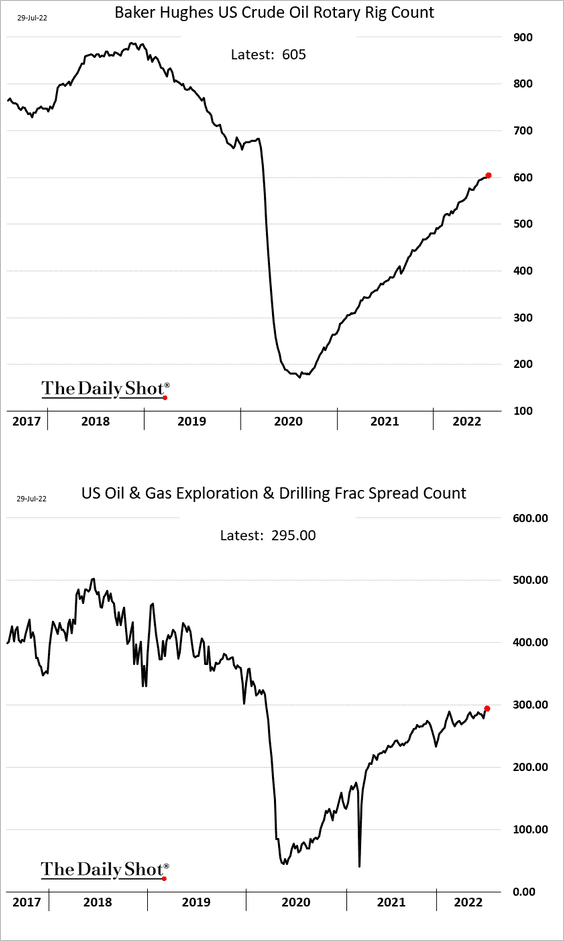
1. US fracking activity continues to recover, …
… as shale companies’ free cash flow surges.
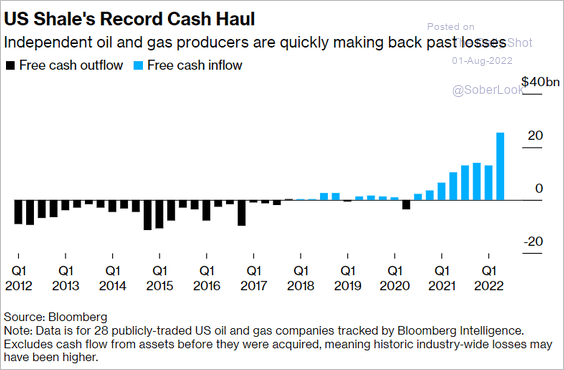 Source: Bloomberg Read full article
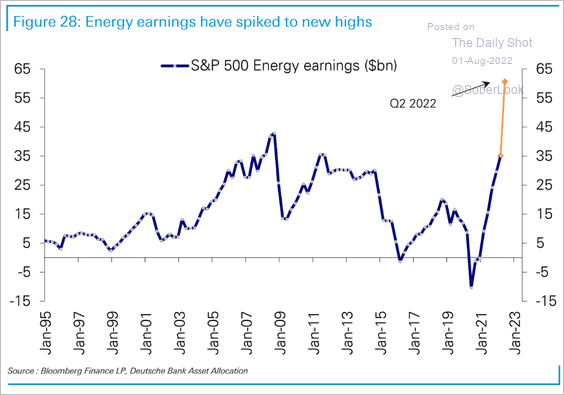
Energy companies’ earnings are hitting record highs.
 Source: Deutsche Bank Research
——————–
2. The global oil supply outlook remains tight as OPEC+ underproduction deepens and geopolitical risks remain elevated.
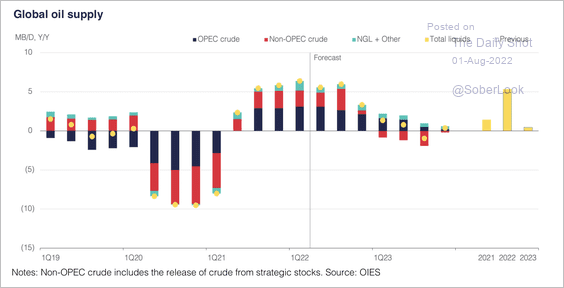 Source: Oxford Institute for Energy Studies
3. Russian refinery runs rebounded in May on higher domestic demand and the restart from prior maintenance. Preliminary data show an increase in June, according to OIES.
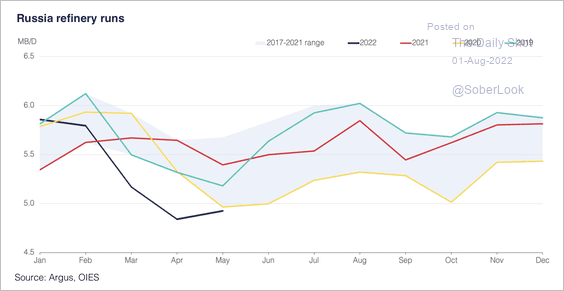 Source: Oxford Institute for Energy Studies
Russian crude oil exports continue to hold above pre-war levels.
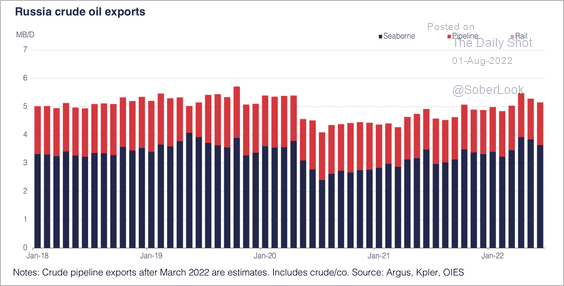 Source: Oxford Institute for Energy Studies
Back to Index
Equities
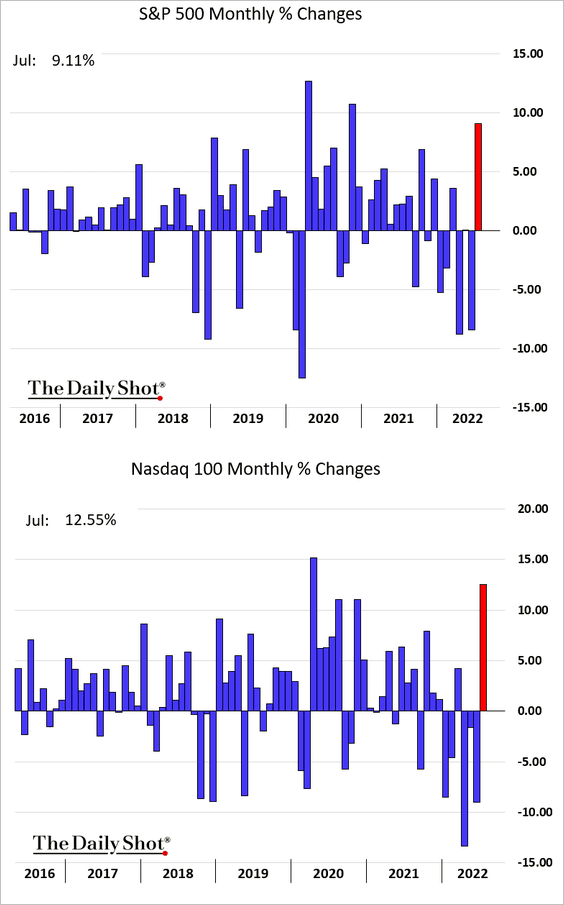
1. July was a good month for stocks.
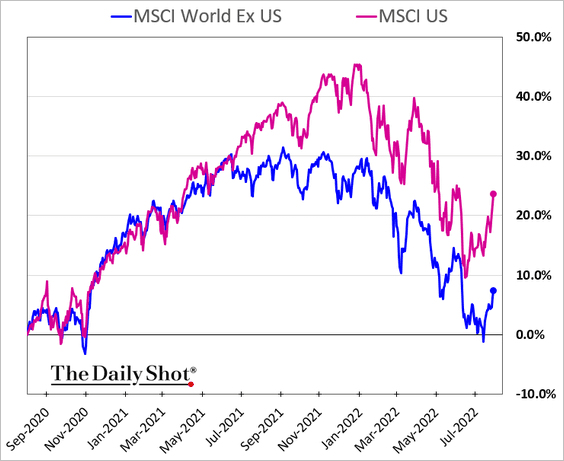
2. US stocks are outperforming global peers.
3. Next, let’s take a look at some stats from the Q2 earnings season.
• Proportion of S&P 500 members beating earnings estimates:
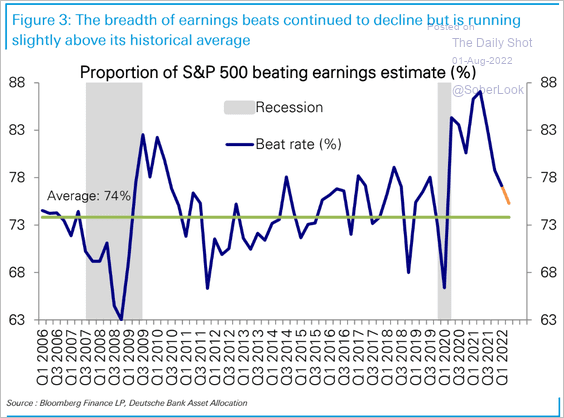 Source: Deutsche Bank Research
• Median earnings beat:
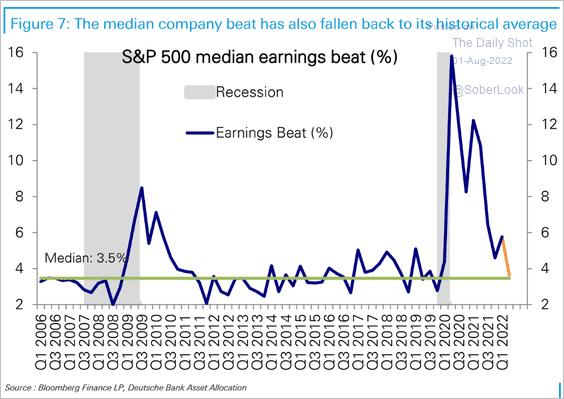 Source: Deutsche Bank Research
• Mega-caps’ revenue growth:
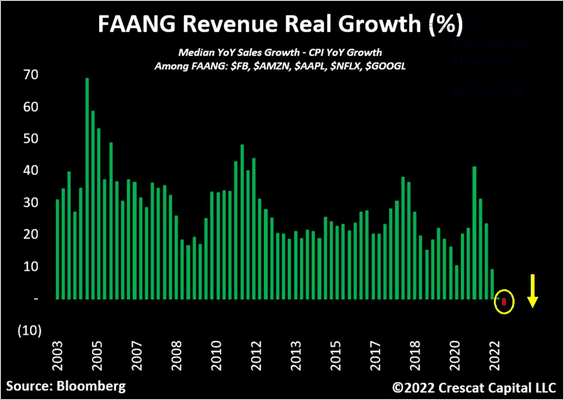 Source: @TaviCosta
• Proportion of S&P 500 members beating margin estimates:
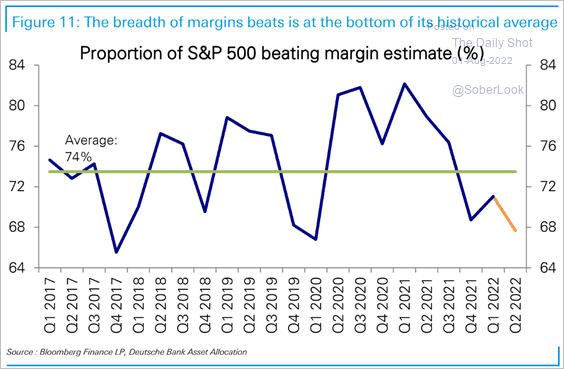 Source: Deutsche Bank Research
Margins are still expected to hit record highs next year. Too optimistic?
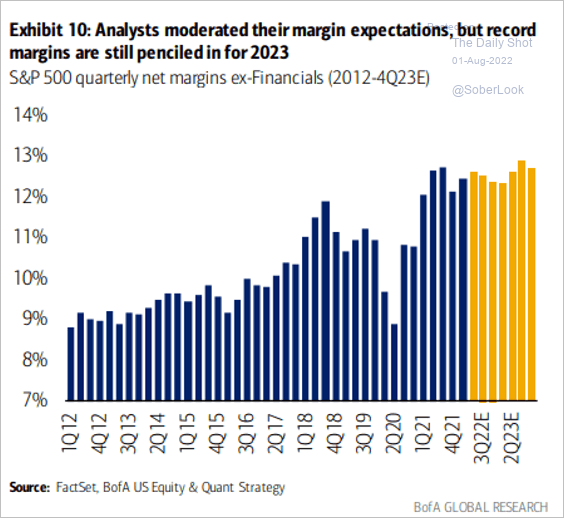 Source: BofA Global Research
• The market has been very forgiving to companies that missed earnings forecasts.
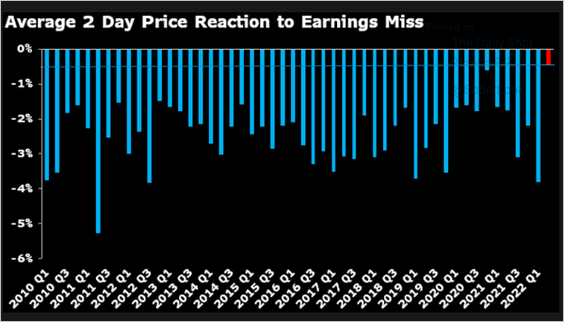 Source: @GinaMartinAdams
——————–
4. Here are some sector updates.
• Consumer discretionary has the highest probability of outperformance six months after a technical recession, especially a significant sell-off (2 charts).
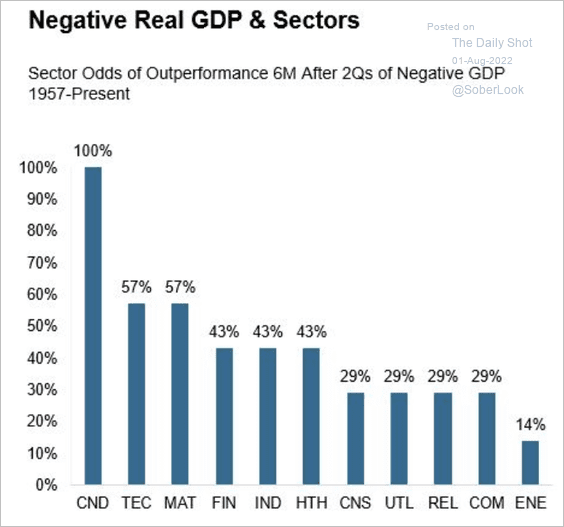 Source: Denise Chisholm, Fidelity Investments
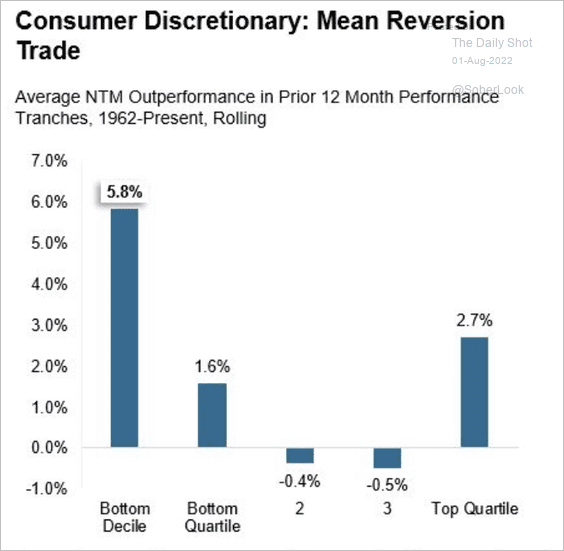 Source: Denise Chisholm, Fidelity Investments
• Banks’ interest margins are surging …
 Source: Bloomberg Read full article
… amid exceptionally low interest rates on deposits (numbers below are in %).
 Source: LendingTree
• Energy and materials have been capped below a long-term downtrend relative to the S&P 500.
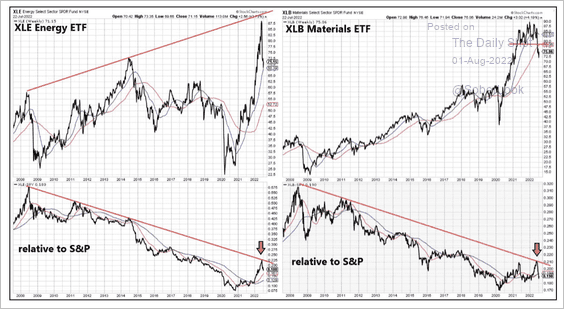 Source: @dlundgren3333
——————–
5. Over 55% of S&P 500 members closed at new 20-day highs.
 Source: @WillieDelwiche
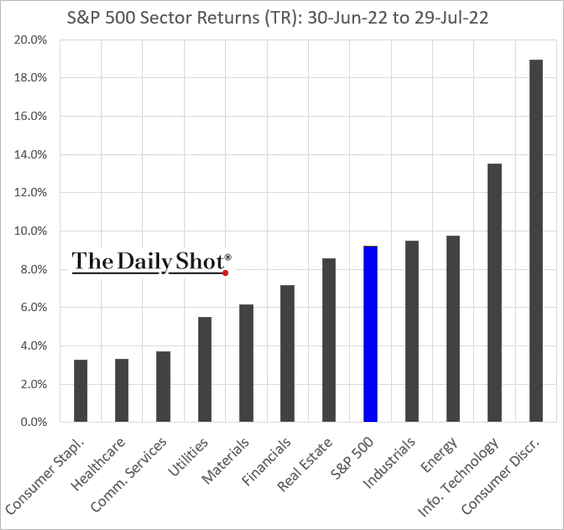
6. Next, we have some performance data for July.
• Sectors:
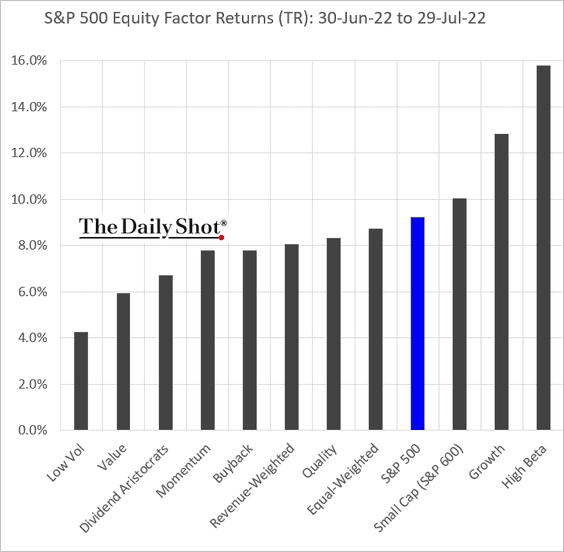
• Equity factors:
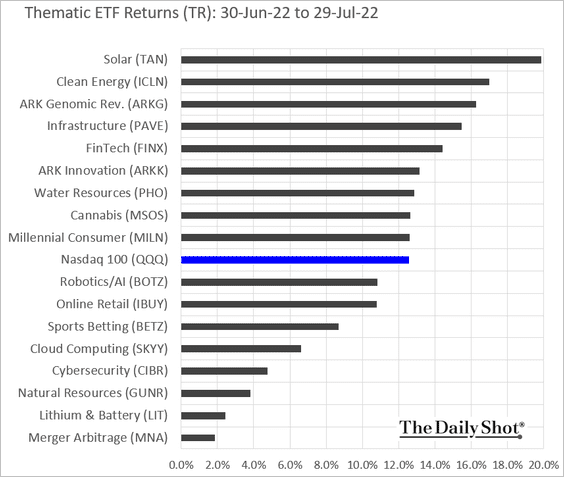
• Thematic ETFs:
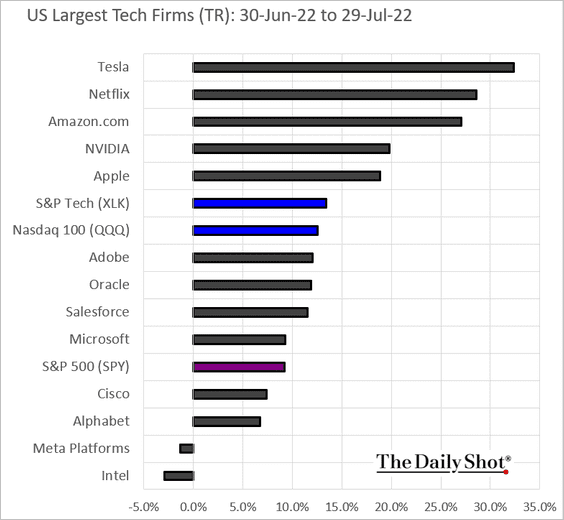
• Largest tech firms:
——————–
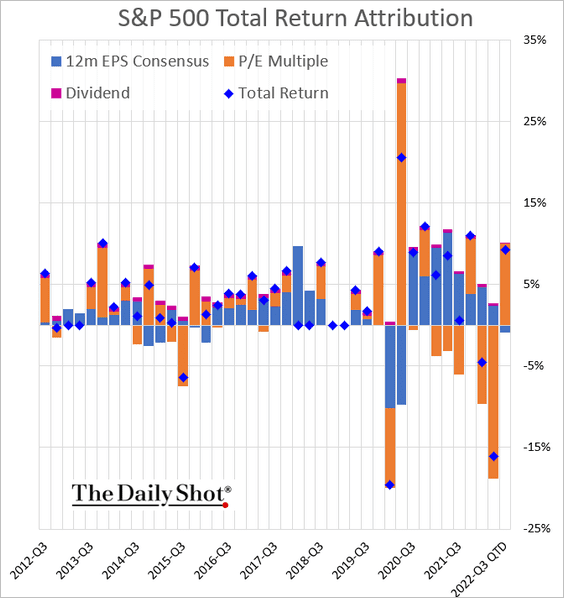
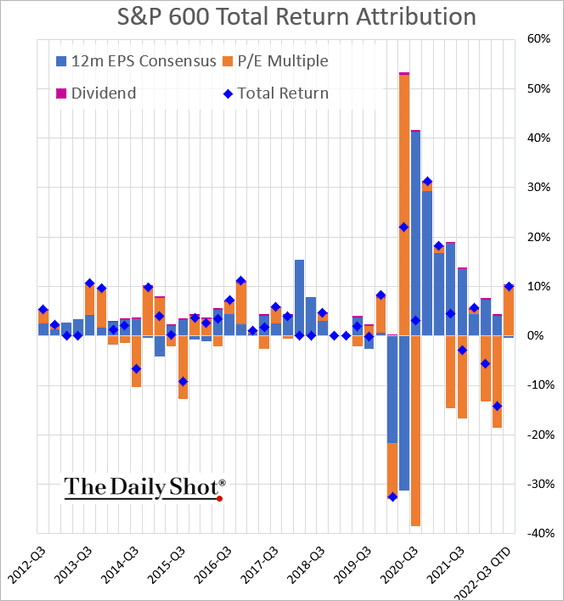
7. Finally, here is the quarterly performance attribution:
• S&P 500:
• S&P 600 (small caps):
Back to Index
Credit
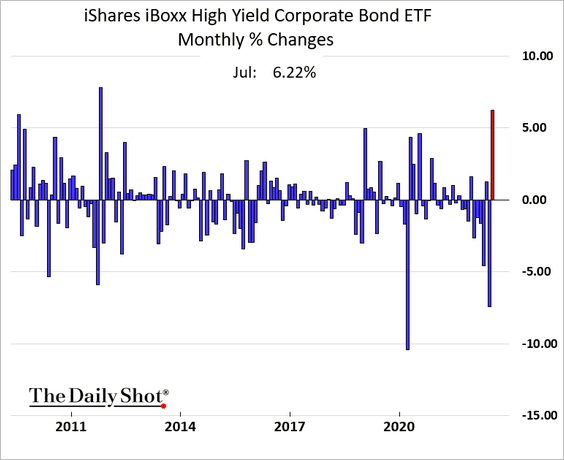
1. July was a good month for high-yield bonds:
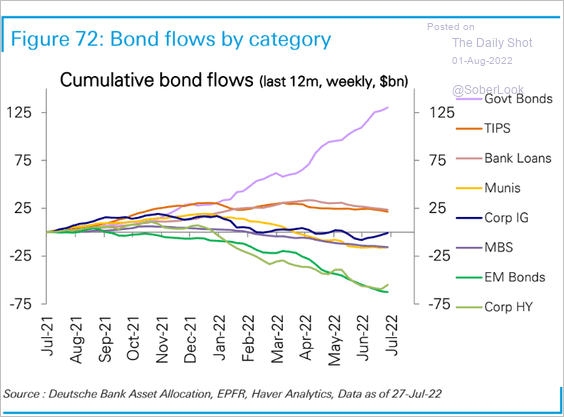
Have HY flows finally bottomed?
 Source: Deutsche Bank Research
——————–
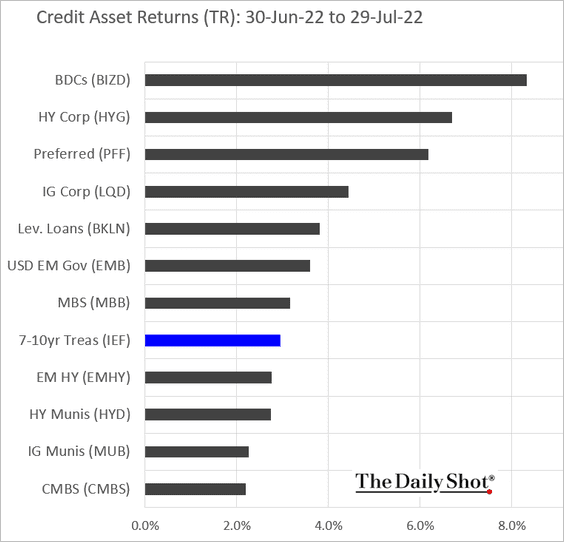
2. Here is the July performance by asset class.
Back to Index
Rates
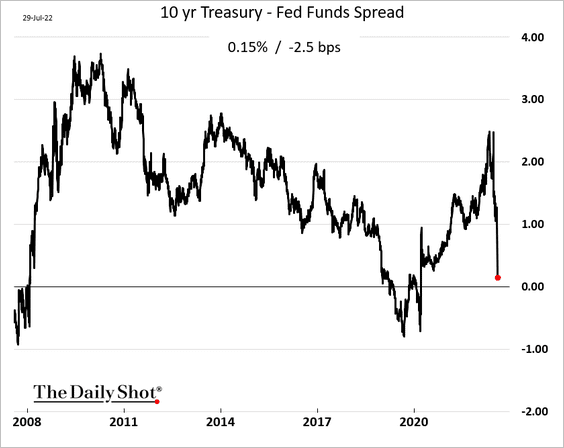
1. The spread between the 10-year Treasury yield and the fed funds rate is rapidly tightening.
2. More downside for Treasury yields?
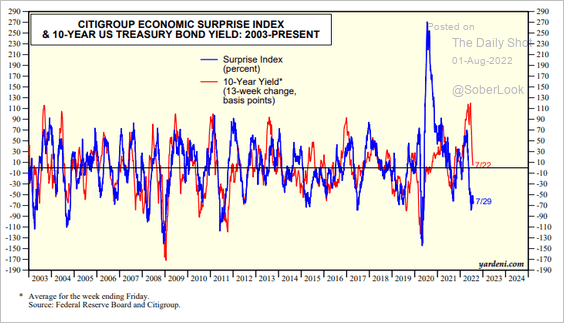 Source: Yardeni Research
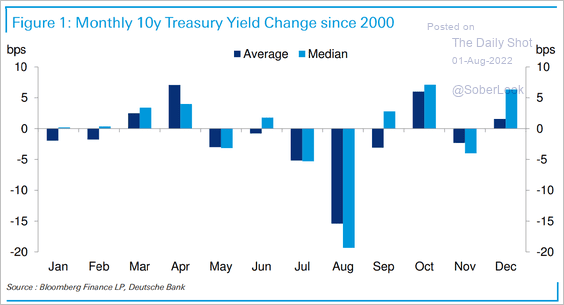
3. The 10-year Treasury yield tends to decline in August. One reason is that bond supply drops in the summer, especially in corporates, leaving investors to park cash in Treasuries while they wait for issuance to pick up, according to Deutsche Bank.
 Source: Deutsche Bank Research
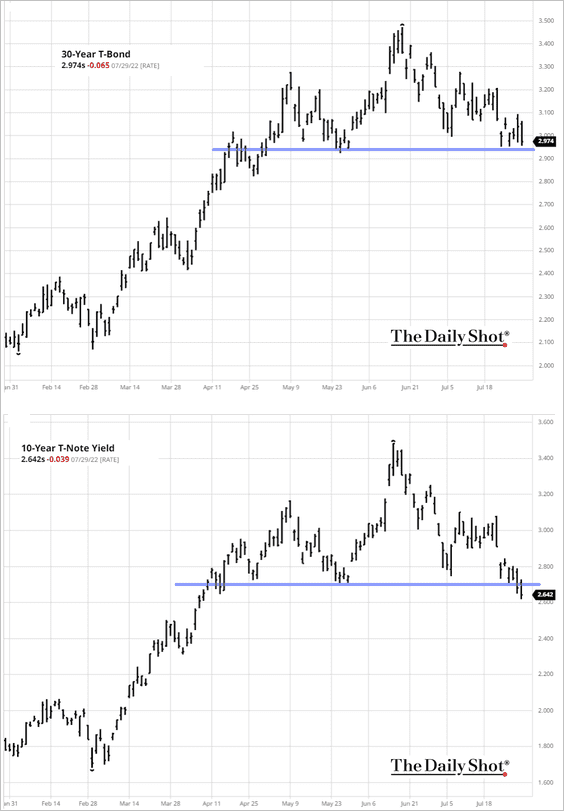
4. The 30-year yield is holding support, but not the 10-year.
 Source: barchart.com
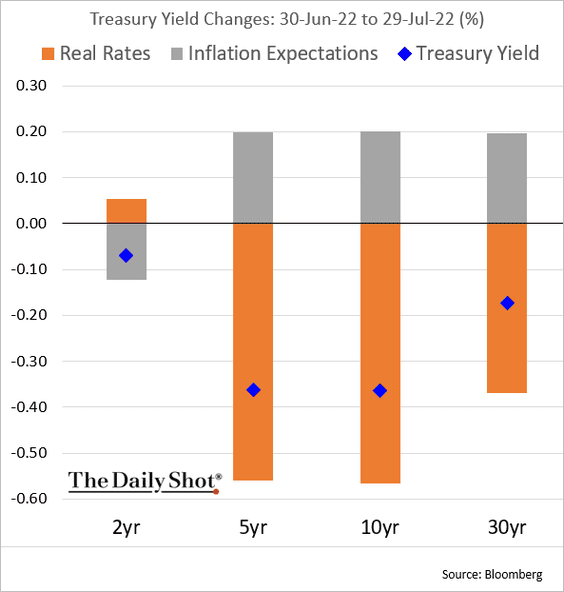
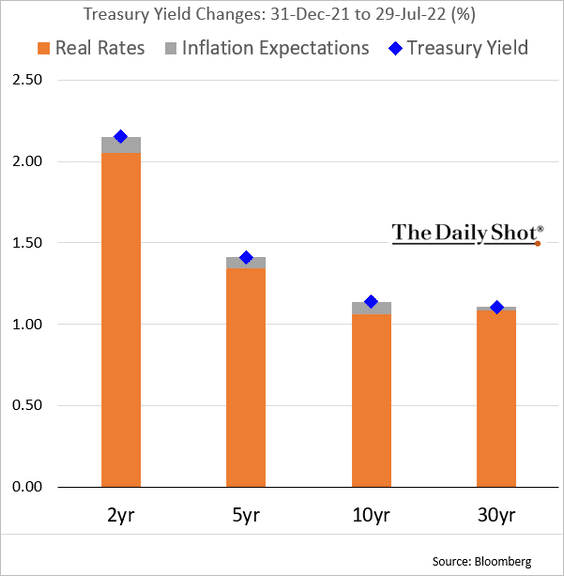
5. Finally, we have some attribution data for Treasury yields.
• July:
• Year-to-date:
——————–
Food for Thought
1. Airport delays:
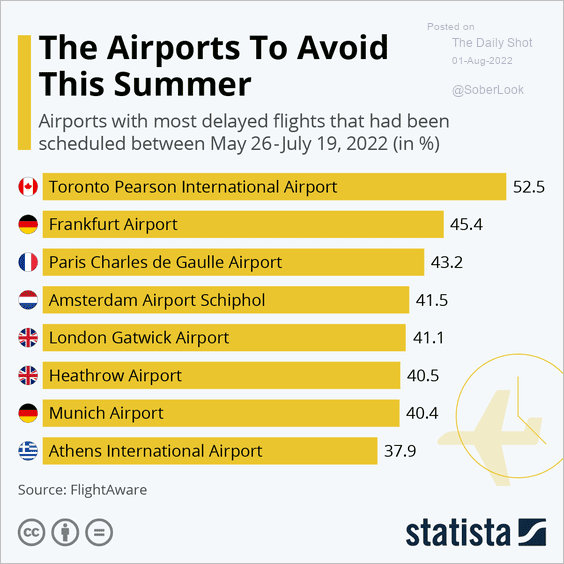 Source: Statista
2. US gasoline prices adjusted for wages:
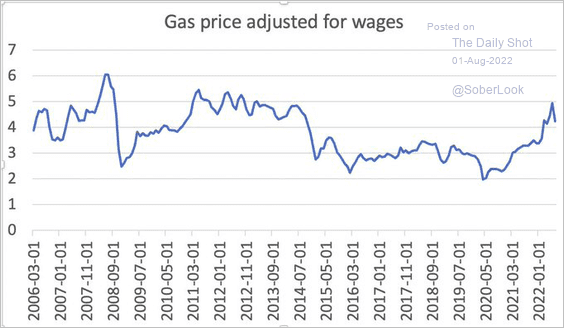 Source: @paulkrugman
3. Monkeypox vaccine rollout:
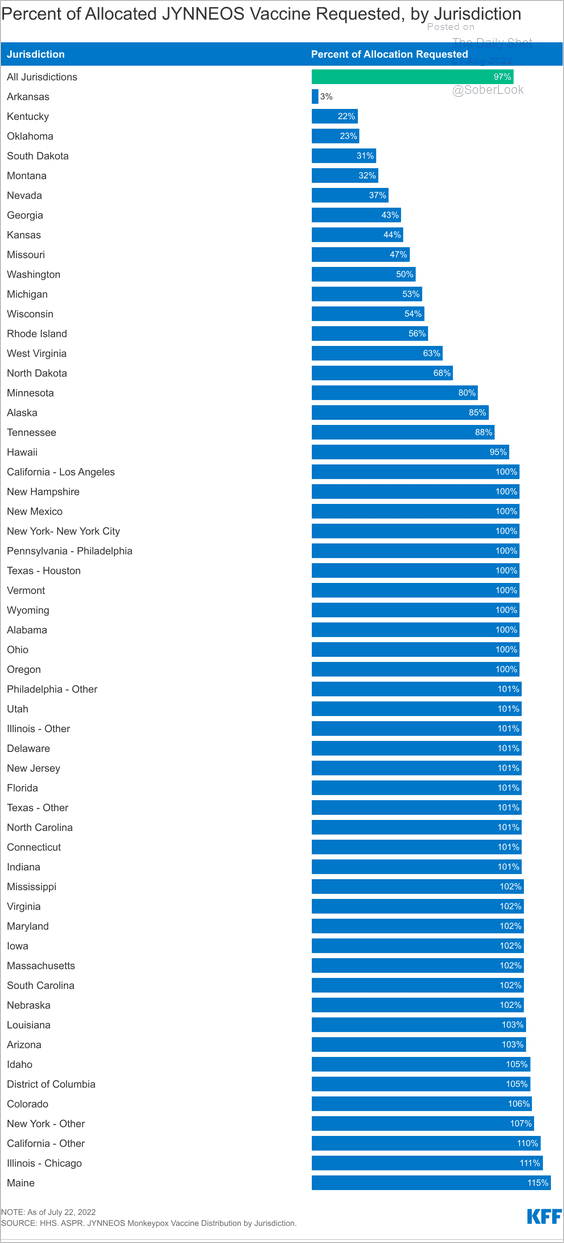 Source: KFF Read full article
4. The balance of power in Congress after the 2022 election, according to the betting markets:
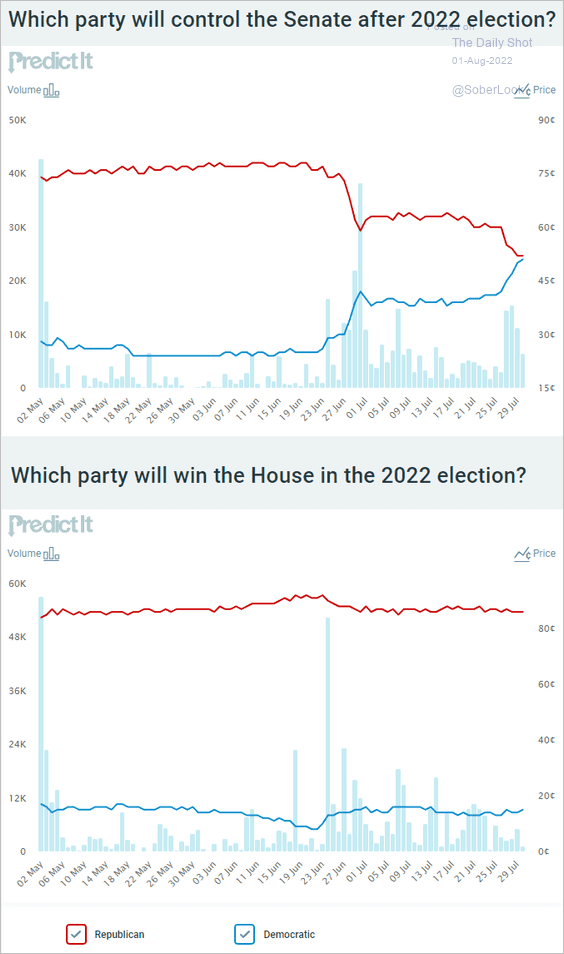 Source: @PredictIt
5. President Biden’s approval ratings:
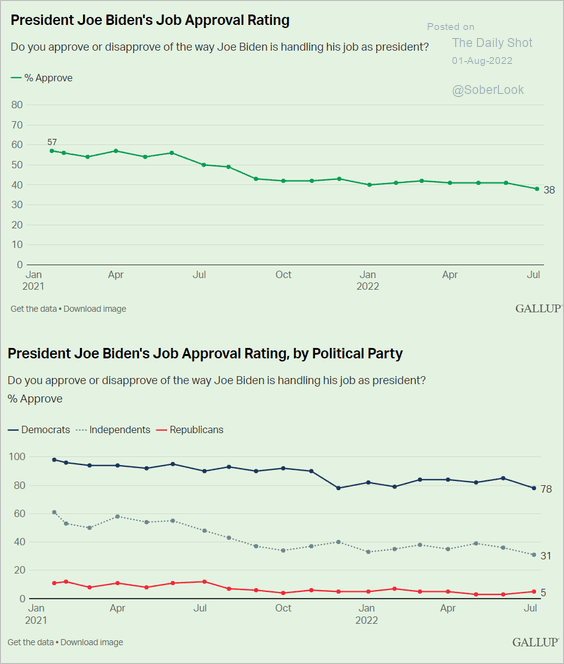 Source: Gallup Read full article
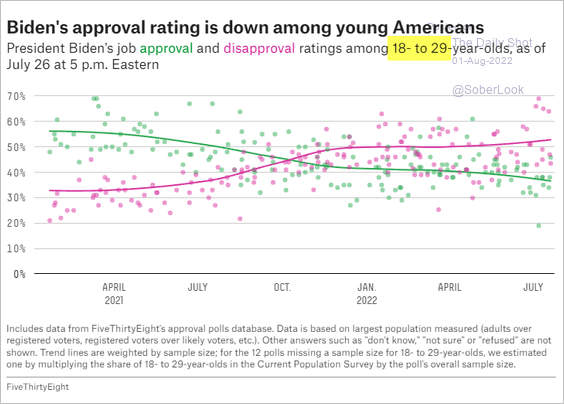 Source: FiveThirtyEight Read full article
——————–
6. Number of skyscrapers by city:
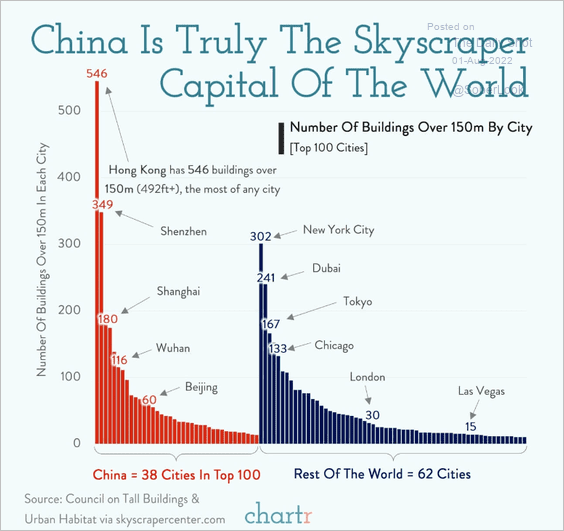 Source: @chartrdaily
——————–
Back to Index