
The Daily Shot: 02-Aug-22
• The United States
• The Eurozone
• Europe
• Asia – Pacific
• China
• Emerging Markets
• Cryptocurrency
• Commodities
• Energy
• Equities
• Global Developments
• Food for Thought
The United States
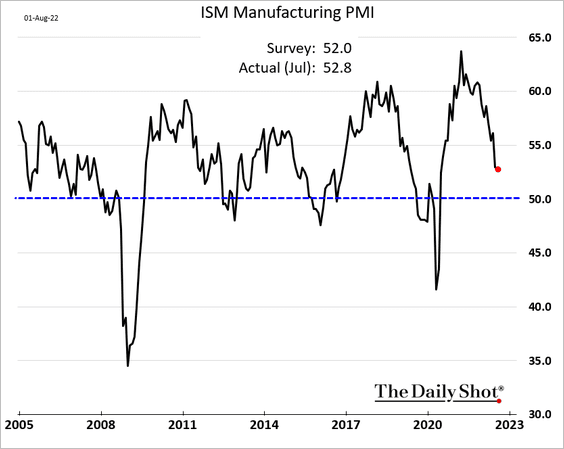
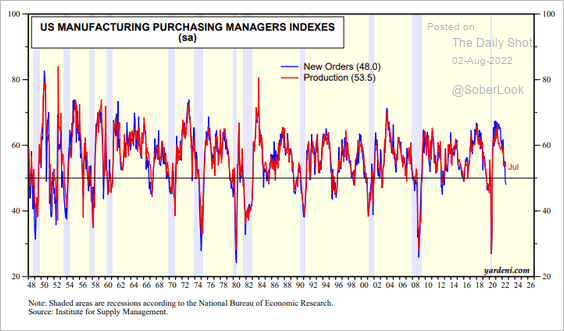
1. The ISM Manufacturing PMI report was a bit better than expected, showing factory activity still expanding in July.
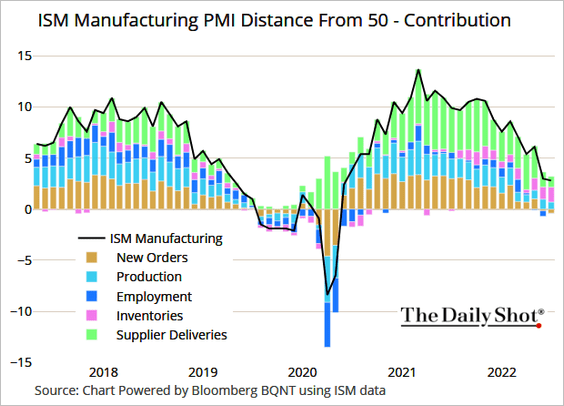
Here are the contributions to the index.
 Source: @TheTerminal, Bloomberg Finance L.P.
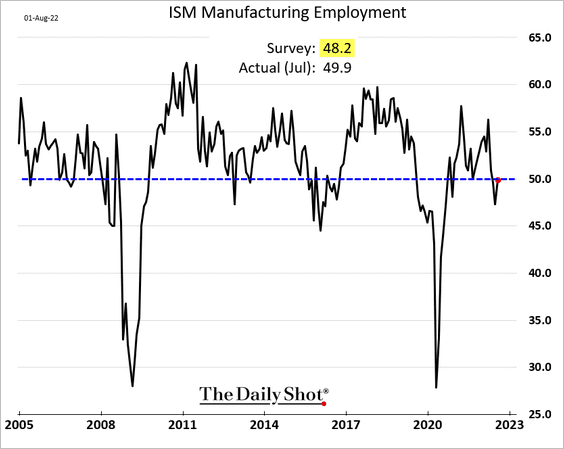
Manufacturing employment is no longer shrinking.
However, forward-looking indicators show trouble ahead for manufacturing growth.
• Demand is shrinking.
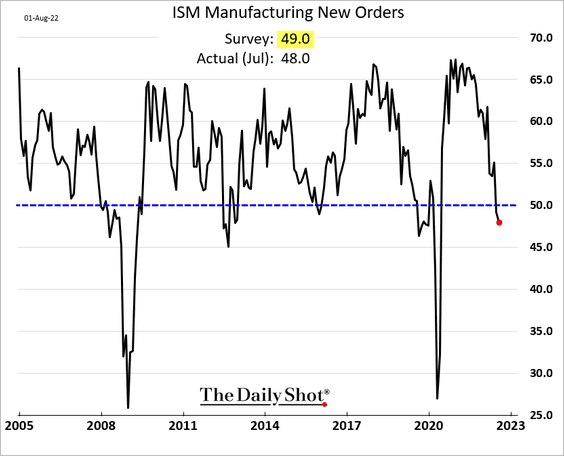
And falling new orders usually signal slower production ahead.
 Source: Yardeni Research
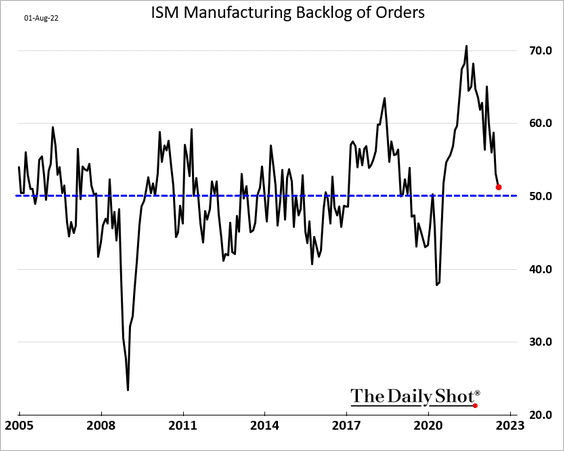
Growth in the backlog of orders has slowed further.
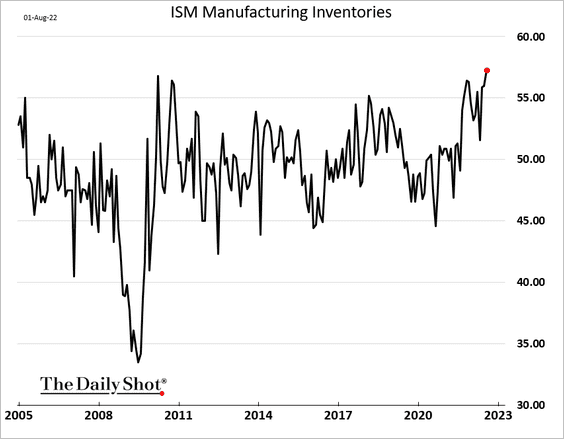
• Inventories are rising quickly.
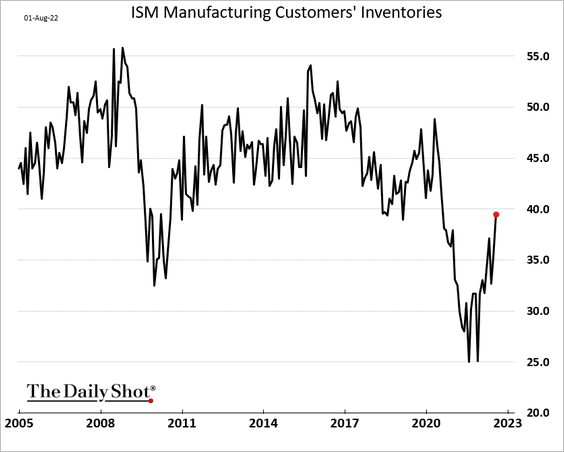
And customers’ inventories are improving.
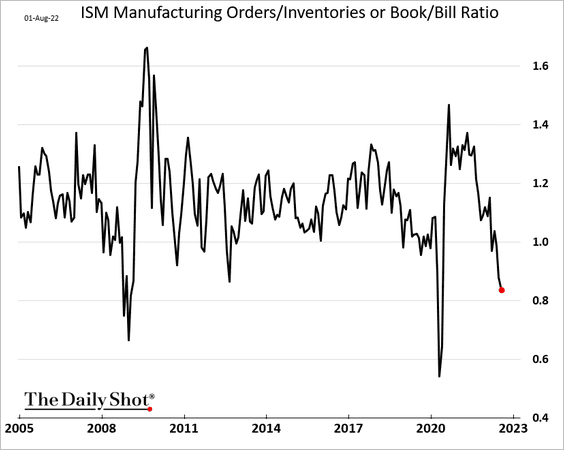
• Here is the ISM orders-to-inventory ratio.
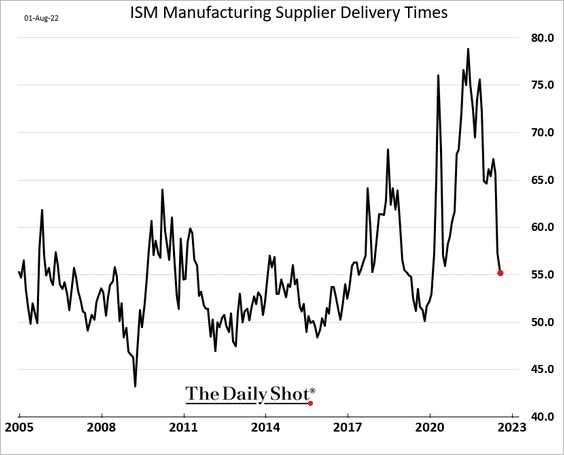
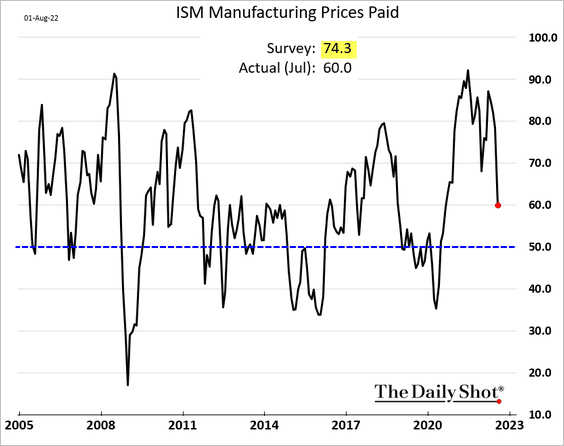
Supply stress and price pressures are easing as demand wanes.
– Supplier delivery times:
– Input prices:
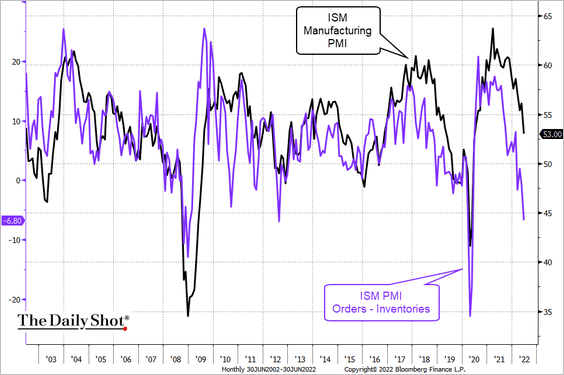
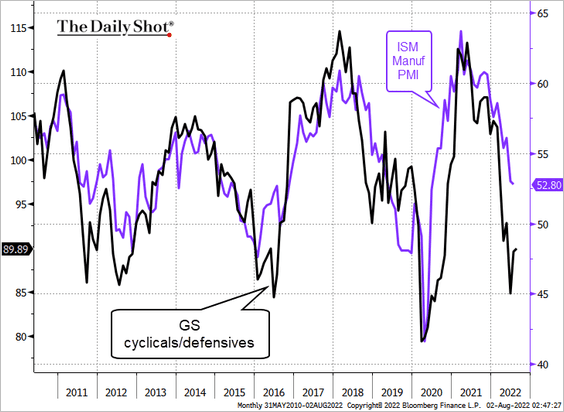
Leading indicators signal weakness ahead for the ISM Manufacturing PMI.
• The headline ISM index vs. the spread between ISM orders and inventories:
• ISM vs. the stock market:
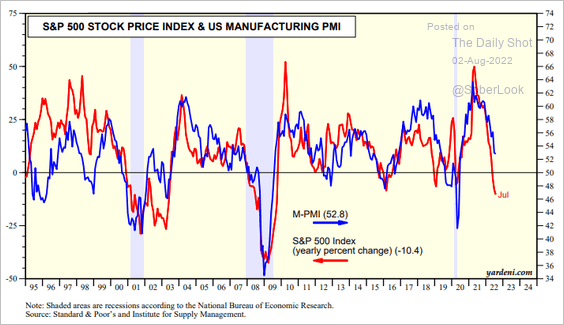 Source: Yardeni Research
• ISM vs. the cyclicals/defensives ratio (cyclical sector shares vs. defensive shares):
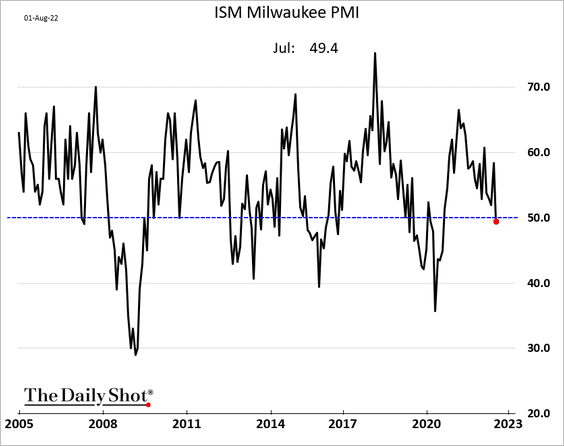
A separate index showed the Milwaukee-area business activity entering contraction territory (Milwaukee is a major manufacturing hub).
——————–
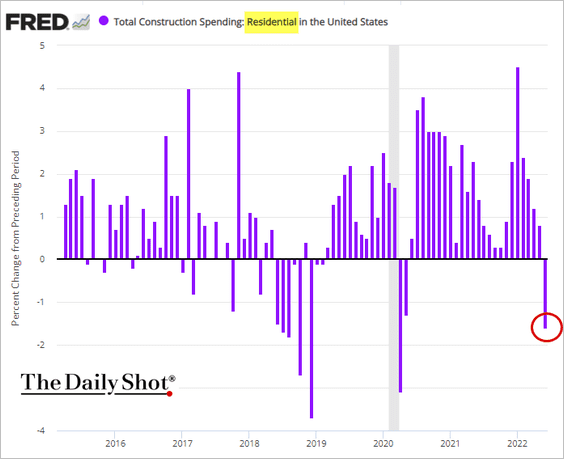
2. Construction spending unexpectedly declined in June, …
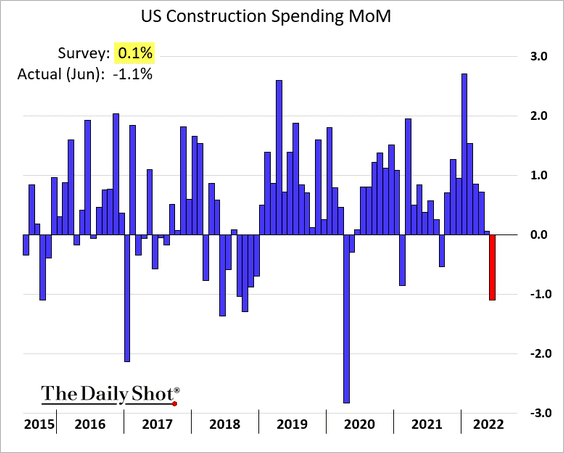
… driven by weakness in residential investment.
 Source: Reuters Read full article
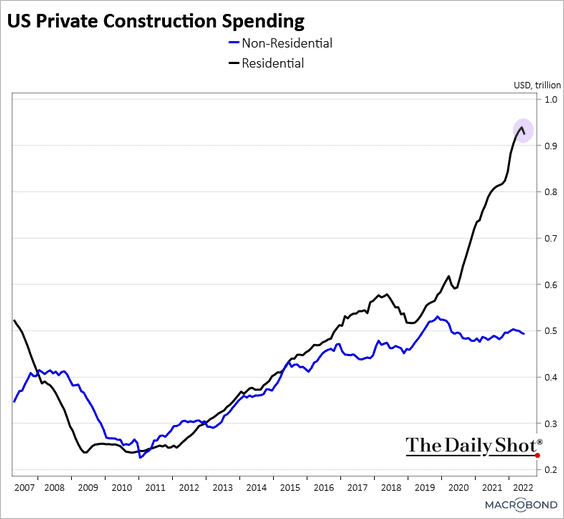
• Has residential investment peaked for now?
 Source: Chart and data provided by Macrobond
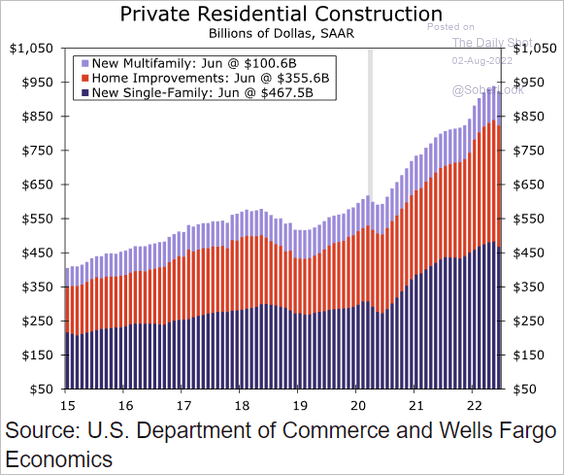
• Here is the breakdown of residential spending.
 Source: Wells Fargo Securities
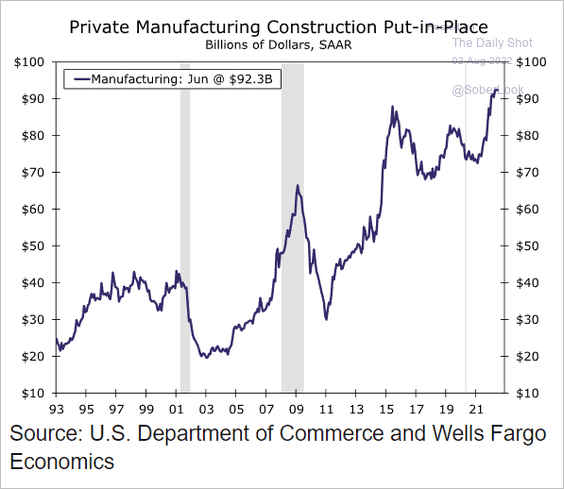
• Manufacturing construction spending is at record highs.
 Source: Wells Fargo Securities
——————–
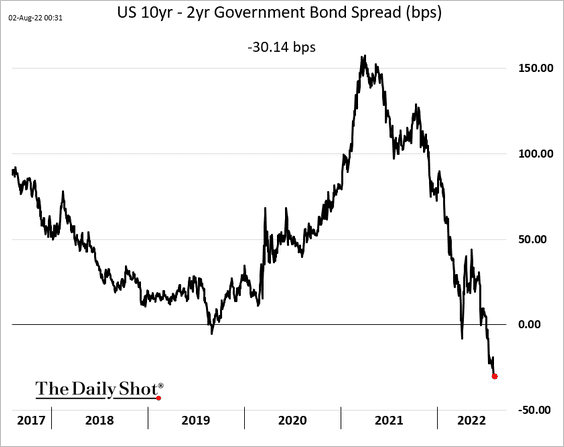
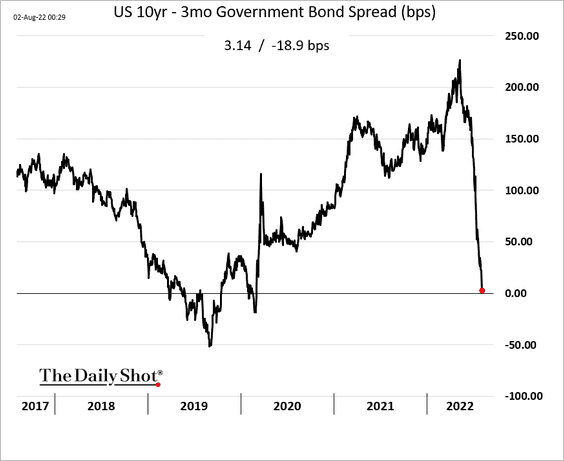
3. The Treasury curve inversion has deepened further.
The 10-year – 3-month portion of the yield curve is about to invert. Some economists prefer this metric as a leading indicator of economic activity.
——————–
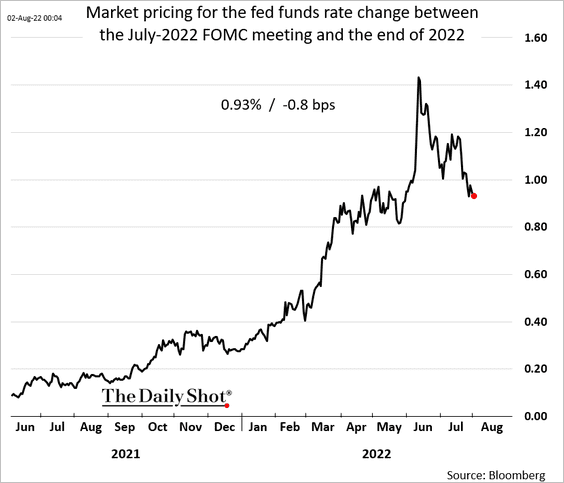
4. Fed rate hike expectations for the rest of the year continue to ease. The market is now pricing in another 93 bps.
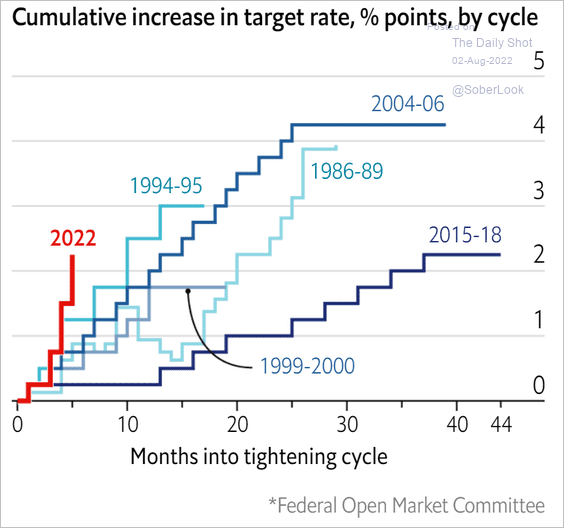
• The pace of rate hikes in this cycle has been unusually steep.
 Source: The Economist Read full article
• But the real fed funds rate is still deep in negative territory.
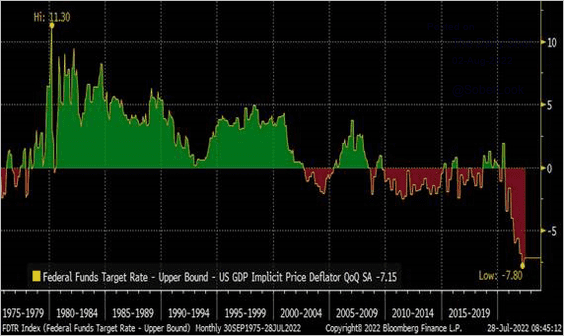 Source: @RBAdvisors
——————–
5. Mortgage bond spreads to Treasuries are tightening as rates volatility eases. As a result, we should see lower mortgage rates.
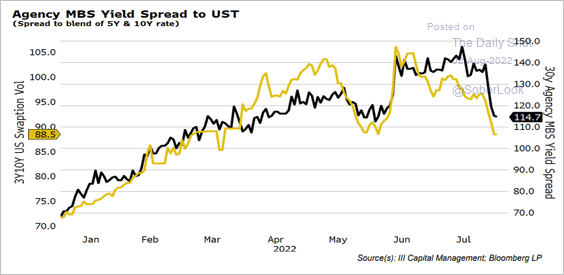 Source: III Capital Management
——————–
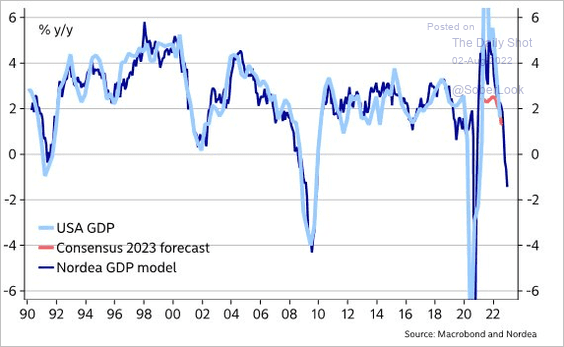
6. Next, we have some updates on economic growth.
• There is a wide gap between gross domestic income (GDI) and GDP. Will we see upward revisions?
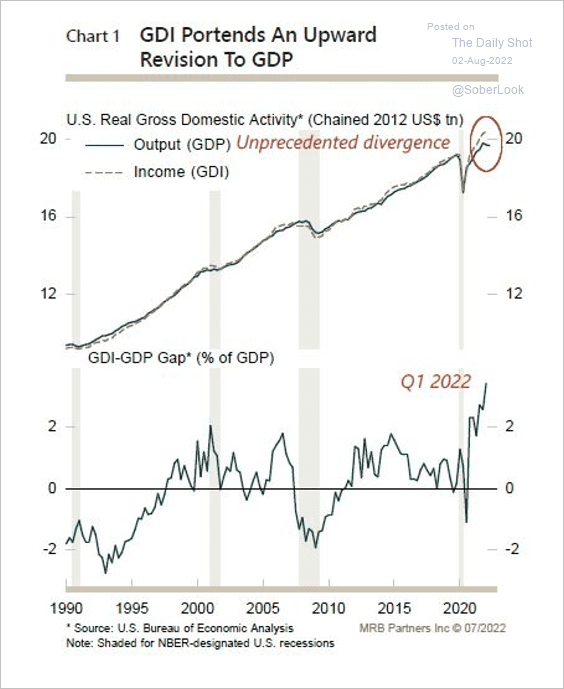 Source: MRB Partners
• The Atlanta Fed’s model for Q3 GDP growth is moving lower.
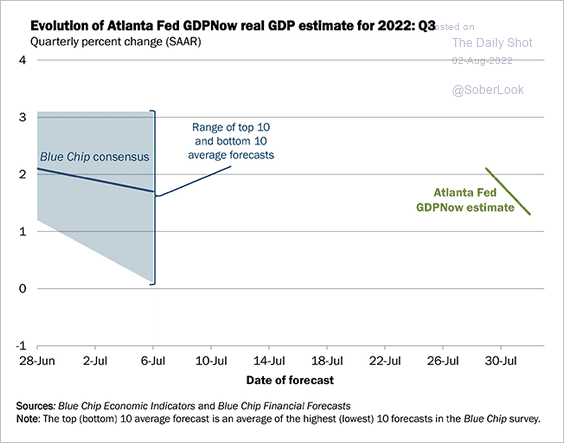 Source: @AtlantaFed Read full article
• Leading indicators (such as the ISM new orders index above) point to further weakness in economic growth.
 Source: @MikaelSarwe
• The cyclical component of the GDP appears to be peaking.
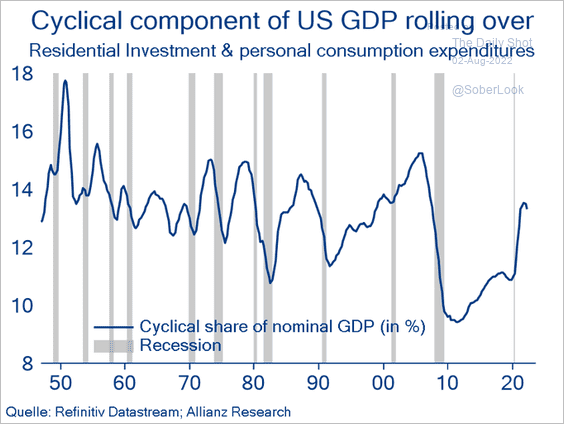 Source: @PatrickKrizan
——————–
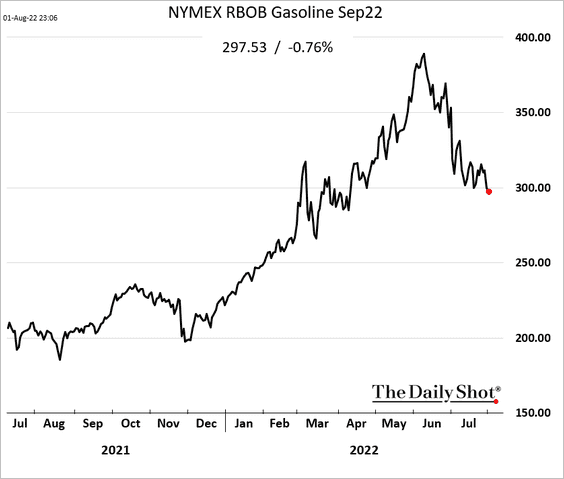
7. Gasoline futures dipped below $3/gal, pointing to lower prices at the pump.
Back to Index
The Eurozone
1. The updated PMI report showed factory activity contracting in most economies.
• Italy:
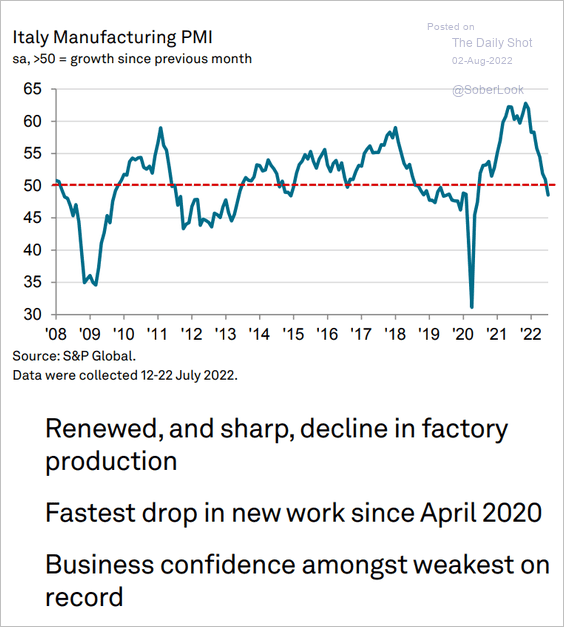 Source: S&P Global PMI
• Spain:
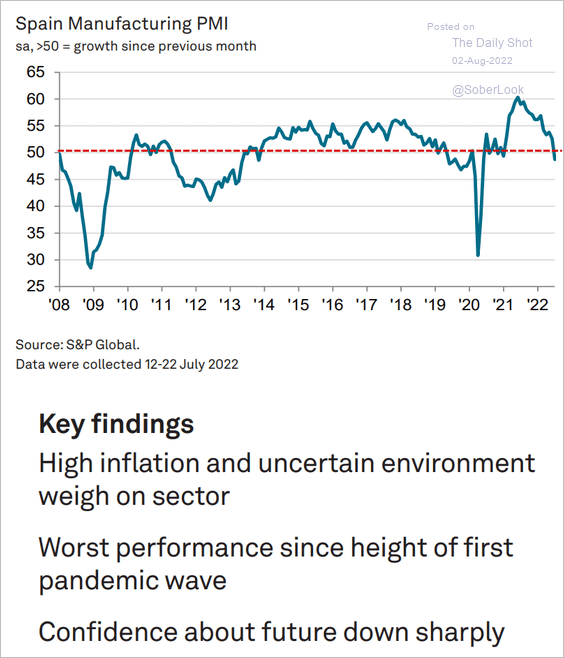 Source: S&P Global PMI
• The Netherlands is one of the exceptions.
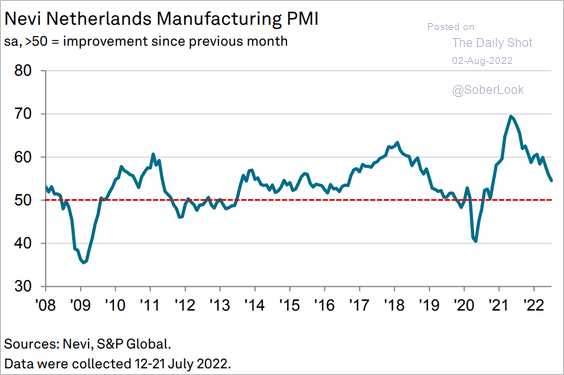 Source: S&P Global PMI
• The Eurozone:
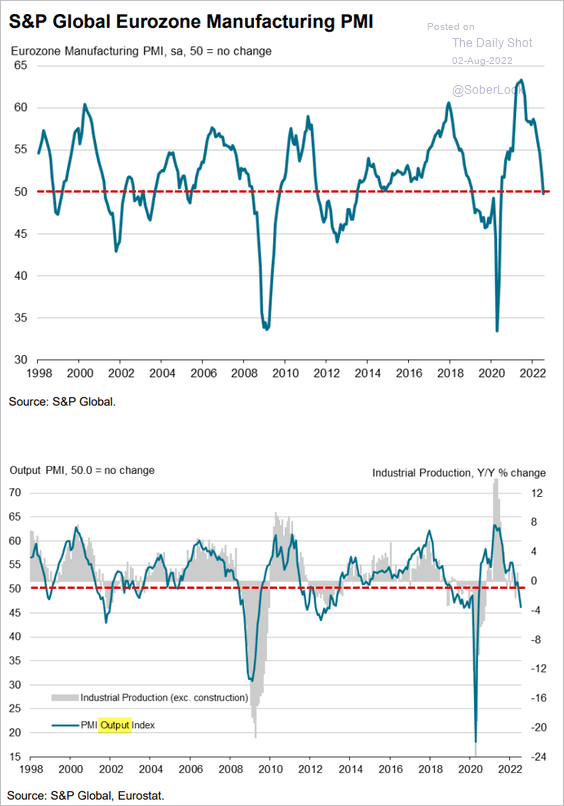 Source: S&P Global PMI
——————–
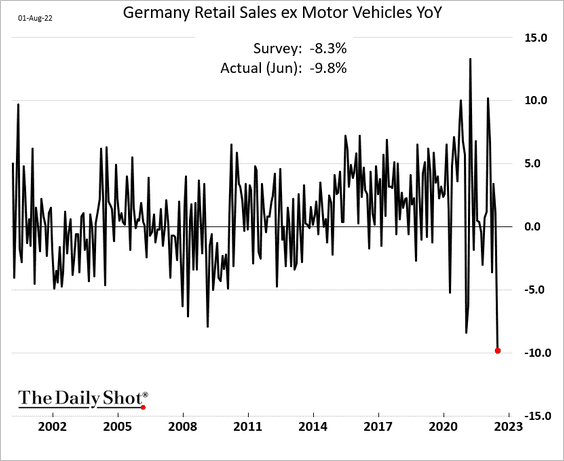
2. Germany’s retail sales tumbled on a year-over-year basis.
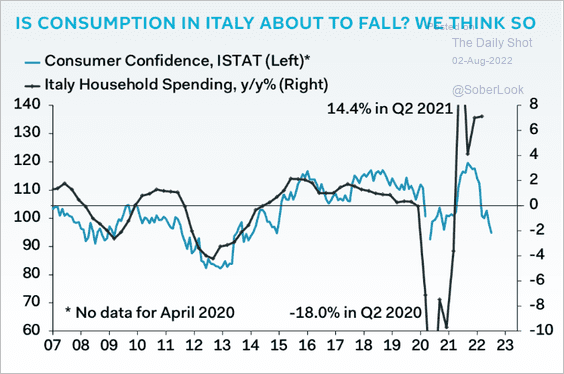
3. Italy’s sinking consumer confidence points to weakness in spending ahead.
 Source: Pantheon Macroeconomics
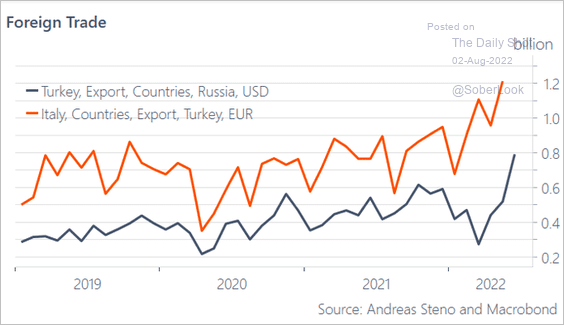
By the way, is Italy exporting to Russia via Turkey?
 Source: @AndreasSteno
Back to Index
Europe
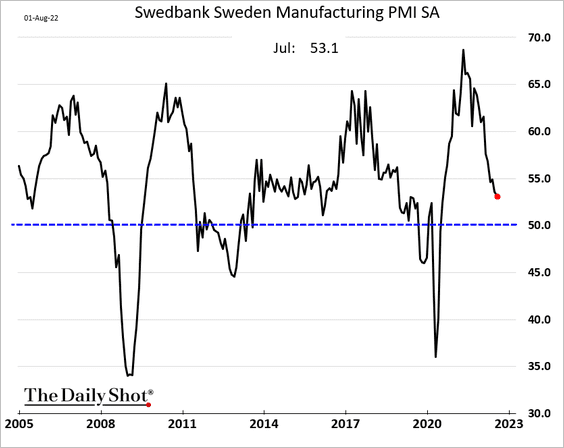
1. Sweden’s factory activity remains in growth mode.
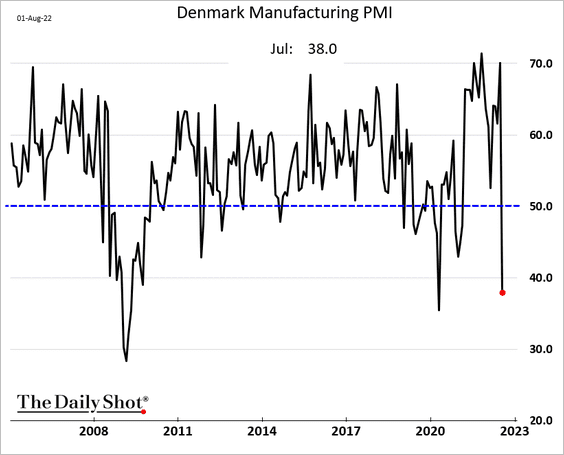
2. What happened here?
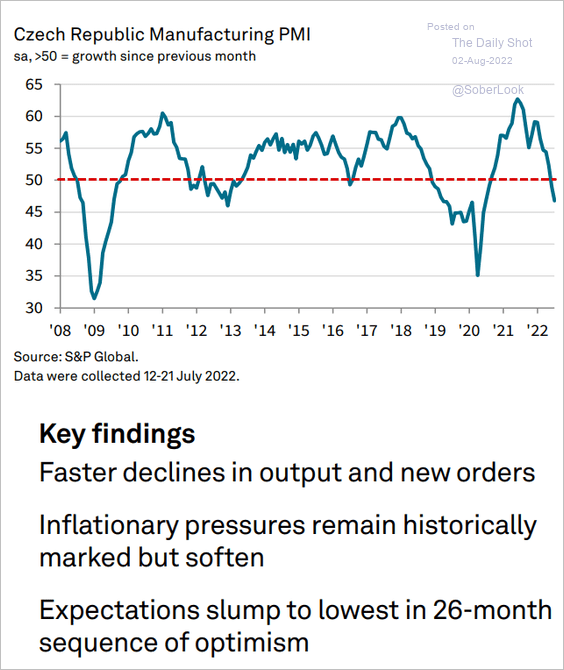
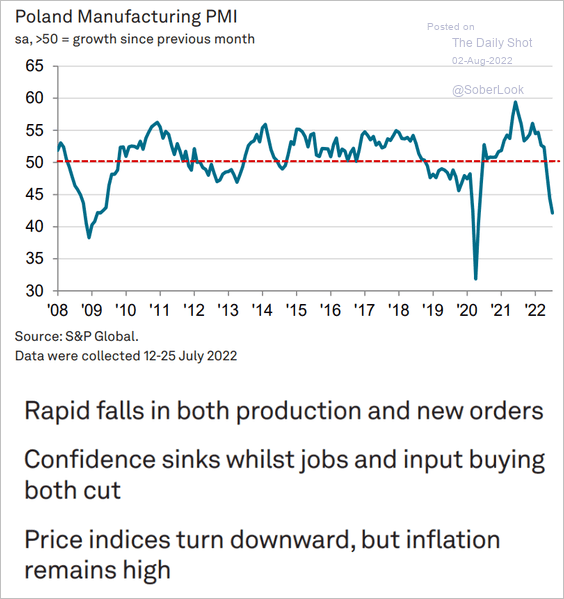
3. Central European manufacturing activity is crashing.
• The Czech Republic:
 Source: S&P Global PMI
• Poland (looks recessionary):
 Source: S&P Global PMI
——————–
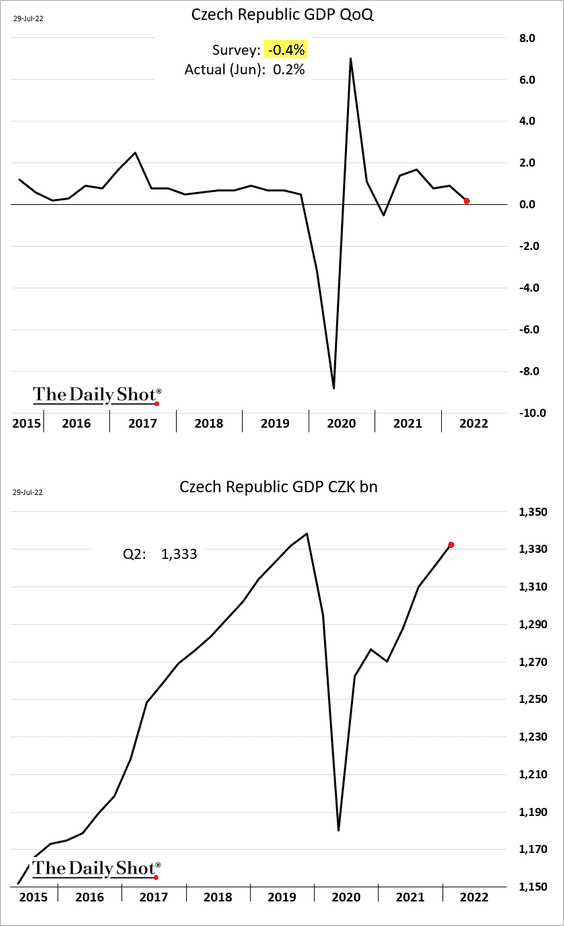
4. Czech Republic’s GDP managed a positive print in Q2. Will growth continue in Q3?
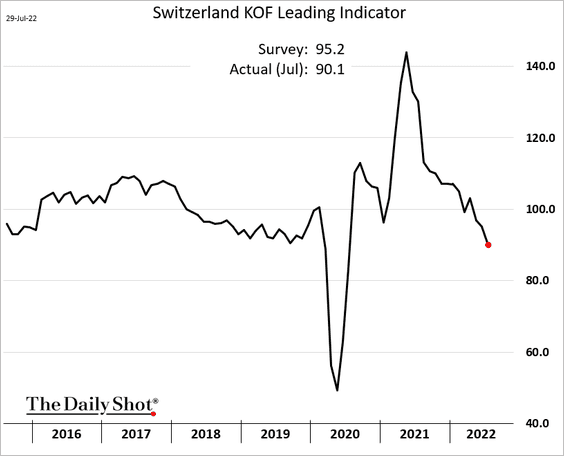
5. The Swiss leading indicator surprised to the downside.
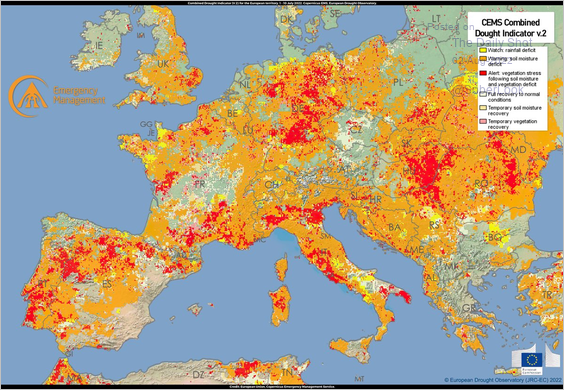
6. Many parts of Europe are experiencing severe drought conditions.
 Source: @defis_eu, @CopernicusEMS
Back to Index
Asia – Pacific
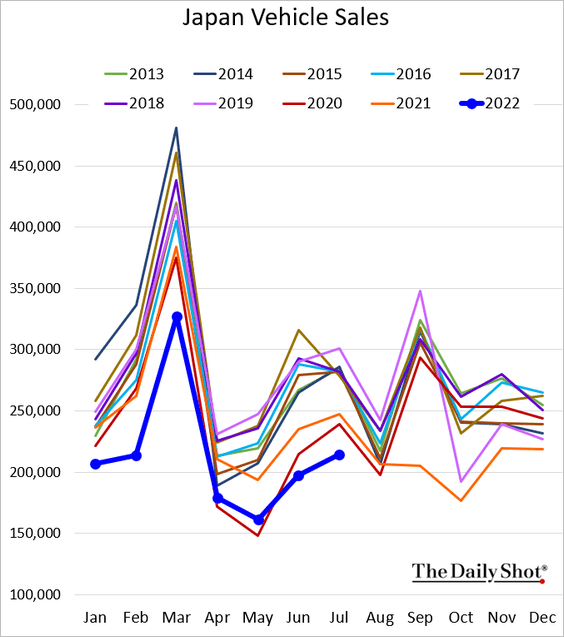
1. Japan’s vehicle sales are very soft for this time of the year.
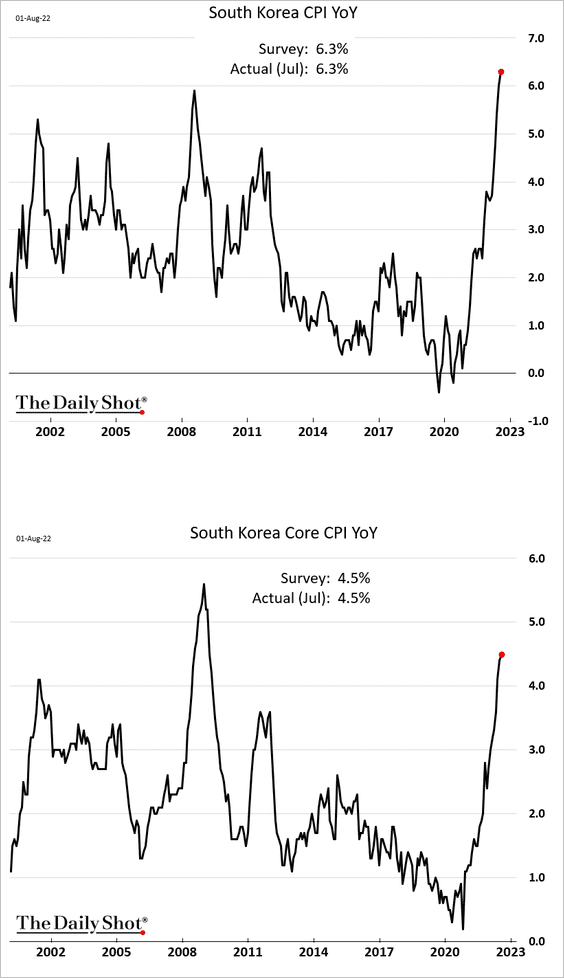
2. South Korea’s inflation continues to climb.
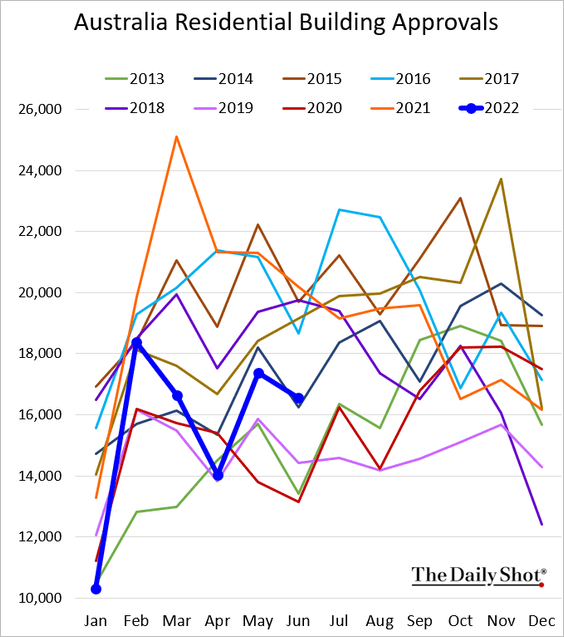
3. Australia’s building approvals held up better than expected in June.
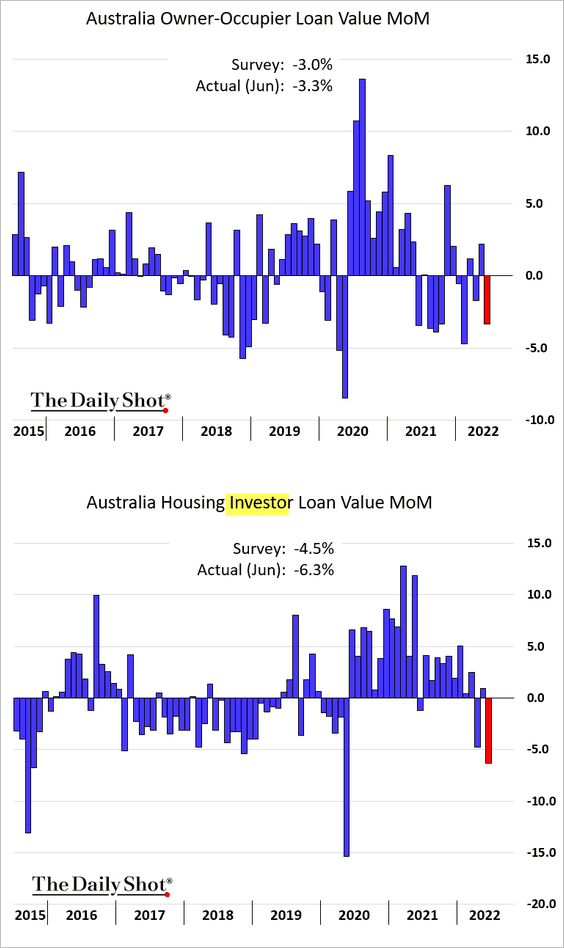
But residential mortgage activity declined, especially for investment properties.
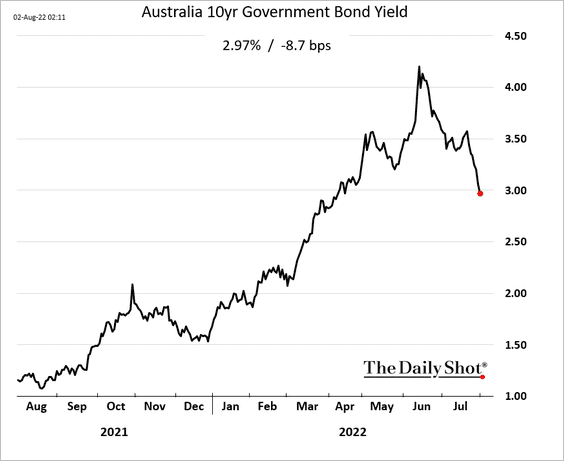
Australia’s 10-year bond yield dipped below 3%.
Back to Index
China
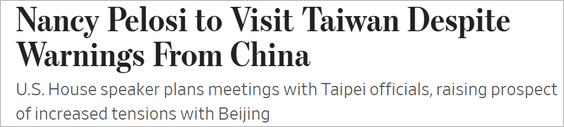
1. China’s threats against Pelosi’s Taiwan visit shifted global sentiment to risk-off.
 Source: @WSJ Read full article
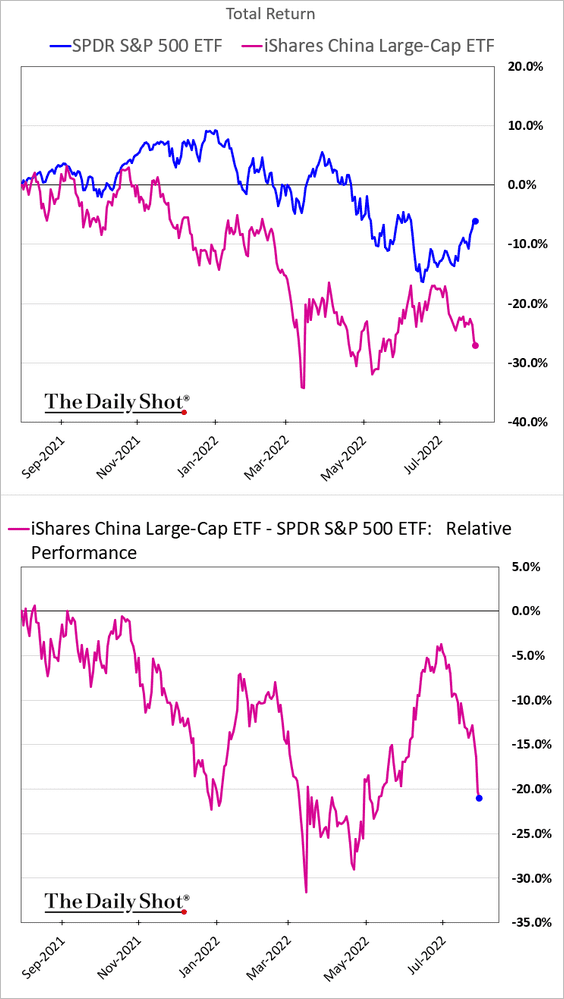
Equity declines accelerated.
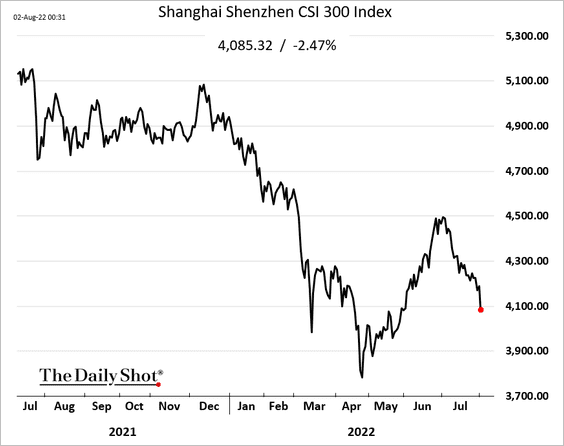
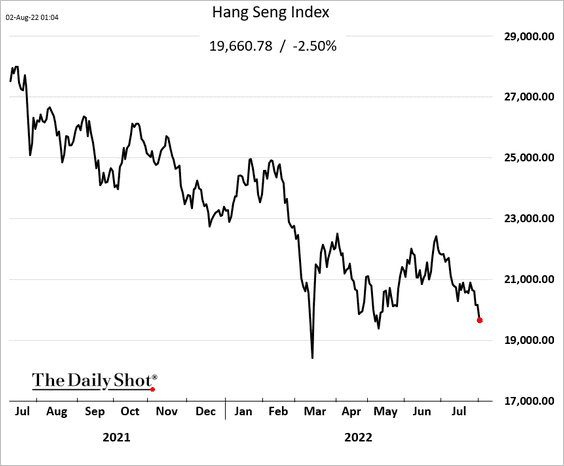
In dollar terms, China’s large caps have widened their underperformance vs. the S&P 500.
——————–
2. China is now exporting deflation to the rest of the world. It’s worth taking another look at the manufacturing PMI price indices here.
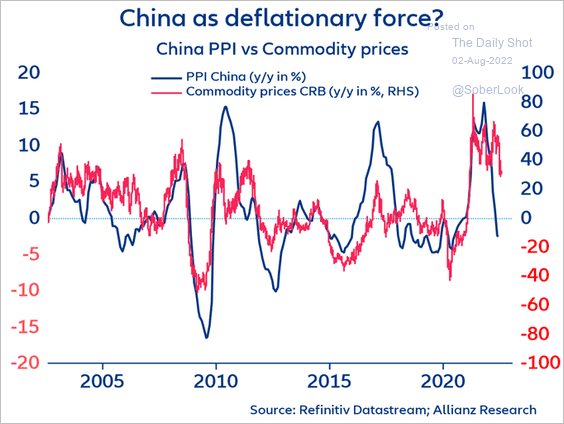 Source: @PatrickKrizan
3. China’s oil demand is expected to recover during the second half of this year, although COVID-19 risks persist.
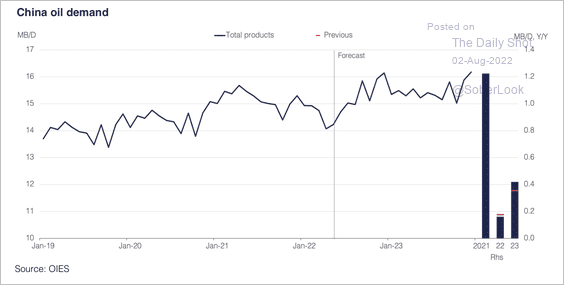 Source: Oxford Institute for Energy Studies
4. Household sentiment indicators have deteriorated.
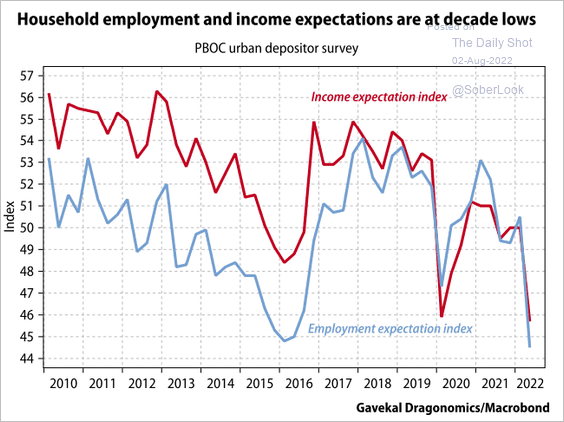 Source: Gavekal Research
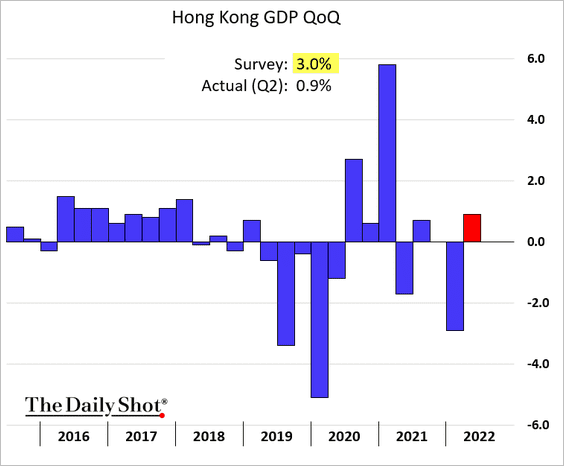
5. Hong Kong’s Q2 GDP growth surprised to the downside. The expected rebound from the first quarter’s drop didn’t materialize.
Back to Index
Emerging Markets
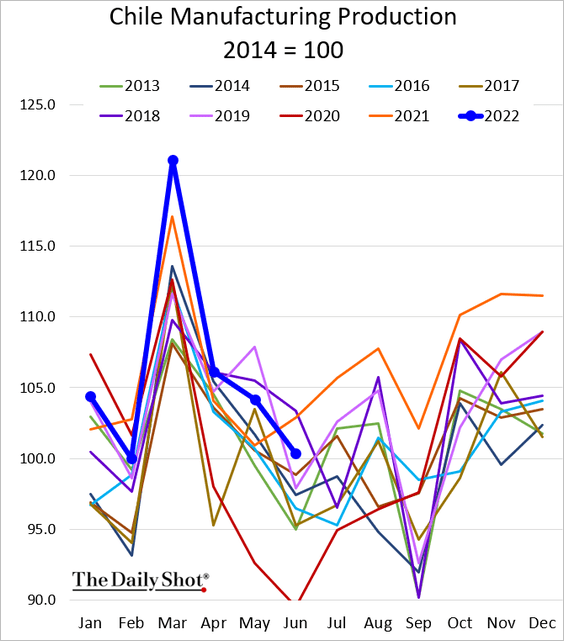
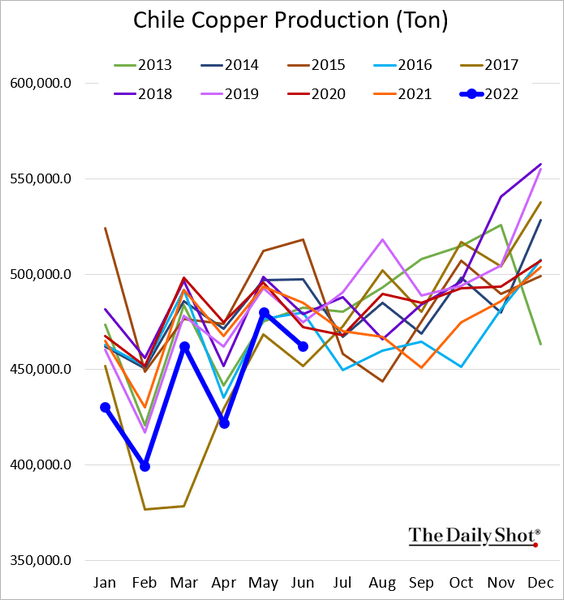
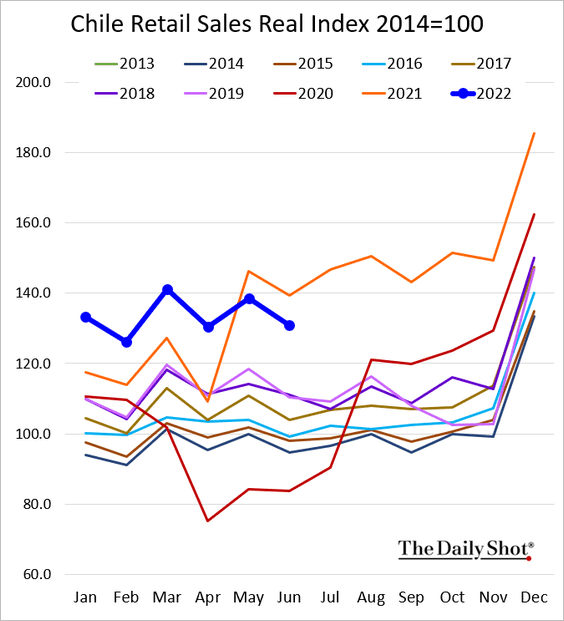
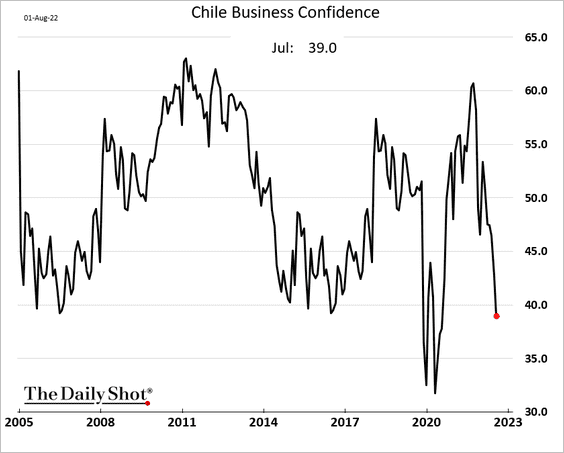
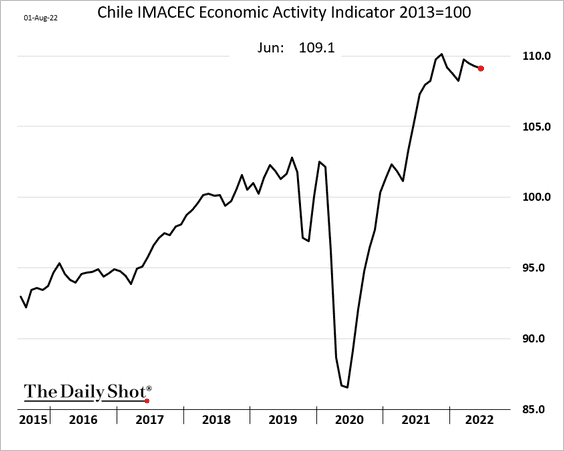
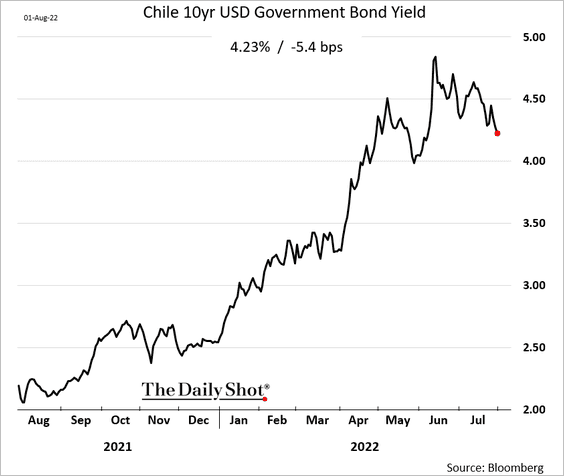
1. Let’s begin with Chile.
• Industrial production (back below last year’s levels):
• Copper production:
• Retail sales (below last year’s level but still quite strong):
• Business confidence (looks recessionary):
• Economic activity:
• The peso is rebounding.
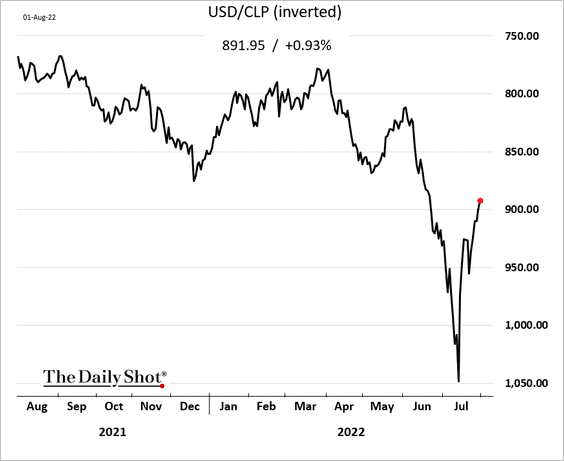
Bond yields have peaked for now.
• Will the new constitution be approved by the voters?
 Source: Reuters Read full article
——————–
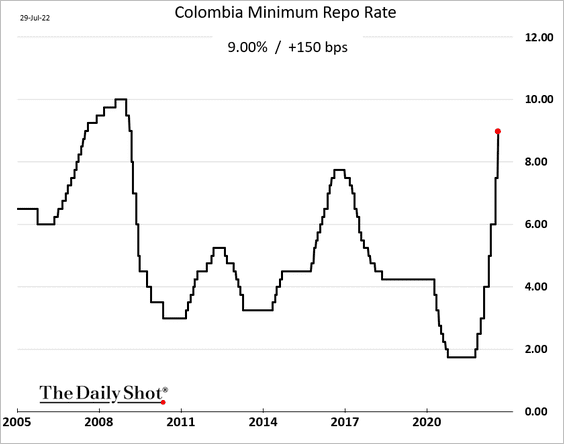
2. Colombia’s central bank hiked rates again.
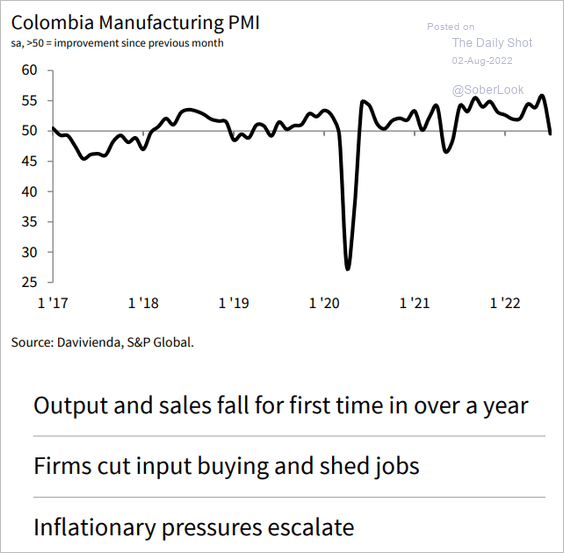
Manufacturing is back in contraction territory.
 Source: S&P Global PMI
——————–
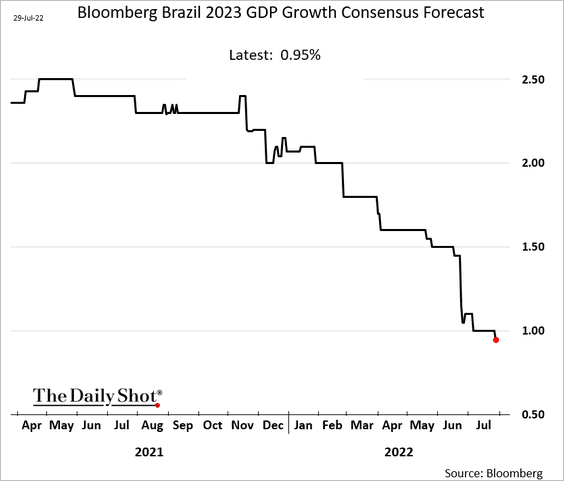
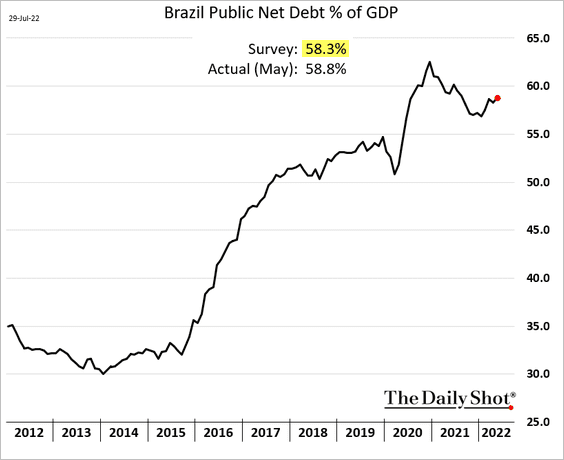
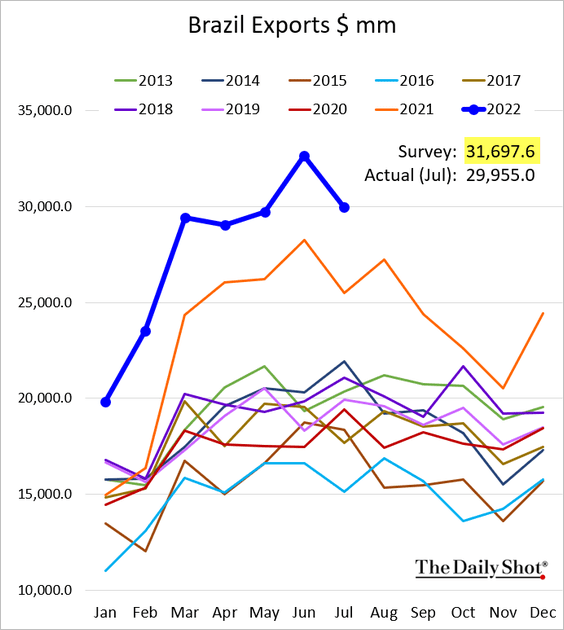
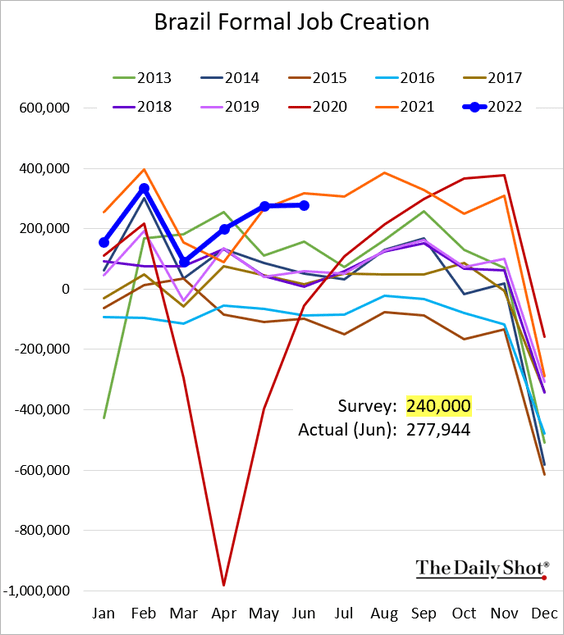
3. Next, we have some updates on Brazil.
• 2023 GDP growth expectations:
• Debt-to-GDP ratio (a rebound?):
• Exports (below expectations):
• Formal job creation (above expectations):
• Manufacturing PMI (stable growth):
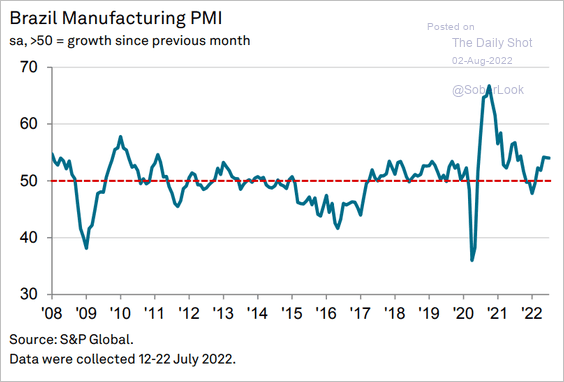 Source: S&P Global PMI
——————–
3. Turkey’s manufacturing is in contraction mode.
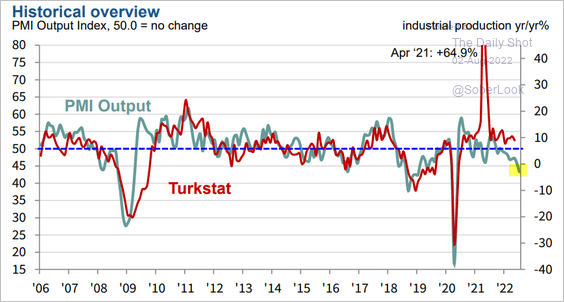 Source: S&P Global PMI
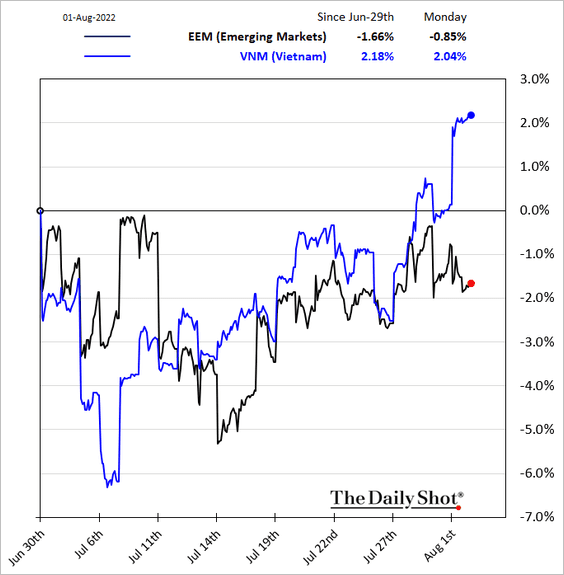
4. Vietnam’s stocks are outperforming as foreign capital returns.
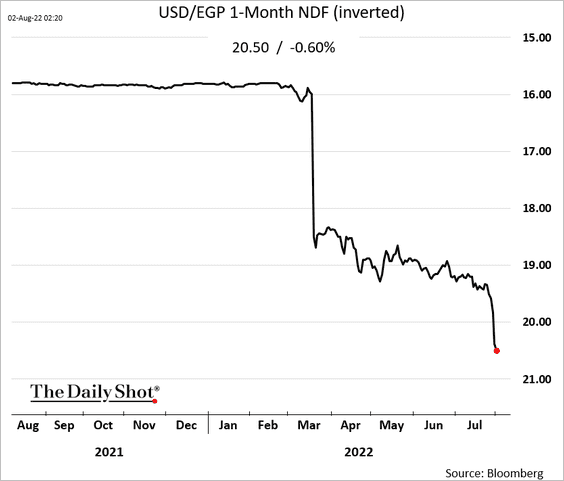
5. Another devaluation on the way in Egypt?
Back to Index
Cryptocurrency
1. Crypto investment products saw inflows totaling $81 million last week. So far, July has been the strongest set of monthly inflows this year.
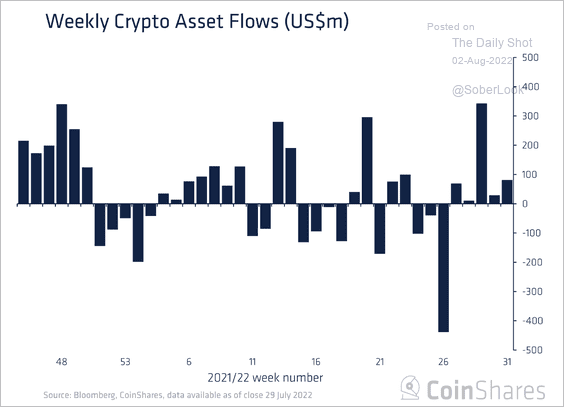 Source: CoinShares Read full article
Bitcoin and Ethereum-focused funds saw inflows last week, while multi-asset and short-bitcoin funds saw outflows.
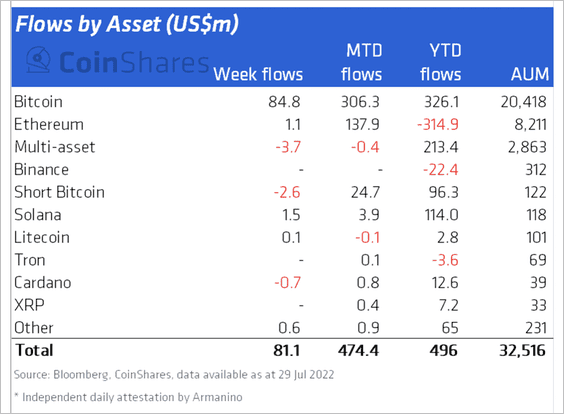 Source: CoinShares Read full article
——————–
2. There has been a significant amount of known BTC selling among large entities over the past two months.
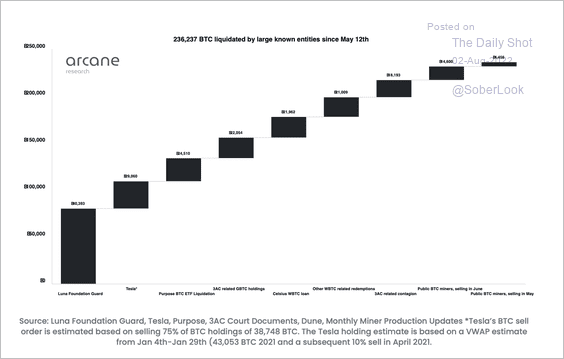 Source: @ArcaneResearch
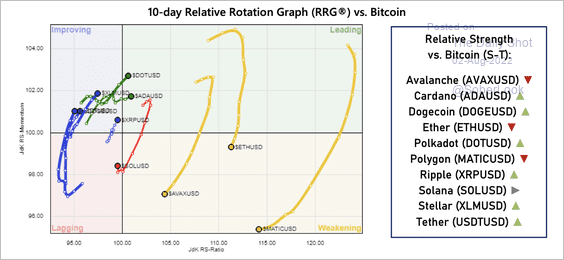
3. This chart shows the relative strength between select altcoins and bitcoin over the past 10 days.
 Source: @StocktonKatie
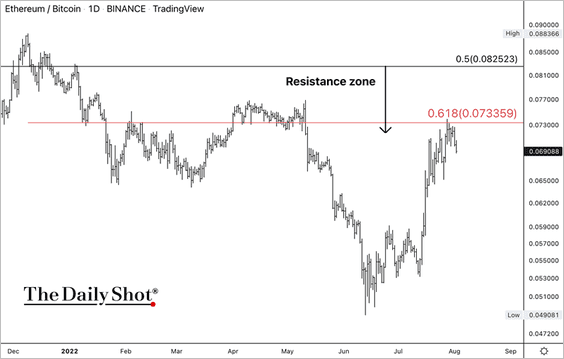
4. The ETH/BTC price ratio is testing resistance, which means the recent risk-on trade could be exhausted over the short term.
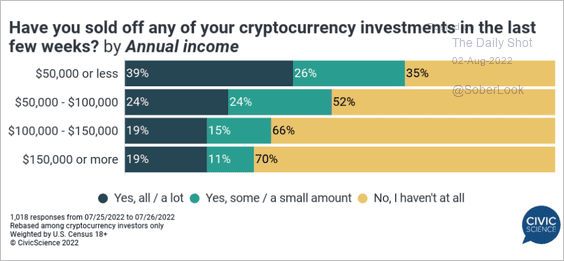
5. Have you sold your crypto holdings?
 Source: @CivicScience
Back to Index
Commodities
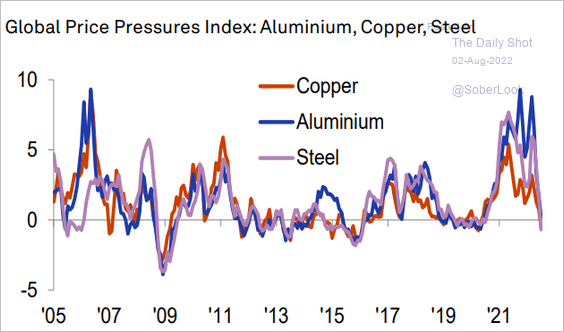
1. Price pressures in industrial commodities have been easing.
 Source: S&P Global PMI
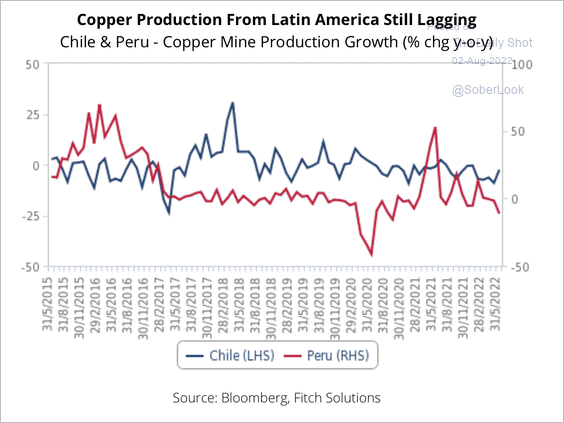
2. Copper production in Chile and Peru remains relatively weak.
 Source: Fitch Solutions Macro Research
But softer demand could put further downward pressure on copper.
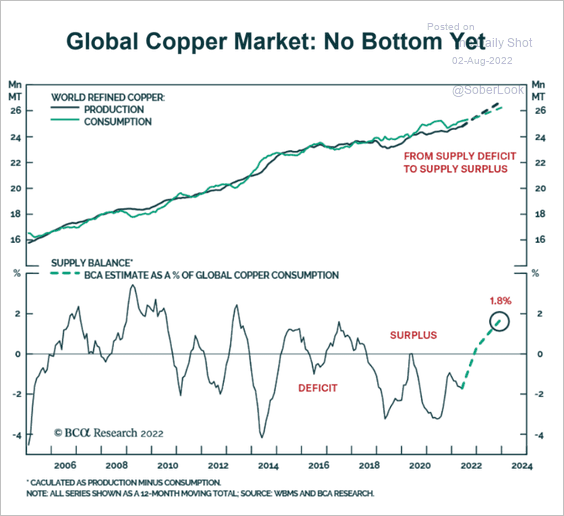 Source: BCA Research
——————–
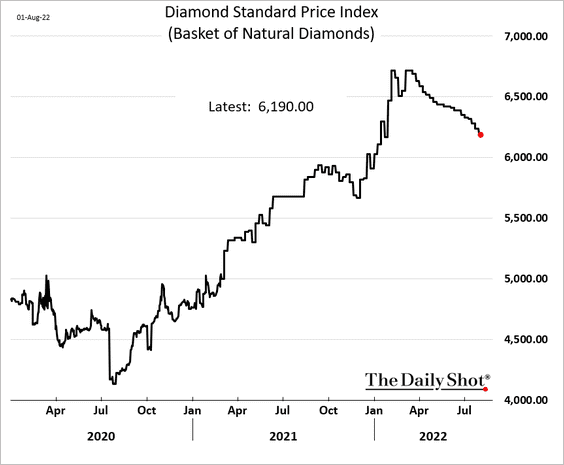
3. Diamond prices have been falling.
Back to Index
Energy
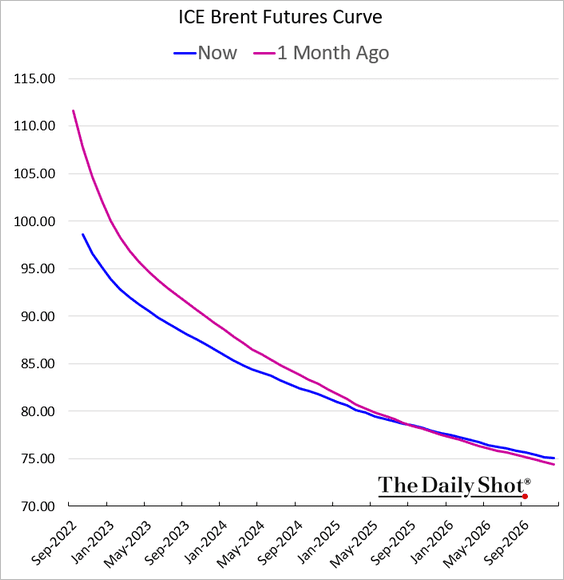
1. Brent dipped below $100 again.
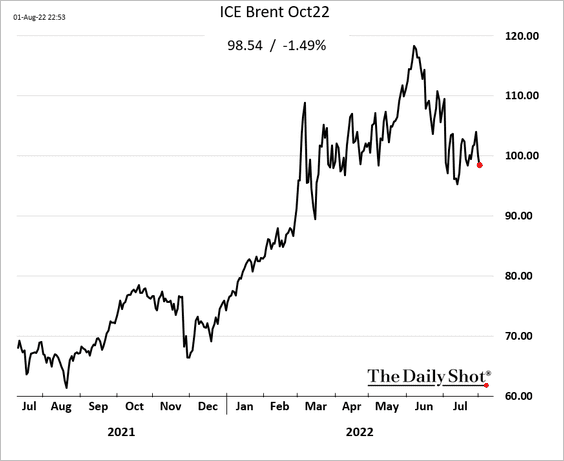
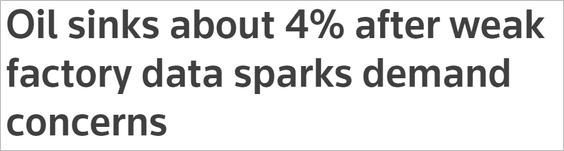 Source: Reuters Read full article
The backwardation is easing.
——————–
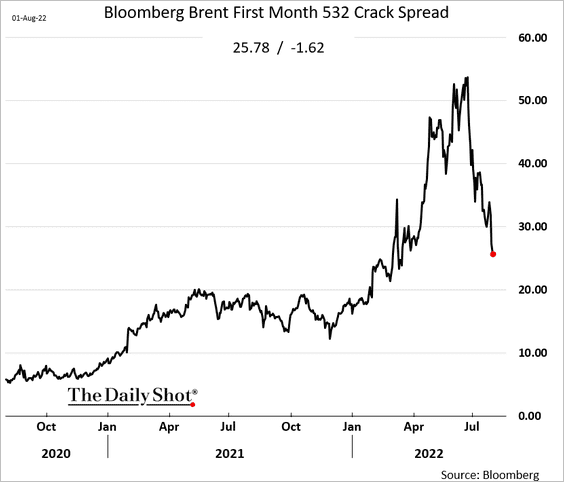
2. Crack spreads continue to fall.
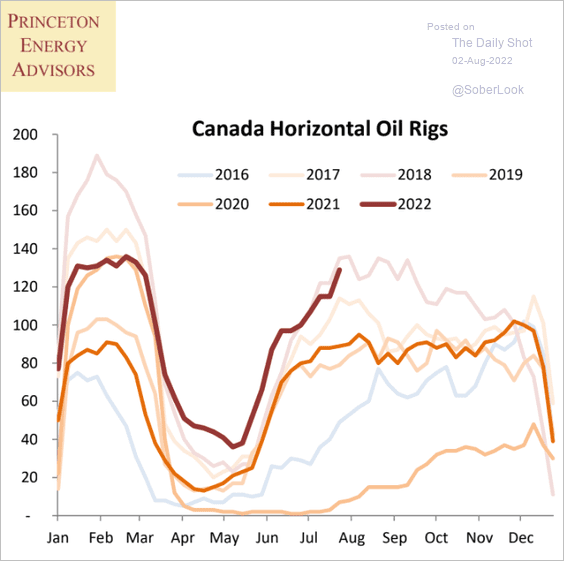
3. Canada’s rig count momentum looks strong.
 Source: Princeton Energy Advisors
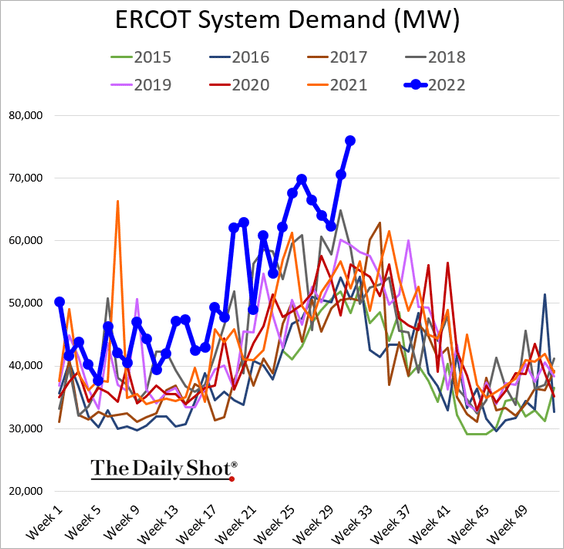
4. The Texas power grid is under severe strain
 Source: Reuters Read full article
Back to Index
Equities
1. The third-quarter earnings expectations are moving lower.
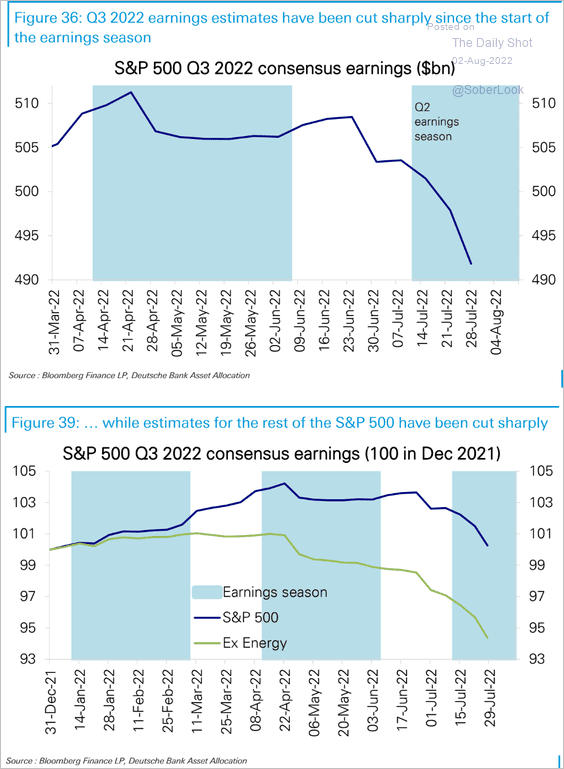 Source: Deutsche Bank Research
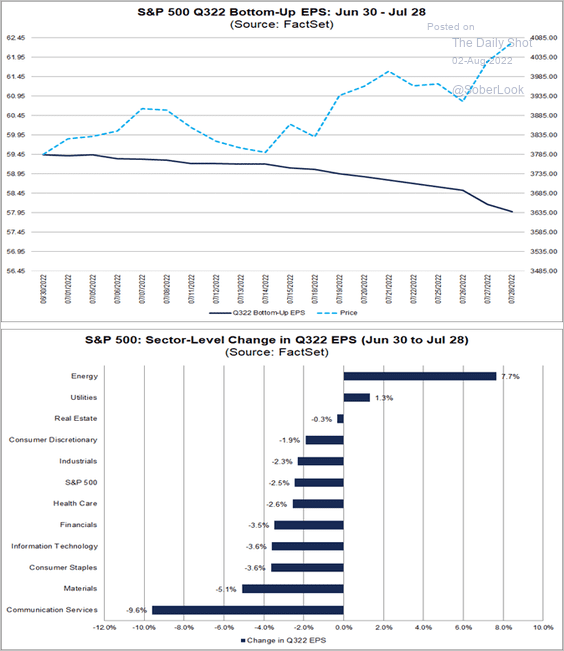 Source: @FactSet
——————–
2. Positioning remains bearish. Here is Deutsche Bank’s positioning indicator.
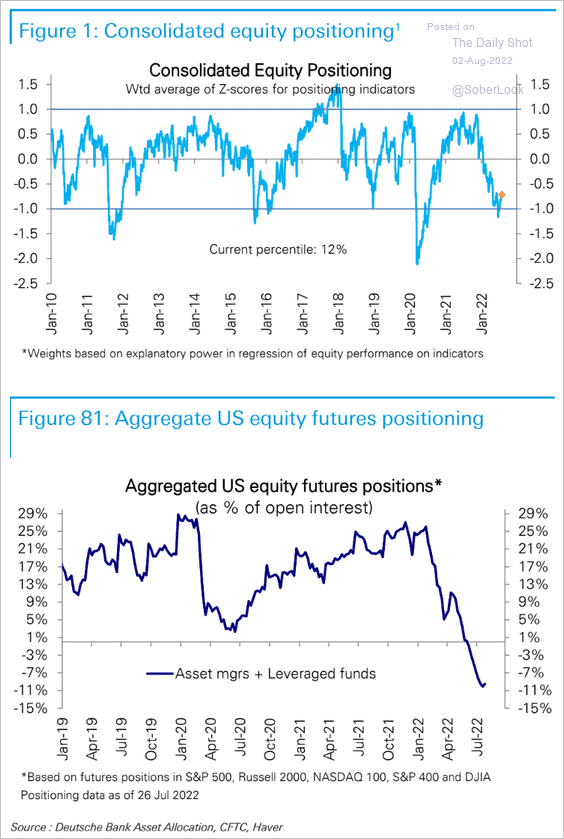 Source: Deutsche Bank Research
3. Global equity valuations have significantly compressed during the recent sell-off.
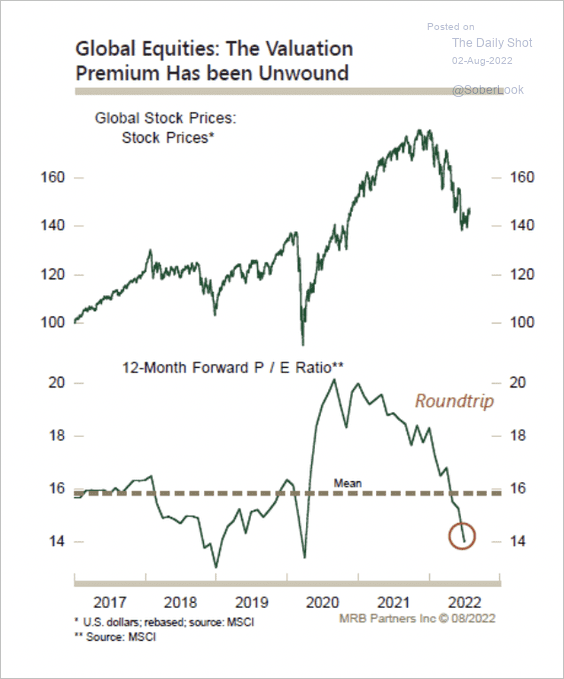 Source: MRB Partners
4. Which stocks did retail investors buy in 2022?
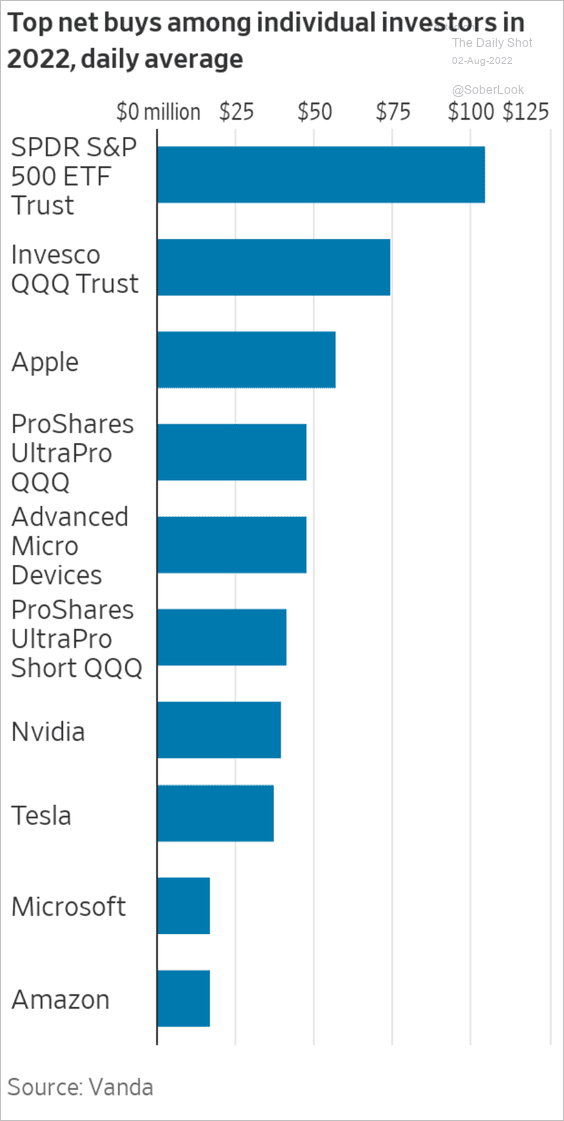 Source: @WSJ Read full article
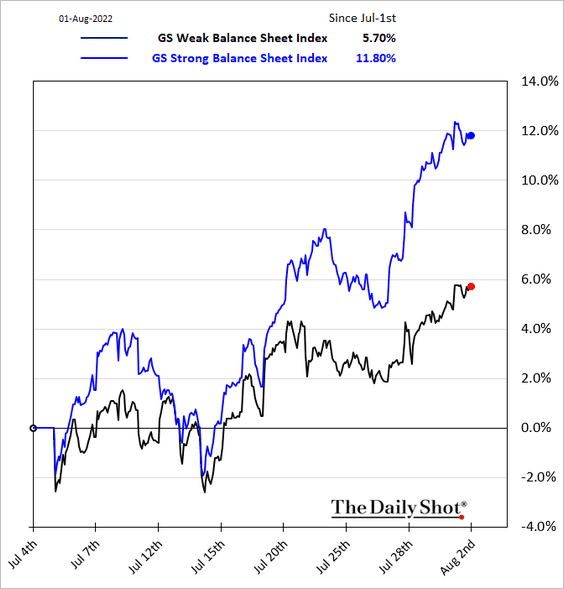
5. Companies with strong balance sheets have been outperforming.
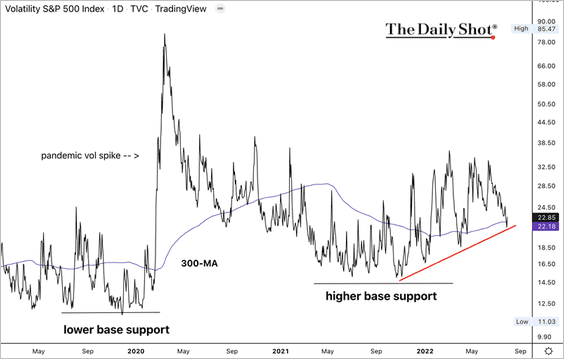
6. Will VIX hold support?
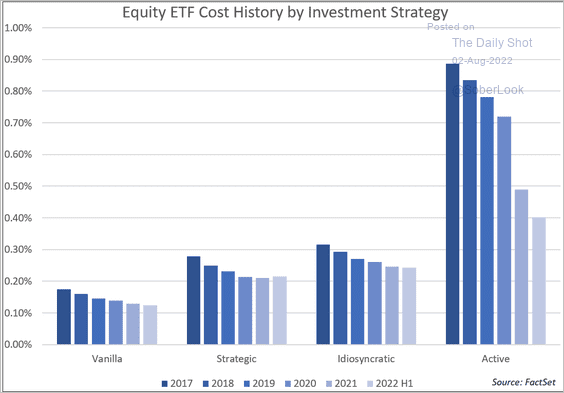
7. Most equity ETF fees have been moving lower.
 Source: @FactSet
Back to Index
Global Developments
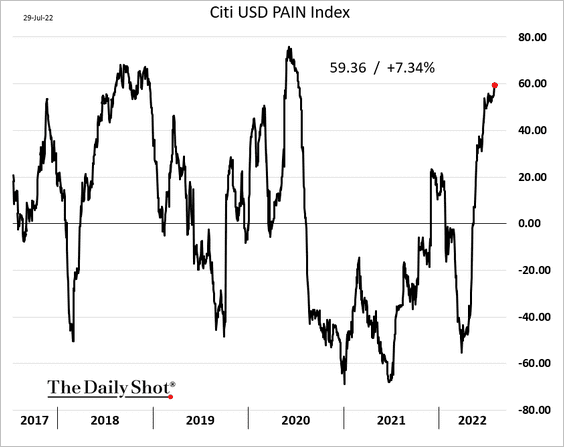
1. Active FX traders remain long the US dollar.
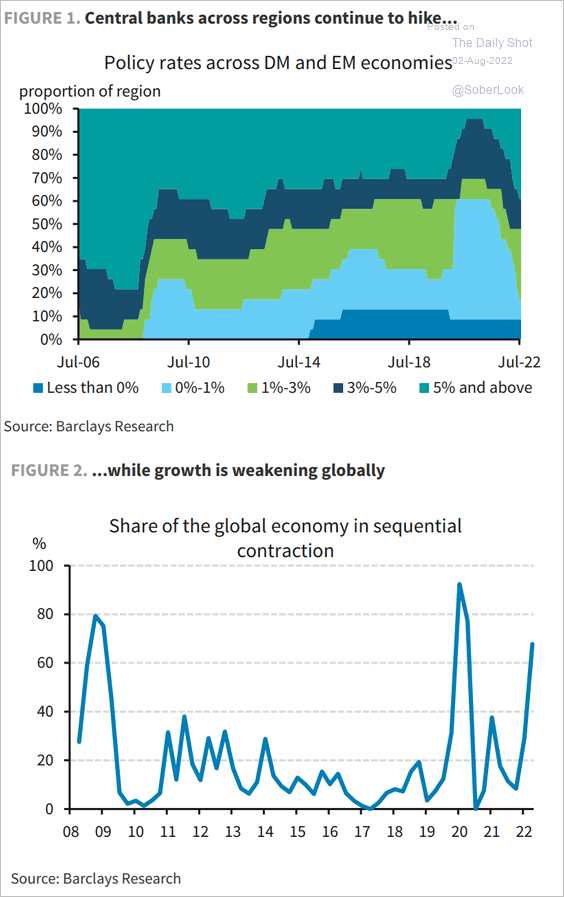
2. Central banks’ tighter policies are putting pressure on economic growth.
 Source: Barclays Research
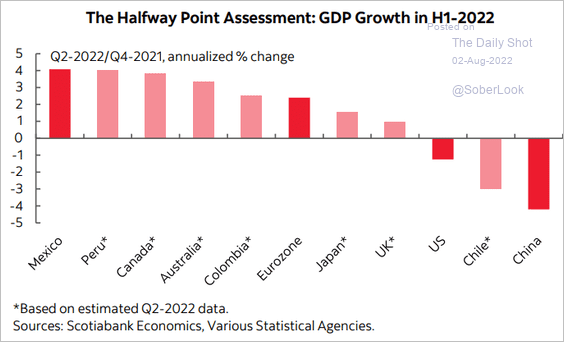
3. Here is Scotiabank’s estimate of the first-half GDP growth in select economies.
 Source: Scotiabank Economics
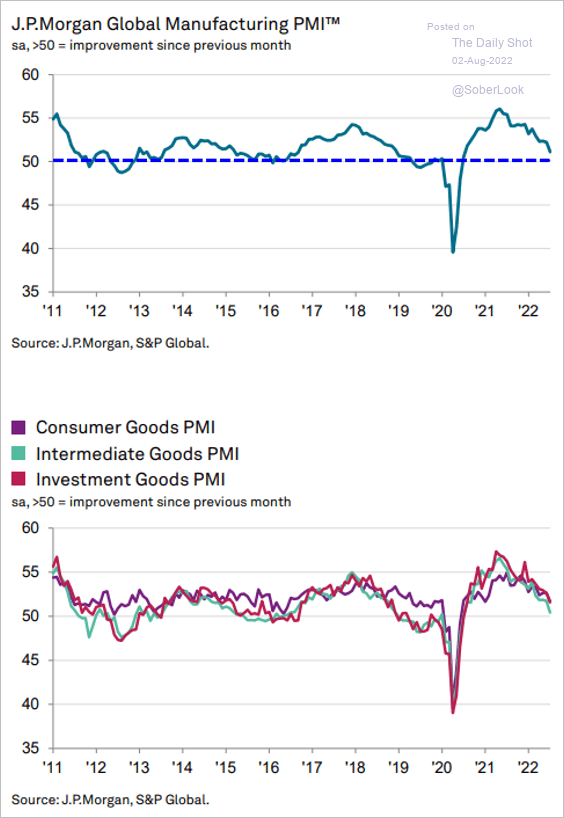
4. Manufacturing growth slowed further in July.
 Source: S&P Global PMI
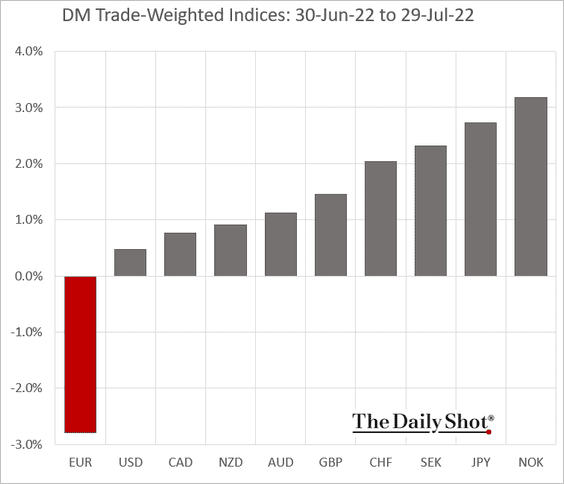
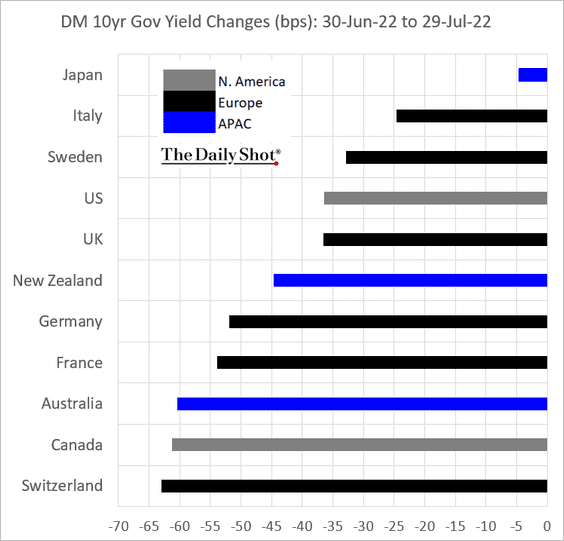
5. Next, we have some performance data for July.
• Trade-weighted currency indices:
• Sovereign bond yields:
——————–
Food for Thought
1. Daily visits to various locations:
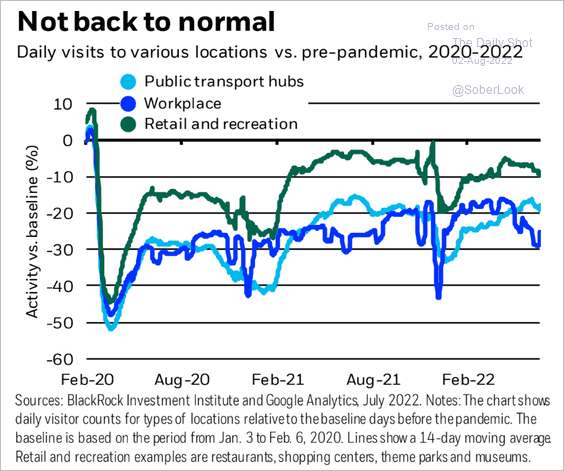 Source: BlackRock Investment Institute
2. The accommodation sector employment recovery:
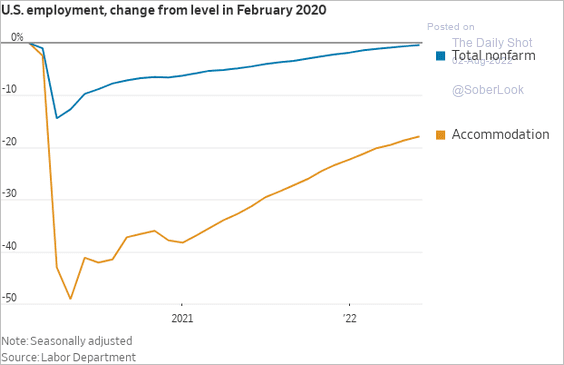 Source: @WSJ Read full article
3. Views on potential abortion policies:
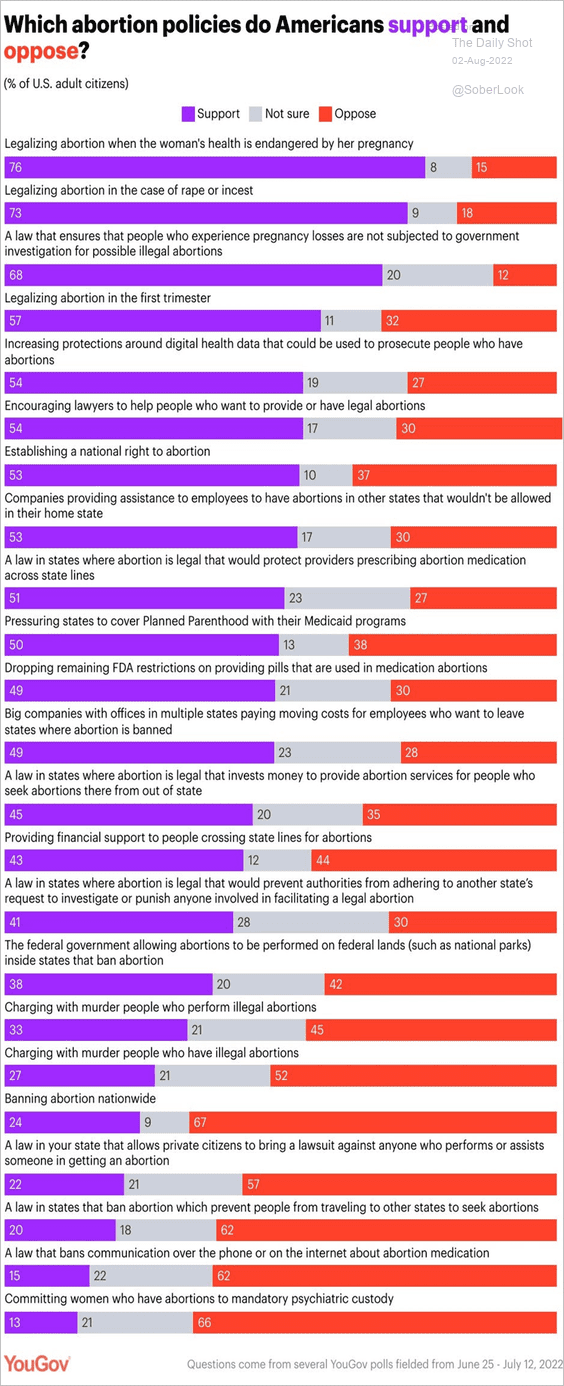 Source: @YouGov
4. Industry that contributes the most to each state’s GDP:
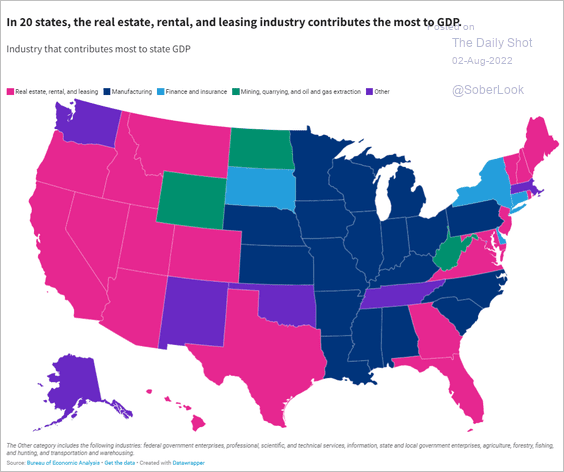 Source: USA Facts Read full article
5. Responding to tampon shortages:
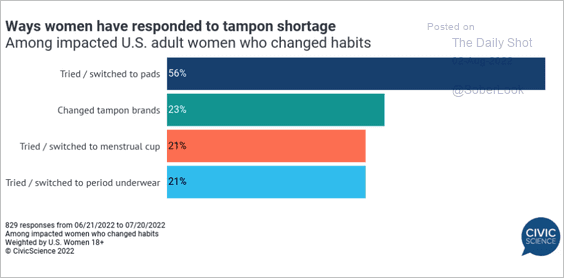 Source: @CivicScience
6. Struggling to pay expenses:
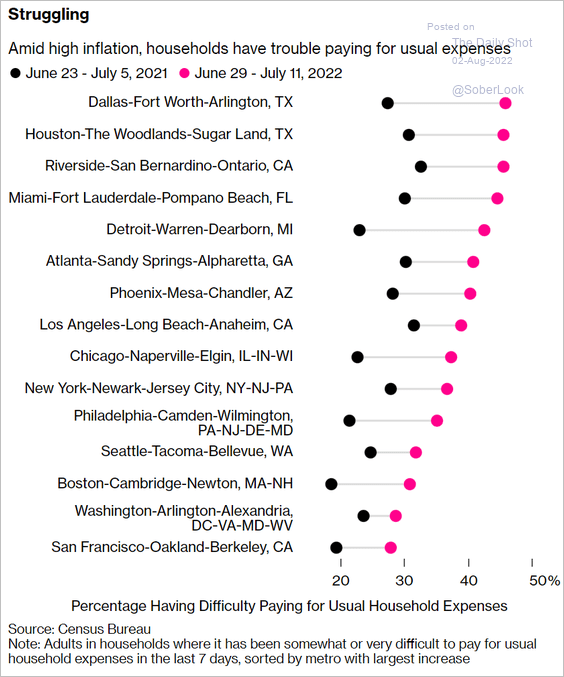 Source: Bloomberg Read full article
7. Americans’ spending on lottery tickets:
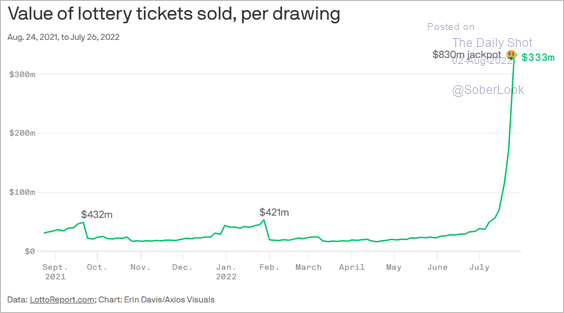 Source: @axios Read full article
——————–
Back to Index