
The Daily Shot: 30-Sep-22
• The United States
• Canada
• The United Kingdom
• The Eurozone
• Europe
• Japan
• Asia – Pacific
• China
• Emerging Markets
• Energy
• Equities
• Credit
• Rates
• Global Developments
• Food for Thought
The United States
1. Initial jobless claims hit another multi-year low, once again running significantly below pre-COVID levels (2nd panel). Despite the headwinds, companies are unwilling to lay off employees (for now) because it’s been so challenging and expensive to hire/retain workers.
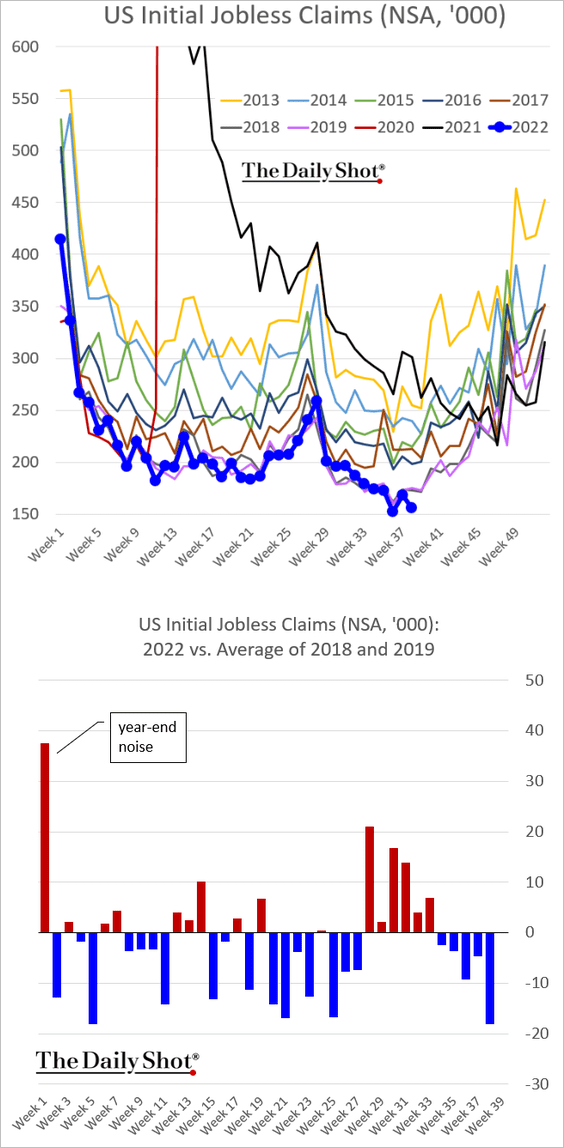
And workers who are laid off find jobs quickly.
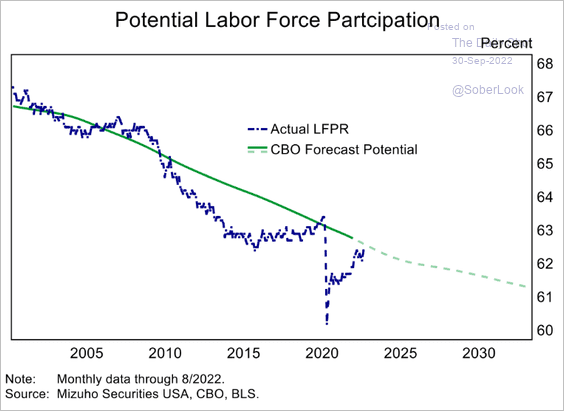
Based on demographic trends, labor force participation is nearing its full potential. Fewer Americans returning to work could keep the labor market tight for some time, maintaining upward pressure on wages.
 Source: Mizuho Securities USA
These labor trends will keep the Fed hawkish.
 Source: Bloomberg Read full article
——————–
2. Mortgage rates hit the highest level since 2008, …
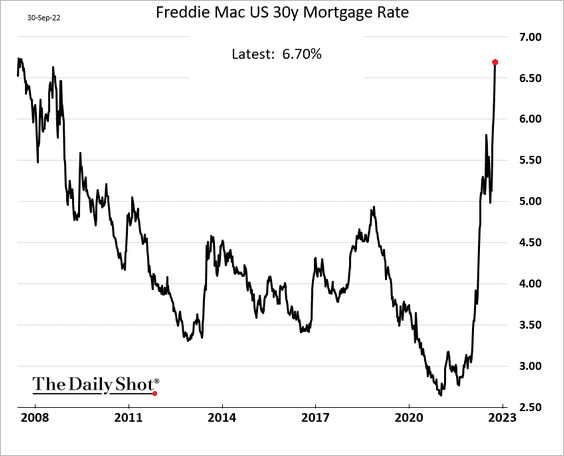
… after a record yearly increase.
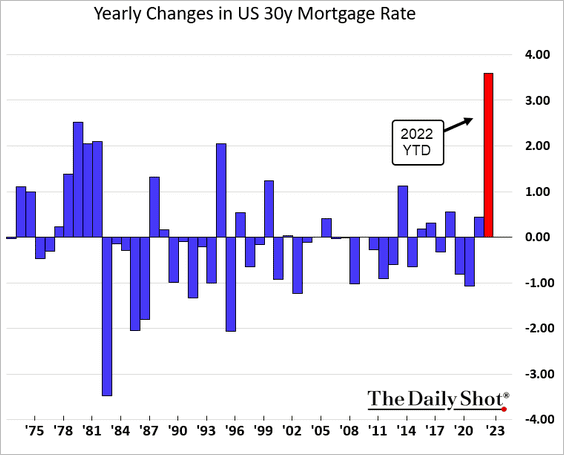
• The spike in mortgage rates will be a significant headwind for economic activity.
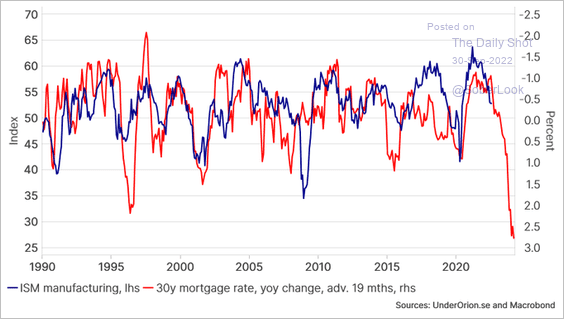 Source: @enlundm
• How much home can you buy with a $2,500 monthly mortgage payment?
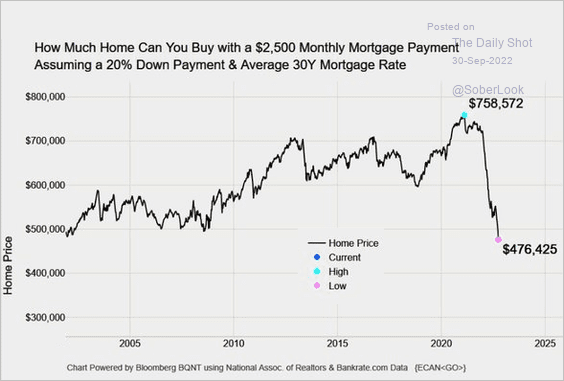 Source: @TheStalwart, @M_McDonough, @markets Read full article
——————–
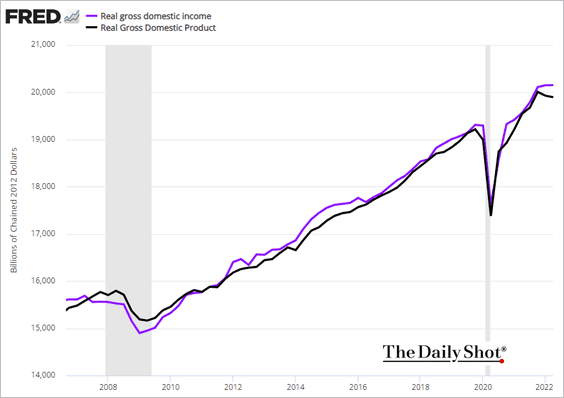
3. The US GDI was revised lower (see story), …
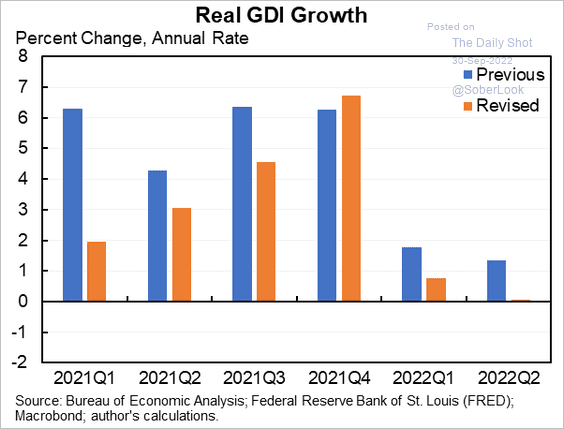 Source: @jasonfurman
… putting the measure more in line with the GDP.
——————–
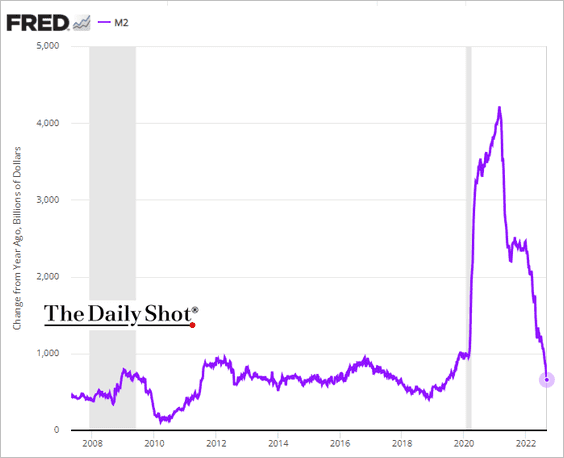
4. US liquidity conditions keep tightening. This chart shows the year-over-year change in the M2 (broad) money supply.
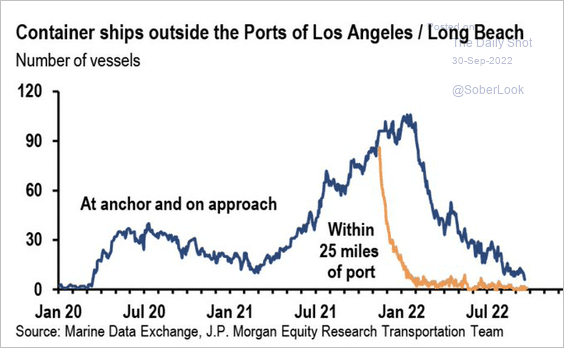
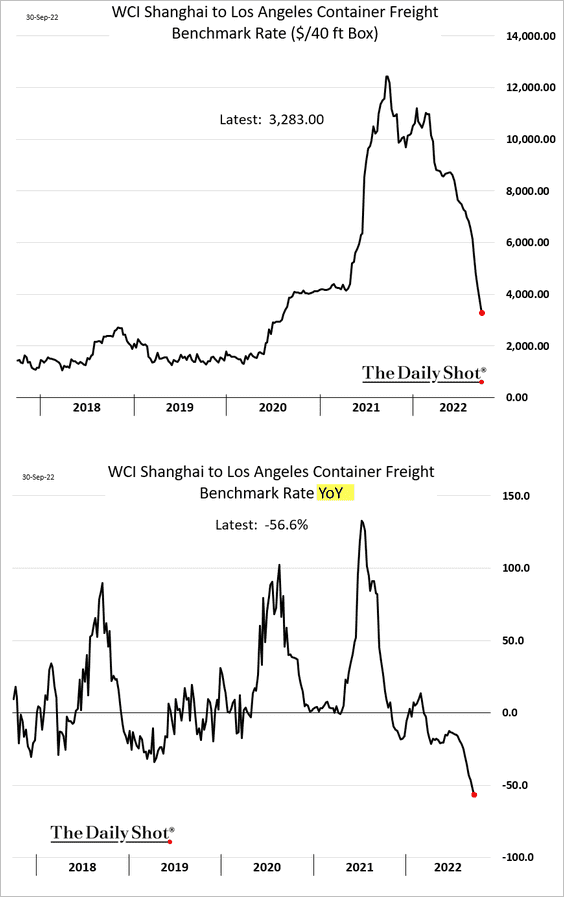
5. Supply bottlenecks continue to ease.
• West Coast port congestion:
 Source: JP Morgan Research; @carlquintanilla
• Container shipping costs (2nd panel shows the year-over-year changes):
——————–
6. Multiple leading indicators suggest that inflation should be lower.
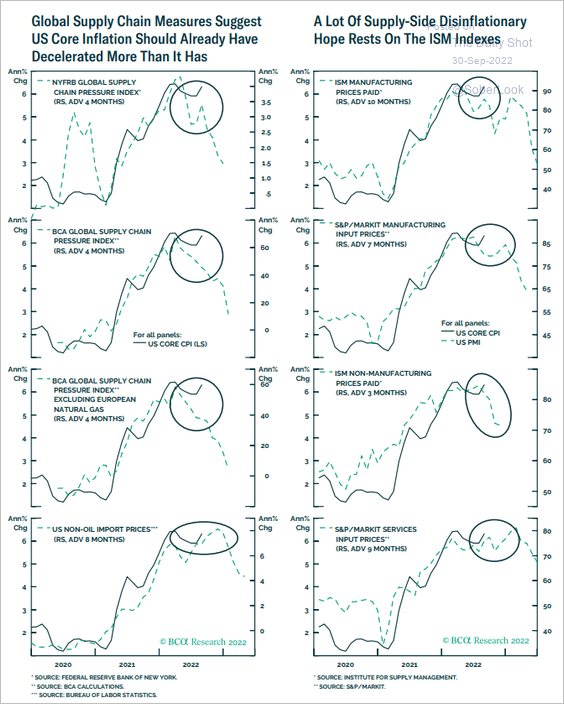 Source: BCA Research
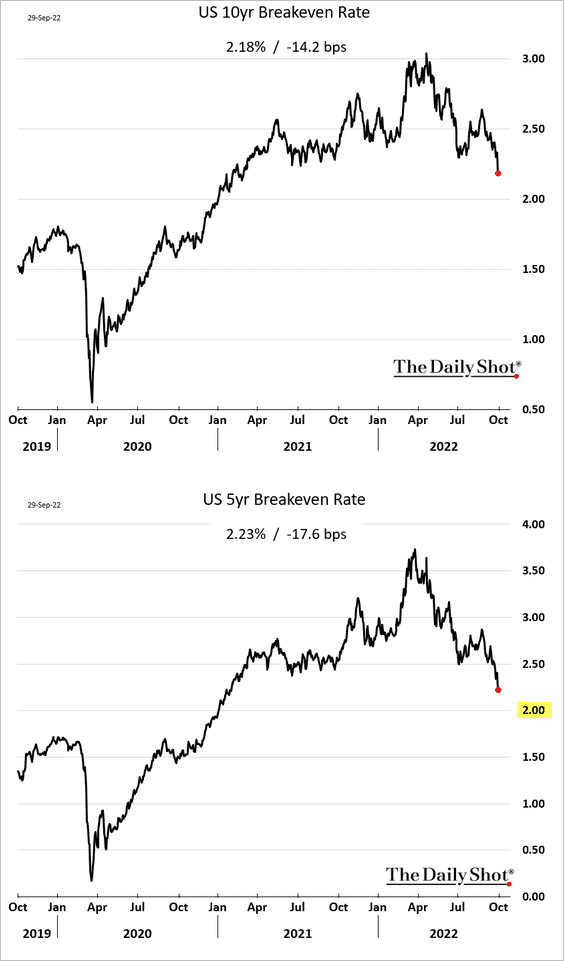
Market-based inflation expectations continue to fall.
——————–
7. The US financial markets meltdown removed some $16 trillion from investment-grade bond and equity markets (including Treasuries and MBS).
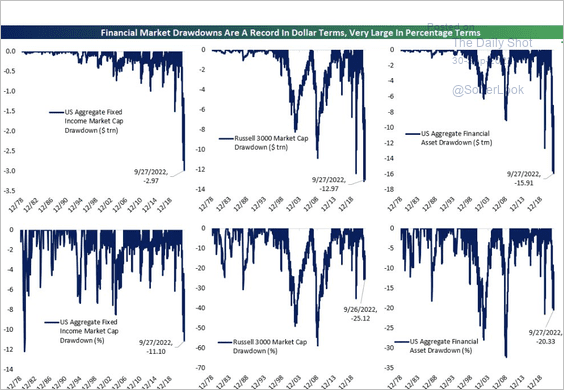 Source: @carlquintanilla, @bespokeinvest
Back to Index
Canada
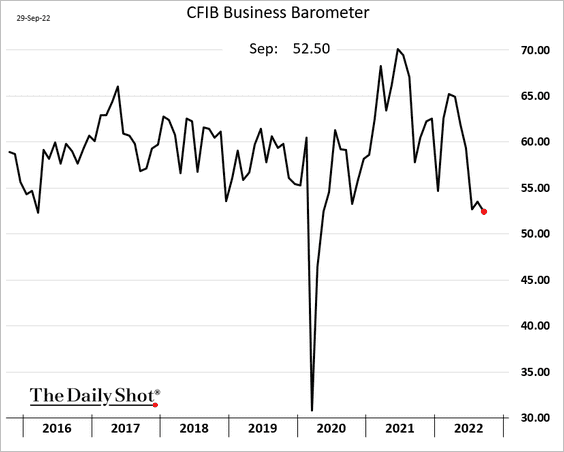
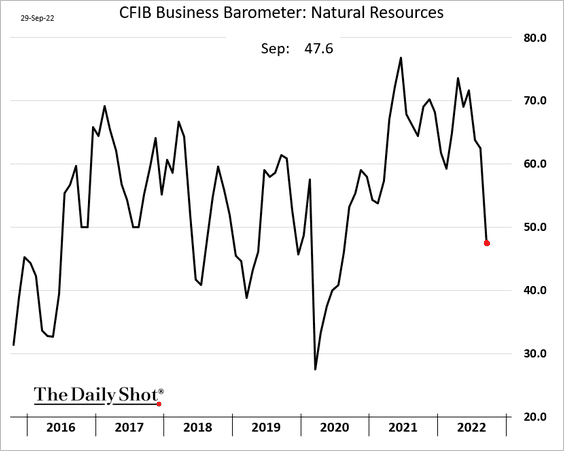
1. The CFIB Business Barometer, Canada’s small business confidence indicator, continues to trend lower.
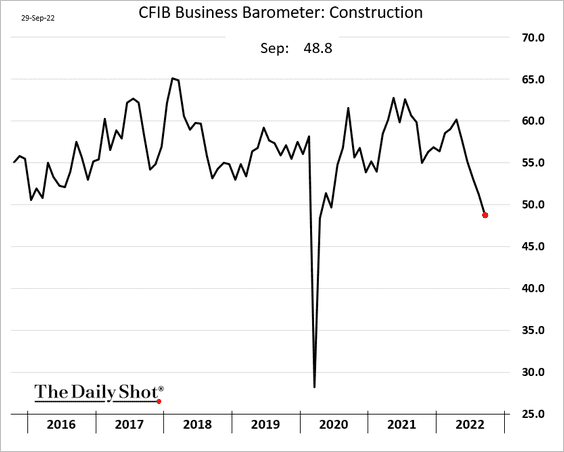
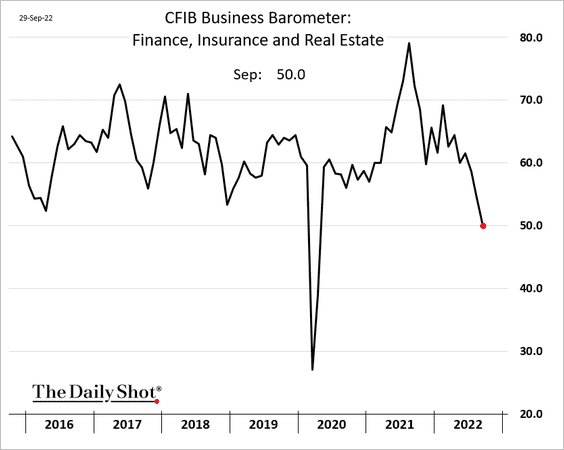
• Property-related sectors have been under pressure (2 charts).
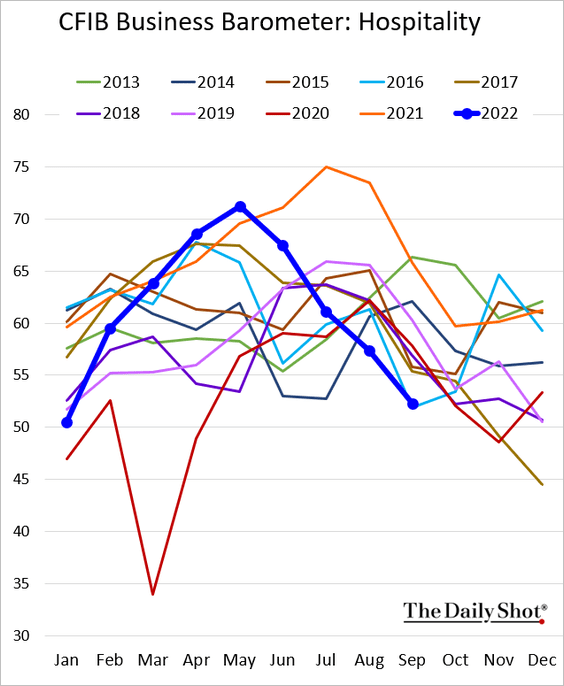
• The hospitality index is also soft for this time of the year.
• And the CFIB index of the natural resources declined sharply.
——————–
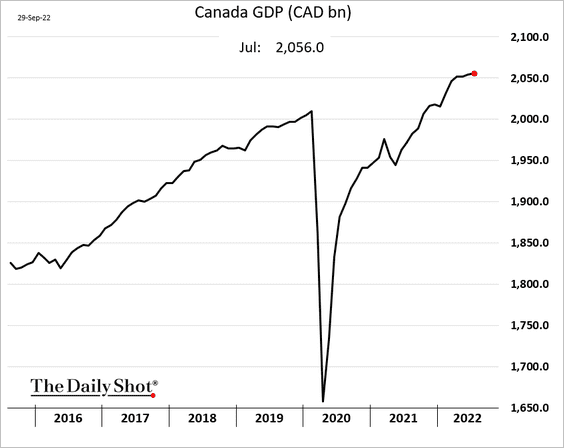
2. The economy continued to expand at the start of Q3.
Back to Index
The United Kingdom
1. Here is another look at projected government borrowing needs.
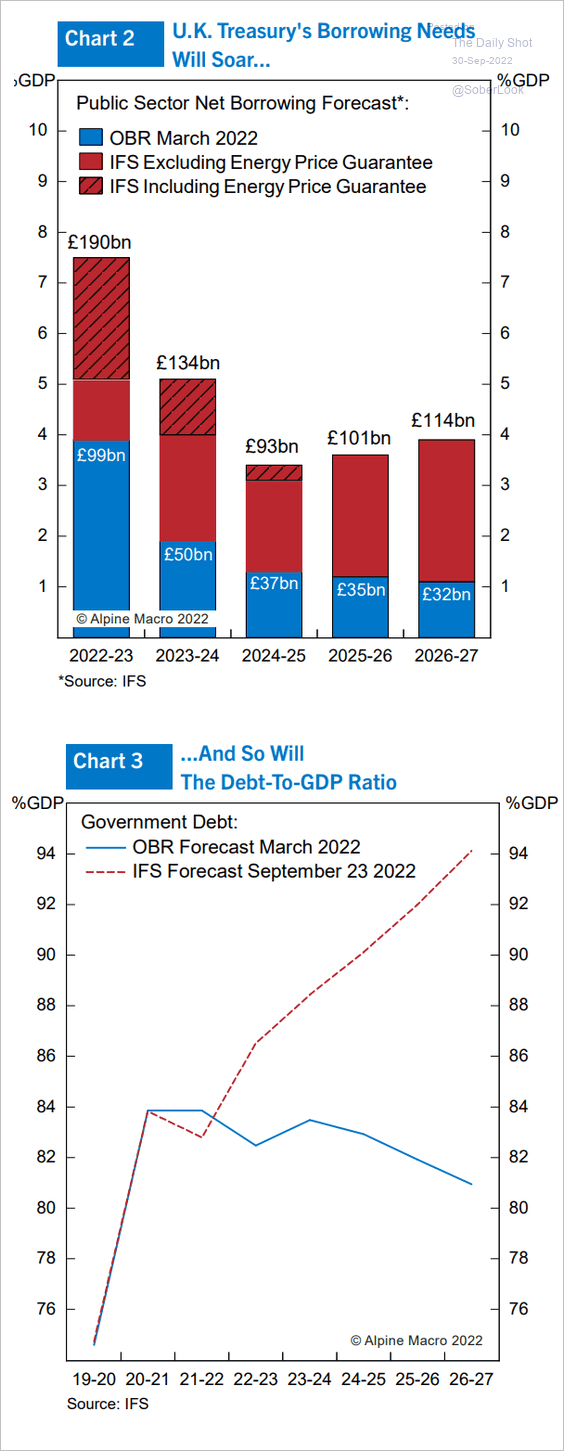 Source: Alpine Macro
2. UK equity outflows hit a record this year.
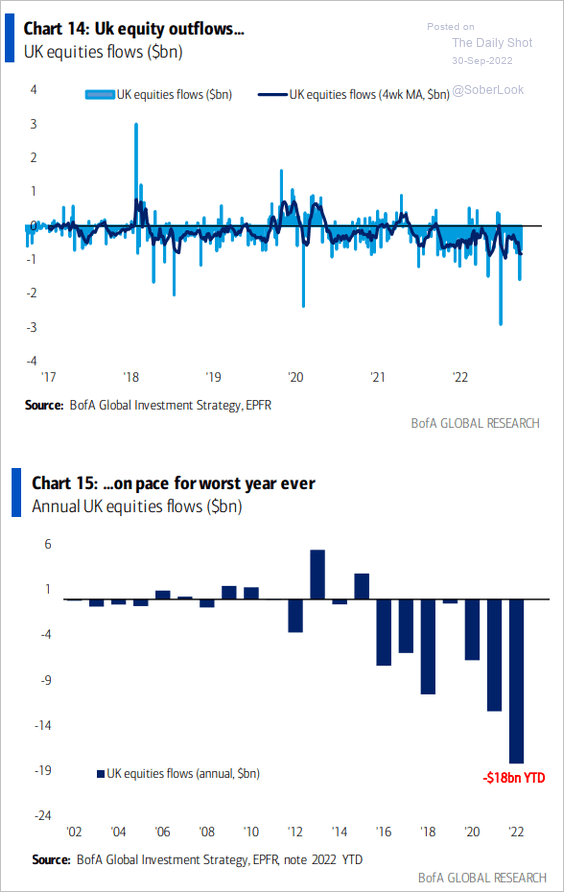 Source: BofA Global Research
3. The pound is heavily discounted relative to fundamentals.
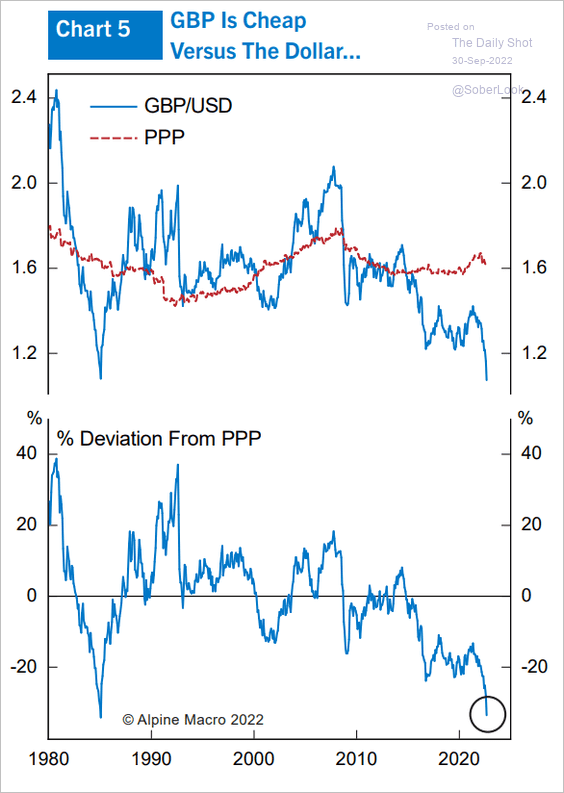 Source: Alpine Macro
4. This chart shows the latest general election voting intentions.
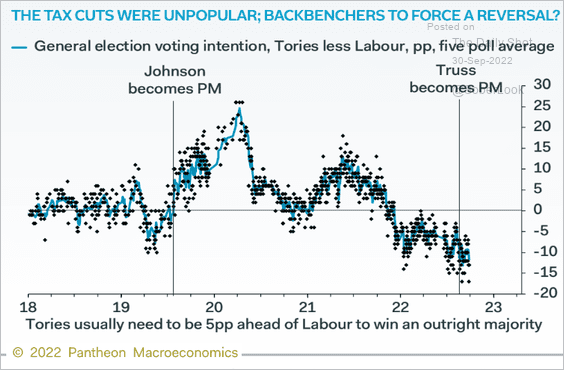 Source: Pantheon Macroeconomics
Back to Index
The Eurozone
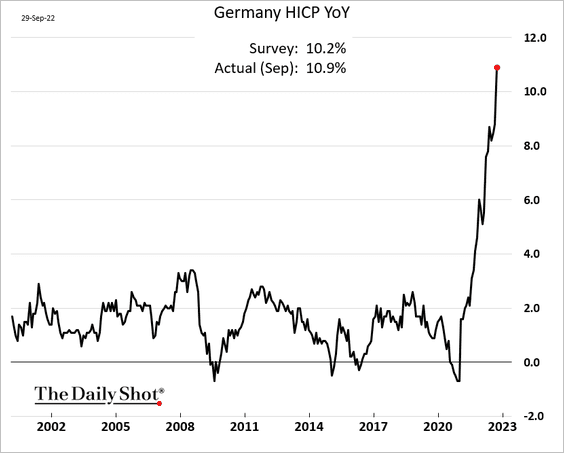
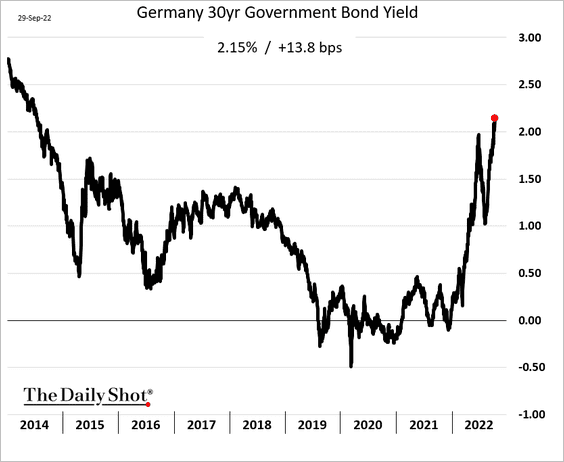
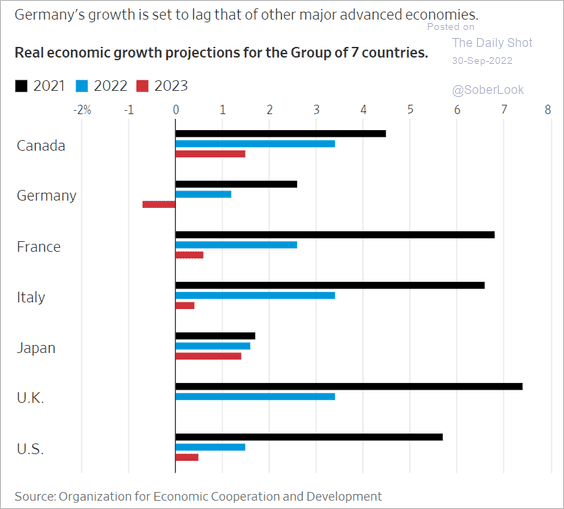
1. Let’s begin with Germany.
• The nation’s CPI climbed above 10% this month, exceeding forecasts.
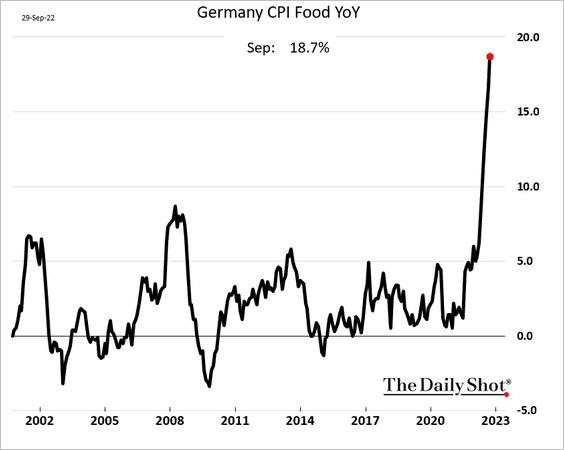
• Food inflation is nearing 20%.
• Bund yields continue to climb.
• One of these forecasts is not like the others.
 Source: @WSJ Read full article
• Germany’s reduction in natural gas consumption has been impressive.
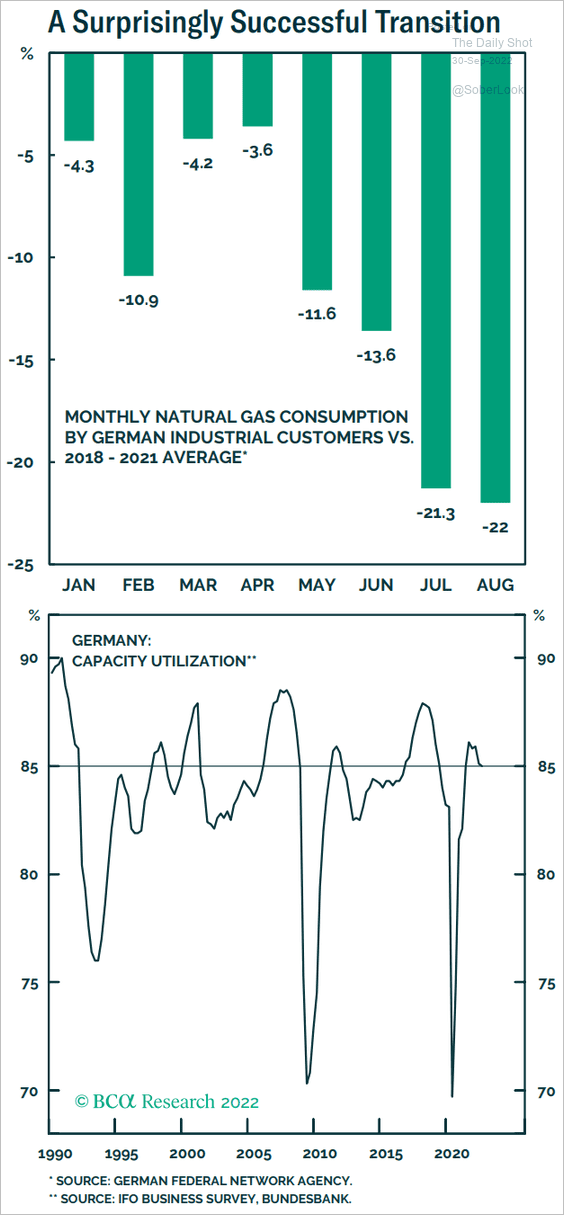 Source: BCA Research
——————–
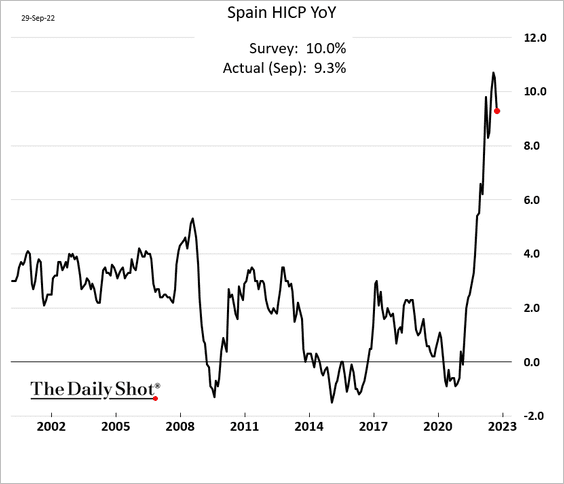
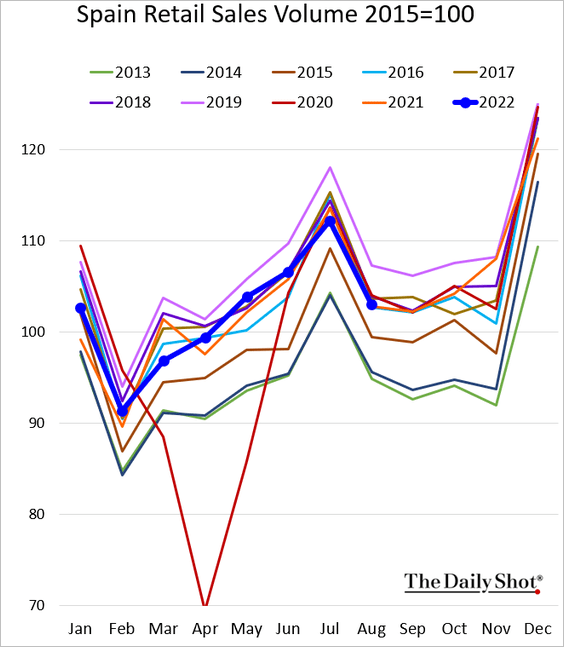
2. Spain’s CPI appears to have peaked.
Retail sales are running at last year’s levels.
——————–
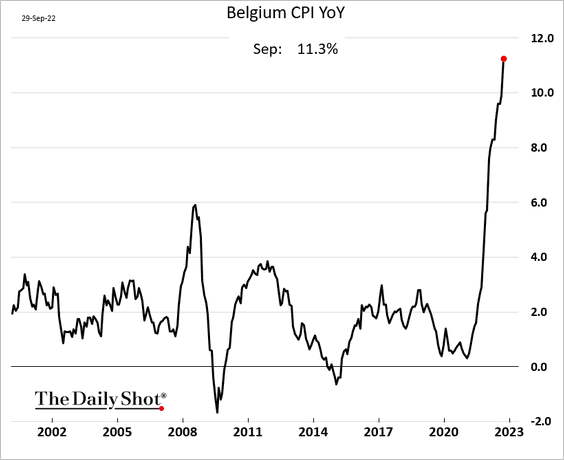
3. Belgian inflation keeps surging.
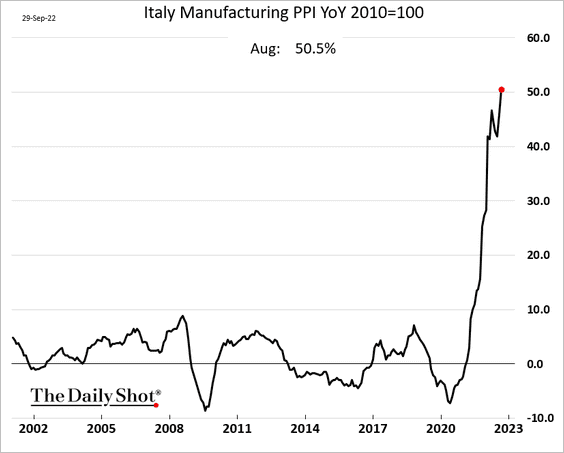
4. Italian PPI breached 50% in August.
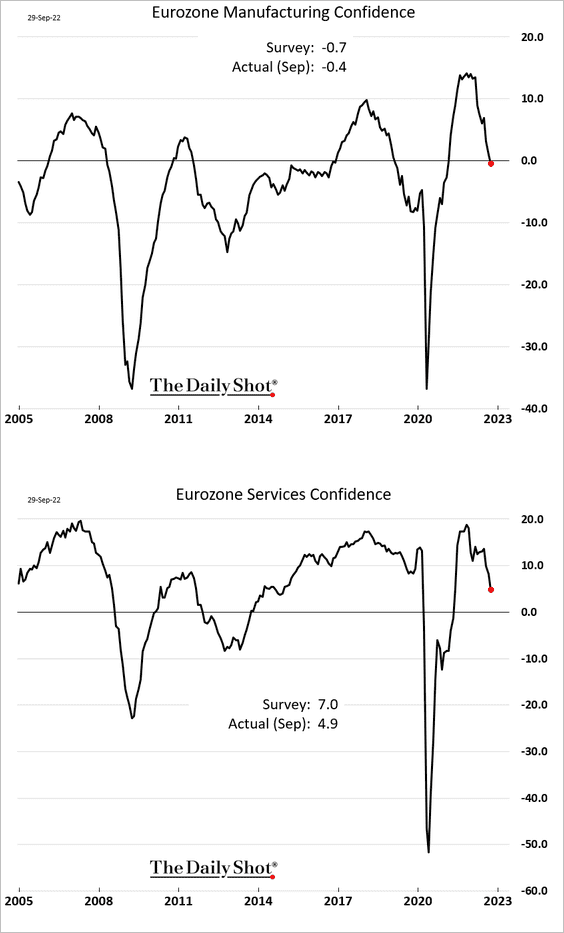
5. Euro-area business confidence has been rolling over.
Back to Index
Europe
1. The stock market is nearing 2020 levels.
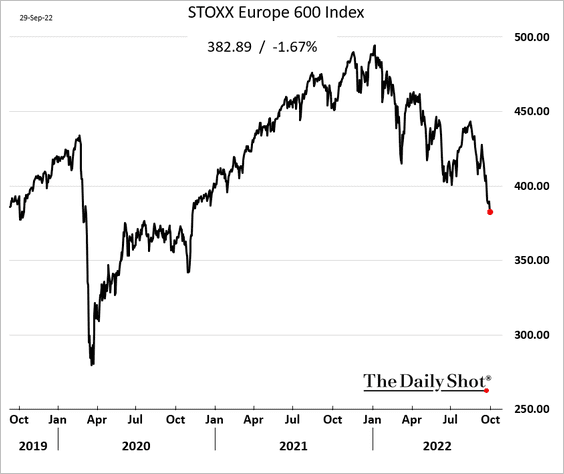
Stocks now trade at the cheapest levels in a decade.
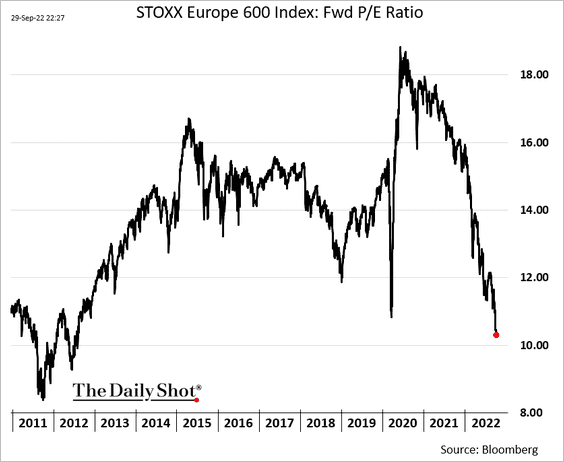 h/t Farah Elbahrawy
What does the FedEx crash tell us about European stocks going forward?
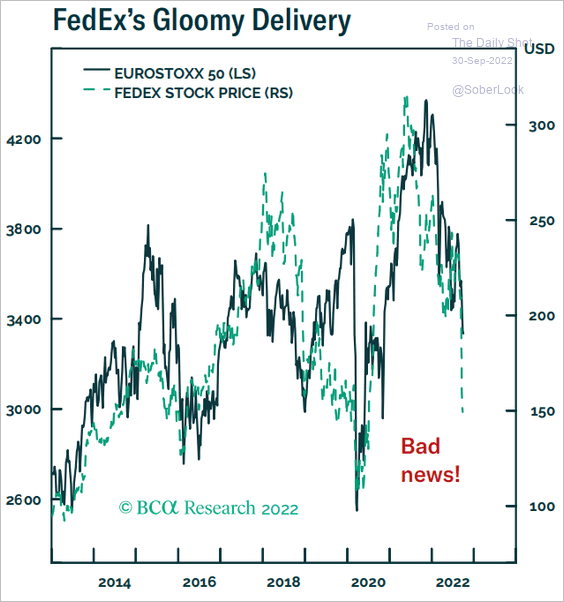 Source: BCA Research
——————–
2. Europe is rapidly importing solar panels from China.
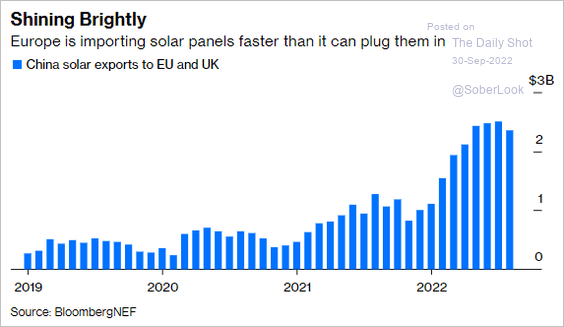 Source: Bloomberg Read full article
Back to Index
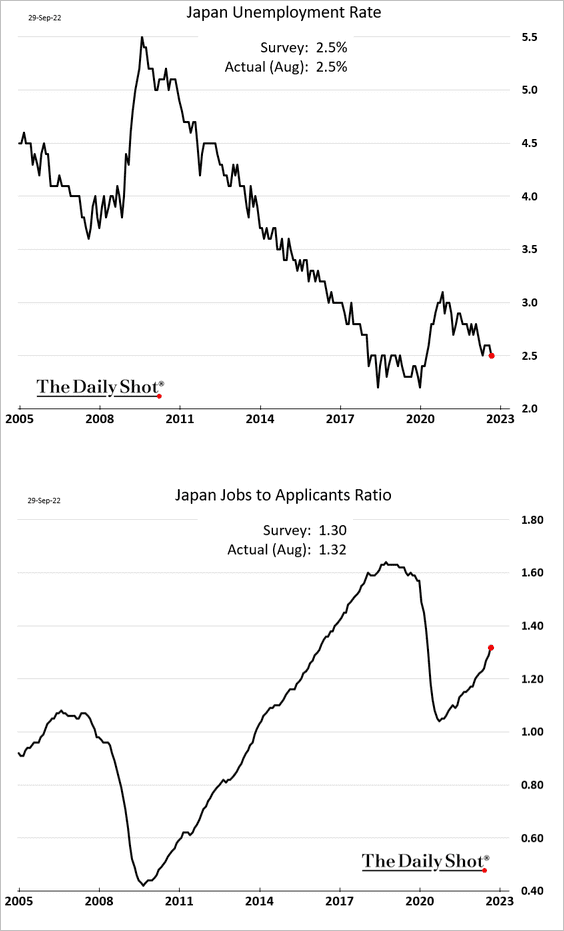
Japan
1. The labor market continues to tighten.
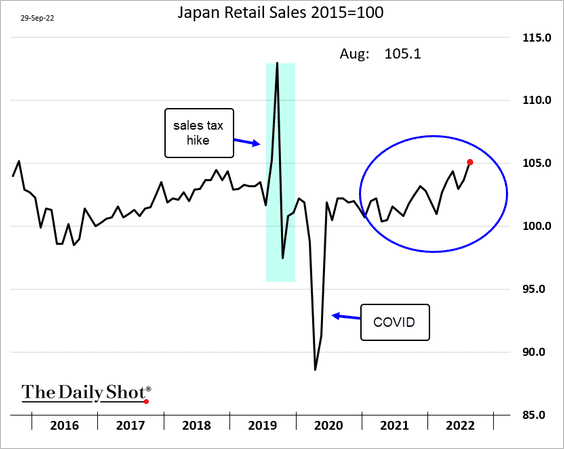
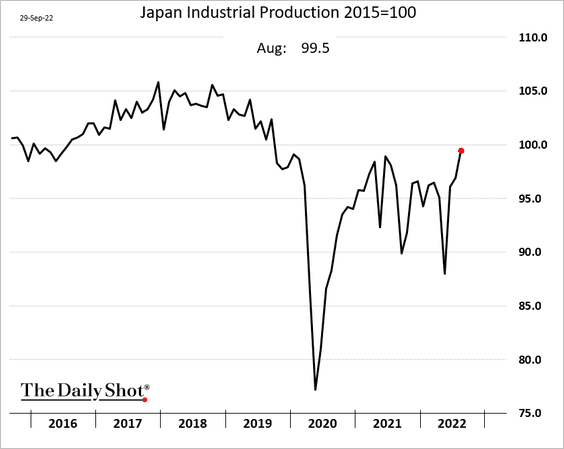
2. The economy is pulling out of the COVID slump.
• Retail sales:
• Industrial production:
More gains ahead for industrial output? Here is a forecast from Capital Economics.
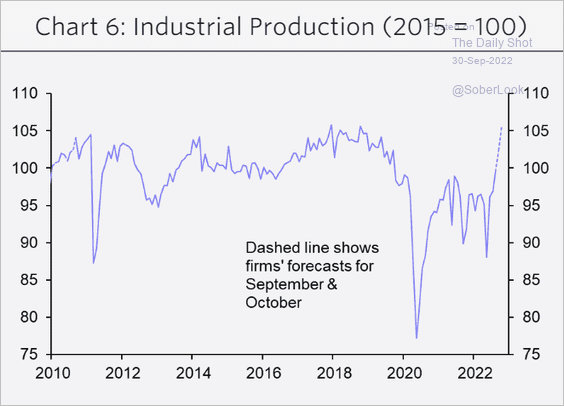 Source: Capital Economics
Back to Index
Asia – Pacific
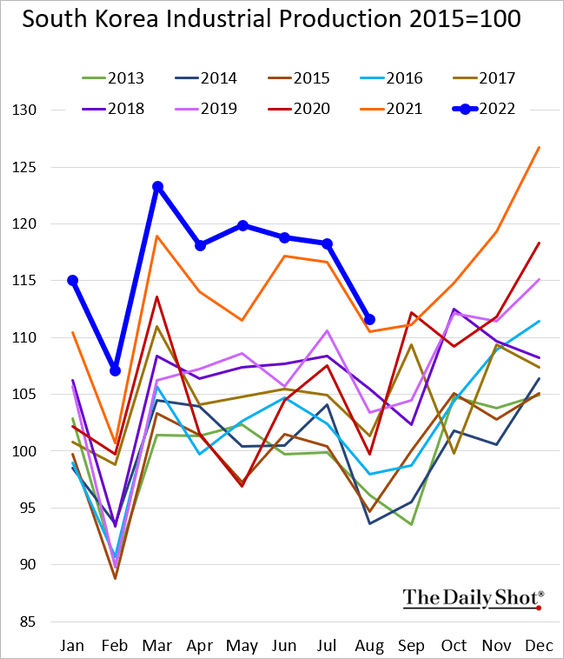
1. Sout Korea’s industrial production softened in August but remained above last year’s levels.
2. Australia’s credit growth has been accelerating, …
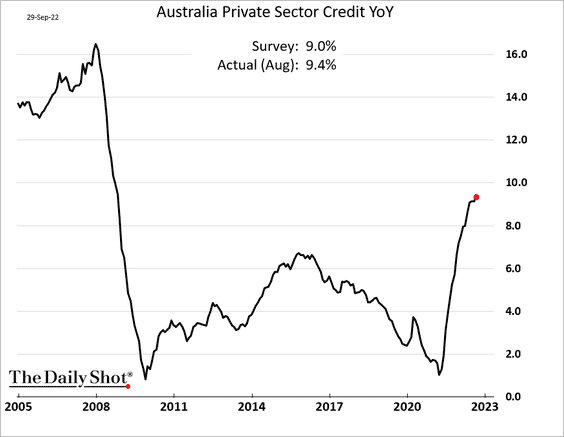
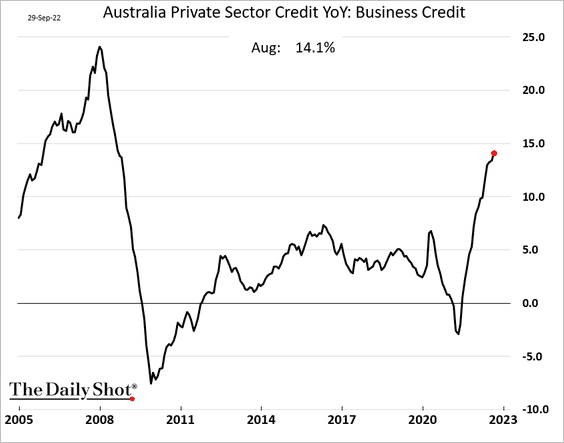
… driven by business loans.
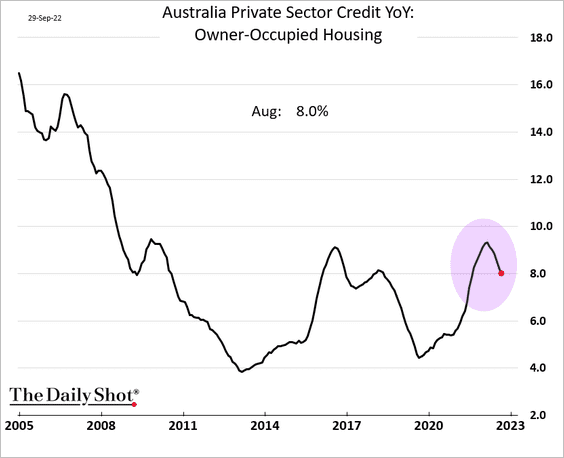
Housing credit is slowing.
Back to Index
China
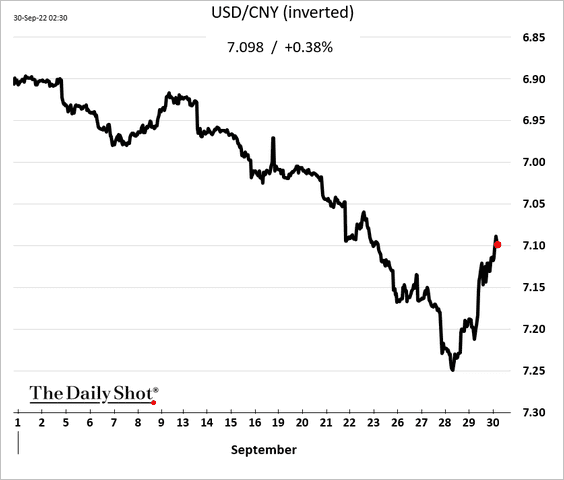
1. The PBoC is getting more aggressive in its attempts to halt the renminbi’s slide.
 Source: Reuters Read full article
The currency bounced from multi-year lows.
——————–
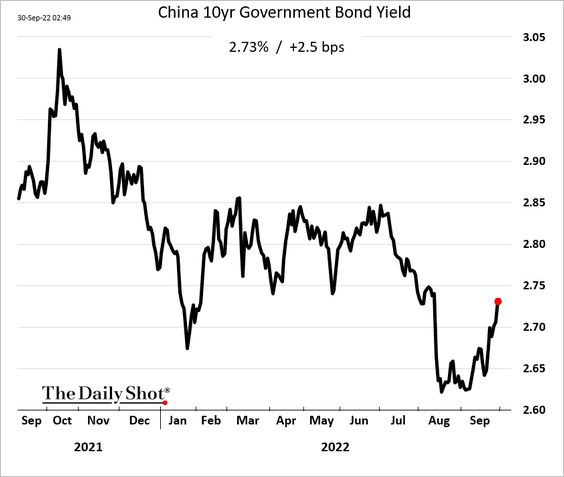
2. Bond yields have risen in September.
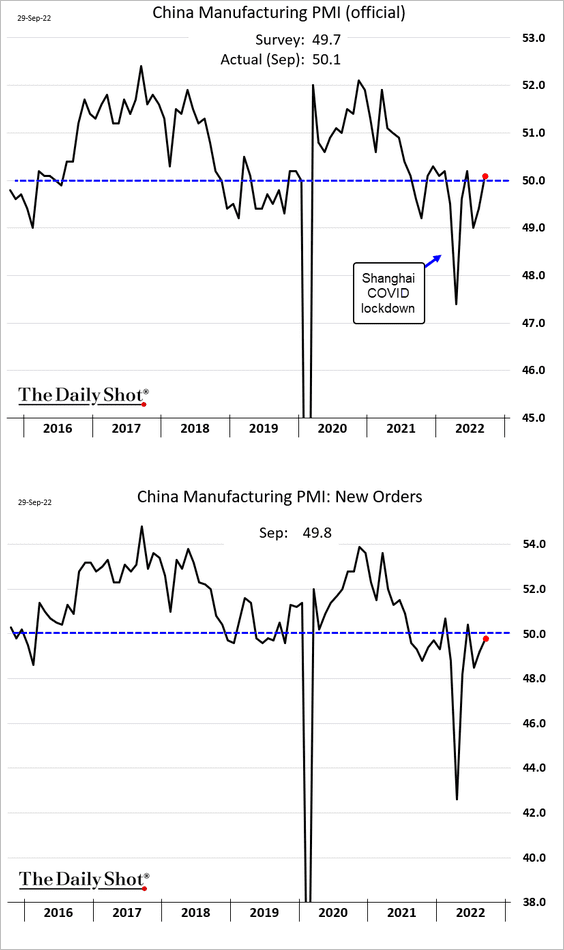
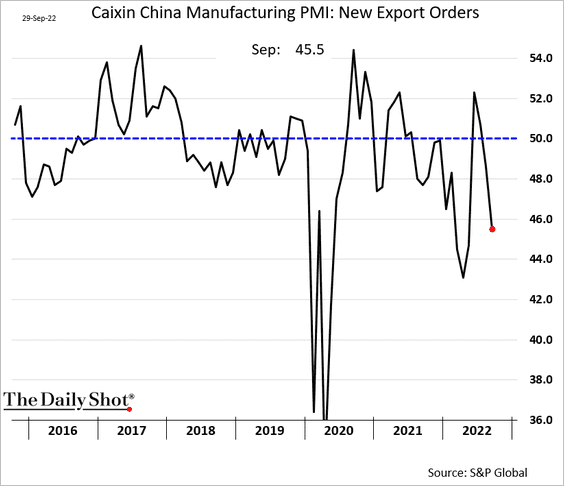
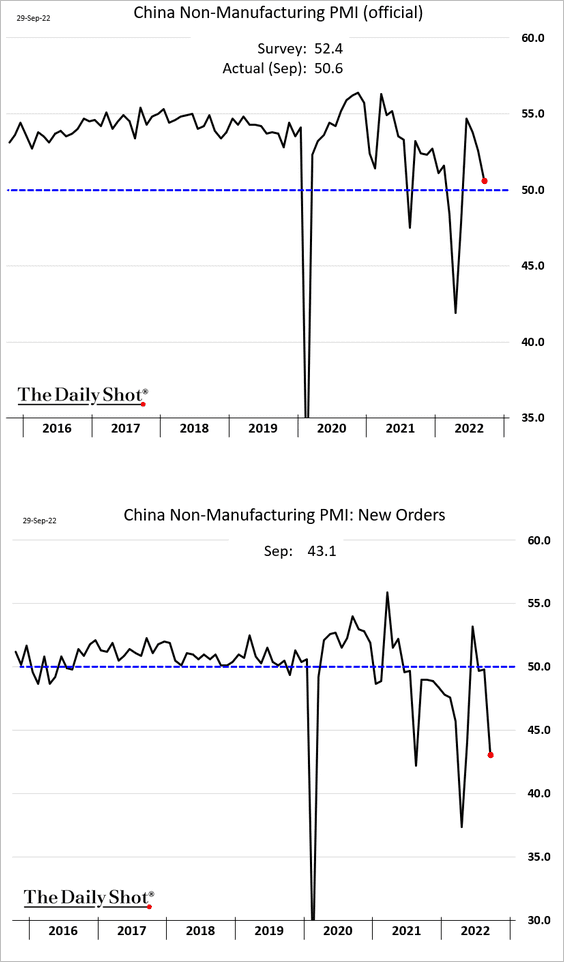
3. The September PMI reports painted a conflicting picture of China’s manufacturing activity.
• The official PMI showed an improvement ahead of the 20th National Congress.
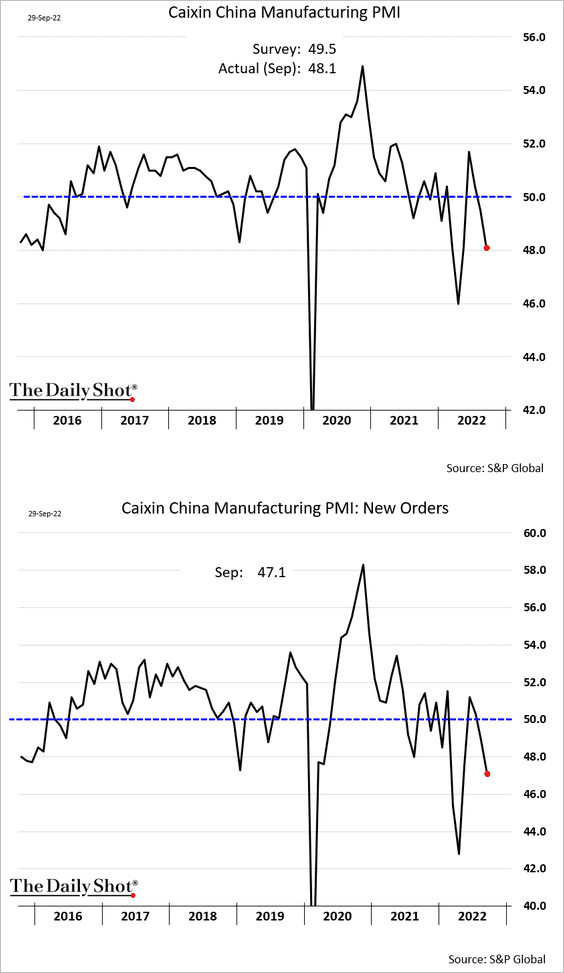
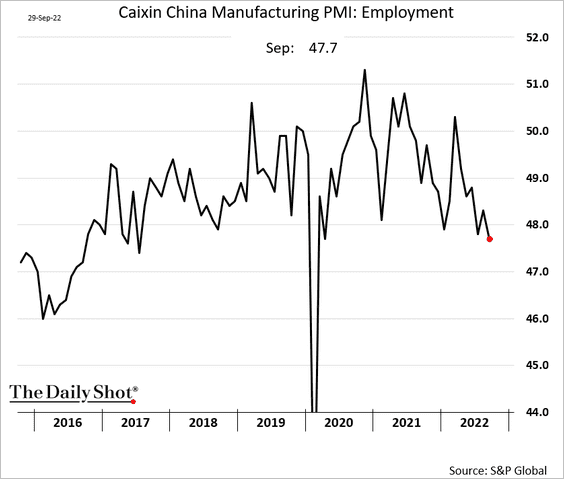
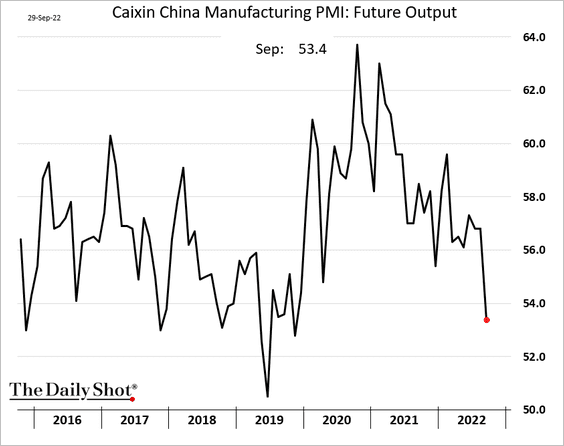
• The S&P Global report showed worsening conditions for China’s factories. The PMI is well below 50, which indicates contraction.
– The headline index and new orders:
– Export orders:
– Employment:
– Output expectations:
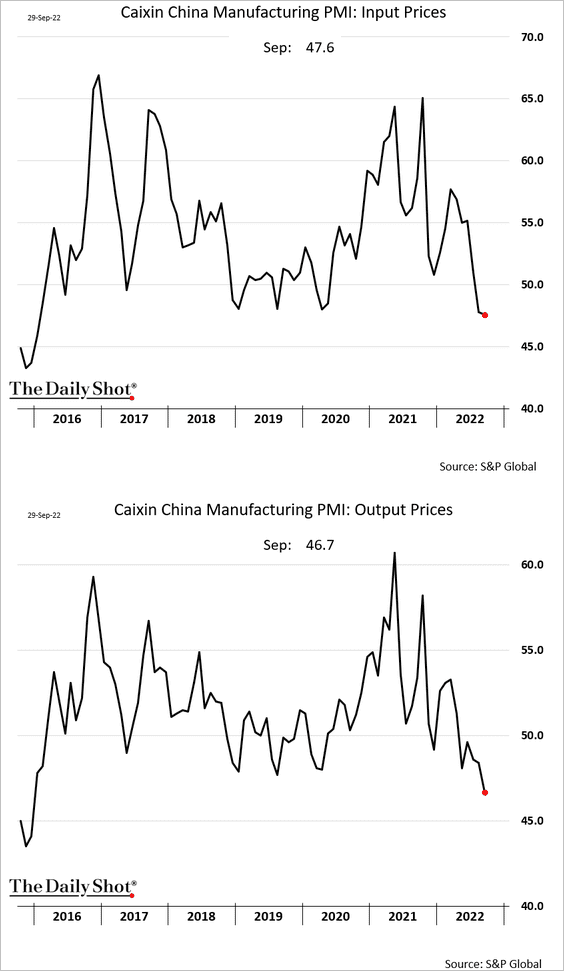
– Prices continue to fall.
• The non-manufacturing PMI was lower but still in growth territory. Non-manufacturing orders slumped.
Back to Index
Emerging Markets
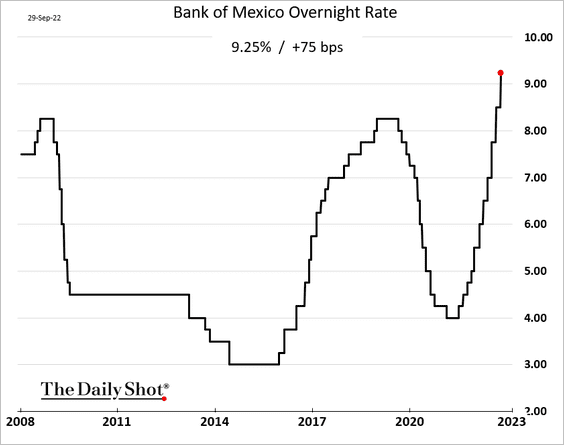
1. Banxico followed the Fed with a 75 bps rate hike.
Inflation expectations were revised higher – again.
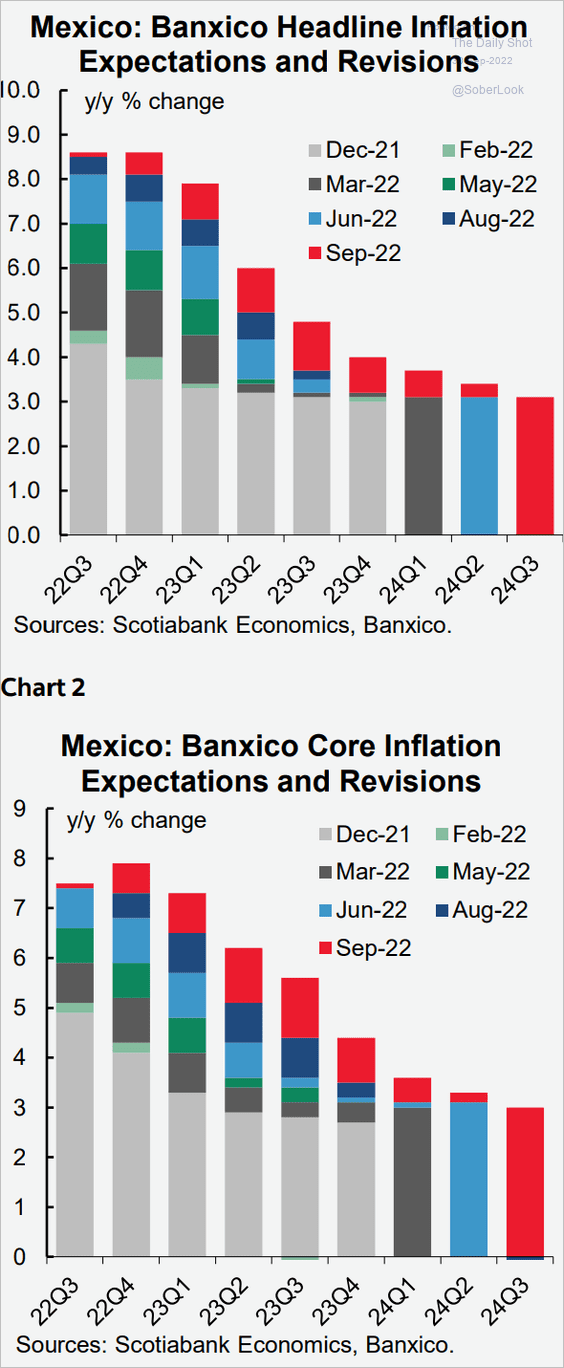 Source: Scotiabank Economics
——————–
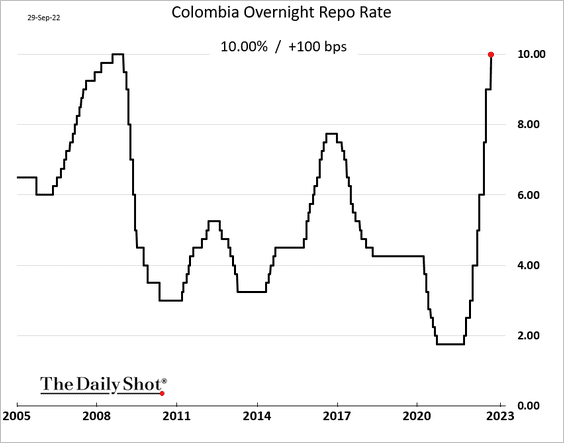
2. Colombia’s central bank also hiked rates.
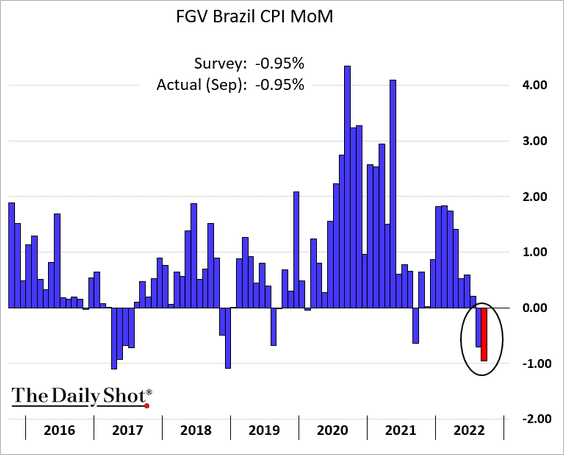
3. Prices are now falling in Brazil.
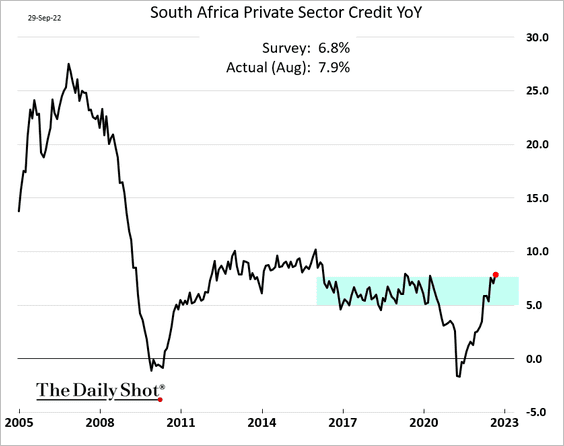
4. South Africa’s credit growth surprised to the upside.
Back to Index
Energy
1. OIES expects gas-to-oil substitution to increase over the next two quarters, with 50% of the gains concentrated in Europe.
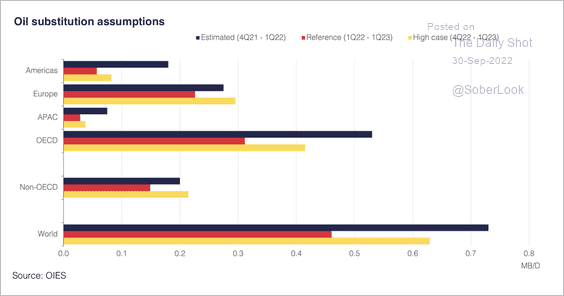 Source: Oxford Institute for Energy Studies
2. Oil demand is highly correlated to GDP growth.
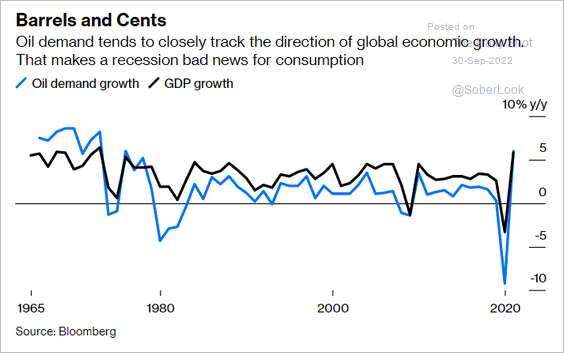 Source: Bloomberg Read full article
3. The focus is now on the remaining gas pipelines to Europe.
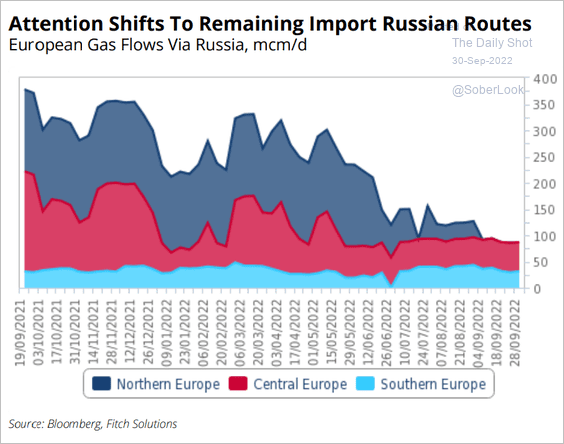 Source: Fitch Solutions Macro Research
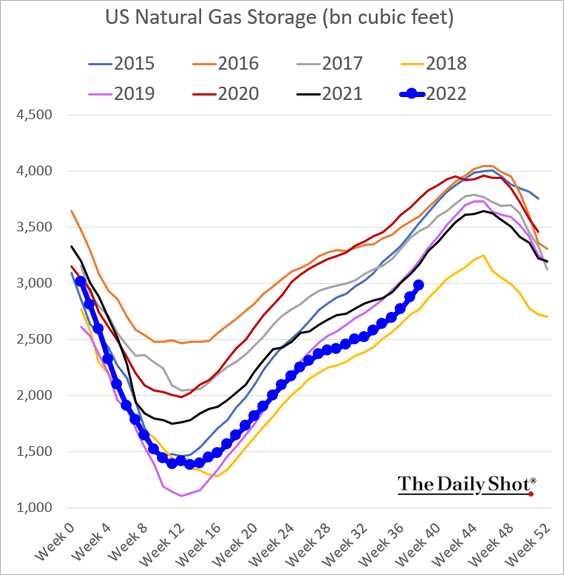
4. US natural gas prices dipped below $7.0/MMBtu, …
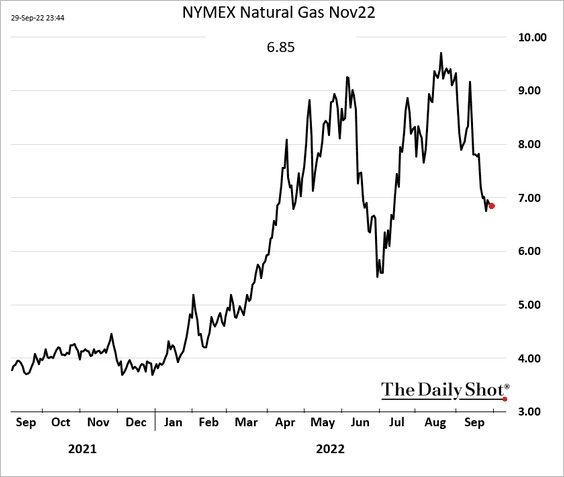
… as storage levels show signs of improvement.
Back to Index
Equities
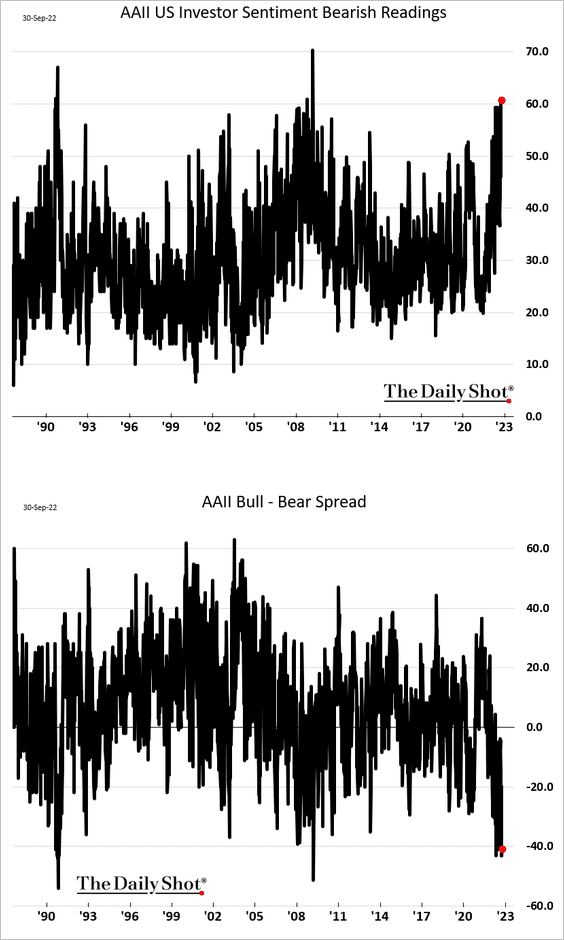
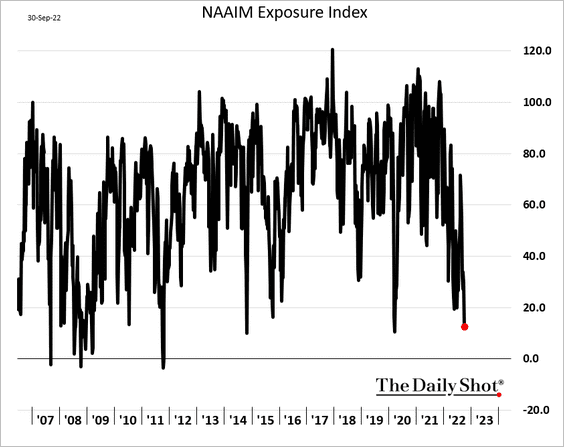
1. Investor sentiment is at bearish levels not seen since the financial crisis – pointing to a market bounce.
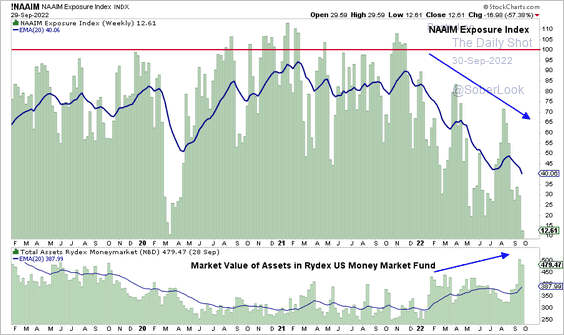
• Investment managers’ exposure to stocks reached the 2020 lows.
Managers continue to reduce their exposure to equities while the value of assets in money market funds rises.
 Source: Aazan Habib, Paradigm Capital
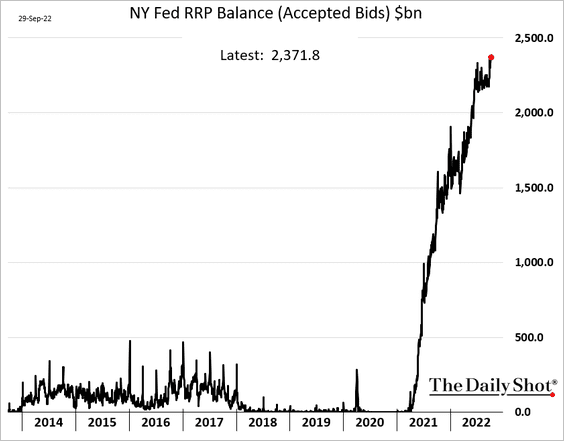
• Frightened investors’ demand for money market assets sent the Fed’s reverse repo balance to record highs (almost $2.4 trillion).
• Put option volumes have been surging.
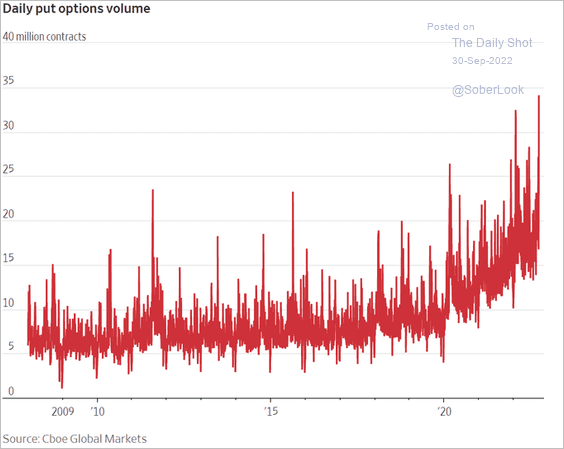 Source: @GunjanJS, @WSJmarkets Read full article
Retail investors’ put options have now exceeded calls.
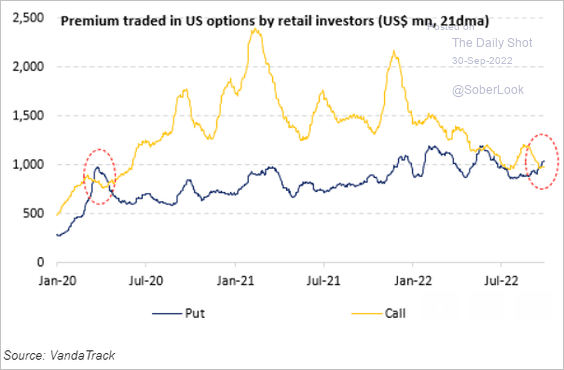 Source: Vanda Research
• The BofA Bull-Bear Index is deep in bear territory.
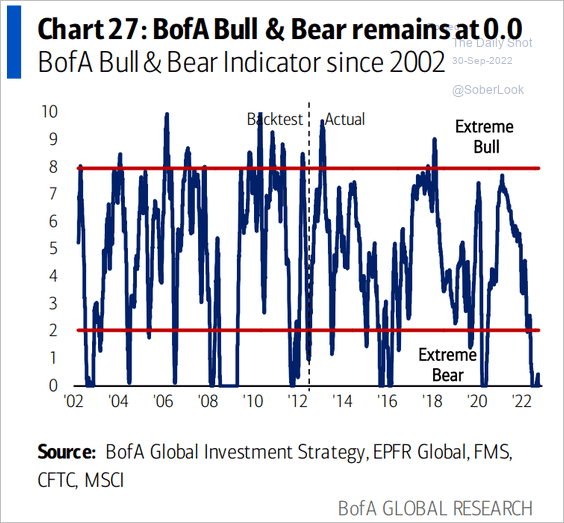 Source: BofA Global Research
——————–
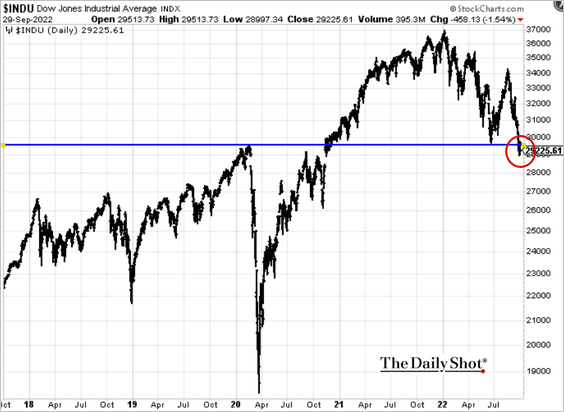
2. The Dow Jones Industrial Average is breaking down.
3. Here is the S&P 500 seasonality.
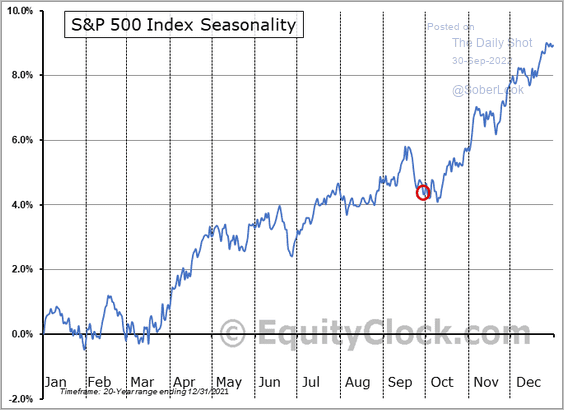 Source: @EquityClock
4. Tech mega-caps continue to trade at a massive premium to the rest of the market.
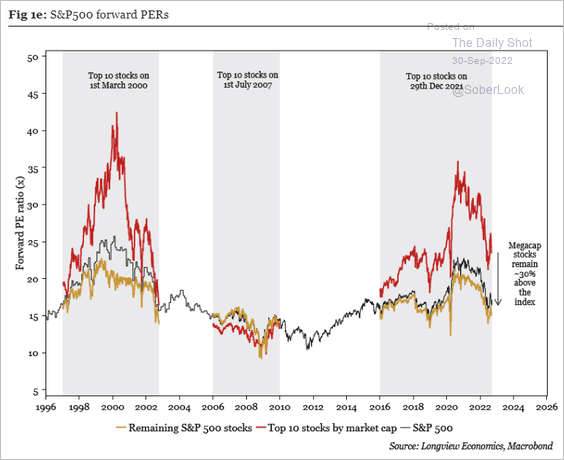 Source: Longview Economics
5. The US IPO volume is at the lowest level since the 2008/09 period.
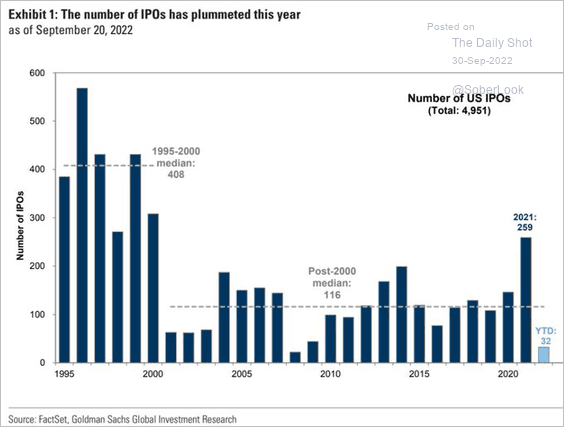 Source: Goldman Sachs; @Maverick_Equity
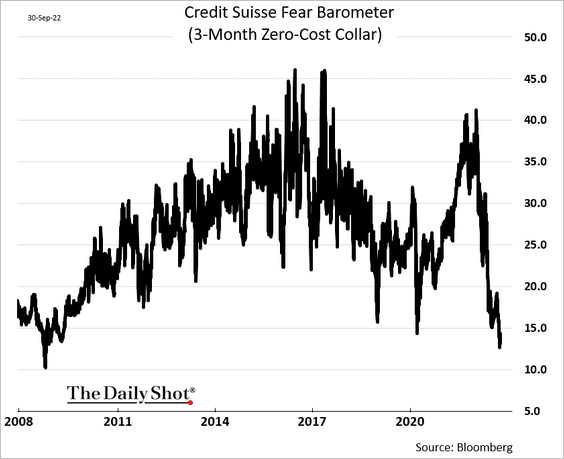
6. Put options (downside protection) are very cheap relative to calls. Here is the definition of the index shown below (from Bloomberg).
The CS Fear Barometer measures investor sentiment for 3-month investment horizons by pricing a zero-cost collar. The collar is implemented by selling of a 10% OTM SPX call option and using the proceeds to buy an OTM put. The index level represents how far out-of-the-money that SPX put is.
Back to Index
Credit
1. Outflows from investment-grade bonds have been extreme.
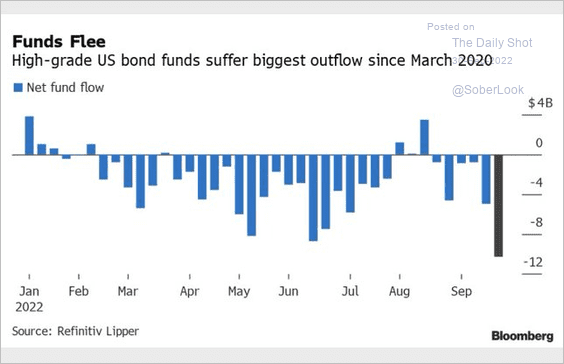 Source: @lisaabramowicz1, @TheTerminal
But capital is starting to return.
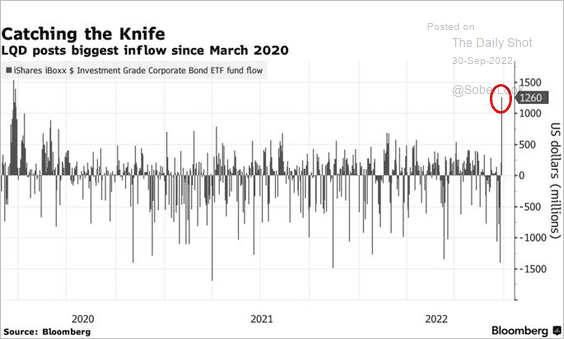 Source: @markets, @kgreifeld Read full article
——————–
2. North American corporate debt downgrades accelerated in September.
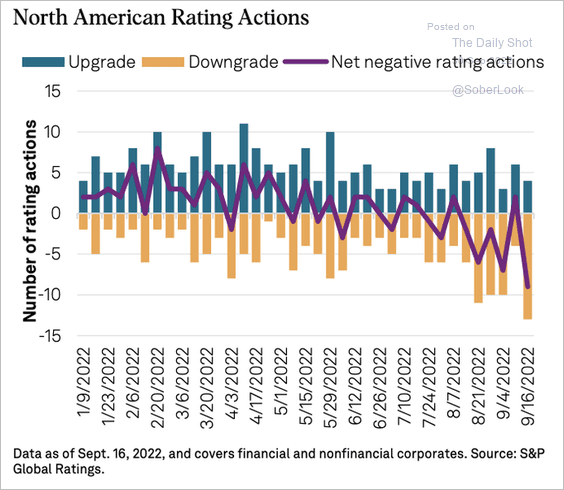 Source: @SPGlobal, @SPGlobalRatings, h/t @pav_chartbook Read full article
3. US non-financial corporate debt as a share of GDP remains elevated.
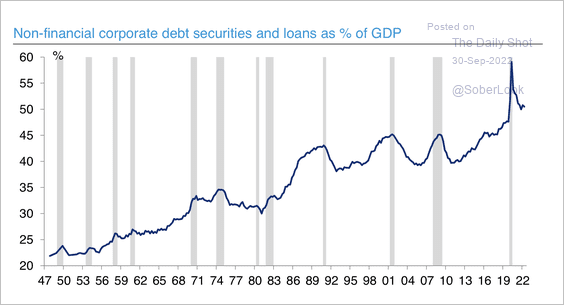 Source: Deutsche Bank Research
Back to Index
Rates
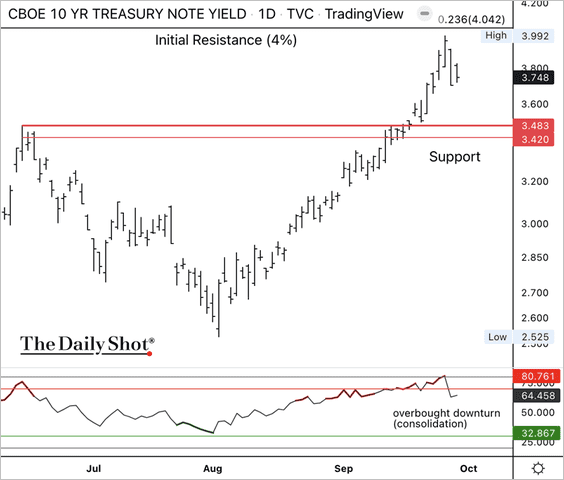
1. This chart shows the cumulative volume related to specific yields over the past five months. Will the 10-year Treasury yield hold support around 3.42%?
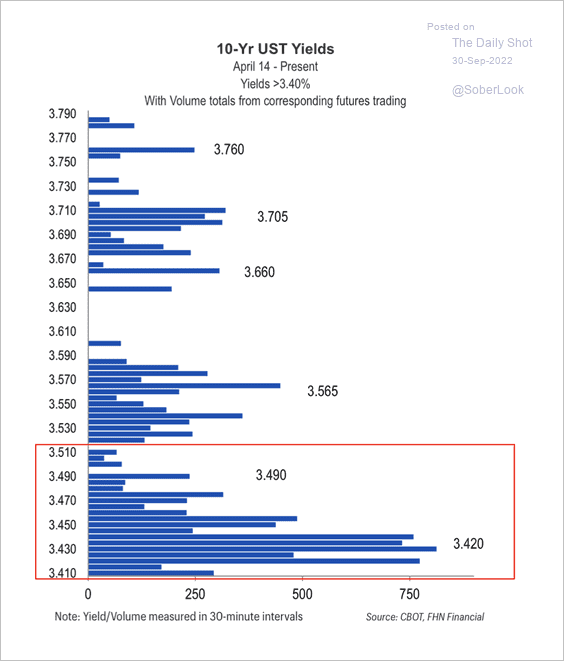 Source: FHN Financial
——————–
2. Treasury market implied volatility keeps surging.
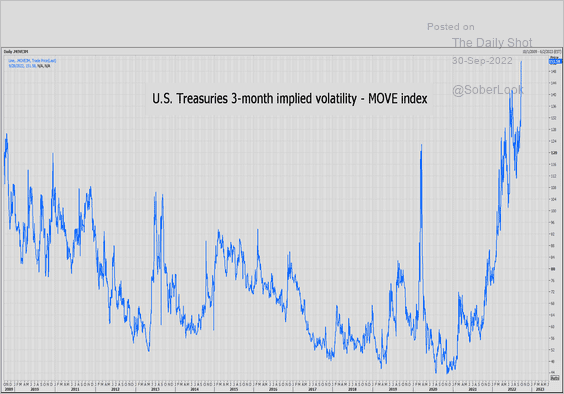 Source: @NigelStevenson5, @ReutersJamie Read full article
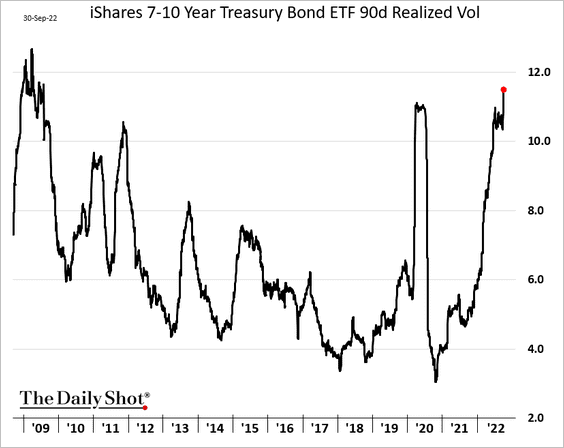
Realized volatility in Treasuries is reaching extreme levels.
——————–
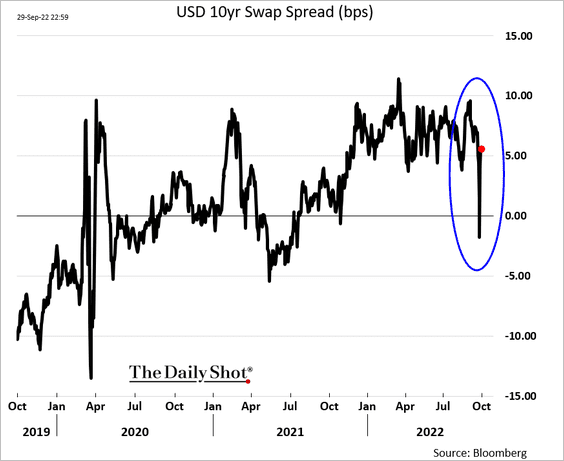
3. Swap spreads haven’t been this volatile since early 2020 as fixed-income liquidity worsens.
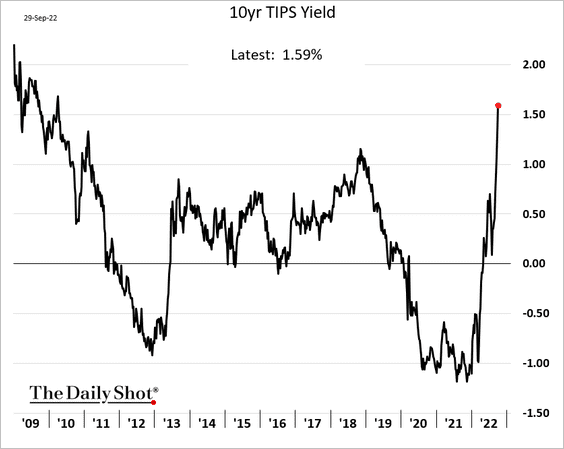
4. Investors have been dumping Treasury Inflation-Protected Securities (TIPS), …
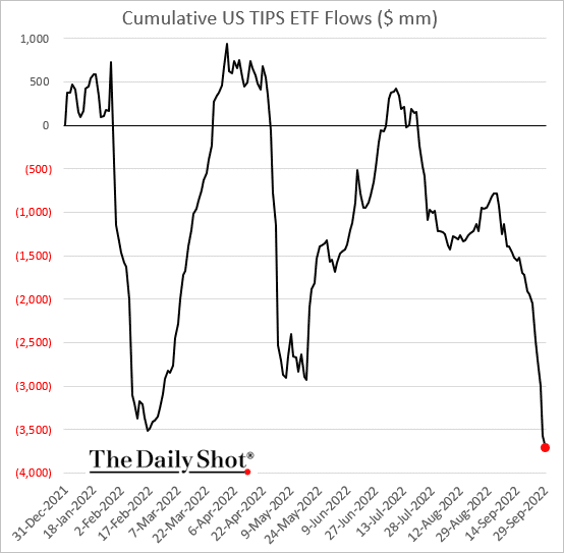
… driving up real yields.
——————–
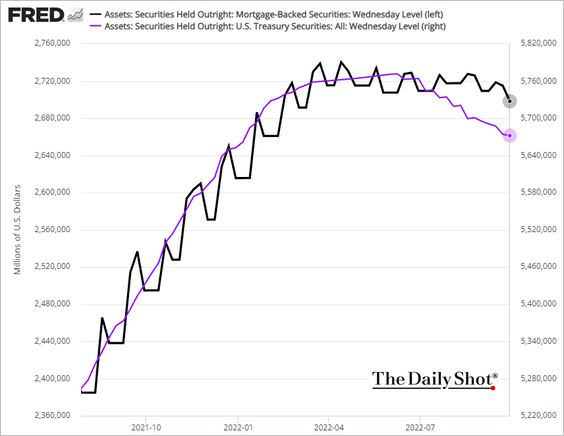
5. The Fed’s MBS portfolio balance should begin to move lower, albeit at a slower pace than the central bank would prefer.
Back to Index
Global Developments
1. Bond yields have been hitting multi-year highs across the G-7 economies.
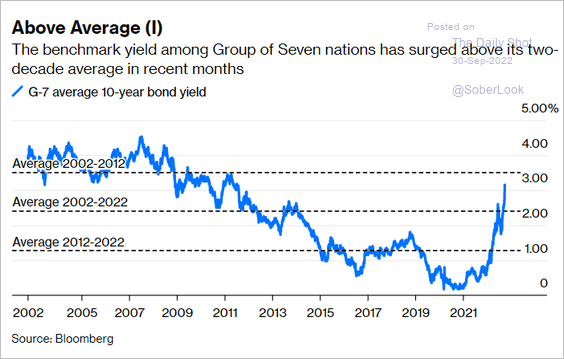 Source: Bloomberg Read full article
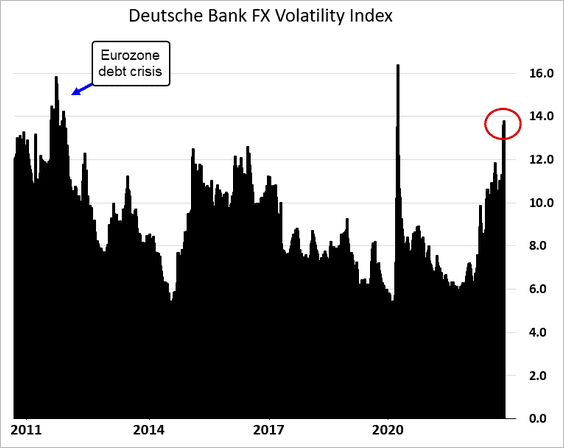
2. FX market implied volatility has been surging.
3. The US dollar is trading well above the levels implied by real yield differentials.
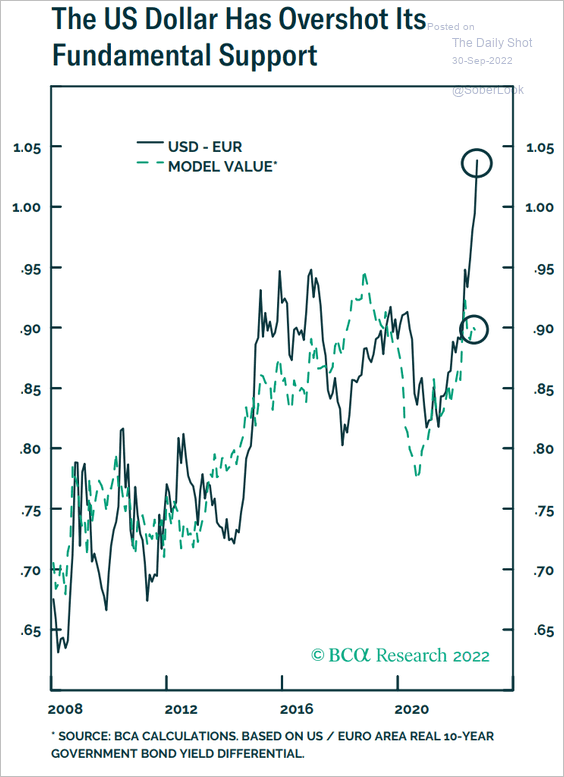 Source: BCA Research
4. Global financial conditions have become exceptionally tight, which will be a drag on economic growth.
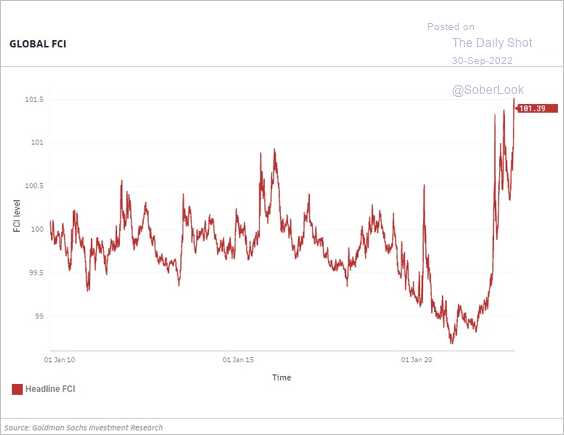 Source: @NigelStevenson5, @ReutersJamie Read full article
——————–
Food for Thought
1. Plant-based market growth:
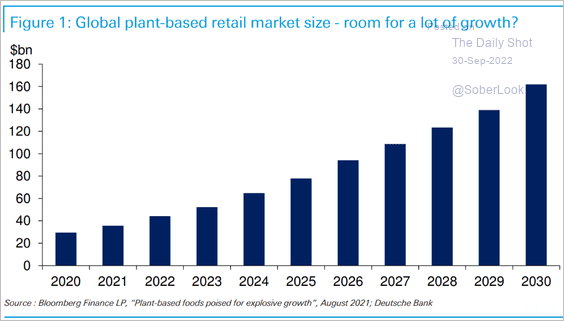 Source: Deutsche Bank Research
2. Sports betting demographics:
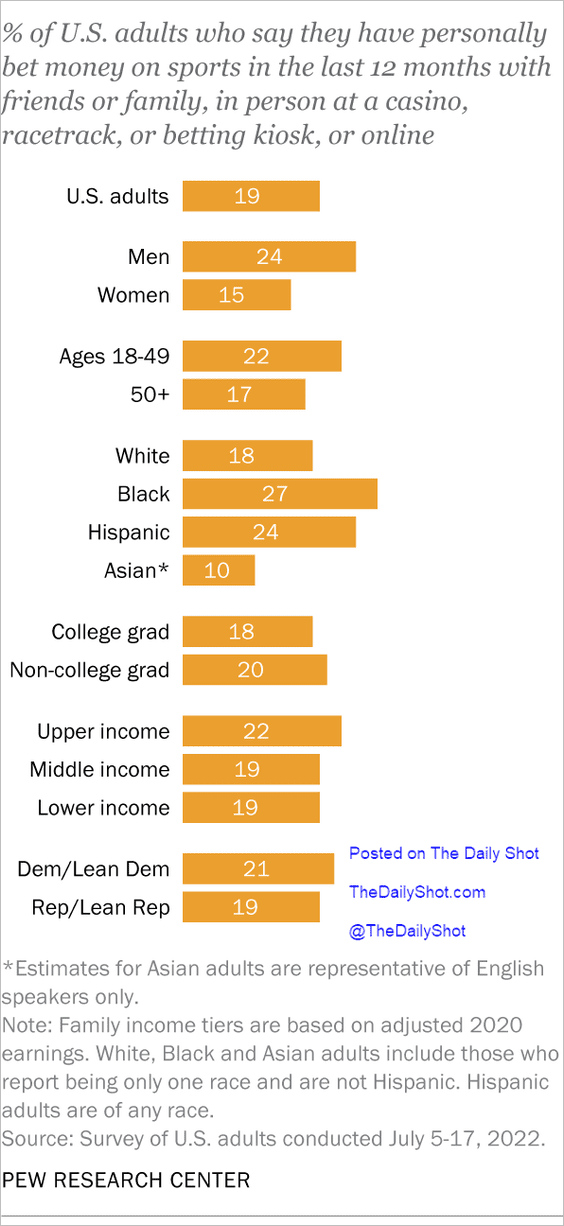 Source: Pew Research Center Read full article
3. Ownership of primary tech devices among older Americans:
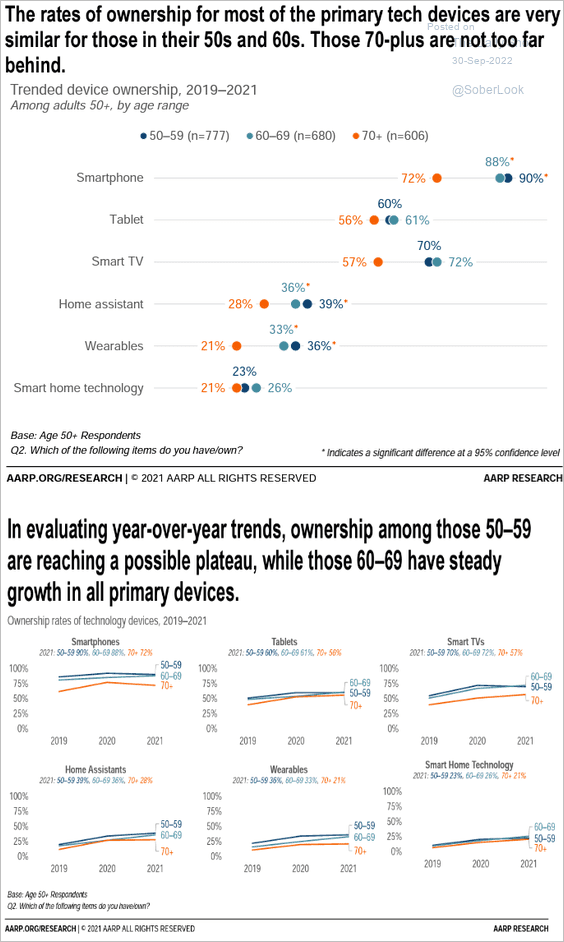 Source: AARP Read full article
4. Crypto fraud in the pandemic era:
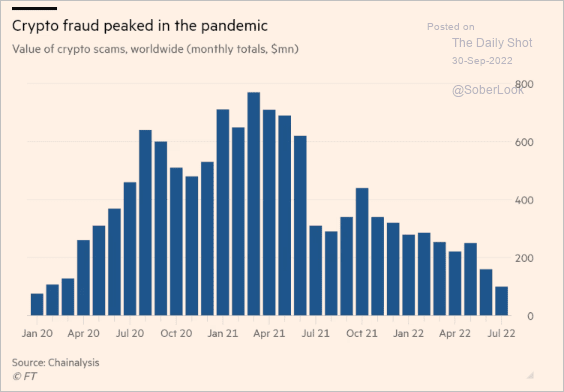 Source: @financialtimes Read full article
5. US Christian population:
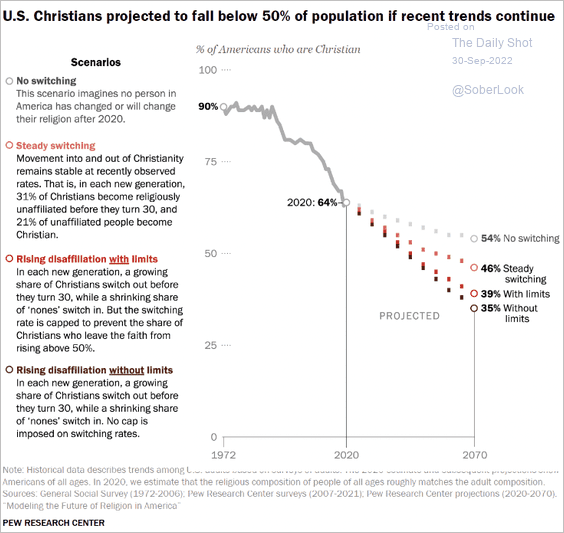 Source: Pew Research Center Read full article
6. Negatives and positives of job postings:
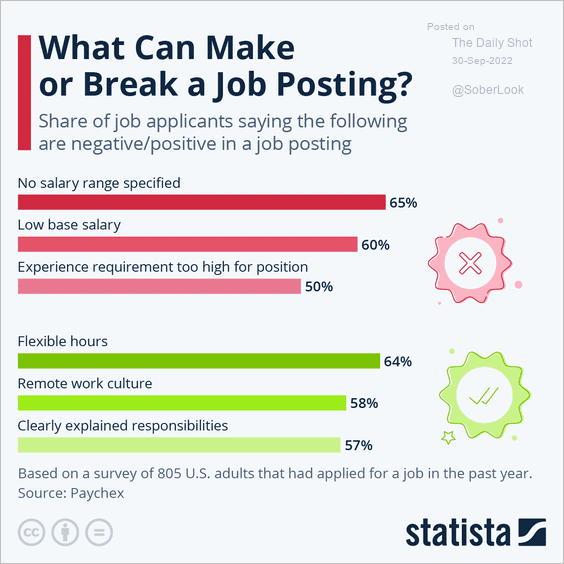 Source: Statista
7. Genome sizes:
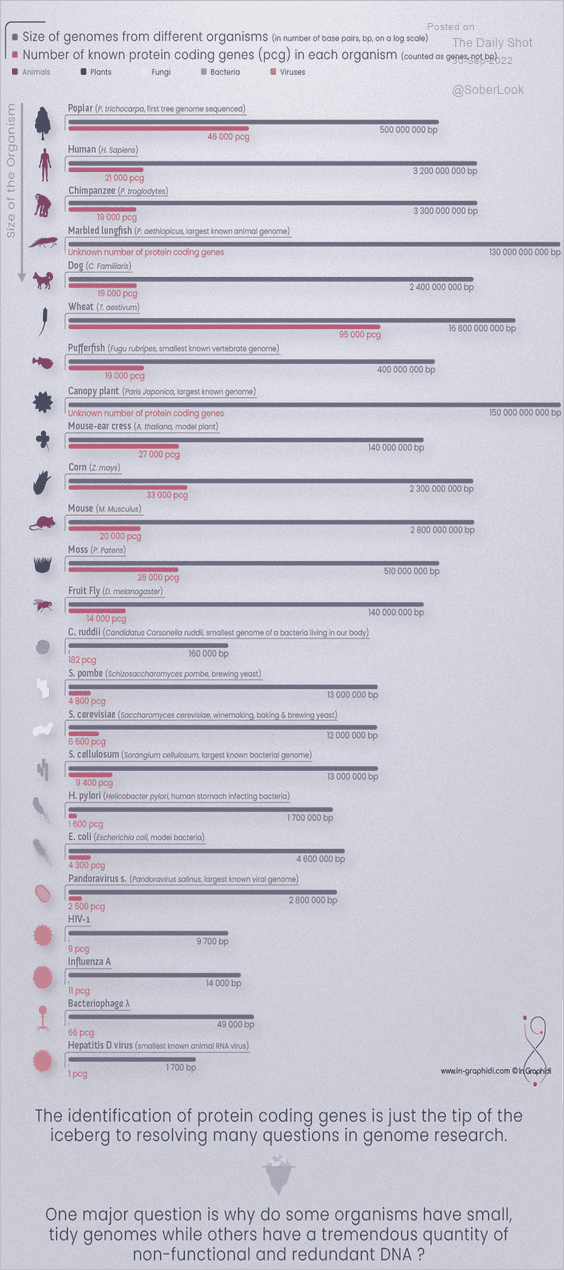 Source: Visual Capitalist Read full article
——————–
Have a great weekend!
Back to Index