The Daily Shot: 03-Oct-22
• Administrative Update
• The United States
• The United Kingdom
• The Eurozone
• Europe
• Japan
• Asia – Pacific
• Emerging Markets
• Commodities
• Energy
• Equities
• Credit
• Rates
• Global Developments
• Food for Thought
Administrative Update
The Daily Shot will not be published on Monday, October 10th.
Back to Index
The United States
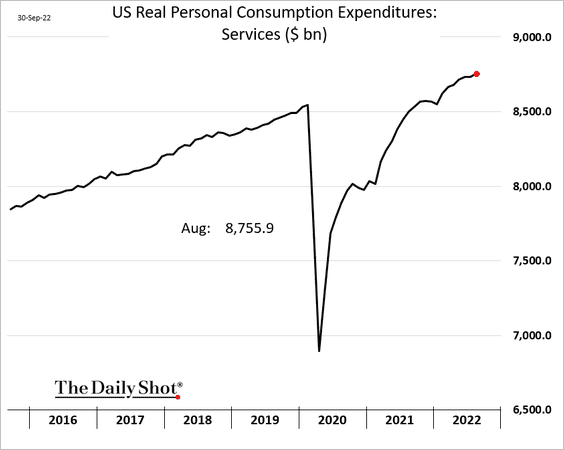
1. US consumer spending continues to climb. The Fed’s efforts to slow demand have not had the desired effect thus far.
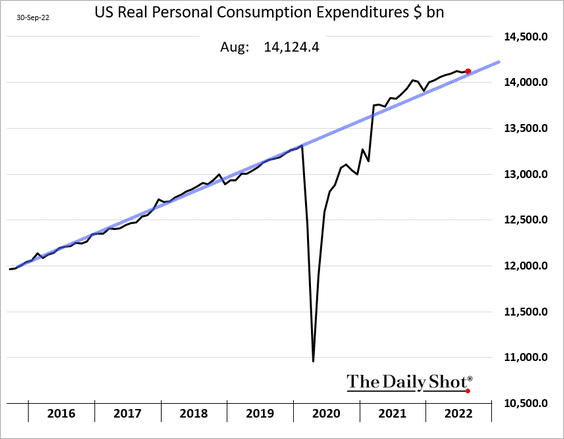
Services consumption has been robust.
Consumer spending on services and lower imports boosted the Atalanta Fed’s GDPNow estimate of economic growth in Q3.
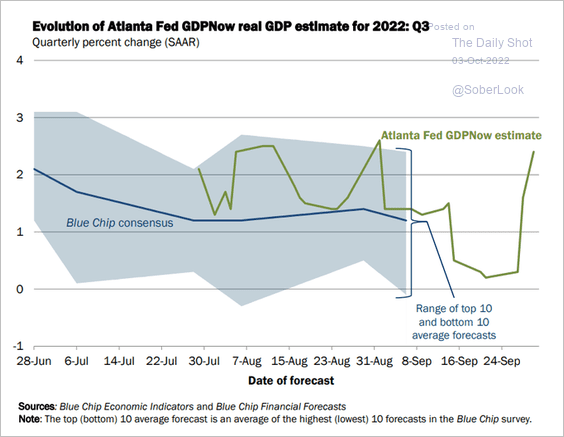 Source: @AtlantaFed
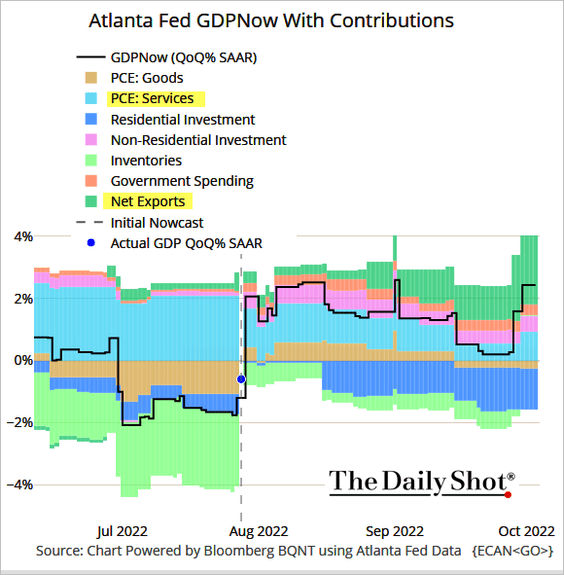 Source: @TheTerminal, Bloomberg Finance L.P.
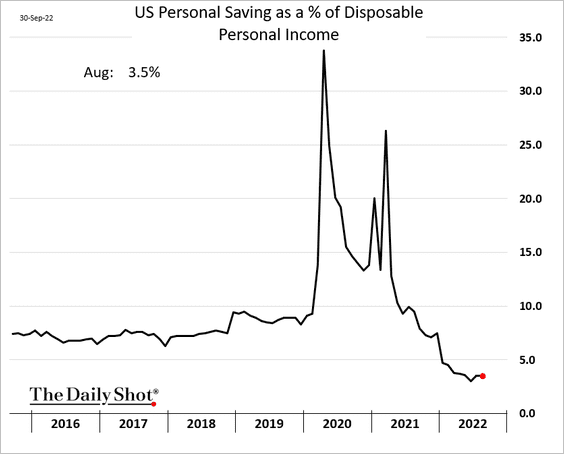
2. Personal saving remains well below pre-COVID levels.
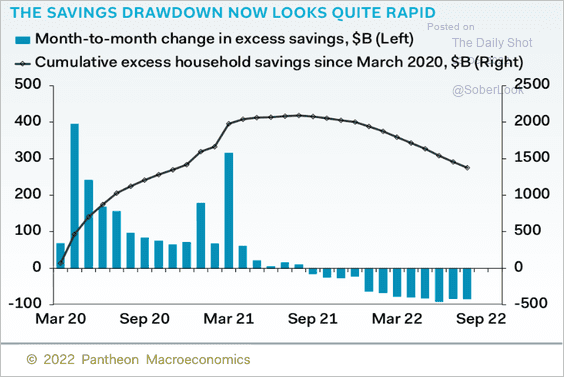
The COVID-era excess savings drawdown has accelerated.
 Source: Pantheon Macroeconomics
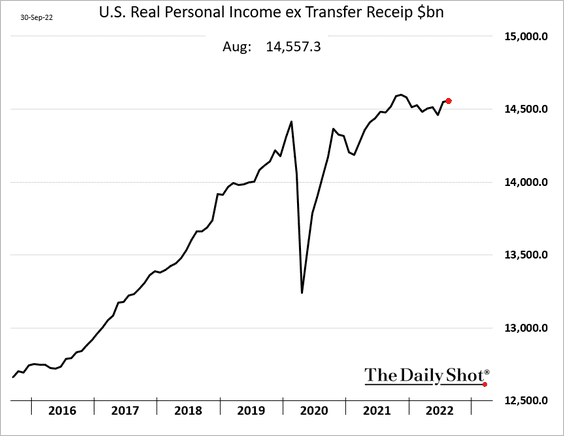
3. Real incomes, excluding government payments, edged higher in August.
——————–
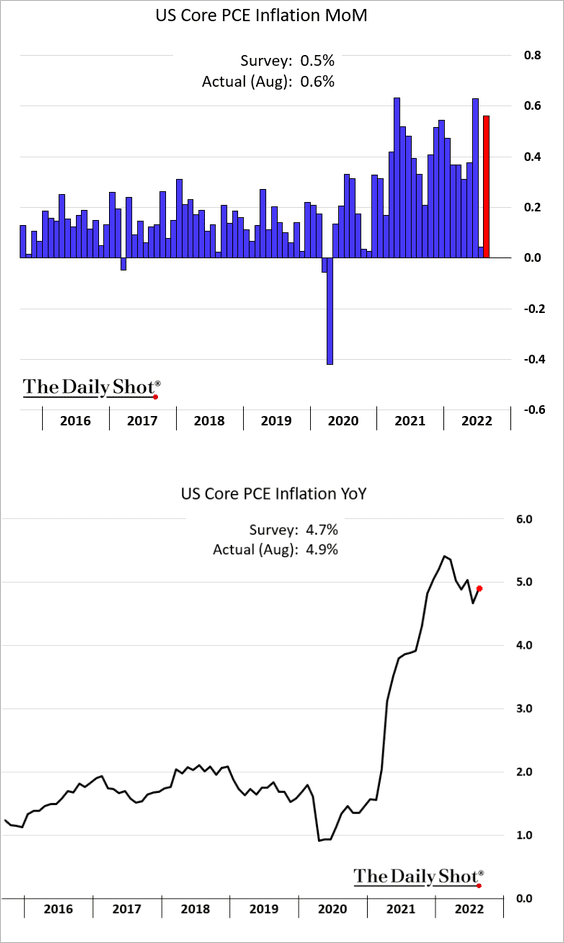
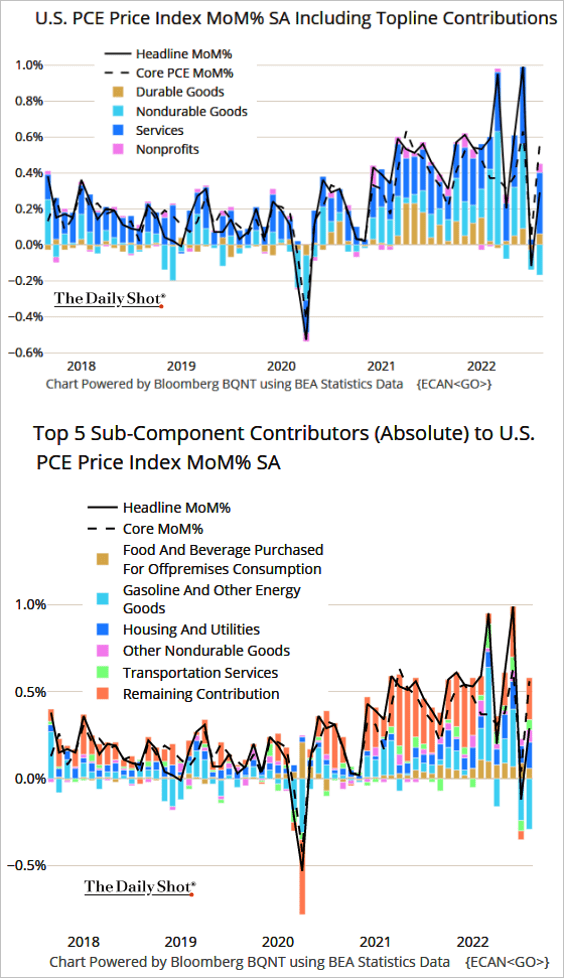
4. As we know from the CPI report, inflation accelerated in August. The PCE inflation measure was above estimates, with gains driven by services.
 Source: @TheTerminal, Bloomberg Finance L.P.
——————–
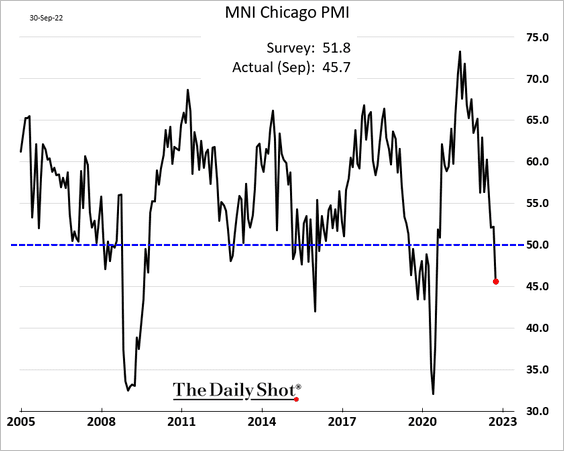
5. The MNI Chicago PMI surprised to the downside, pointing to a manufacturing contraction in the Midwest region in September.
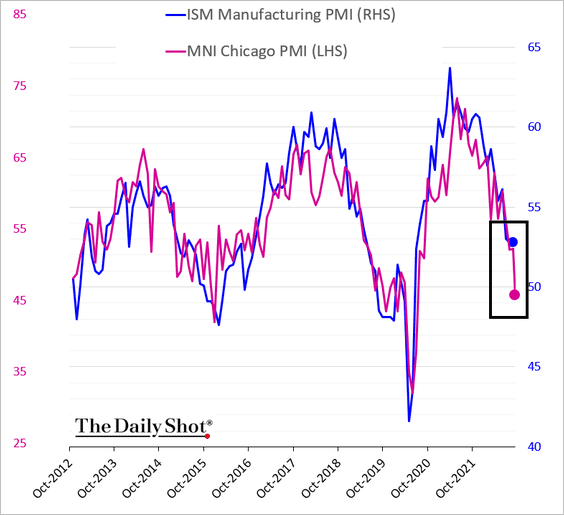
The report suggests that manufacturing activity contracted at the national level (ISM PMI) as well.
——————–
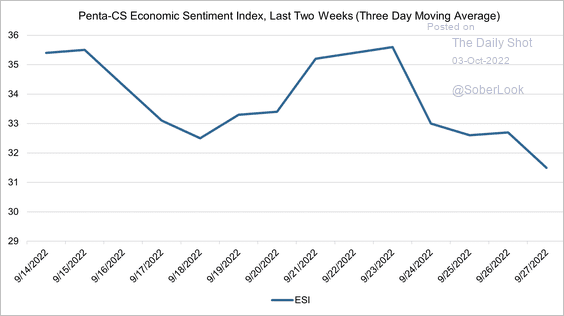
6. The updated U. Michigan consumer sentiment index softened in the second half of September, driven by the expectations component (3rd panel).
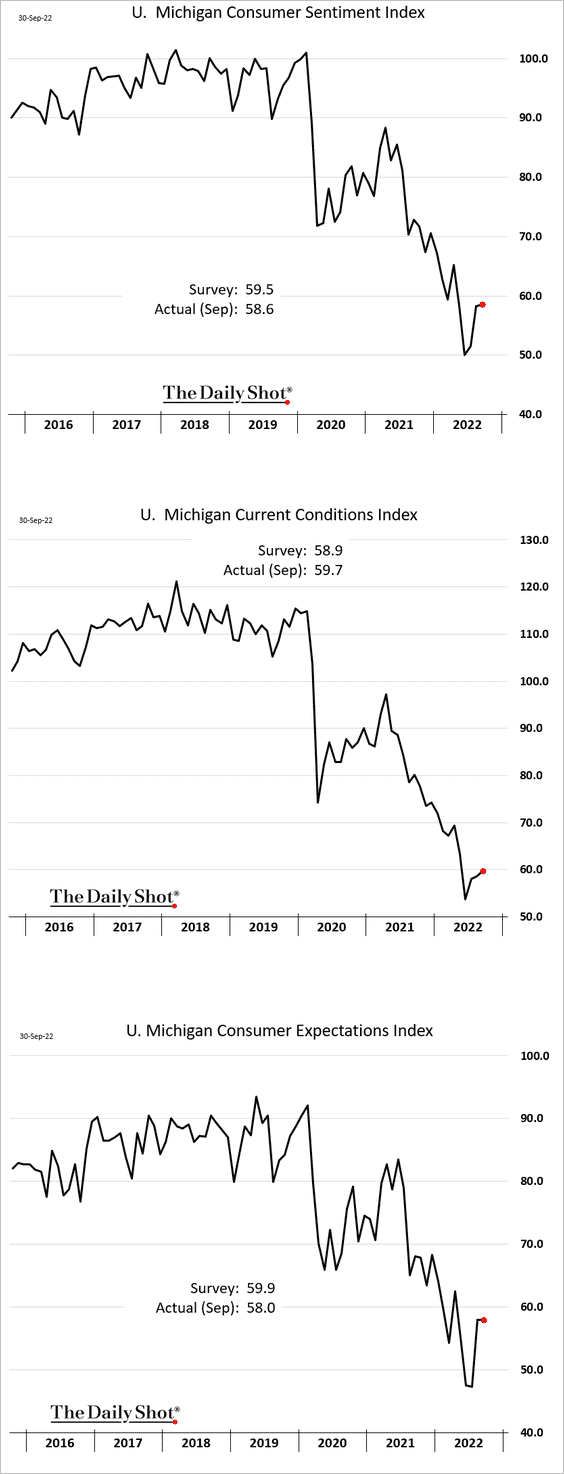
A separate report from Civic Science also showed softer consumer confidence at the end of September.
 Source: @CS_Penta
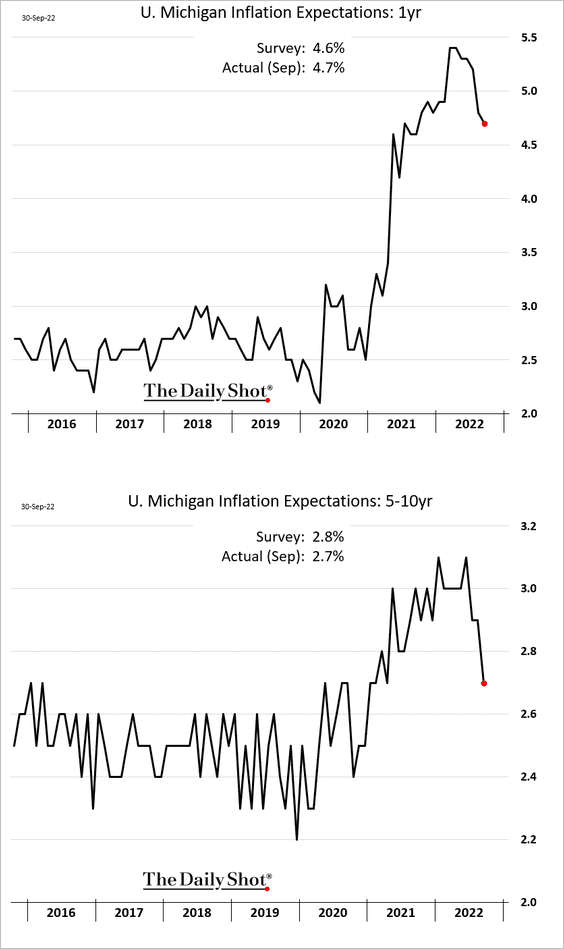
Inflation expectations edged lower.
——————–
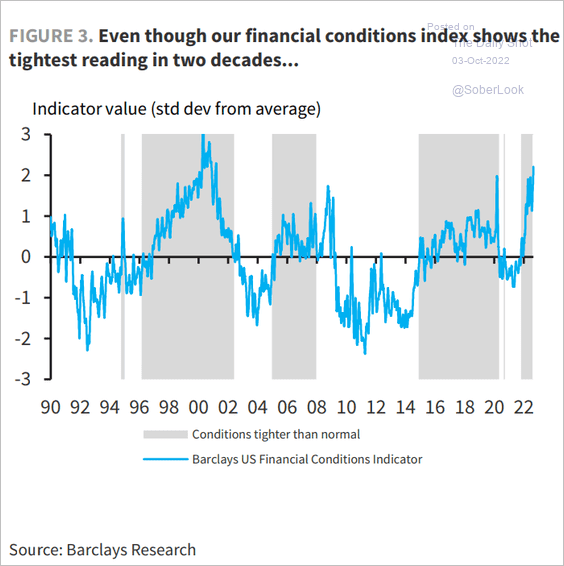
7. US financial conditions are very tight.
 Source: Barclays Research
Back to Index
The United Kingdom
1. The UK government is backtracking on some of its tax cut pledges.
 Source: @WSJ Read full article
The pound rose modestly but gave up most of the gains.
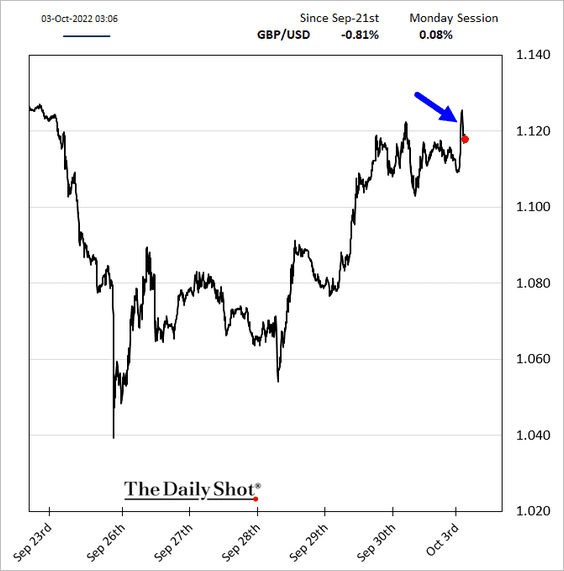
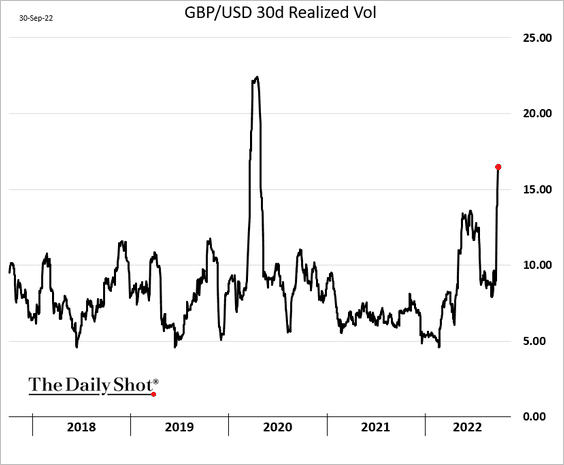
The pound’s volatility has been extreme.
——————–
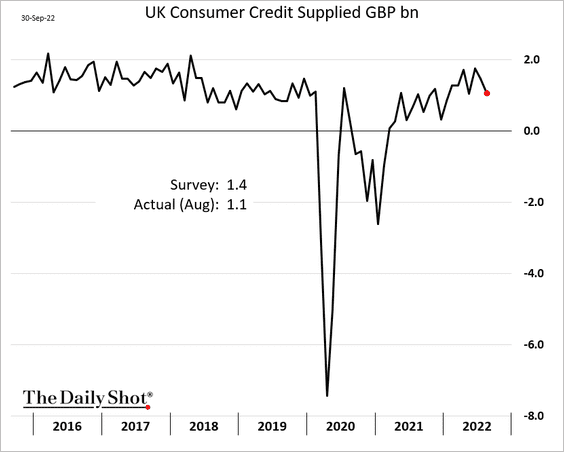
2. Consumer credit softened in August.
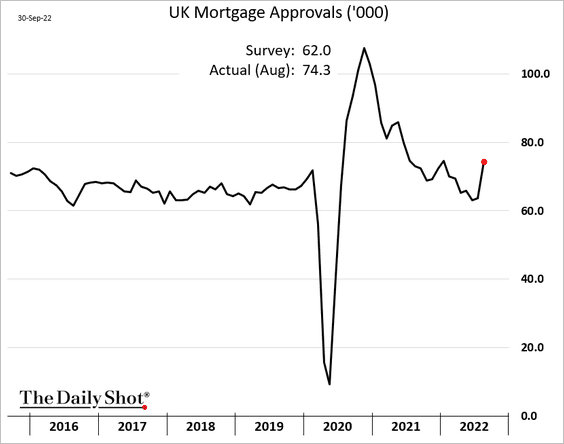
But mortgage approvals unexpectedly jumped.
——————–
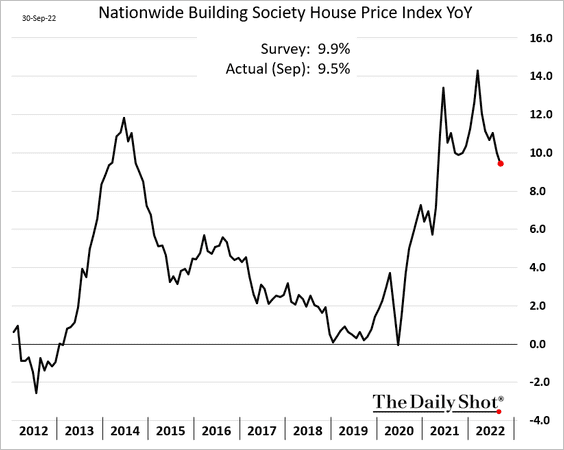
3. Home price appreciation is moderating.
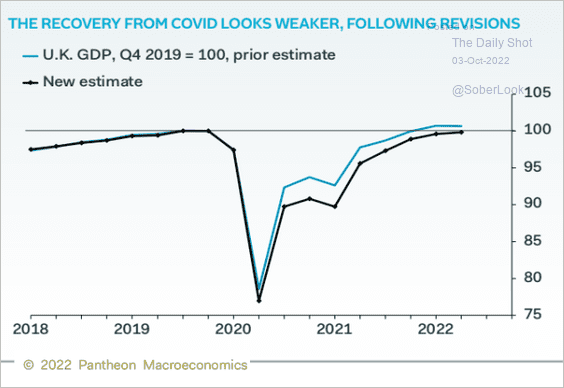
4. The revised GDP showed a slower pace of COVID-era recovery.
 Source: Pantheon Macroeconomics
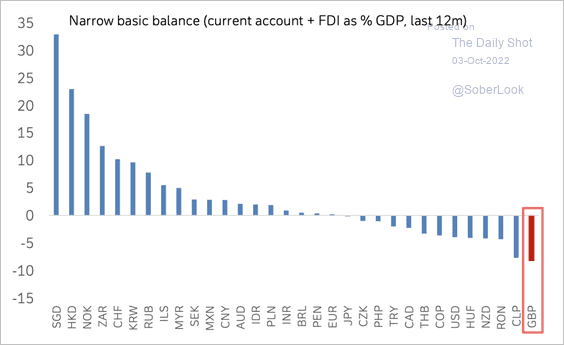
5. The UK has one of the worst narrow basic balances across both developed and emerging markets (narrow basic balance = current account balance + foreign direct investment).
 Source: Deutsche Bank Research
Back to Index
The Eurozone
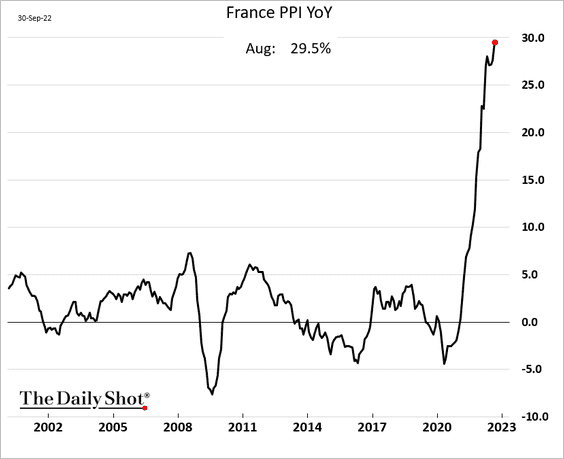
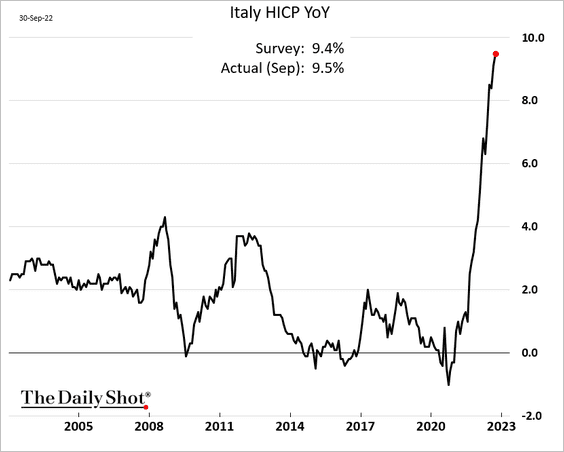
1. The Eurozone CPI hit 10% in September, surprising to the upside. Many economists see inflation peaking.
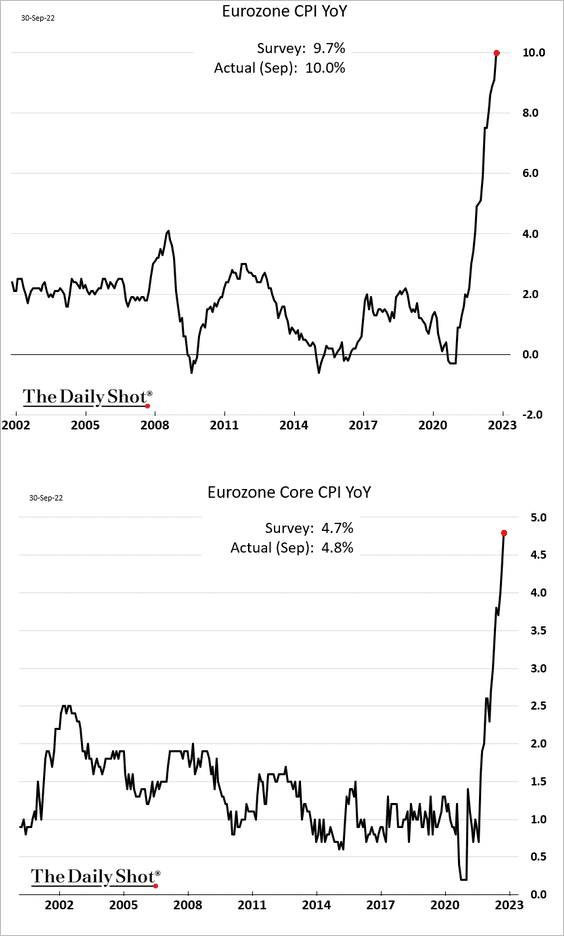
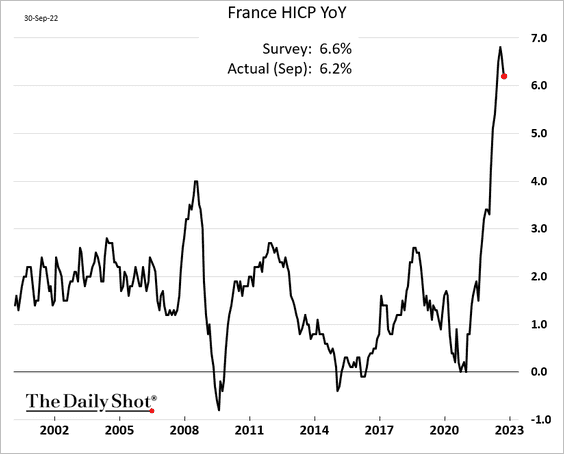
Here are some additional inflation trends.
• France CPI (peaked?):
• France PPI:
• Italy CPI:
——————–
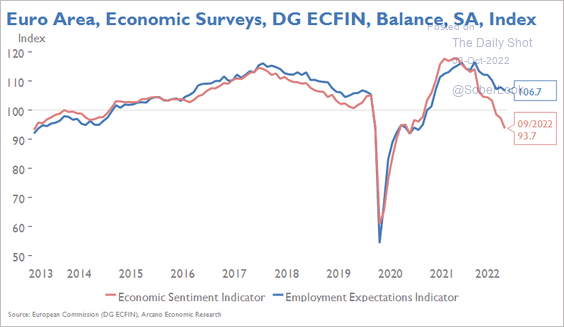
3. Employment expectations have diverged from economic sentiment (similar to the US divergence between the Conference Board’s and the U Michigan’s sentiment indices).
 Source: Arcano Economics
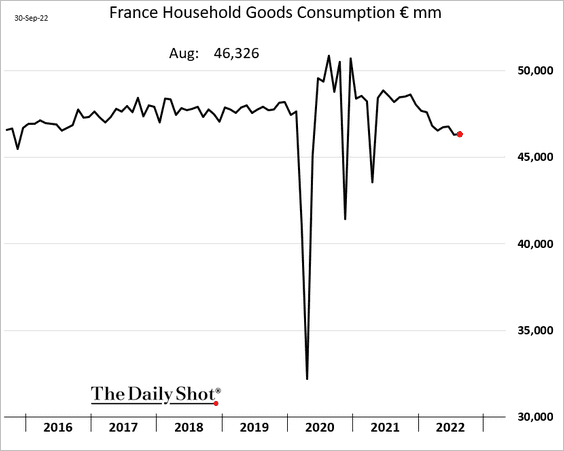
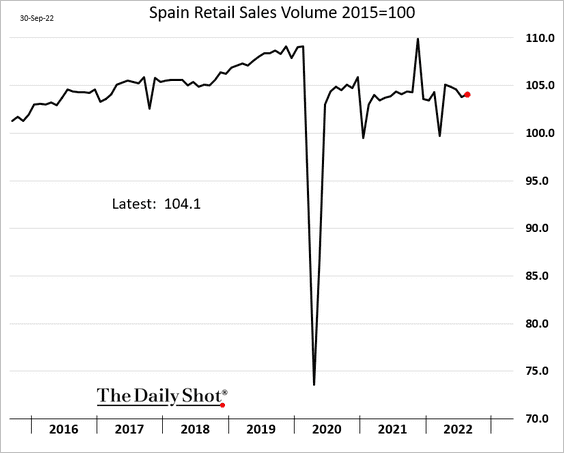
4. French goods consumption and Spanish retail sales held up well in August.
——————–
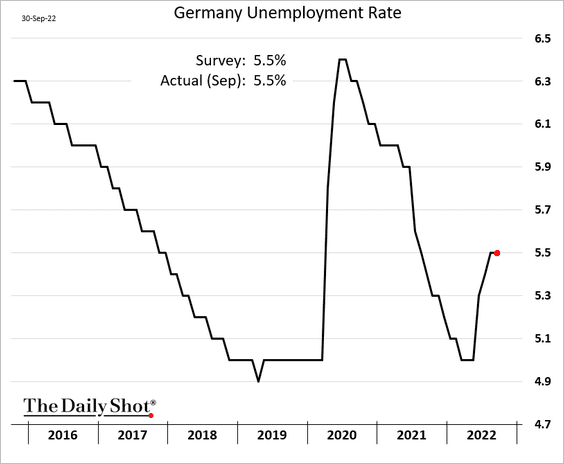
5. Germany’s unemployment was steady in September.
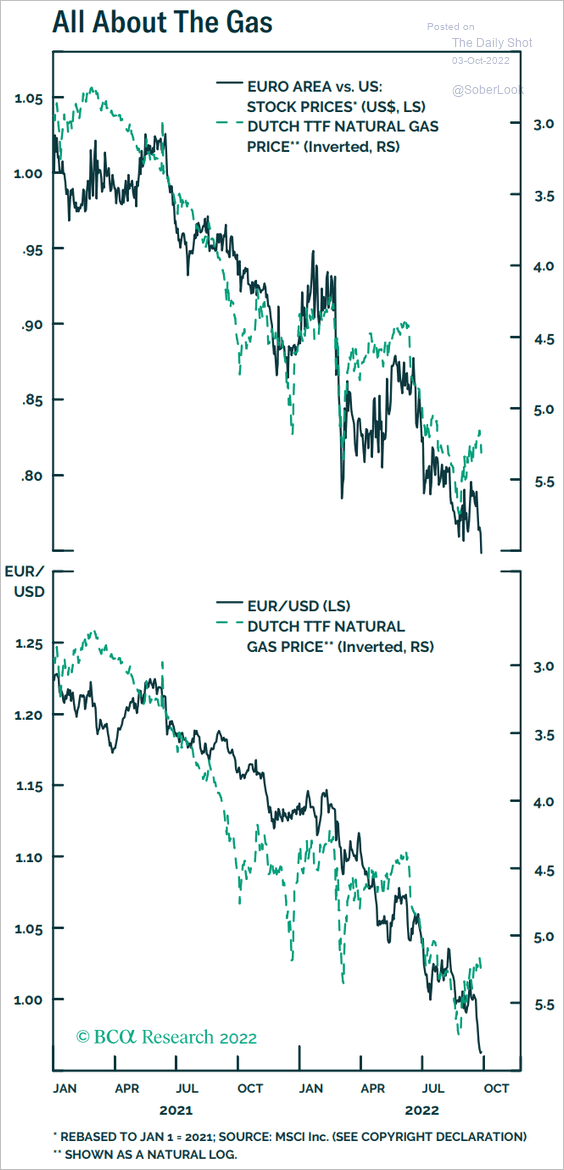
6. Will stabilization in natural gas prices (see the energy section) boost the euro and Europen stocks?
 Source: BCA Research
Back to Index
Europe
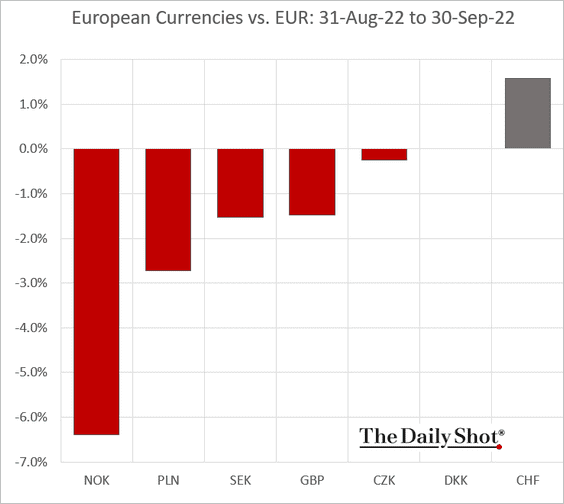
1. The Norwegian krone took a hit last week, …
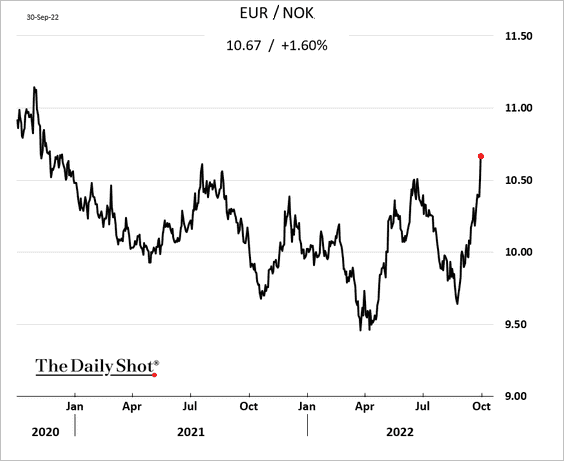
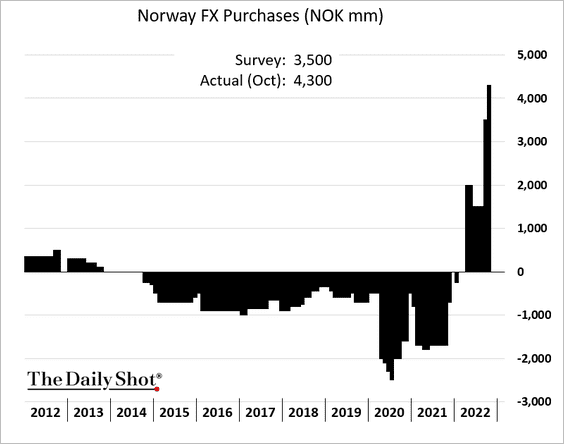
… as the central bank accelerated FX purchases.
——————–
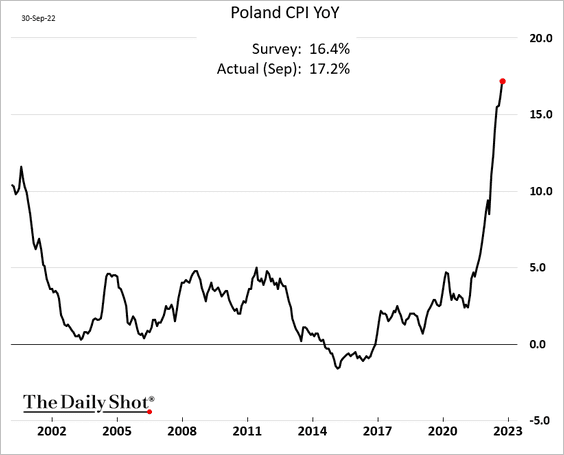
2. Poland’s inflation exceeded 17% in September.
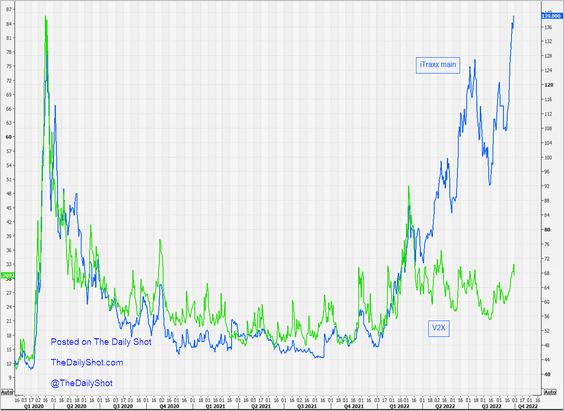
3. European credit spreads have massively diverged from equity implied volatility.
 Source: @themarketear
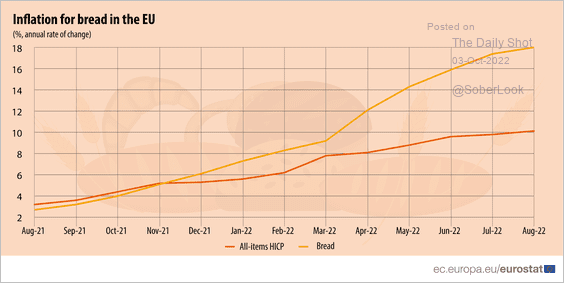
4. This chart shows bread inflation in the EU.
 Source: Eurostat Read full article
Back to Index
Japan
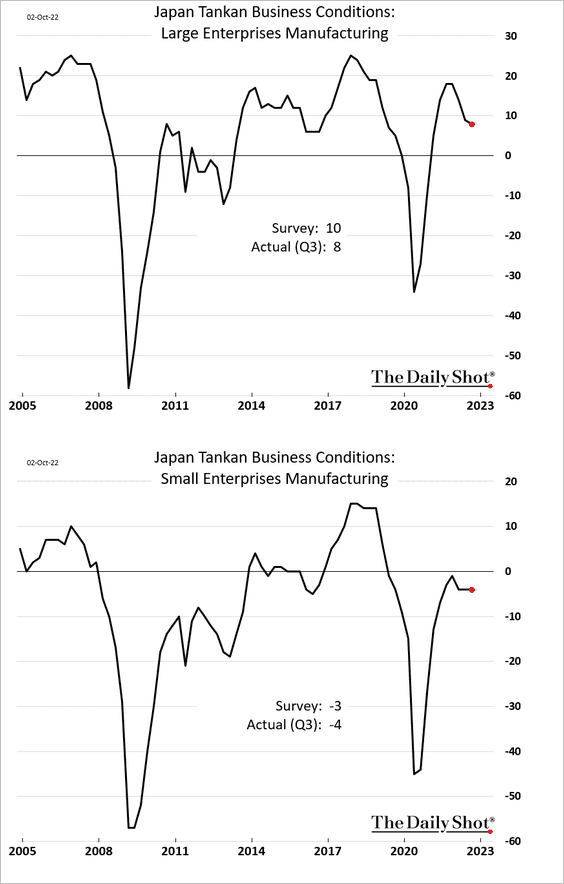
1. The Tankan report showed softer manufacturing sentiment in Q3.
 Source: Reuters Read full article
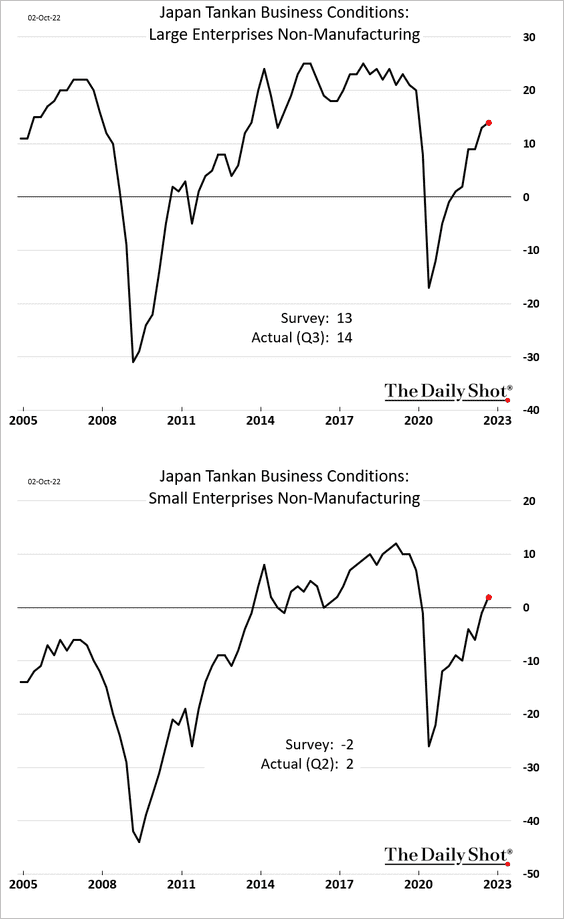
The nonmanufacturing index improved as the pandemic eased.
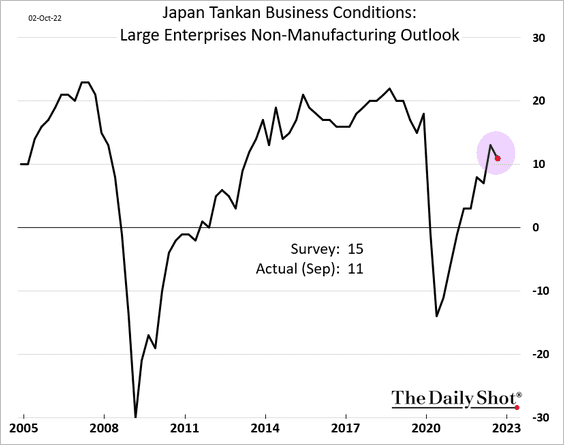
However, the nonmanufacturing outlook declined.
——————–
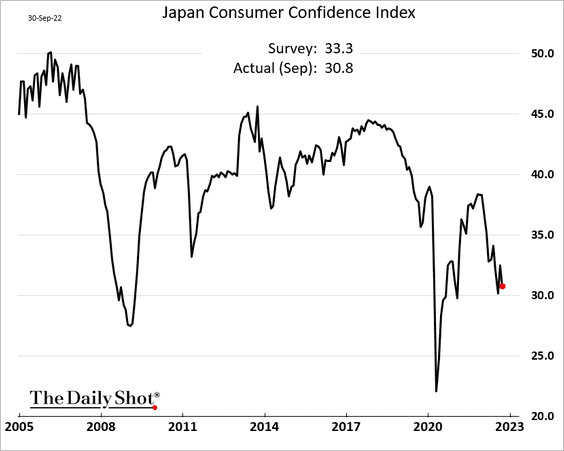
2. Consumer sentiment worsened in September.
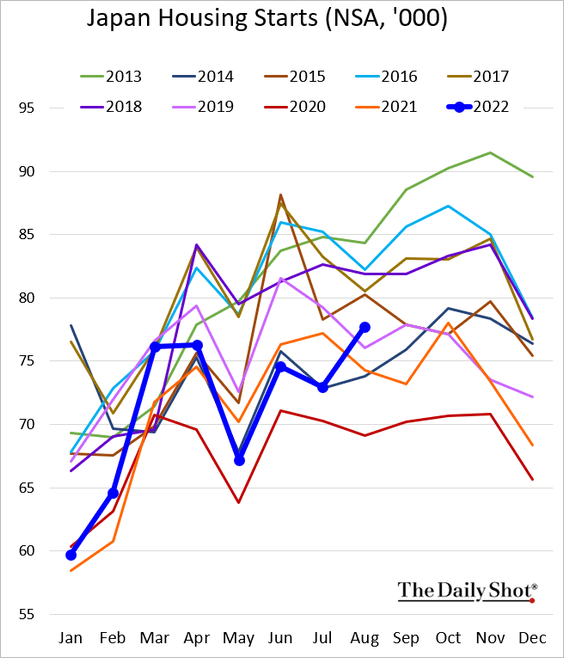
3. Housing starts jumped in August.
Back to Index
Asia – Pacific
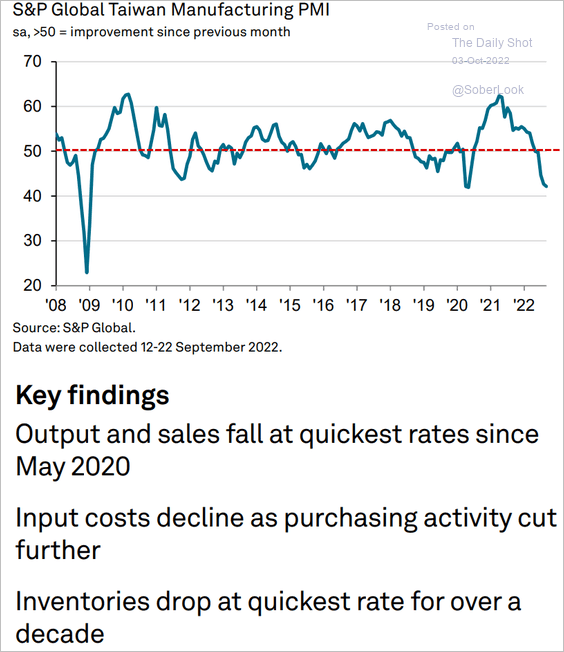
1. Taiwan’s manufacturing slump accelerated in September.
 Source: S&P Global PMI
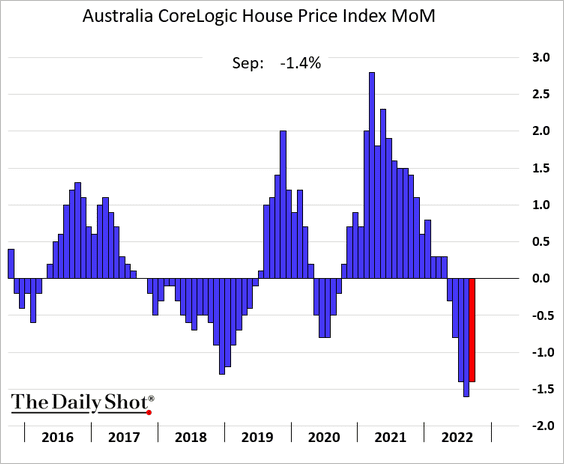
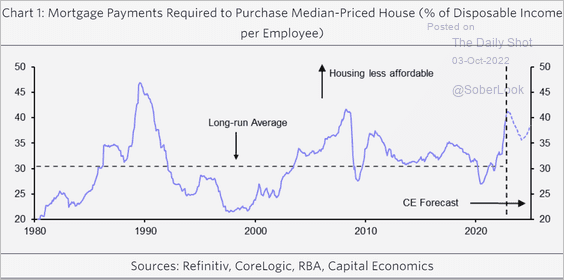
2. Australia’s home prices continue to fall …
… amid worsening affordability.
 Source: Capital Economics
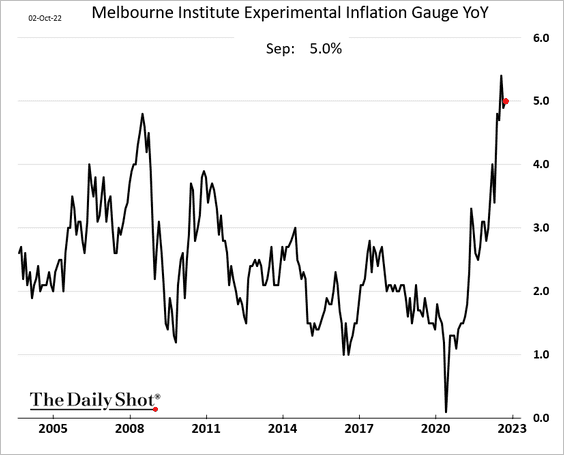
Separately, Australia’s inflation remained elevated in September.
Back to Index
Emerging Markets
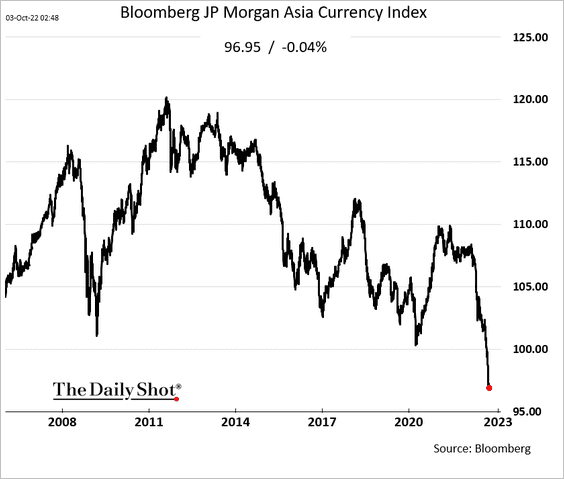
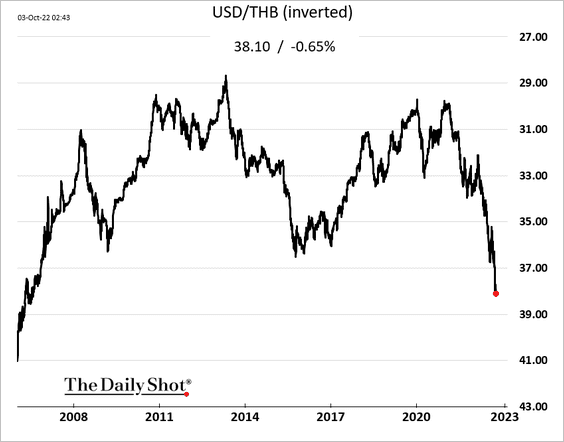
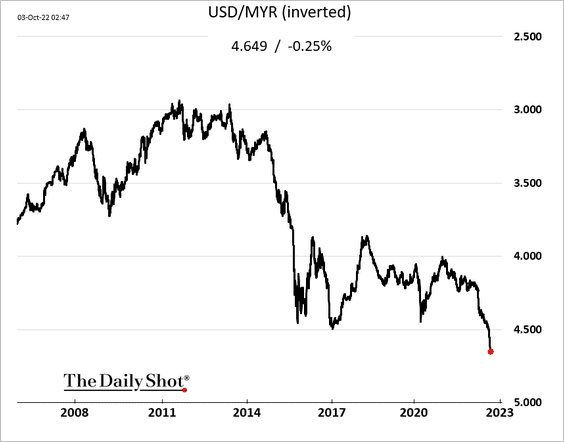
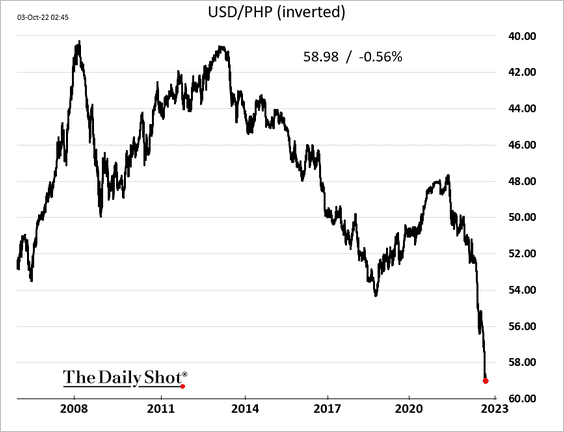
1. Asian currencies remain under pressure.
• Asia currency index:
• The Thai baht:
• The Malaysian ringgit:
• The Philippine peso:
——————–
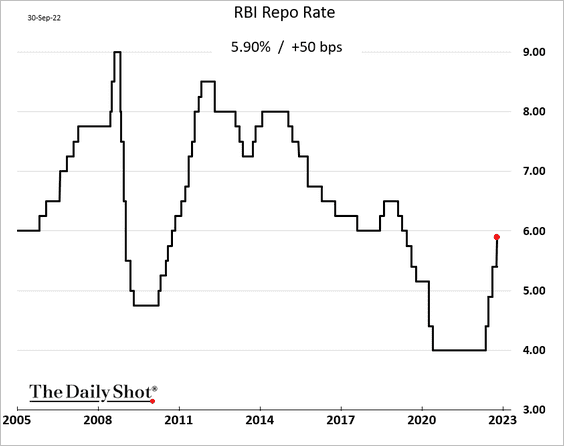
2. India’s central bank hiked rates again.
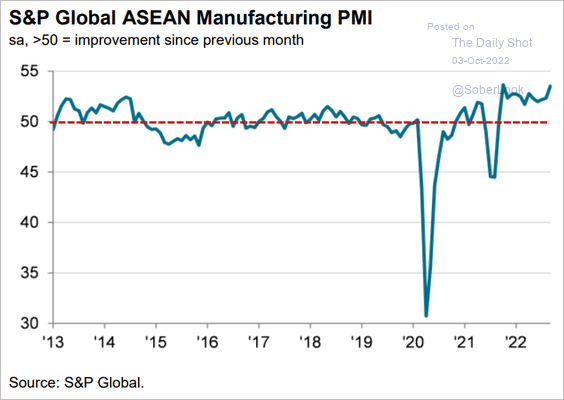
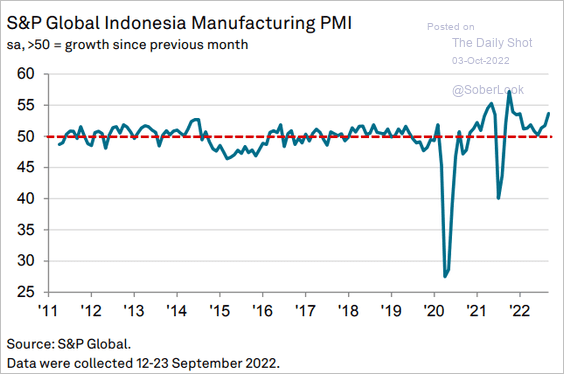
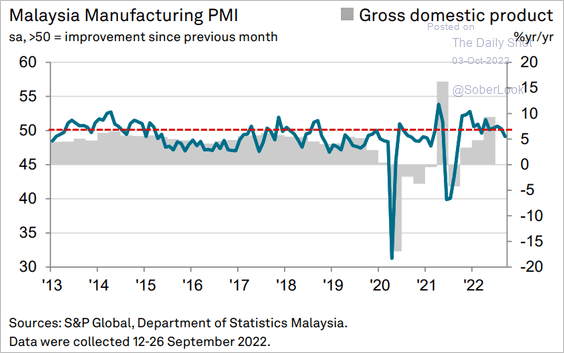
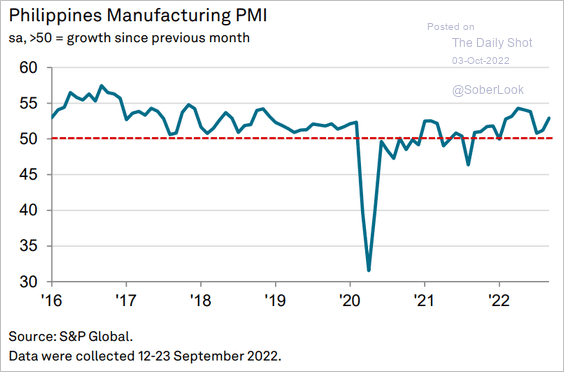
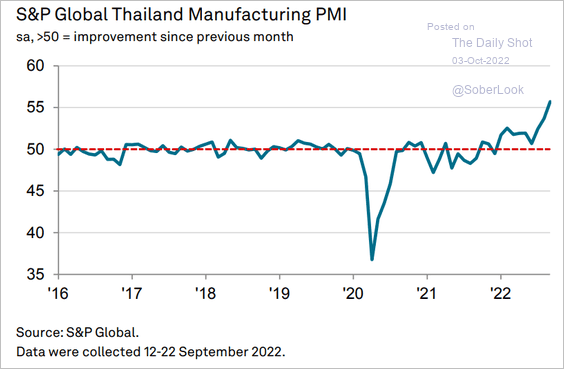
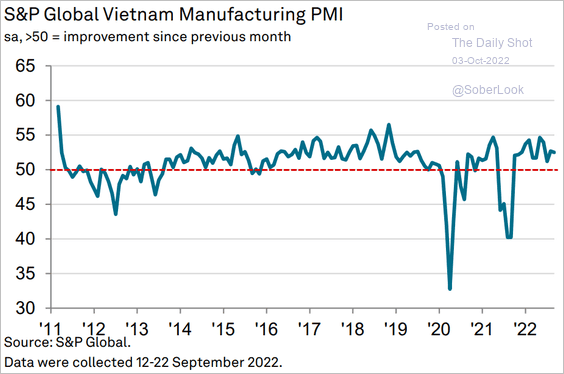
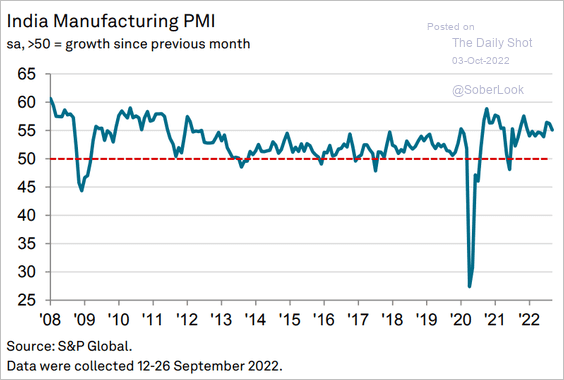
3. EM Asia PMI reports mostly showed expanding factory activity in September.
• ASEAN:
 Source: S&P Global PMI
• Indonesia:
 Source: S&P Global PMI
• Malaysia (the exception):
 Source: S&P Global PMI
• The Philippines:
 Source: S&P Global PMI
• Thailand:
 Source: S&P Global PMI
• Vietnam:
 Source: S&P Global PMI
• India:
 Source: S&P Global PMI
——————–
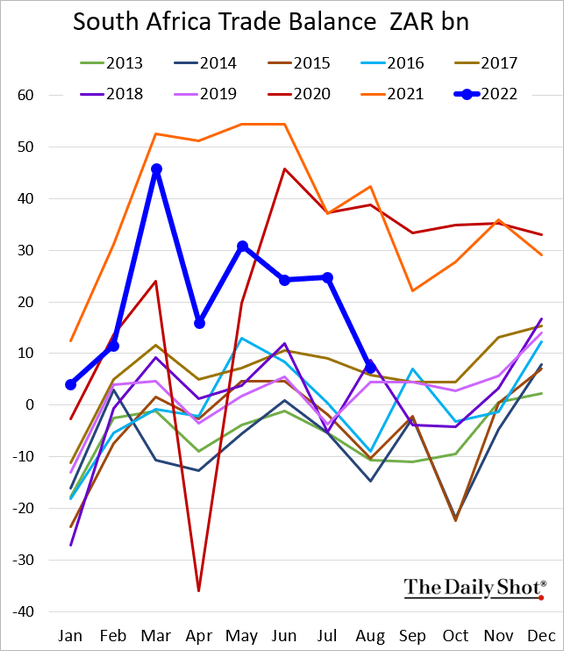
• South Africa’s trade surplus declined sharply in August.
——————–
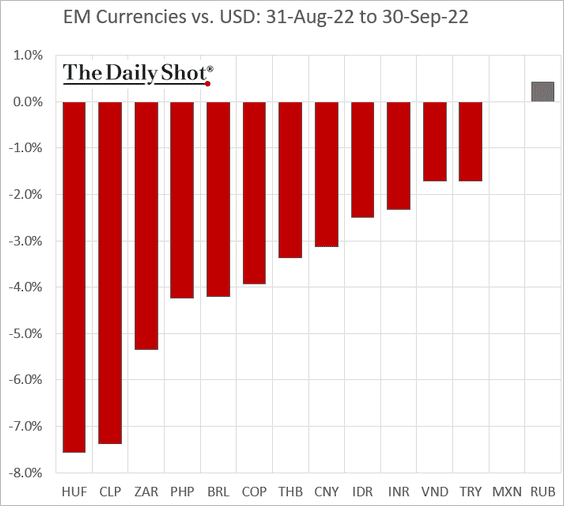
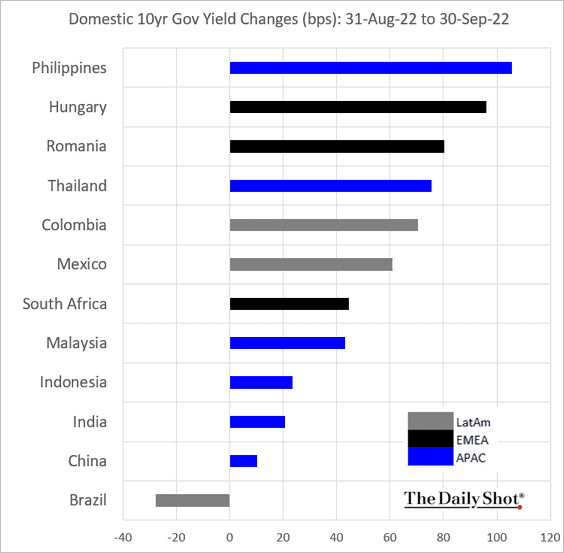
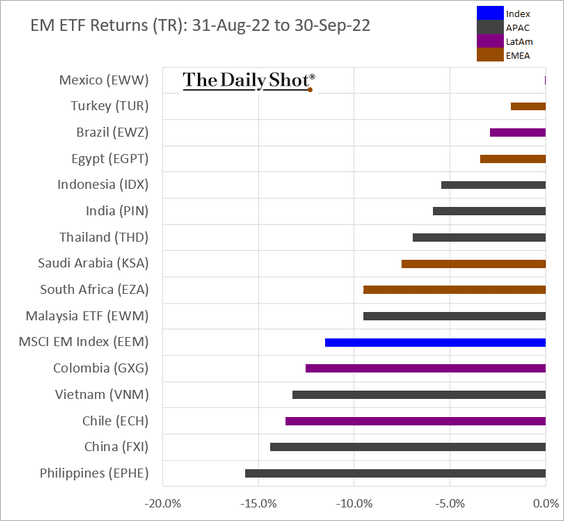
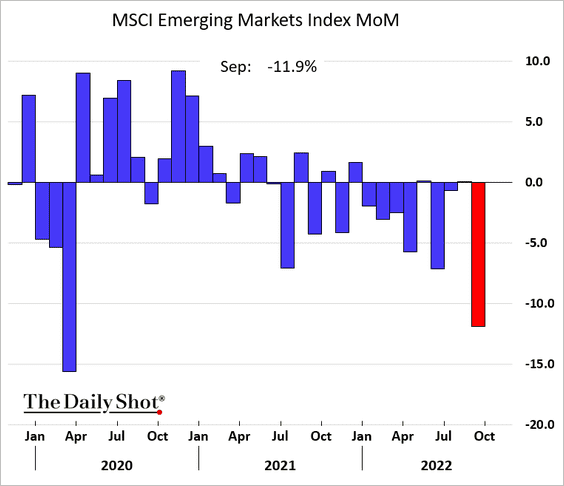
4. Next, we have last month’s performance data.
• Currencies:
• Bond yields:
• Equity ETFs:
• Broad equity index:
Back to Index
Commodities
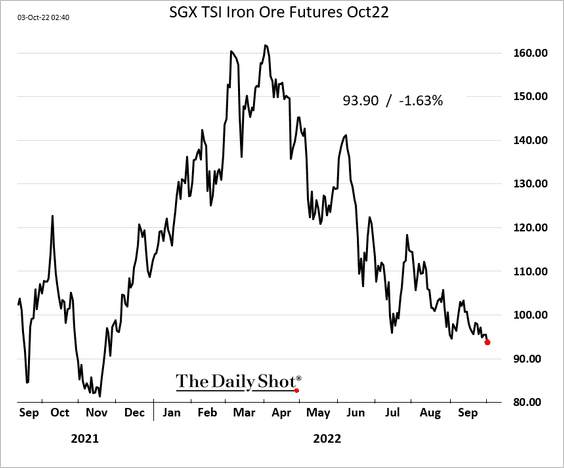
1. Iron ore futures keep trending lower.
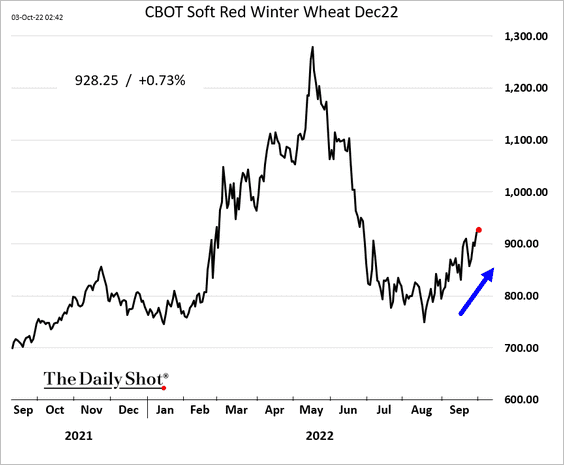
2. Wheat prices continue to rebound.
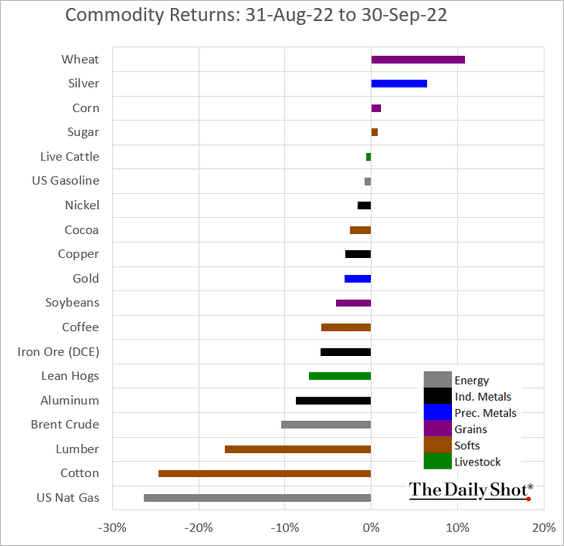
3. This chart shows how different commodity markets performed in September.
Back to Index
Energy
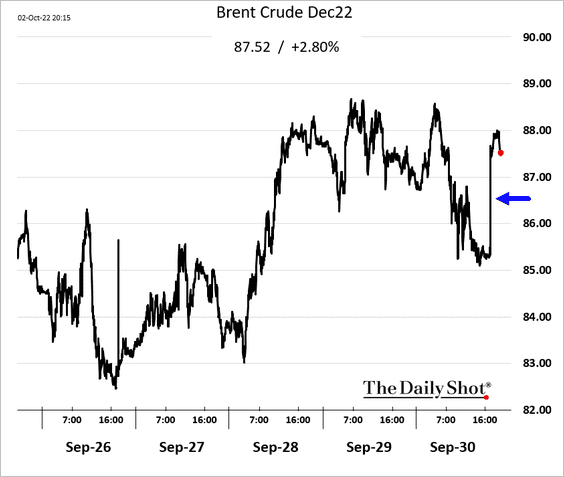
1. Oil prices jumped on the news that OPEC plans to cut production.
 Source: Reuters
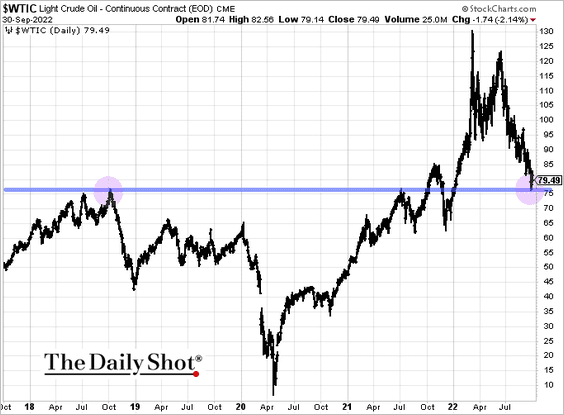
US crude oil held support at the 2018 peak.
——————–
2. European natural gas prices continue to move lower.
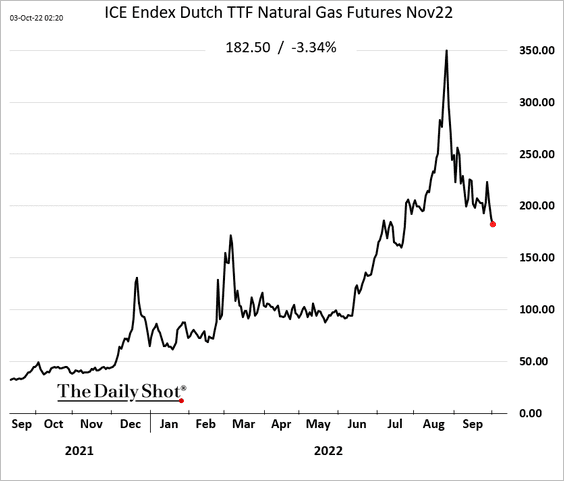
• Russia is trying to force the new Italian government to turn against the EU’s sanctions.
 Source: Bloomberg Read full article
Russian gas flows into Europe keep falling.
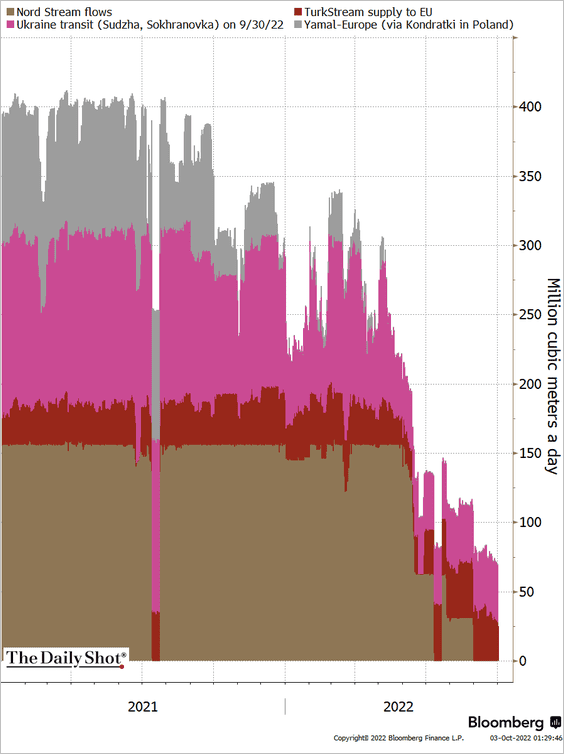 Source: @TheTerminal, Bloomberg Finance L.P.
Back to Index
Equities
1. Outside of the mega-cap shares, valuations look cheap.
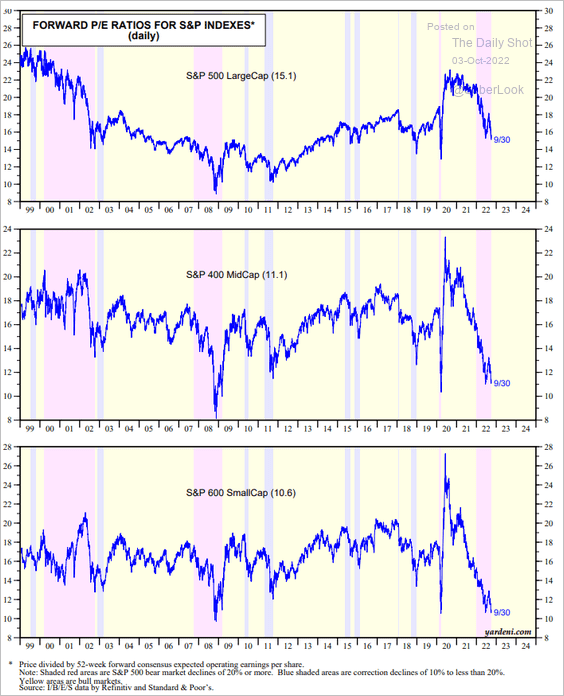 Source: Yardeni Research
The median S&P 500 P/E is now at 14.5x.
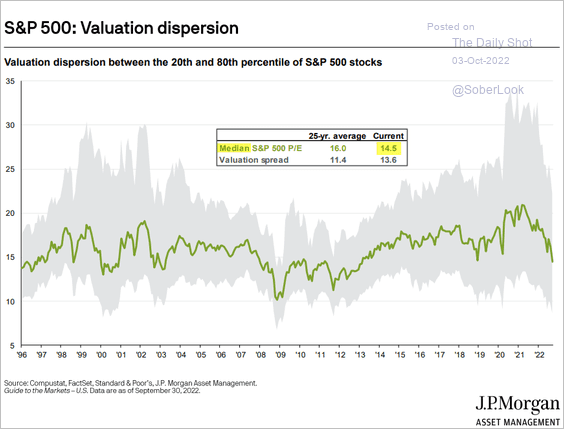 Source: J.P. Morgan Asset Management
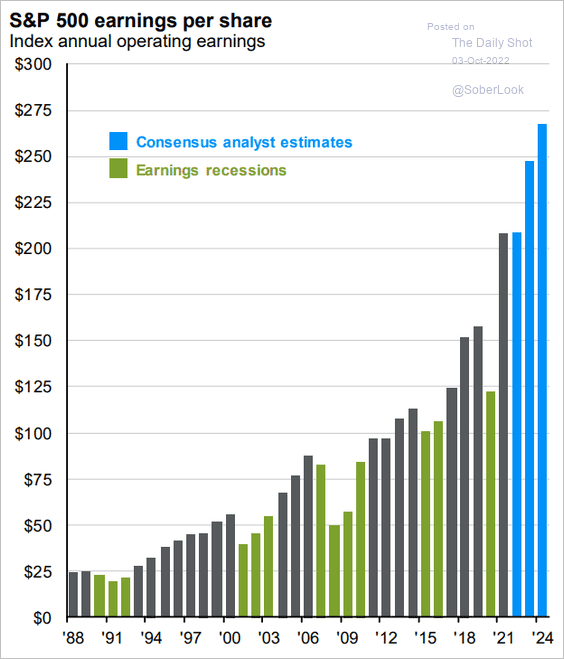
2. However, earnings estimates for the next couple of years look aggressive.
 Source: J.P. Morgan Asset Management
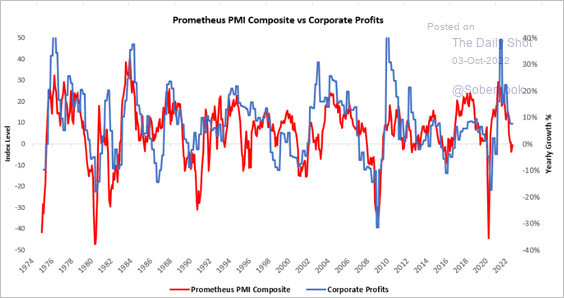
PMI indicators point to weaker profits ahead.
 Source: Prometheus Research
——————–
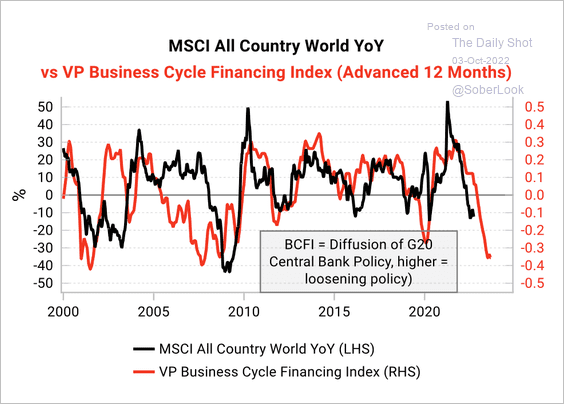
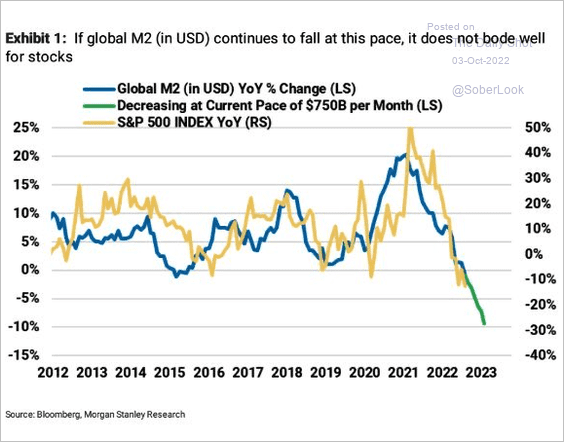
3. It appears that equities have not fully priced in tighter financial conditions and deteriorating liquidity (2 charts).
 Source: Variant Perception
 Source: Morgan Stanley Research
——————–
4. US dollar gains exacerbated international equity losses for US investors.
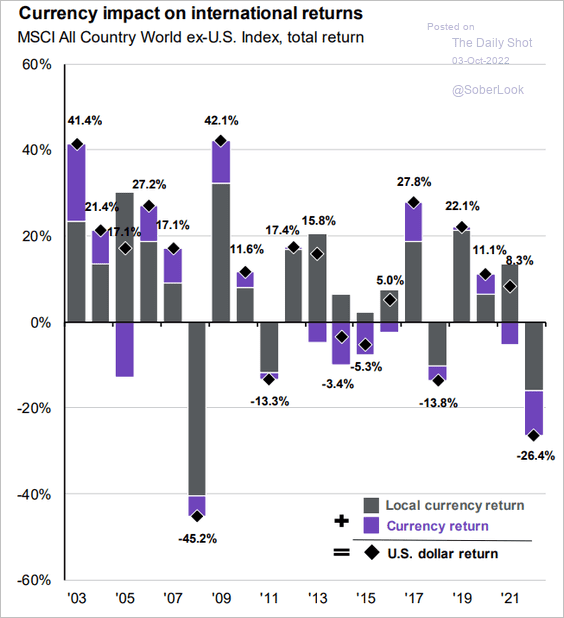 Source: J.P. Morgan Asset Management
5. The 2008 analog is holding.
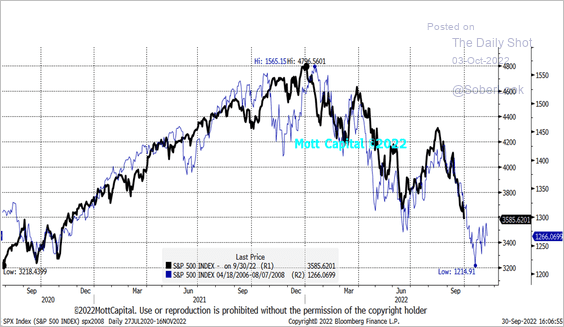 Source: @MichaelMOTTCM
6. Share buybacks have been slowing.
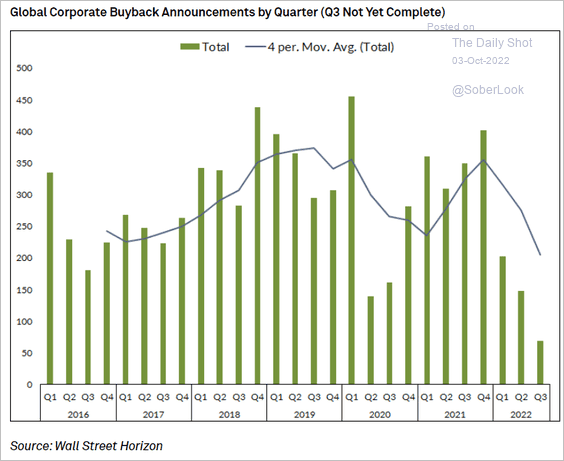 Source: @FactSet, @pav_chartbook Read full article
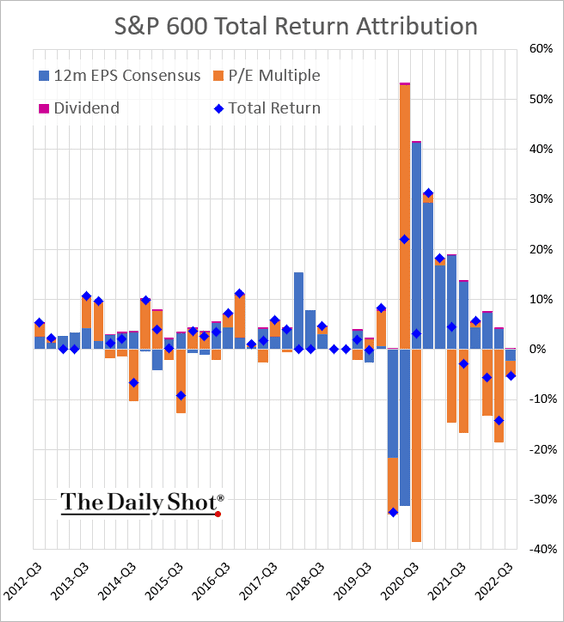
7. For the first time since 2020, earnings expectations were a drag on performance in Q3.
• S&P 500:
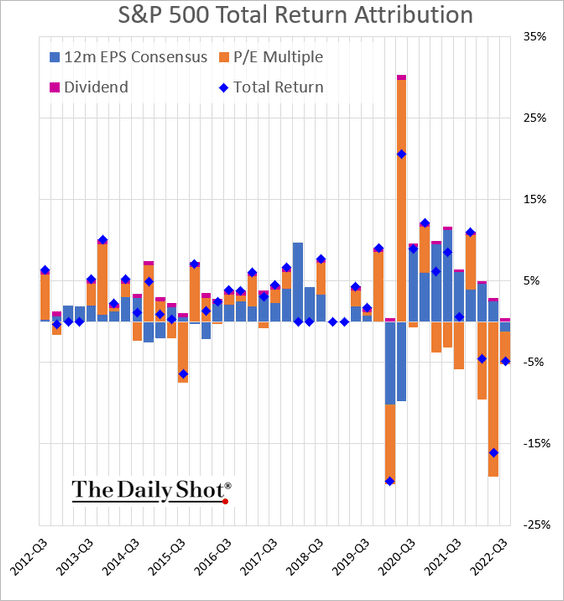
• S&P 600 (small caps):
——————–
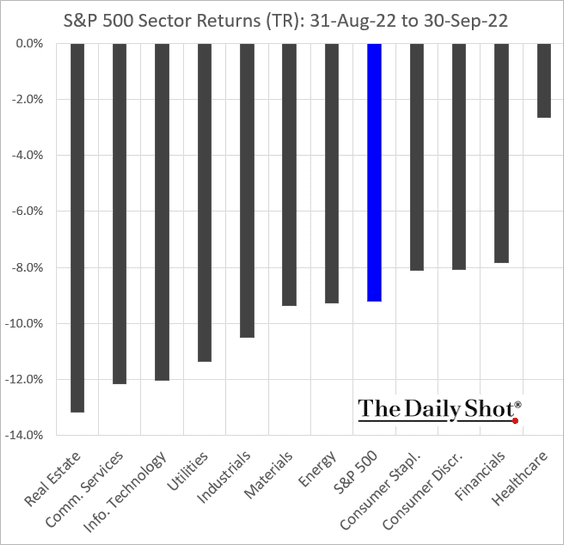
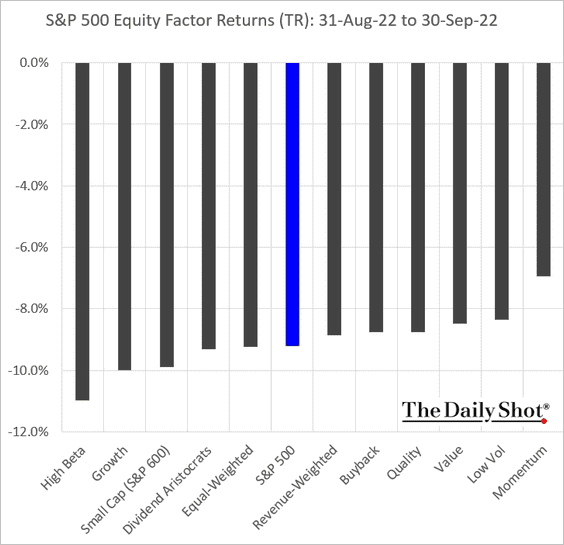
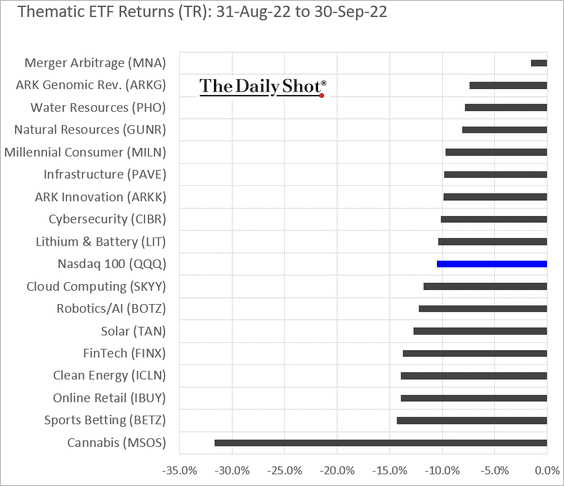
8. Finally, we have some performance data for the month of September.
• Sectors:
• Equity factors:
• Thematic ETFs:
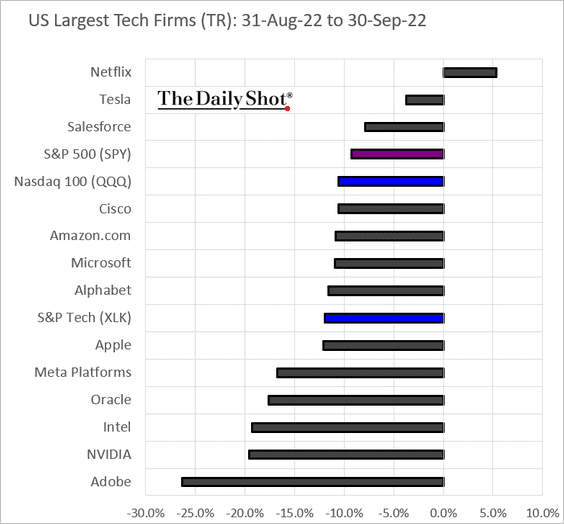
• Largest US tech stocks:
Back to Index
Credit
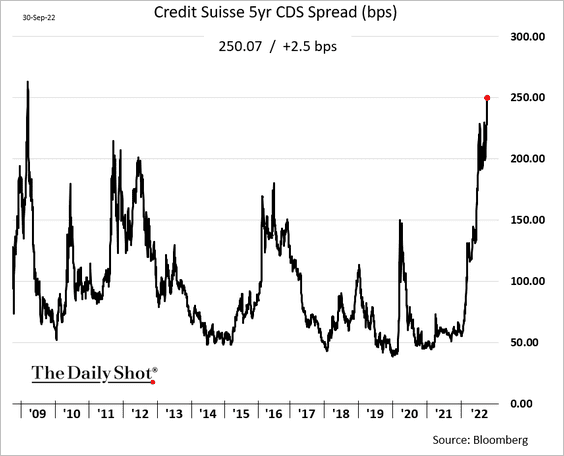
1. Should credit markets be concerned about persistent troubles at Credit Suisse?
 Source: @WSJ Read full article
——————–
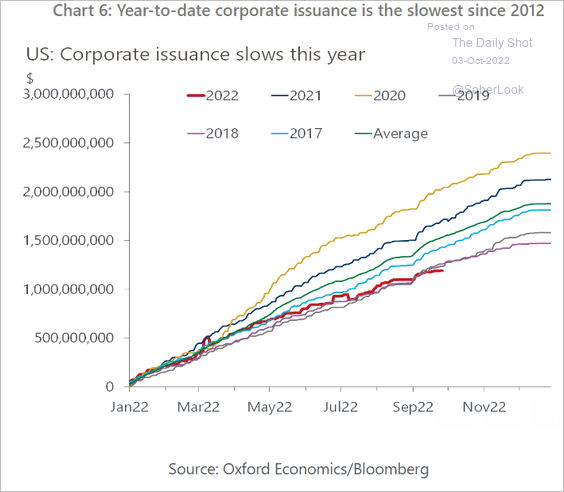
2. US corporate bond issuance was slow this year.
 Source: Oxford Economics
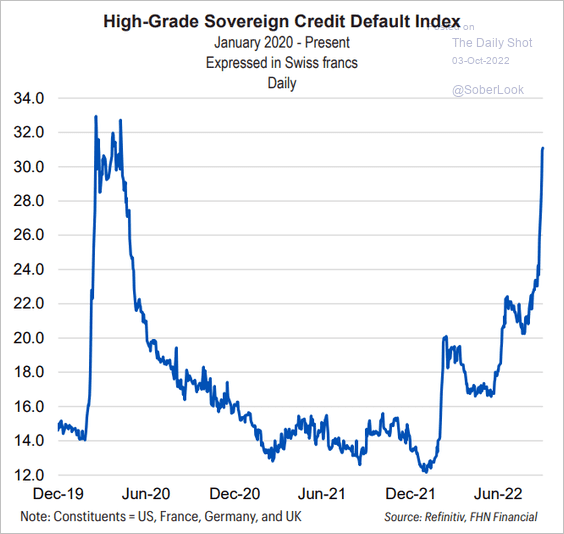
3. Advanced economies’ sovereign CDS spreads have widened sharply.
 Source: FHN Financial
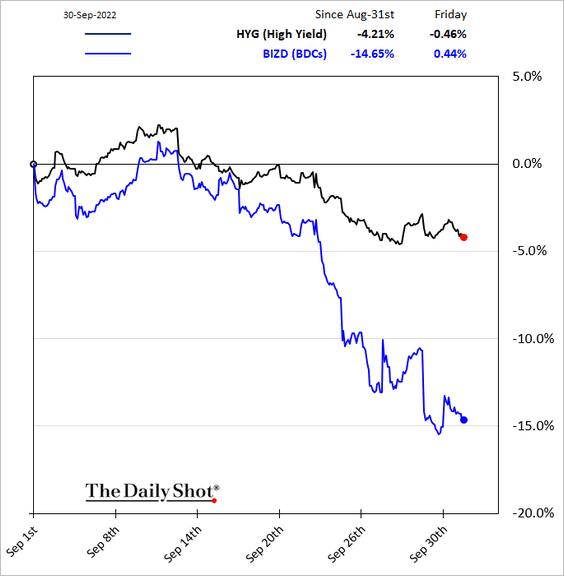
4. BDCs tumbled over the past couple of weeks.
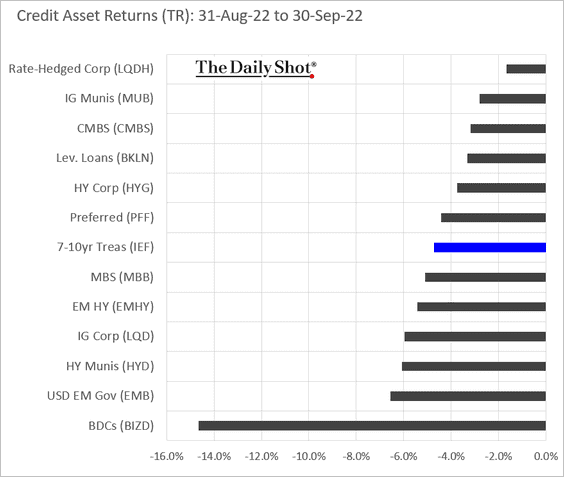
5. Here is the September performance across credit asset classes.
Back to Index
Rates
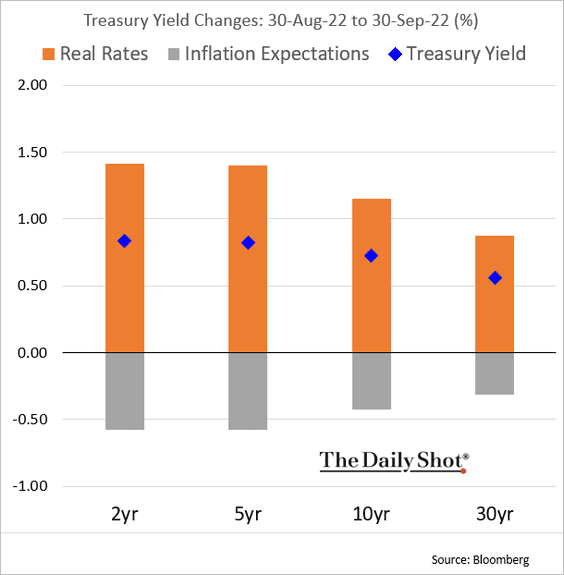
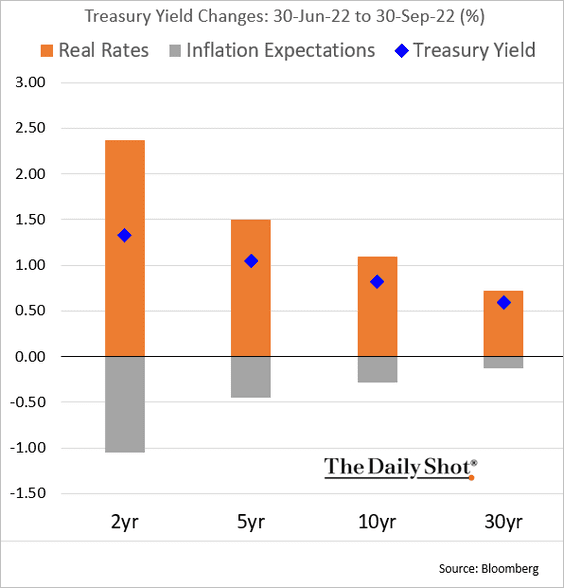
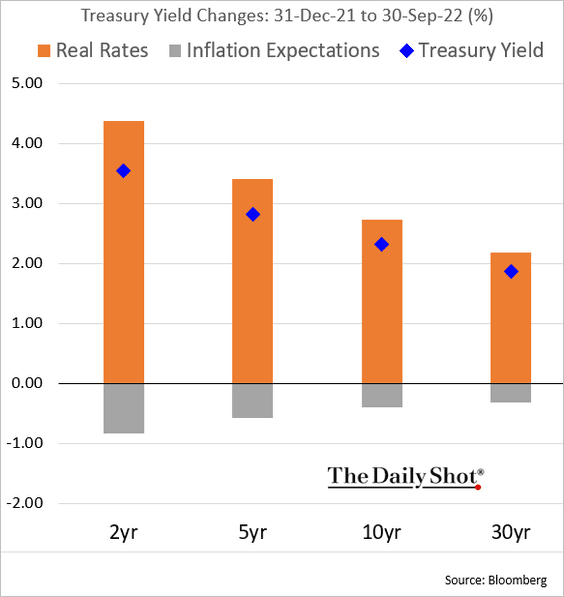
1. Let’s start with the Treasury market performance attribution. Yield increases have been driven by real rates rather than inflation expectations.
• September:
• Q3:
• Year-to-date:
——————–
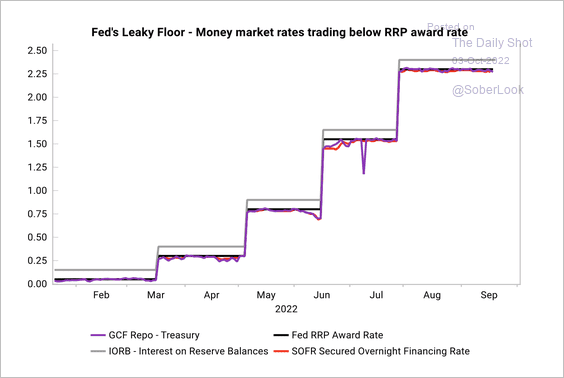
3. Key financing rates have traded well below the Fed’s reverse repurchase agreement (RRP) award rate, which was supposed to be a floor. This means there is too much cash in money markets looking to be parked for returns, according to Variant Perception.
 Source: Variant Perception
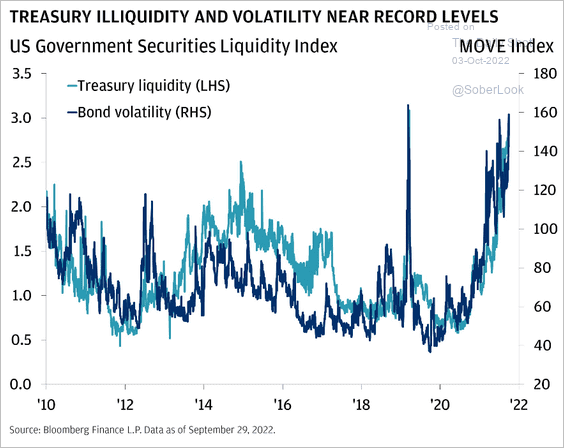
4. Treasury market liquidity has been worsening, …
 Source: J.P. Morgan Asset Management
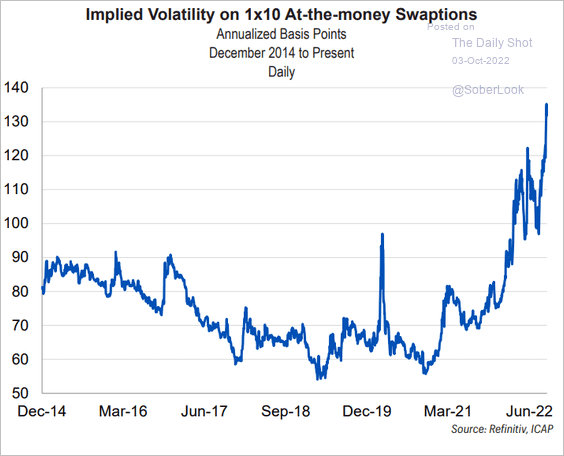
… as rates volatility surged.
 Source: FHN Financial
——————–
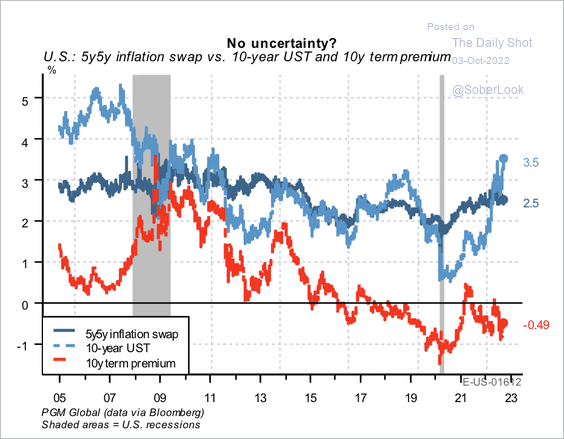
5. Nearly 50 basis points of the rise in the 10-year Treasury yield can be attributed to the recent inversion in the 10-year term premium, according to PGM Global.
 Source: PGM Global
Back to Index
Global Developments
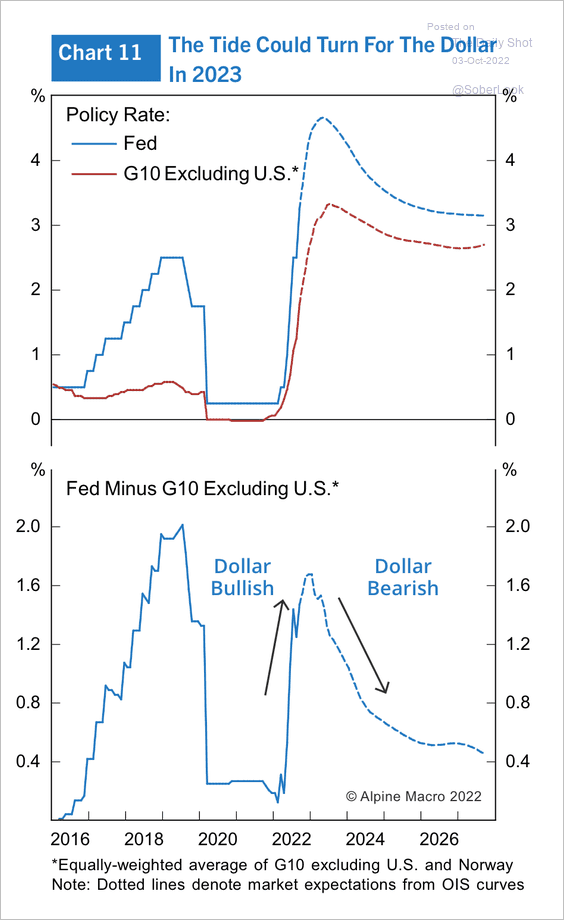
1. A dovish Fed pivot could be bearish for the dollar next year.
 Source: Alpine Macro
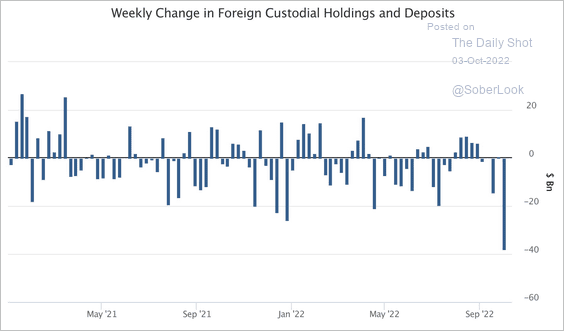
2. Governments around the world have been dumping US assets to defend their sinking currencies.
 Source: @ExanteData
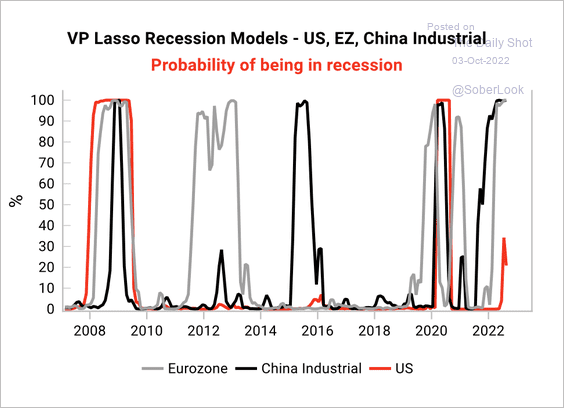
3. The probability of a US recession remains low relative to China and the Eurozone, according to Variant Perception.
 Source: Variant Perception
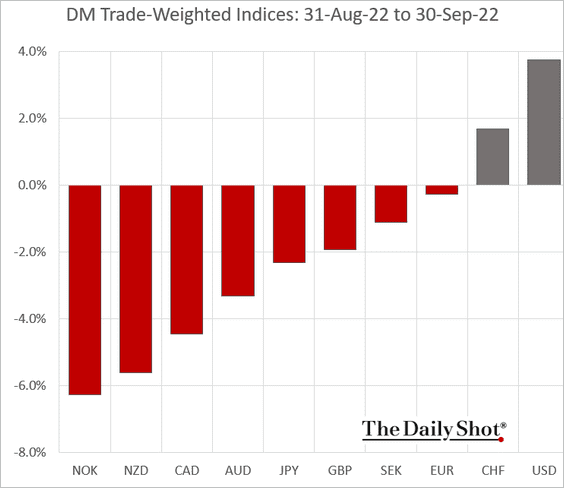
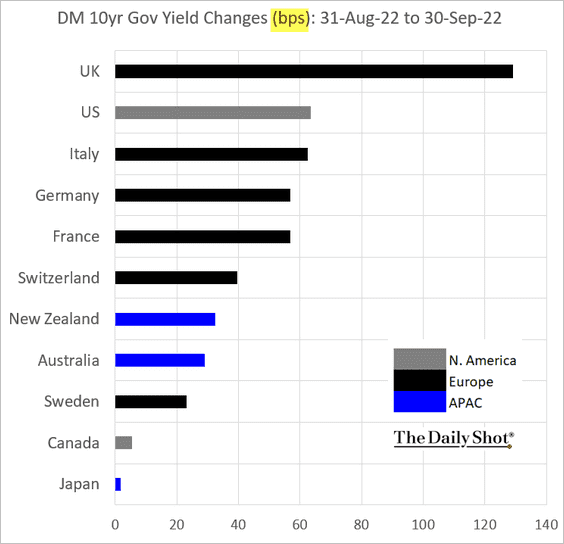
4. Next, we have some performance data for September.
• Trade-weighted currency indices.
• Bond yields:
——————–
Food for Thought
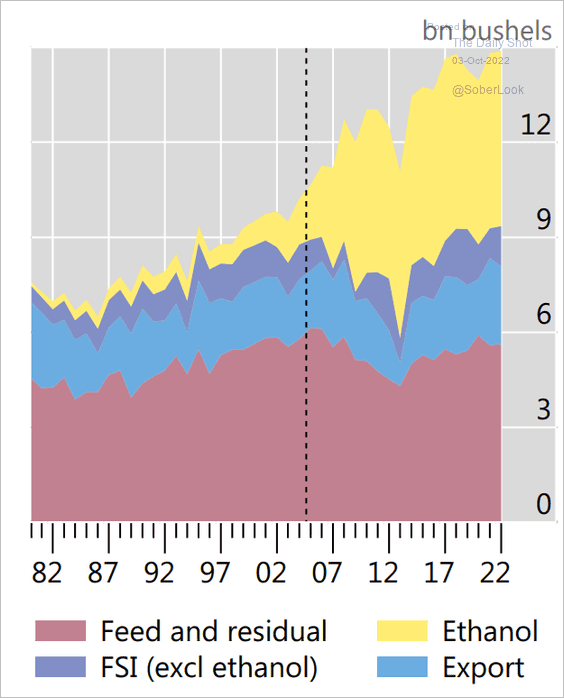
1. Uses of US corn production:
 Source: BIS Read full article
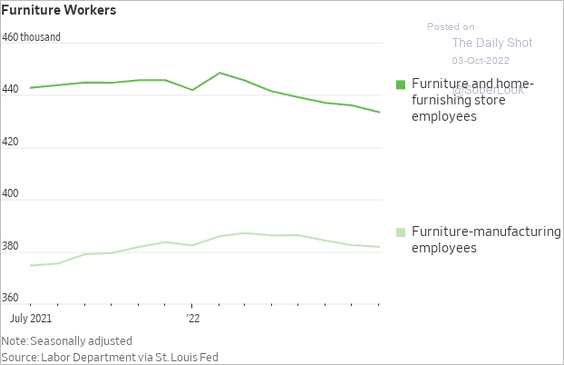
2. Furniture workers:
 Source: @WSJ Read full article
3. Youth unemployment:
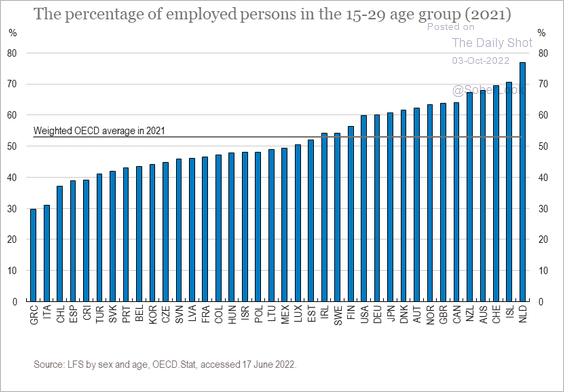 Source: OECD Read full article
4. Clean energy employment:
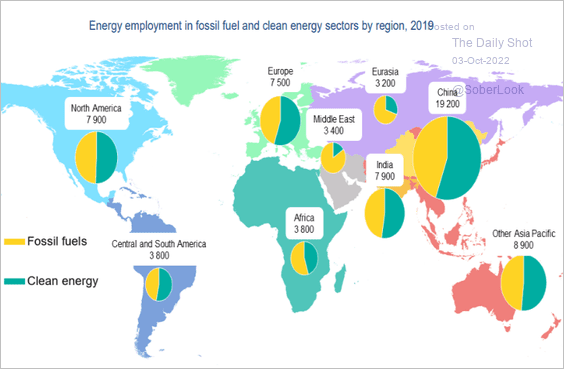 Source: IEA Read full article
5. Hispanic American voters’ focus on the economy:
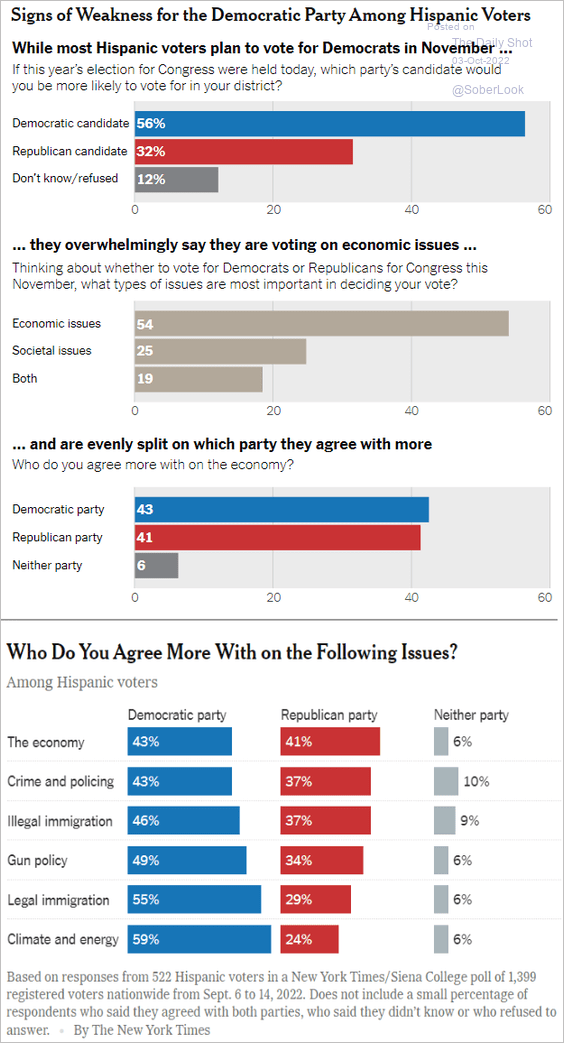 Source: The New York Times Read full article
6. Lithium supply and demand:
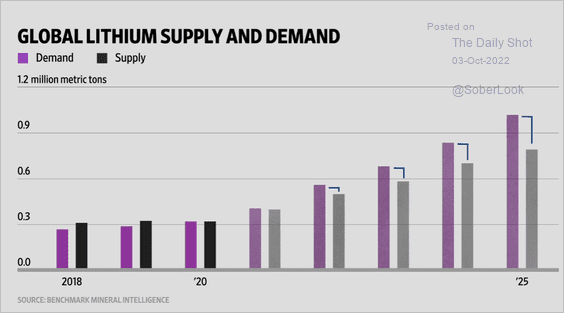 Source: @WSJ Read full article
7. The royal line of succession in the UK:
 Source: The Guardian Read full article
——————–
Back to Index
