
The Daily Shot: 13-Dec-22
• The United States
• Canada
• The United Kingdom
• The Eurozone
• Japan
• Asia – Pacific
• China
• Emerging Markets
• Cryptocurrency
• Energy
• Equities
• Credit
• Rates
• Global Developments
• Food for Thought
The United States
1. Credit growth has been robust. But banks appear to be curbing lending amid recession concerns.
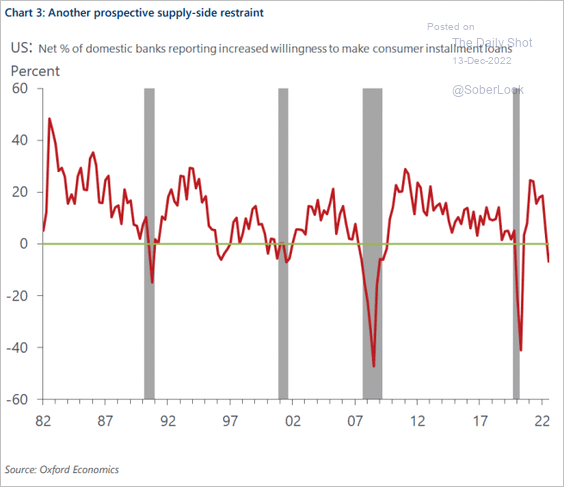 Source: Oxford Economics
2. When will this recession start? The next chart is from a survey by Deutsche Bank.
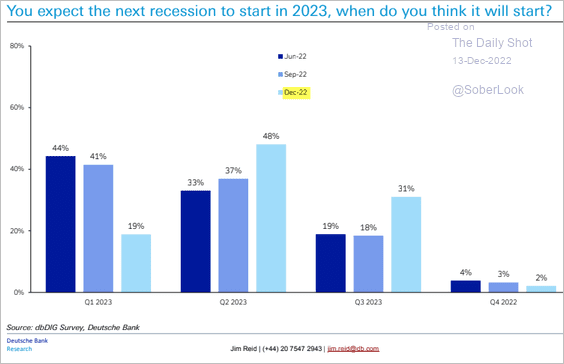 Source: Deutsche Bank Research
• Nationwide’s economic projections show a GDP decline in 2023 (for the full year), which is well below the FOMC’s projections from September. The FOMC is likely to downgrade its forecast this week.
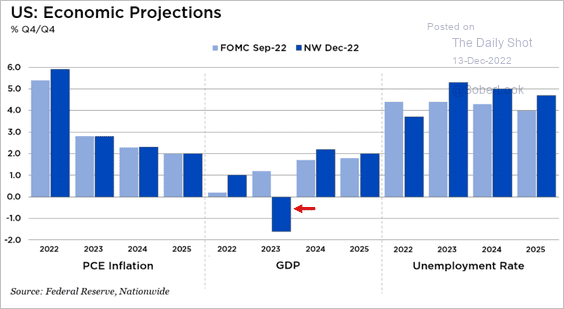 Source: Nationwide
• With the recession looming, the market expects deeper rate cuts after reaching the terminal rate.
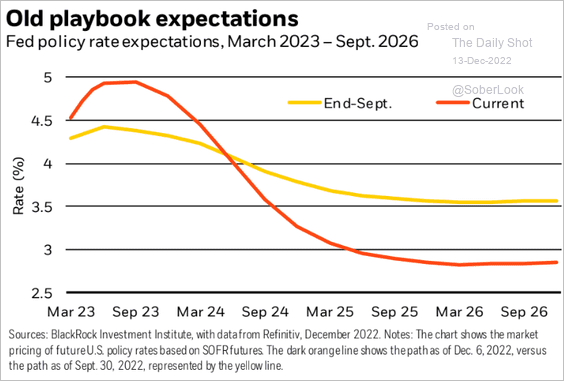 Source: BlackRock Investment Institute
——————–
3. Business investment is expected to slow rapidly.
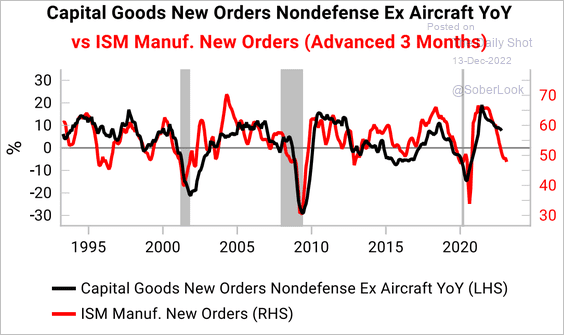 Source: Variant Perception
4. The budget deficit is now following last year’s trajectory.
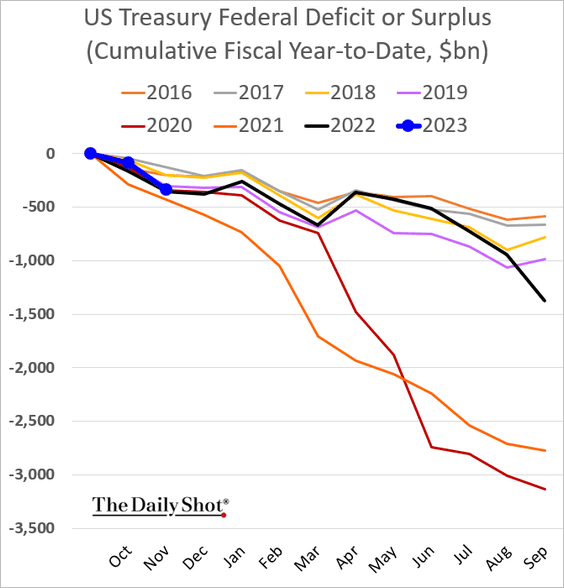
Interest payments continue to climb.
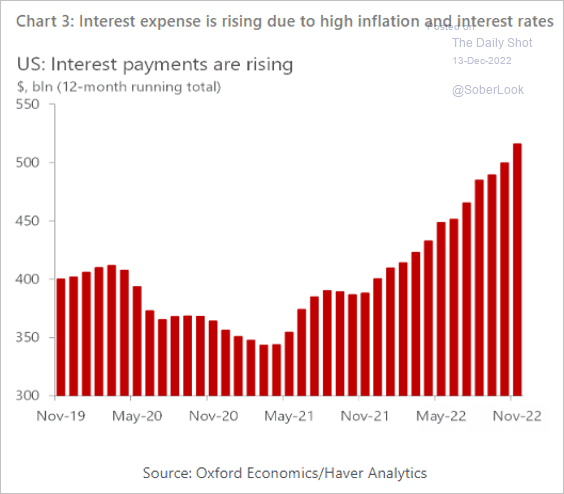 Source: Oxford Economics
——————–
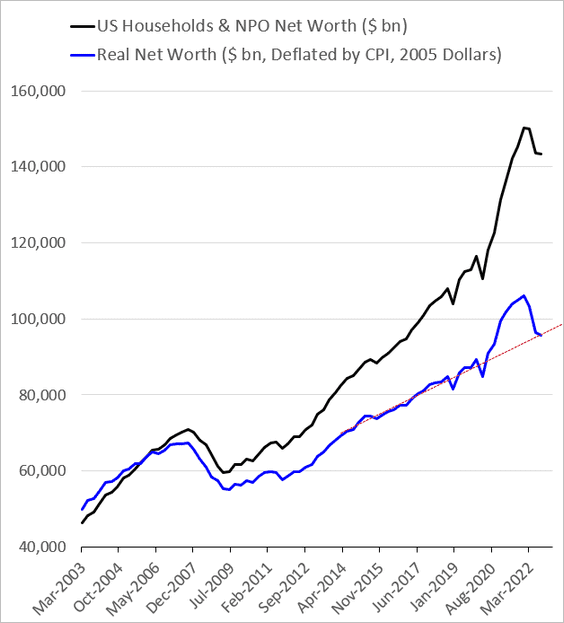
5. Real household net worth (blue line) is back on the pre-COVID trend.
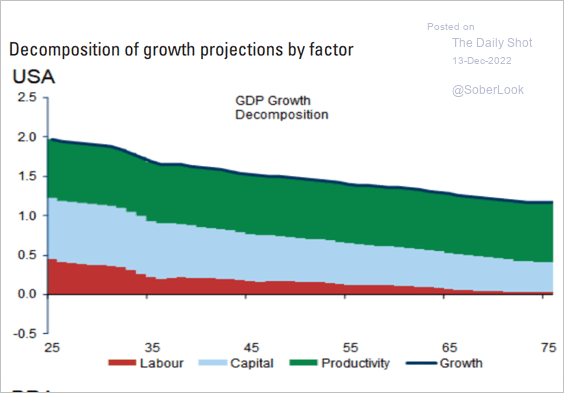
6. Declining population growth limits US economic potential.
 Source: Goldman Sachs
Back to Index
Canada
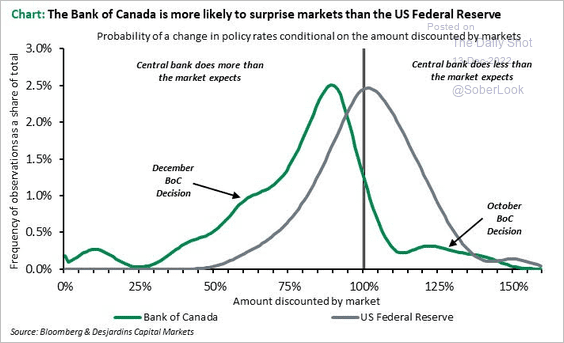
1. The BoC is more likely to surprise the markets than the Fed.
 Source: Desjardins
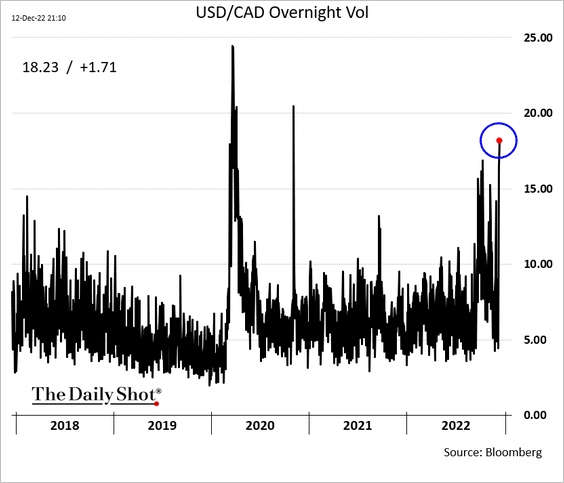
2. USD/CAD overnight implied vol surged ahead of the US CPI and FOMC.
Back to Index
The United Kingdom
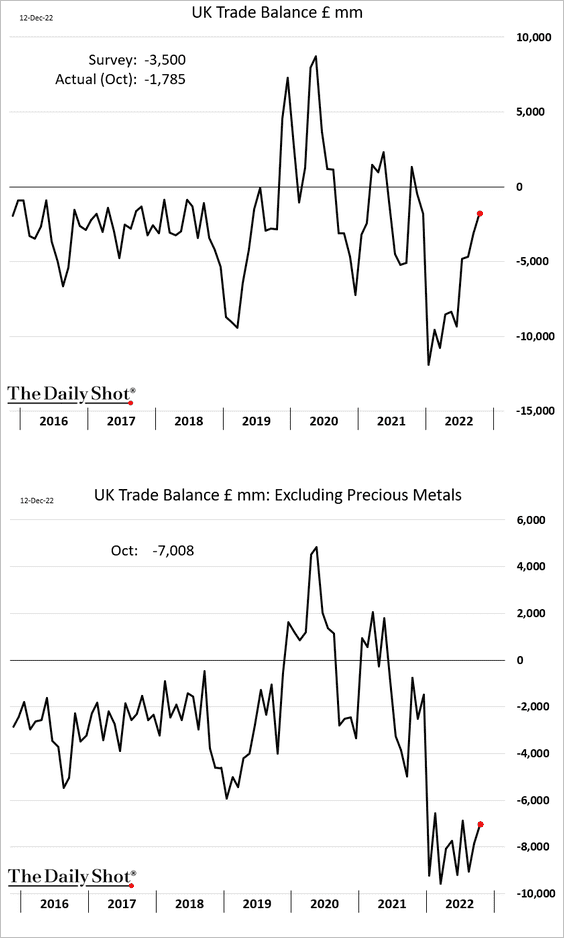
1. The economy grew in October, …
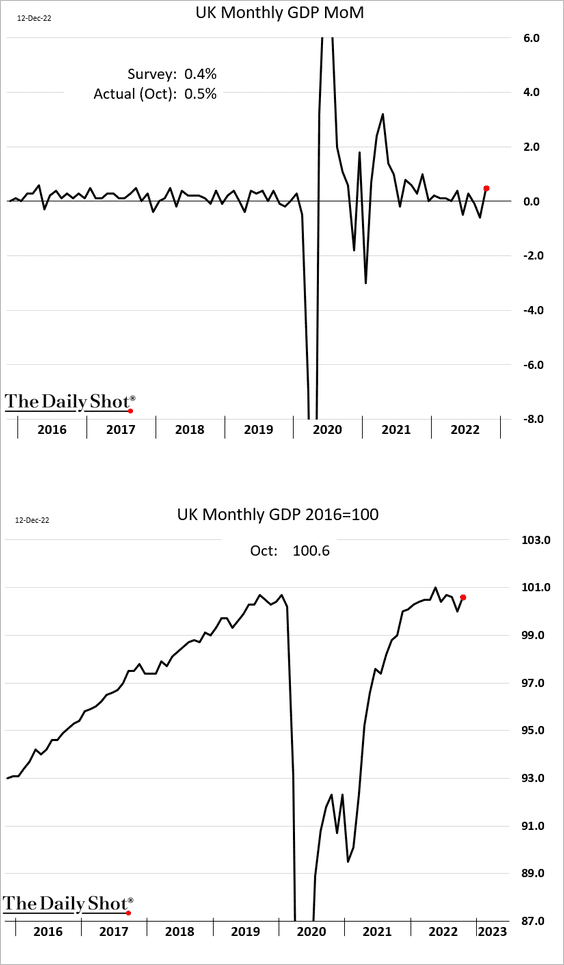
… driven by services.
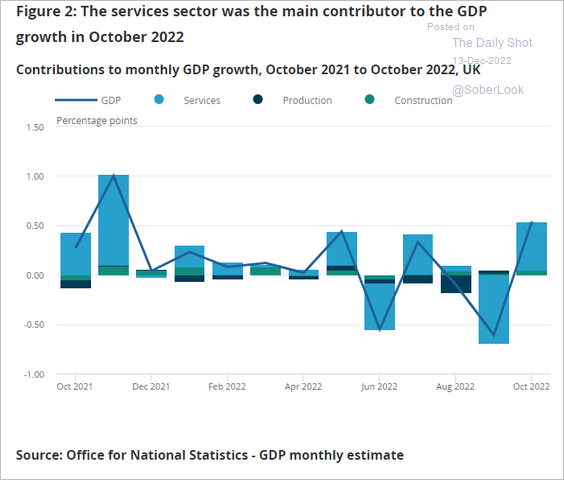 Source: ONS Read full article
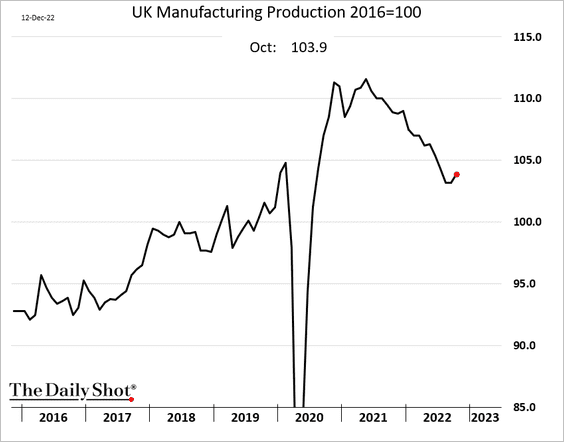
• Manufacturing production improved, but it was offset by mining, resulting in flat industrial production.
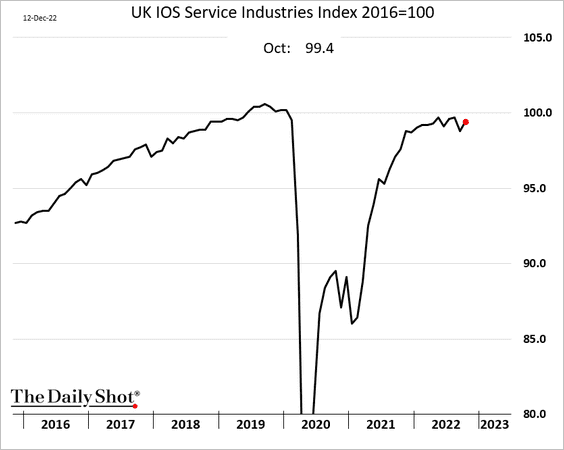
• Services output also increased.
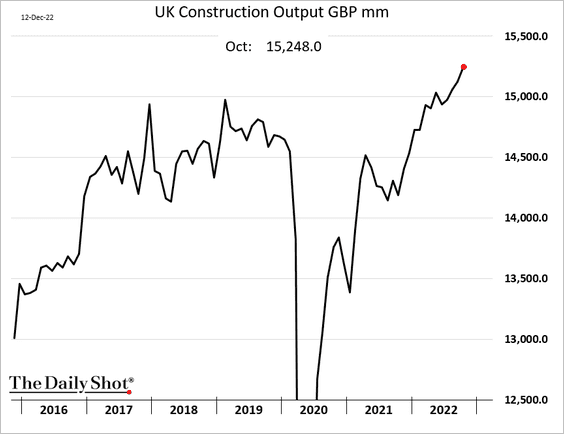
• Construction output continues to show strength.
• The trade deficit narrowed.
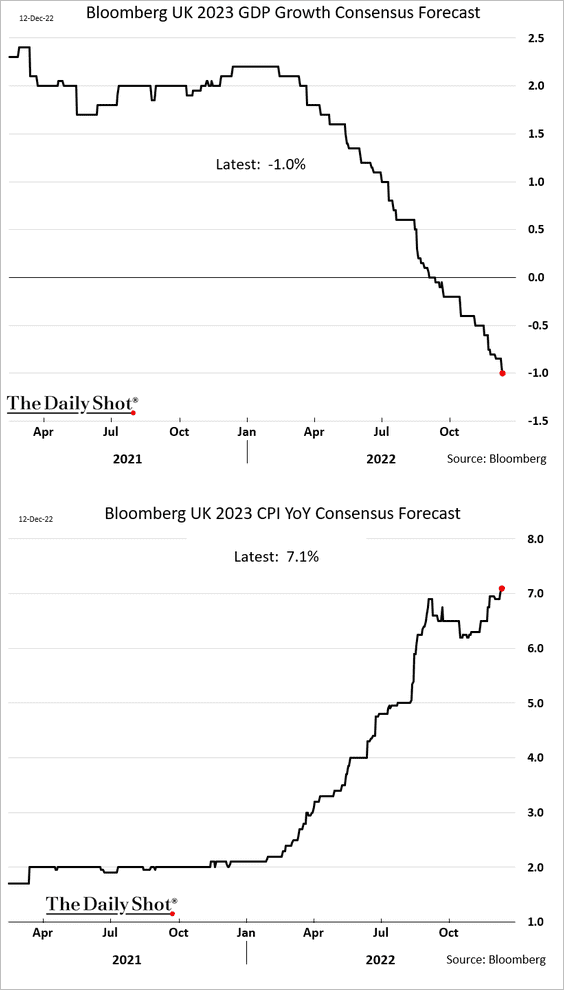
2. Economists continue to forecasts an ugly 2023 for the UK. Welcome to stagflation.
3. Last month’s growth in payrolls topped expectations. More on this tomorrow.
Back to Index
The Eurozone
1. Where is the terminal rate? Below is a forecast from Pantheon Macroeconomics compared to the consensus estimate.
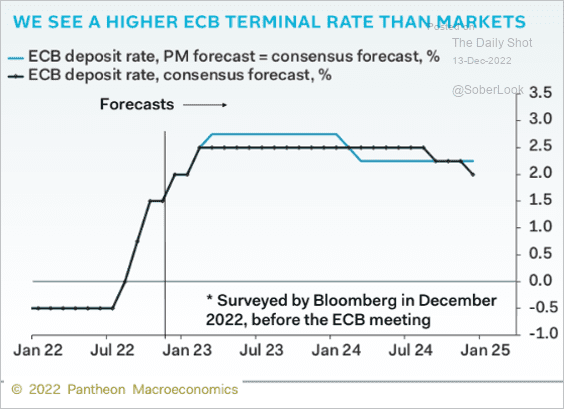 Source: Pantheon Macroeconomics
And this chart shows Deutsche Bank’s survey results.
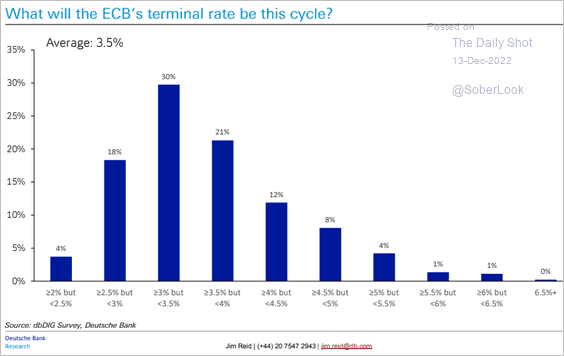 Source: Deutsche Bank Research
——————–
2. Price and demand expectations have diverged (stagflationary signal).
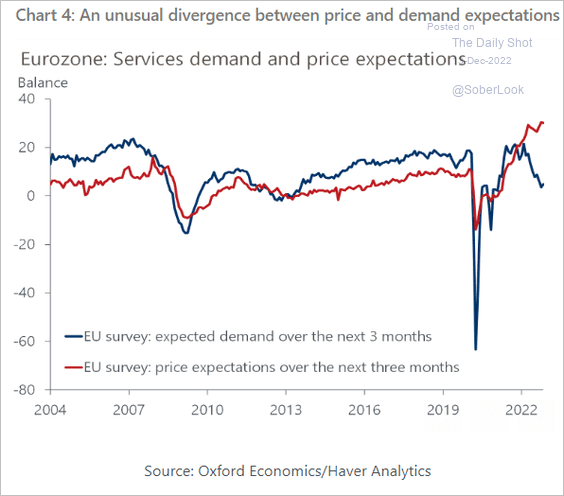 Source: Oxford Economics
3. Financial conditions remain depressed.
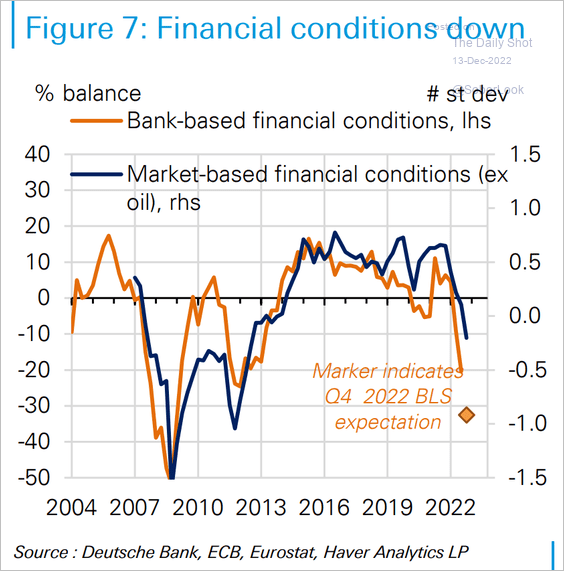 Source: Deutsche Bank Research
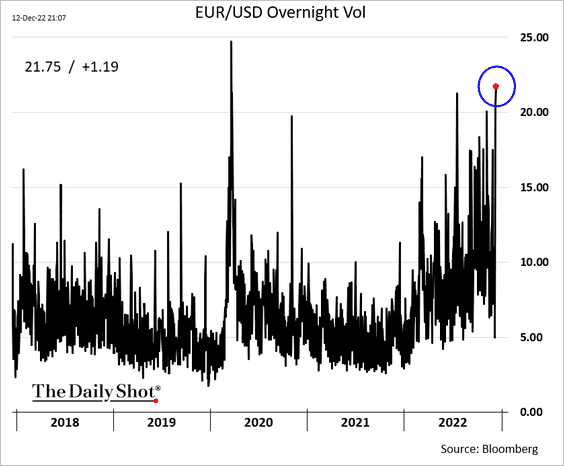
4. EUR/USD overnight implied vol jumped ahead of US CPI, the FOMC, and the ECB.
Back to Index
Japan
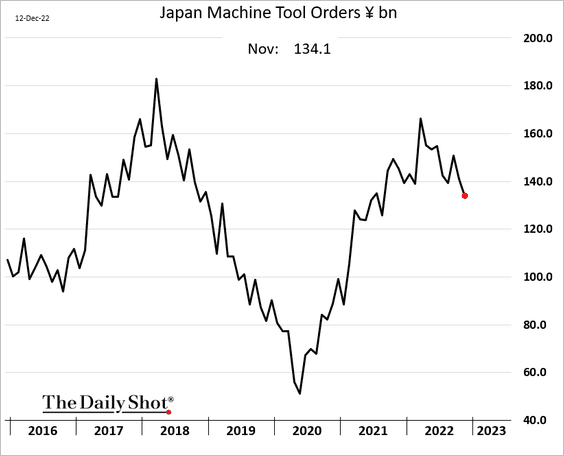
1. Machine tool orders are rolling over.
2. The BoJ has consistently upgraded its inflation and growth forecasts since April.
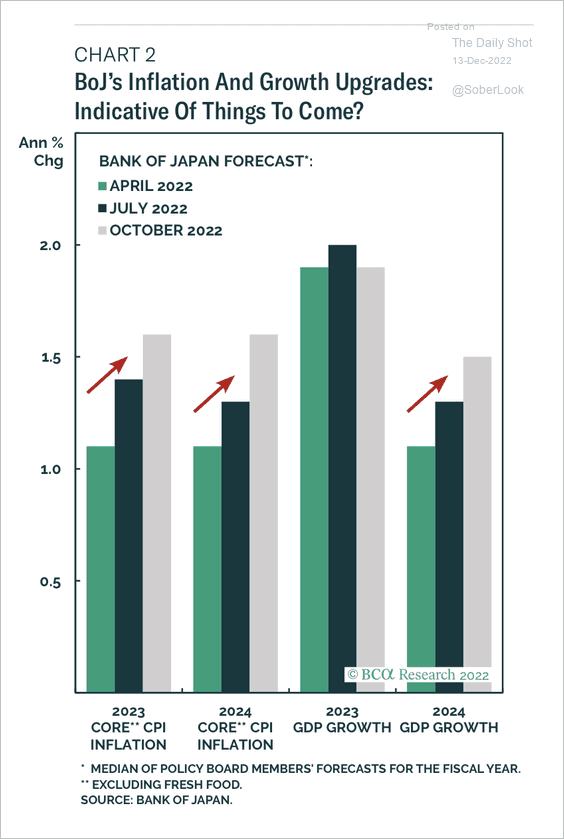 Source: BCA Research
Back to Index
Asia – Pacific
1. New Zealand’s housing sales are down 36% versus 12 months ago, …
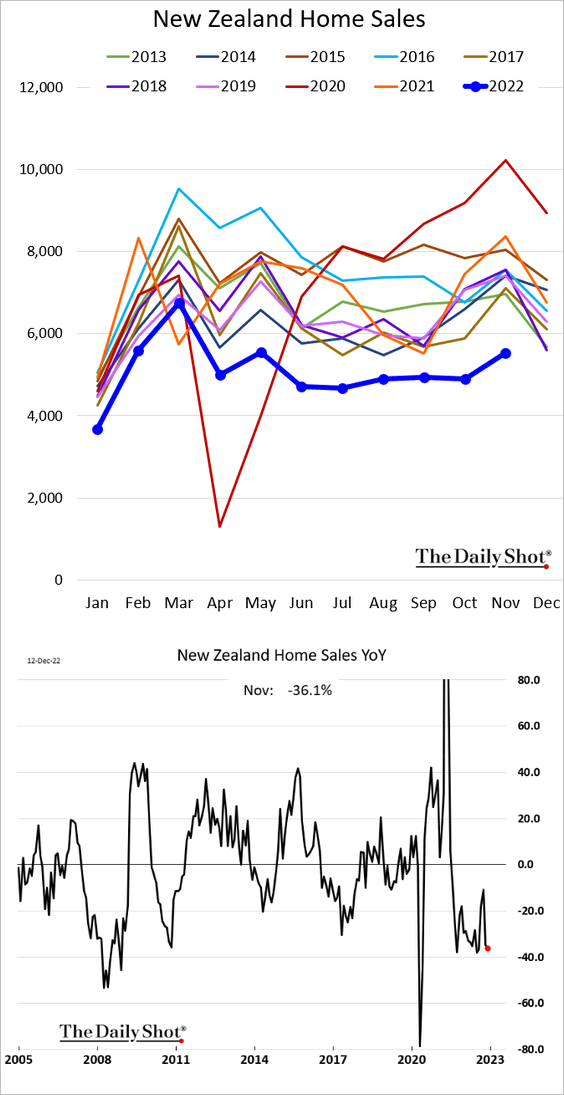
… as home prices tumble.
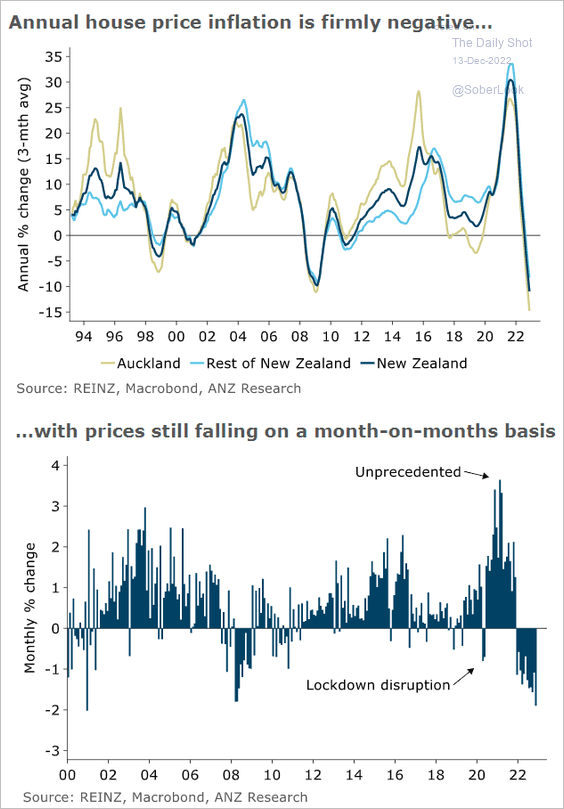 Source: @ANZ_Research
——————–
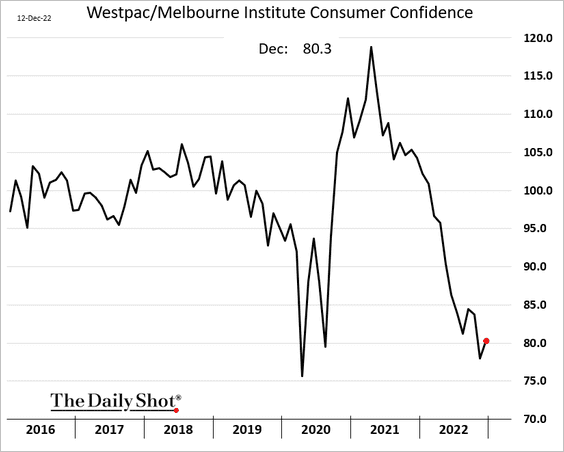
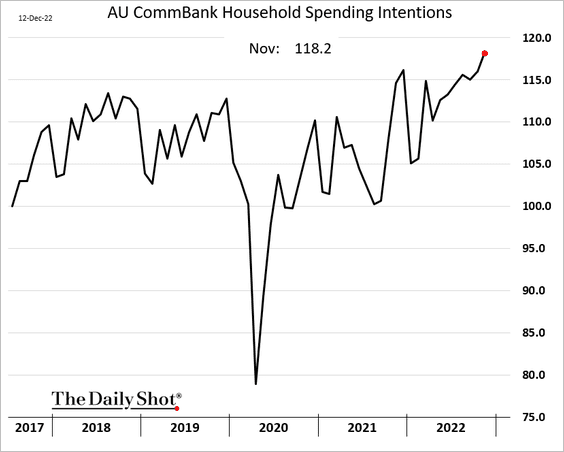
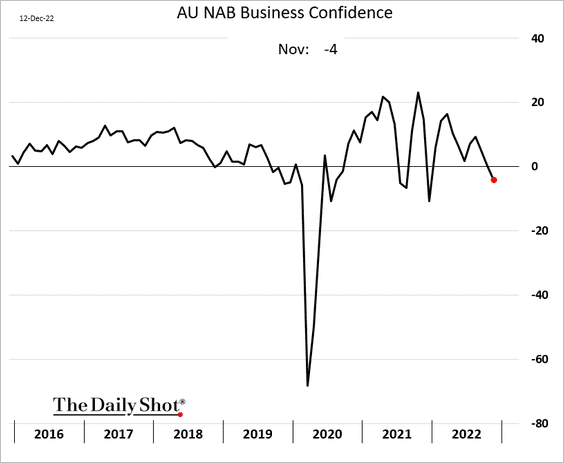
2. Next, we have some updates on Australia.
• Consumer confidence (bottomed?):
• Households’ spending intentions:
• Business confidence (worsening):
• Exports (downside risk):
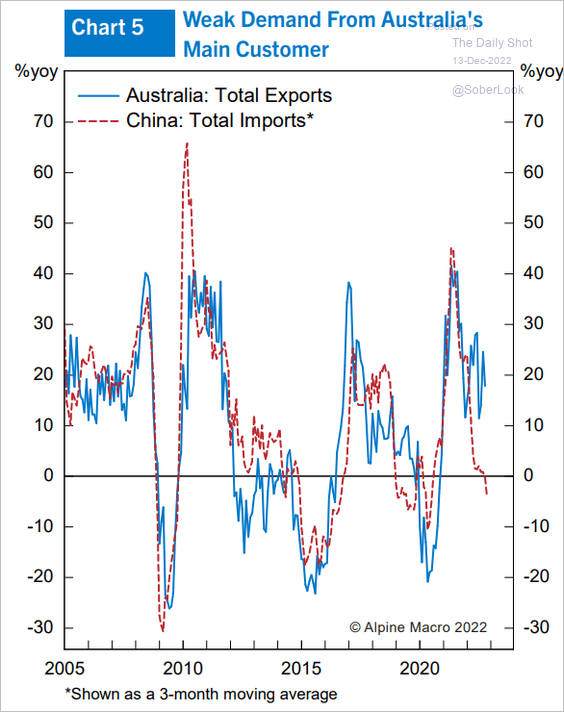 Source: Alpine Macro
Back to Index
China
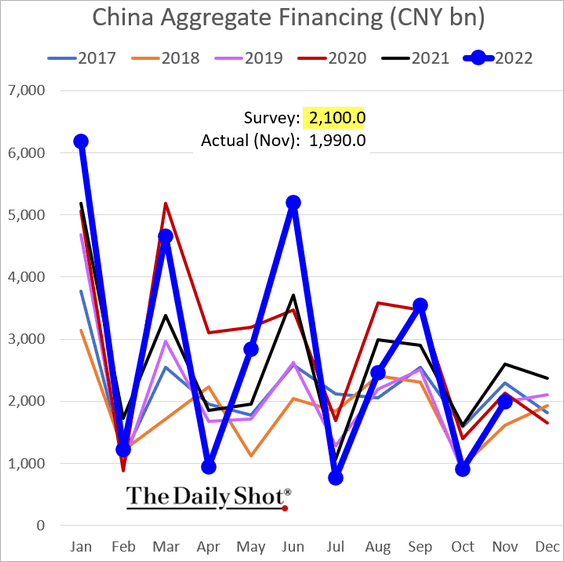
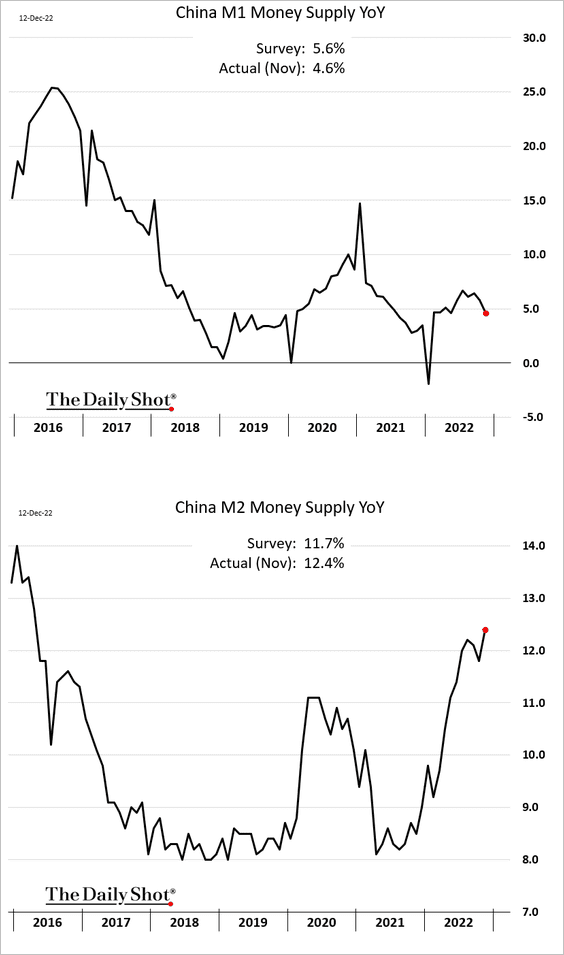
1. Loan growth was weaker than expected, …
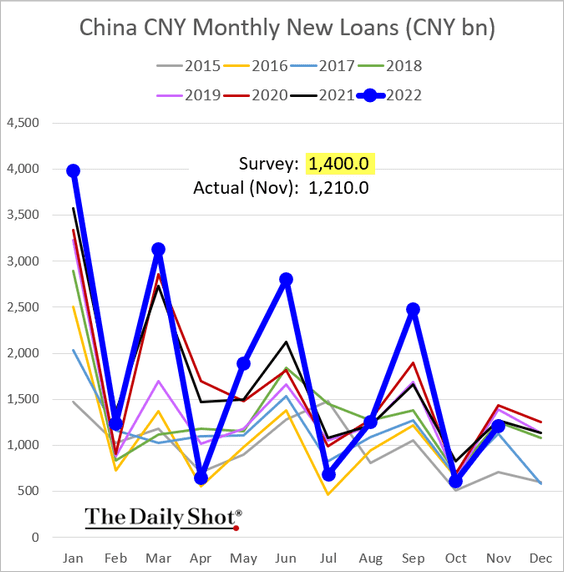
… as households remain cautious (2 charts).
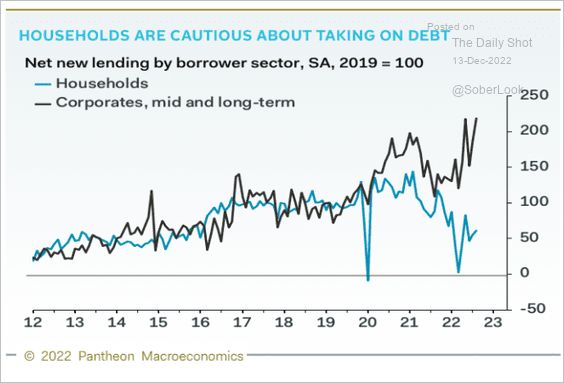 Source: Pantheon Macroeconomics
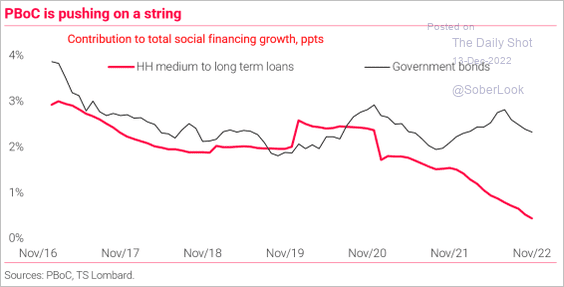 Source: TS Lombard
• Total credit growth was also below forecasts.
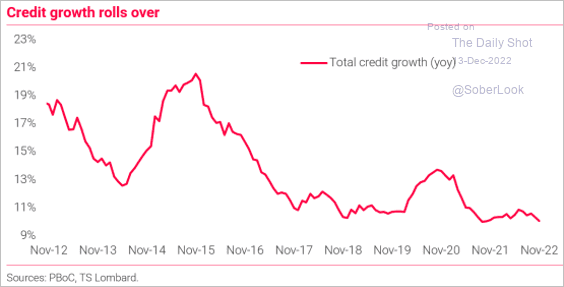 Source: TS Lombard
• The broad money supply growth accelerated.
——————–
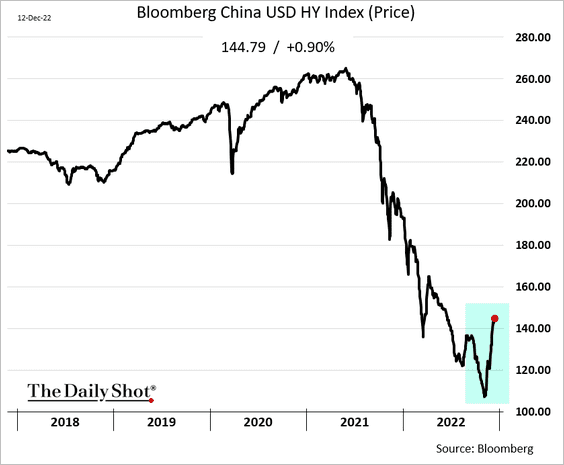
2. USD-denominated high-yield bonds are rebounding as Beijing promises more support.
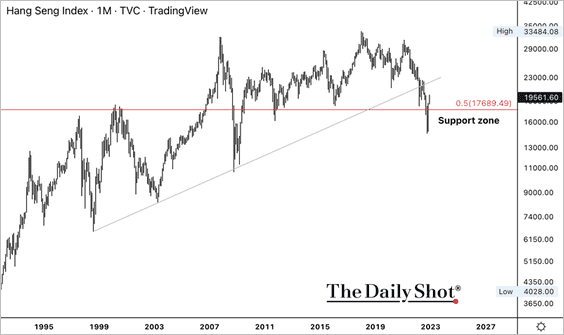
3. Hong Kong stocks rose further as the city lifted COVID-19 curbs on arrivals.
 Source: South China Morning Post Read full article
The Hang Seng Index returned above support, albeit still below its long-term uptrend.
Back to Index
Emerging Markets
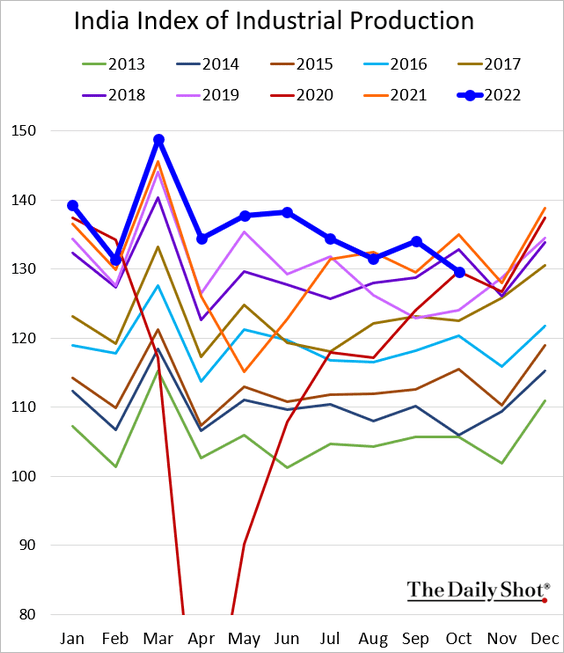
1. India’s inflation surprised to the downside.
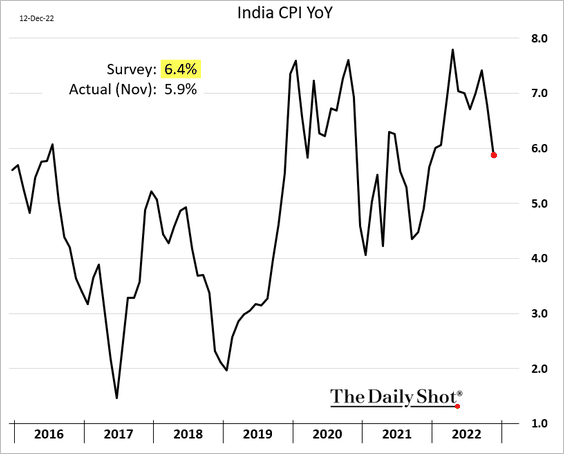
Industrial production weakened in October.
——————–
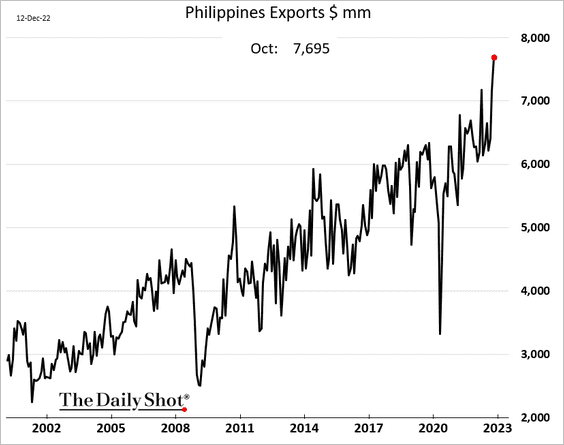
2. Philippine exports hit a record high.
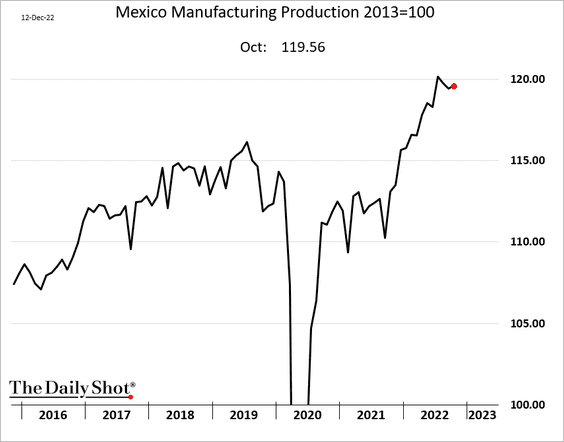
3. Mexico’s manufacturing output has been holding up.
4. EM reserves declined in recent months.
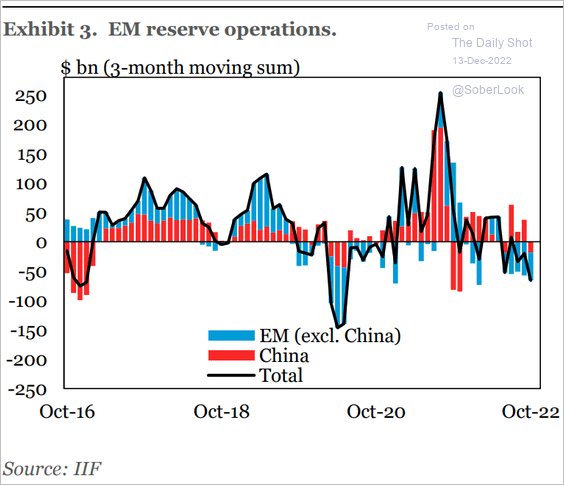 Source: IIF
5. Which economies are most vulnerable to US dollar strength?
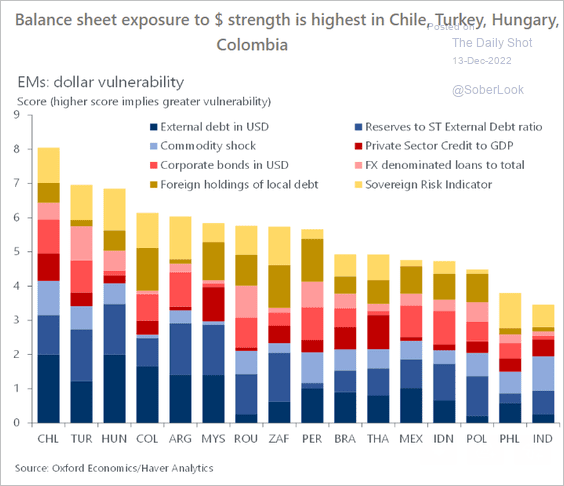 Source: Oxford Economics
Back to Index
Cryptocurrency
1. FTX’s founder was arrested Sunday night in the Bahamas.
 Source: @WSJ Read full article
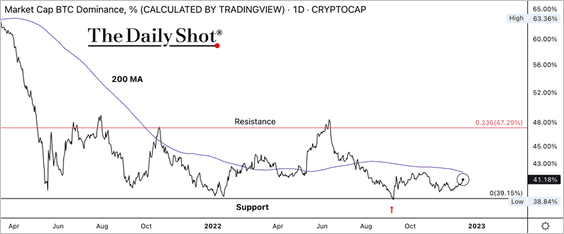
2. Bitcoin’s market cap relative to the total crypto market cap (dominance ratio) is approaching its 200-day moving average. A break above resistance could signal risk-off conditions.
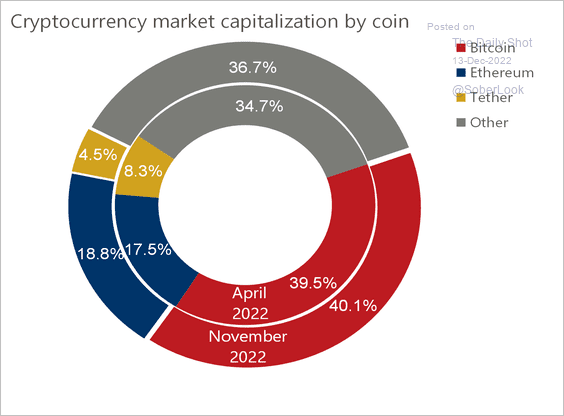
3. Bitcoin, ether, and tether still dominate the total crypto market cap.
 Source: Oxford Economics
4. The crypto Fear & Greed Index has shifted between “extreme fear” and “fear” over the past few months.
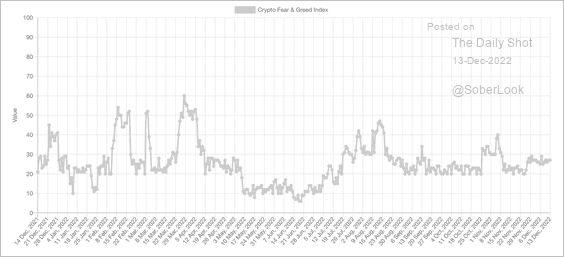 Source: Alternative.me
5. Several altcoins have lost momentum relative to bitcoin, with widespread technical breakdowns. The chart below plots weekly relative strength and momentum across altcoins versus bitcoin.
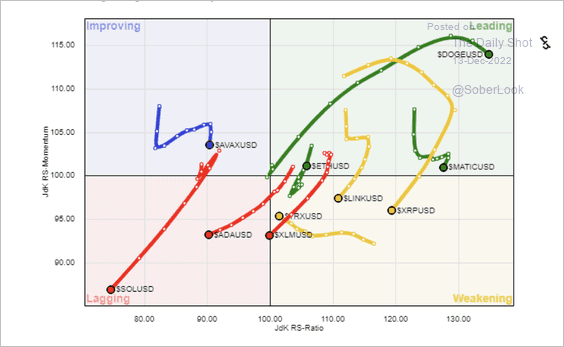 Source: @StocktonKatie
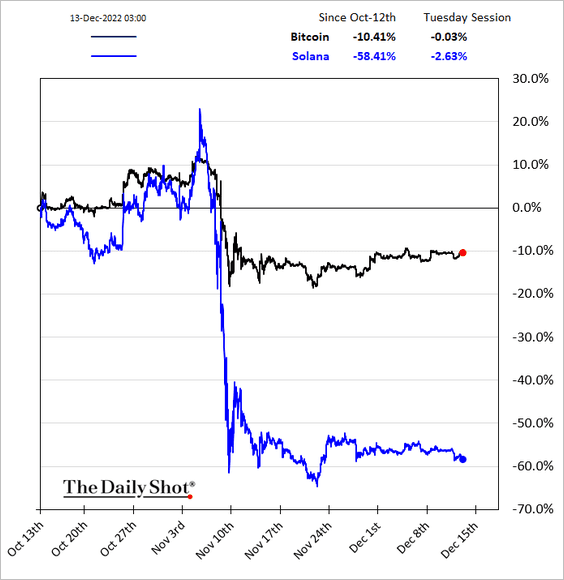
6. The FTX-induced crash in SOL (Solana’s token) has been remarkable – with no signs of recovery. There are now concerns about the Solana network stability.
Back to Index
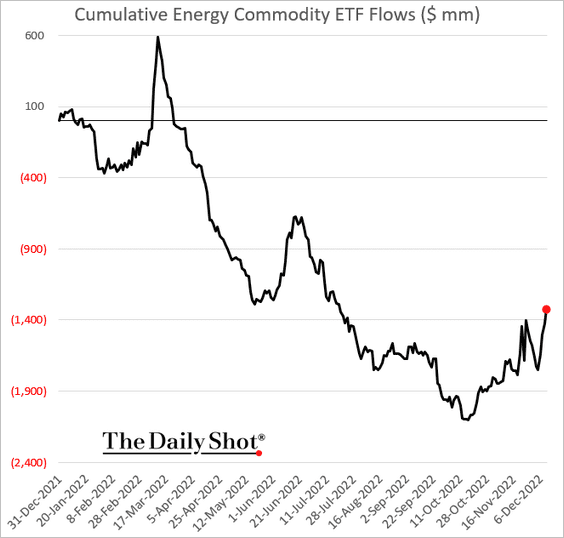
Energy
Oil ETFs are seeing inflows (3 charts).
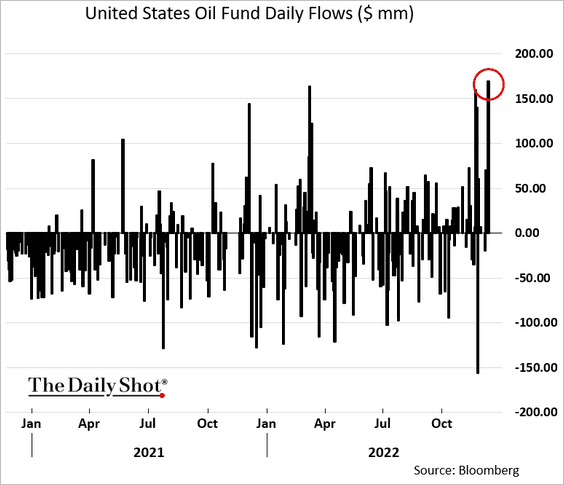
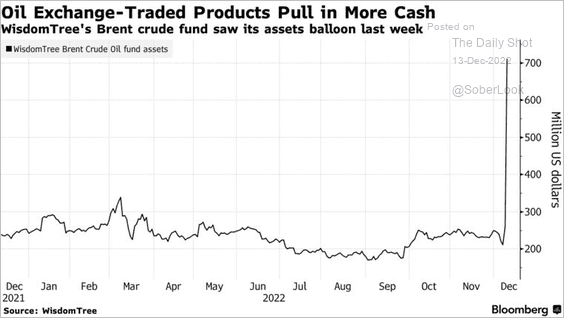 Source: @alexlongley1, @markets Read full article
Back to Index
Equities
1. The bottom-up S&P 500 price target for the end of 2013 is about 13% above current levels.
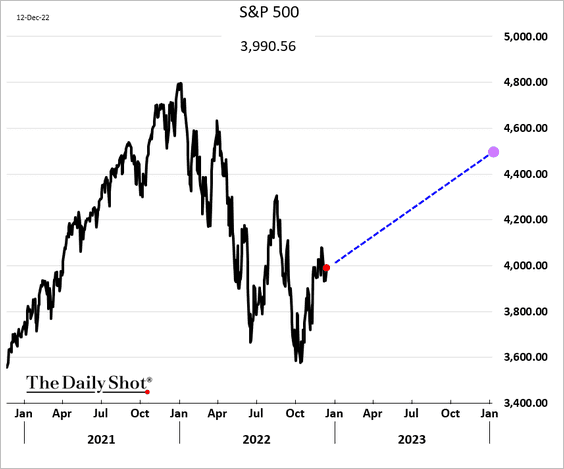
Here is the track record of these forecasts.
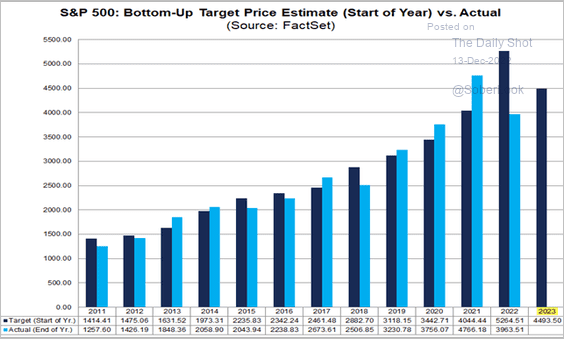 Source: @FactSet Read full article
And this chart shows bottom-up price targets by sector.
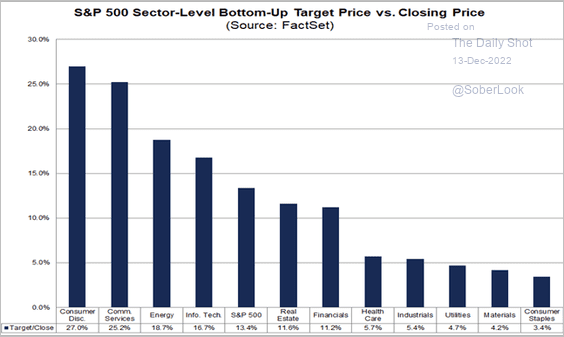 Source: @FactSet Read full article
——————–
2. Market sentiment remains cautious.
• Single-stock call volume:
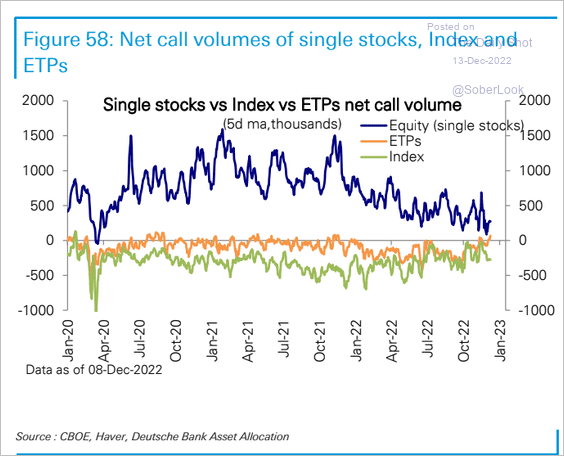 Source: Deutsche Bank Research
• Premiums paid for puts vs. calls:
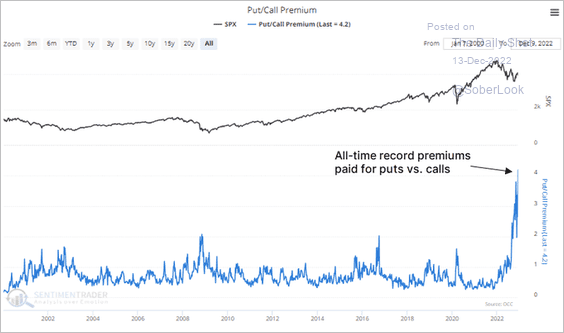 Source: @sentimentrader
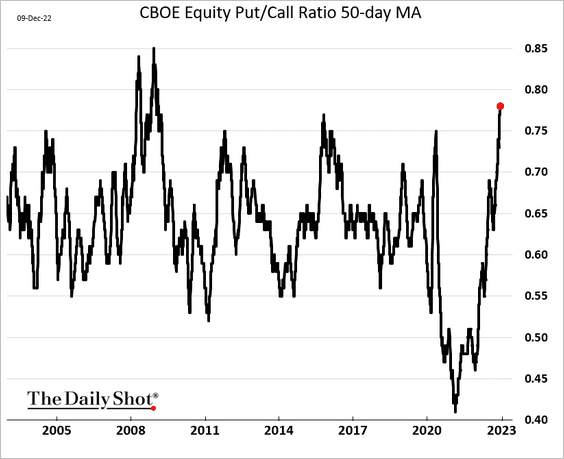
• The put/call ratio 50-day moving average (highest since the GFC):
• Goldman’s sentiment indicator:
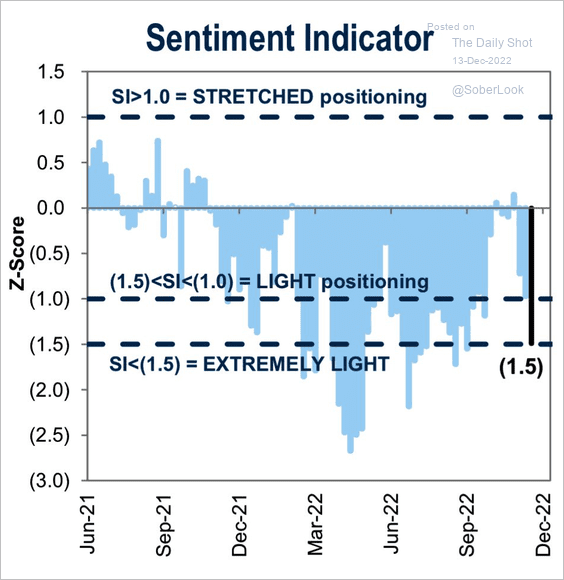 Source: Goldman Sachs; @WallStJesus
However, BofA’s fund manager survey shows cash levels peaking …
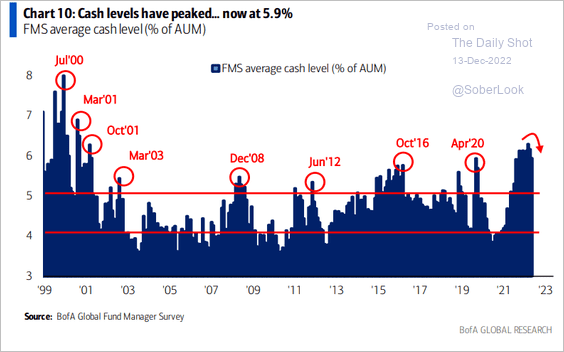 Source: BofA Global Research
… and risk appetite starting to recover.
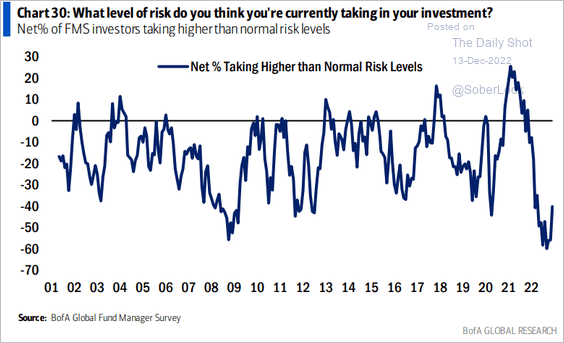 Source: BofA Global Research
——————–
3. Are growth stocks oversold?
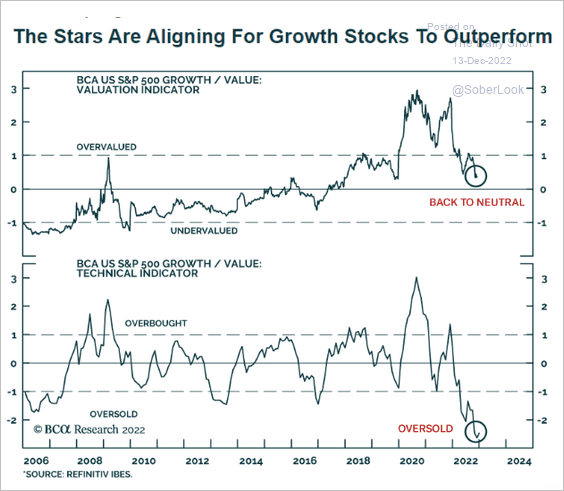 Source: BCA Research
4. There isn’t much interest in shorting SPY.
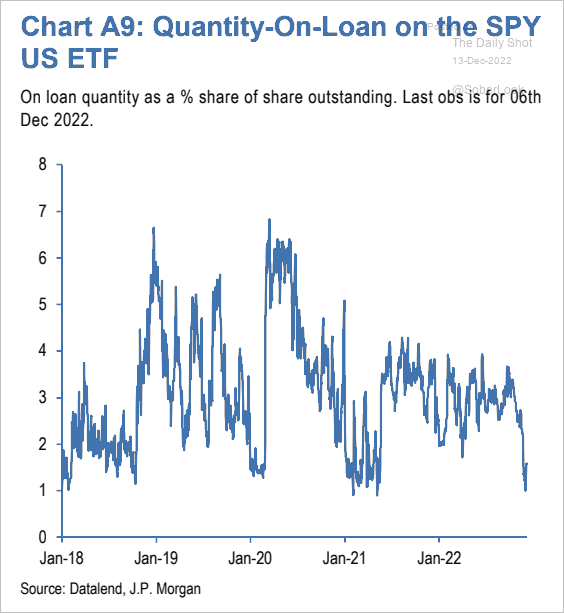 Source: JP Morgan Research; @themarketear
5. Here is the S&P 500 performance in Fed tightening cycles.
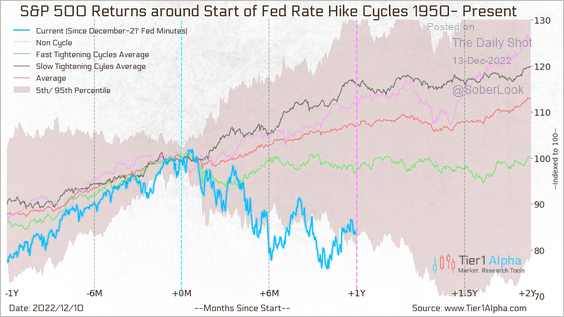 Source: Tier1 Alpha
6. This chart shows non-financial equity issuance trends since 1998.
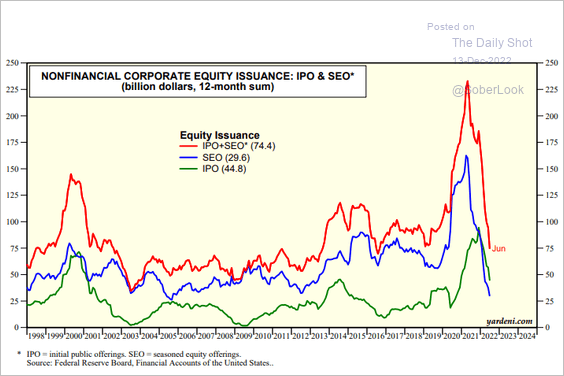 Source: Yardeni Research
7. Equity market volatility has been more extreme over the past three years.
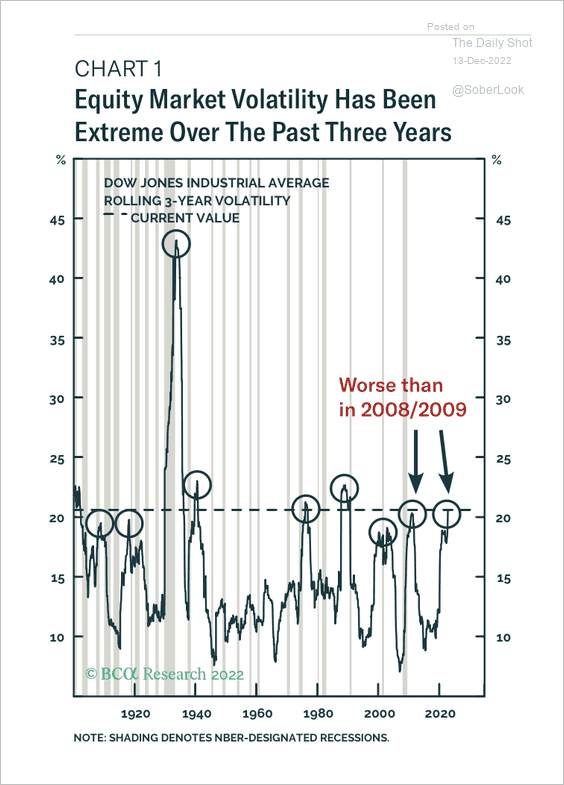 Source: BCA Research
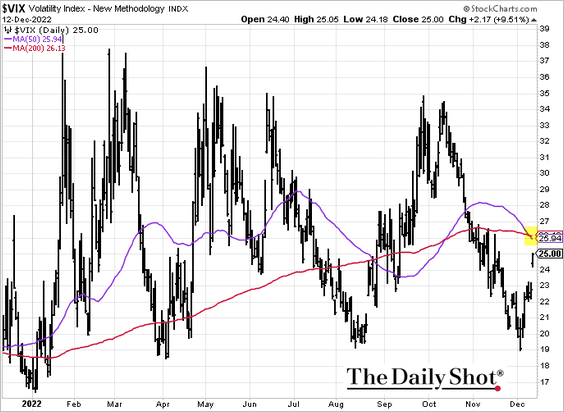
8. VIX fell into a death cross.
 Source: @JessicaMenton, @markets Read full article
Back to Index
Credit
1. US bank-held business loans are back on the pre-COVID trend.
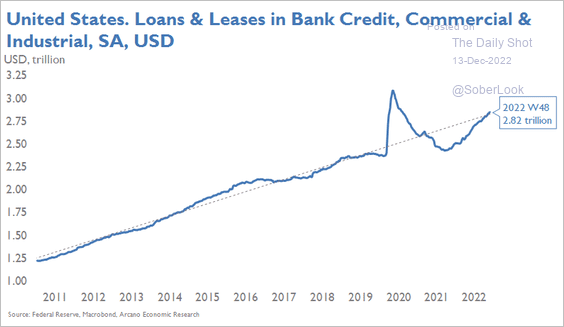 Source: Arcano Economics
But banks are tightening lending standards.
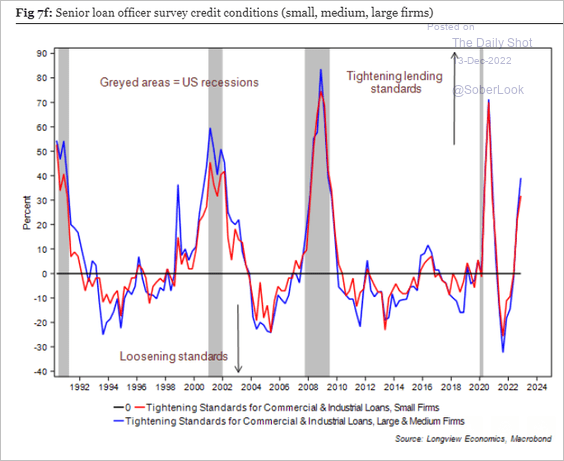 Source: Longview Economics
——————–
2. What are the drivers of recent rating downgrades?
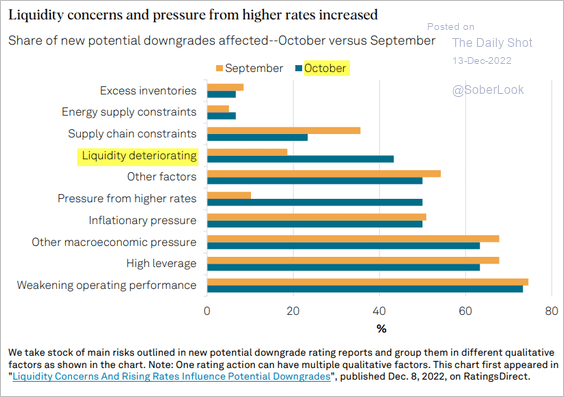 Source: S&P Global Ratings
3. When do spreads peak in a recession?
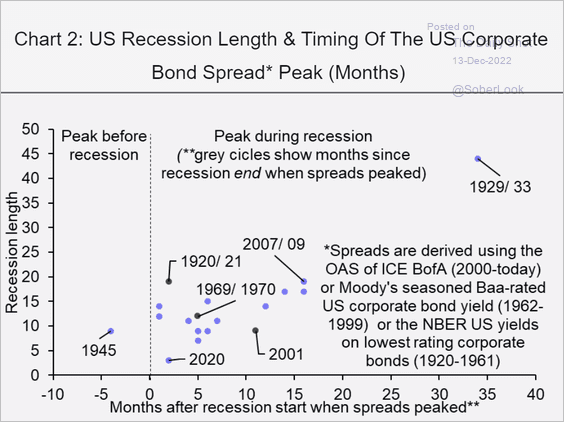 Source: Capital Economics
Back to Index
Rates
1. The 10-year/3-month Treasury yield curve tends to trough between zero and -100 basis points in the lead-up to recessions.
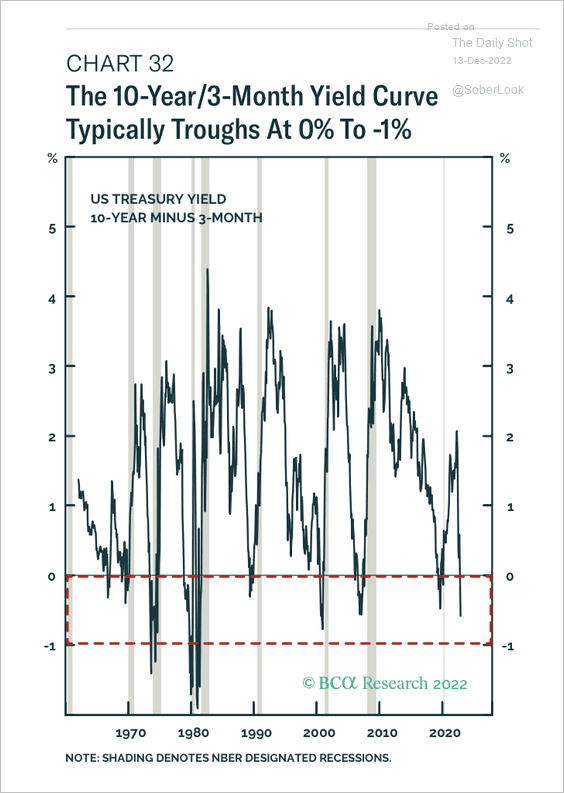 Source: BCA Research
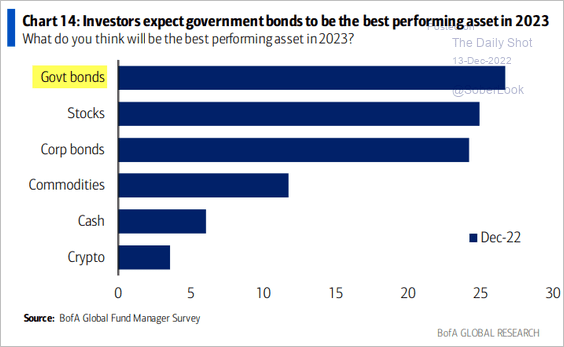
2. Fund managers are now overweight bonds.
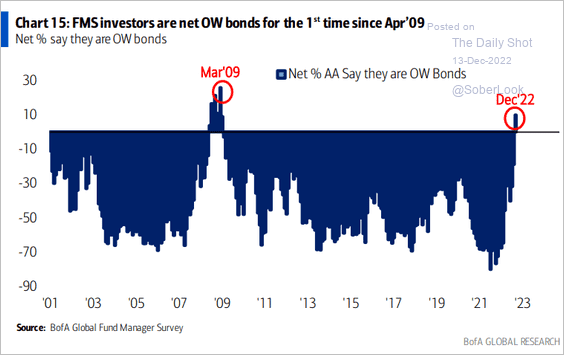 Source: BofA Global Research
 Source: BofA Global Research
——————–
3. The iShares TIPS Bond ETF (TIP) is starting to underperform the iShares 7-10 year Treasury Bond ETF (IEF). A breakdown in the TIP/IEF price ratio could point to a falling inflation environment.
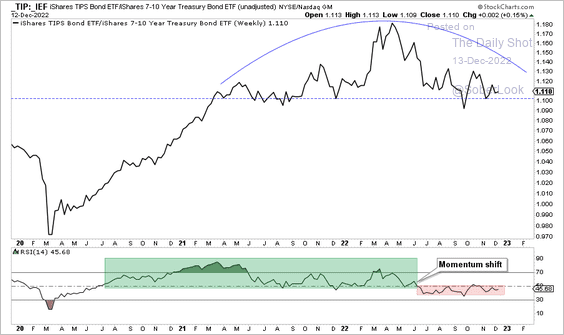 Source: Aazan Habib, Paradigm Capital
4. SOFR has climbed above the Fed’s RRP rate.
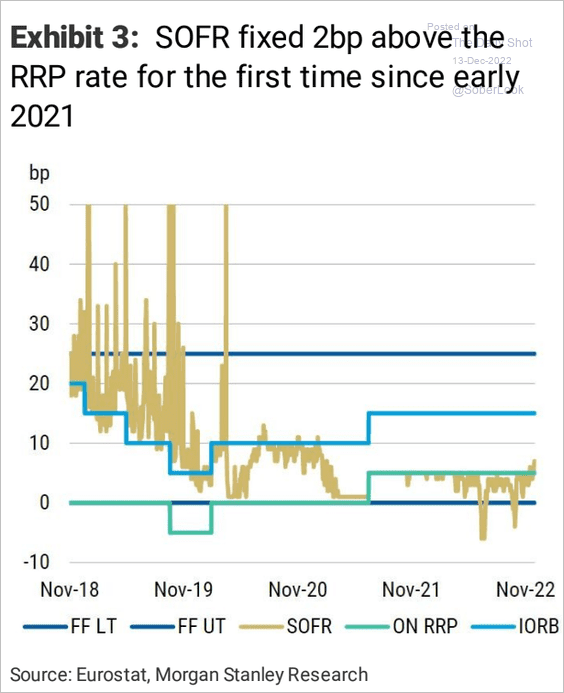 Source: Morgan Stanley Research
5. LIBOR bond issuance stopped at the end of 2021. Overnight risk-free or nearly risk-free rates (RFRs such as SOFR) have replaced LIBOR.
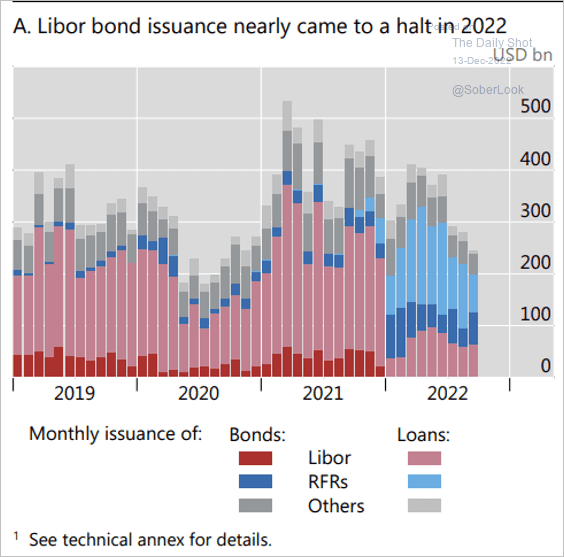 Source: BIS Read full article
Back to Index
Global Developments
1. Below are some projections for central bank balance sheets from OECD.
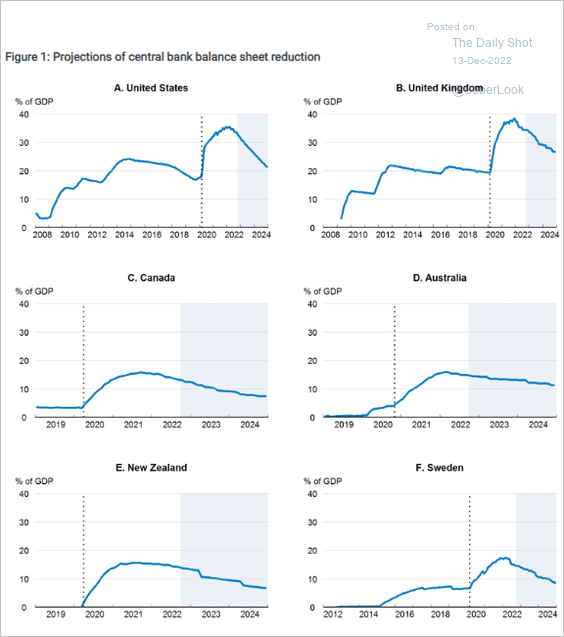 Source: OECD Read full article
2. This has been the most coordinated global hiking cycle in history. Will we see rate cuts soon?
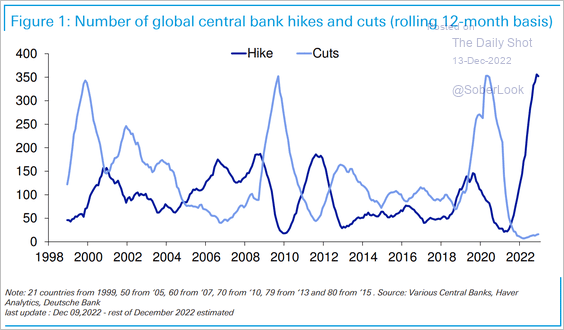 Source: Deutsche Bank Research
3. The decline in bond yields has occurred amid narrower credit spreads.
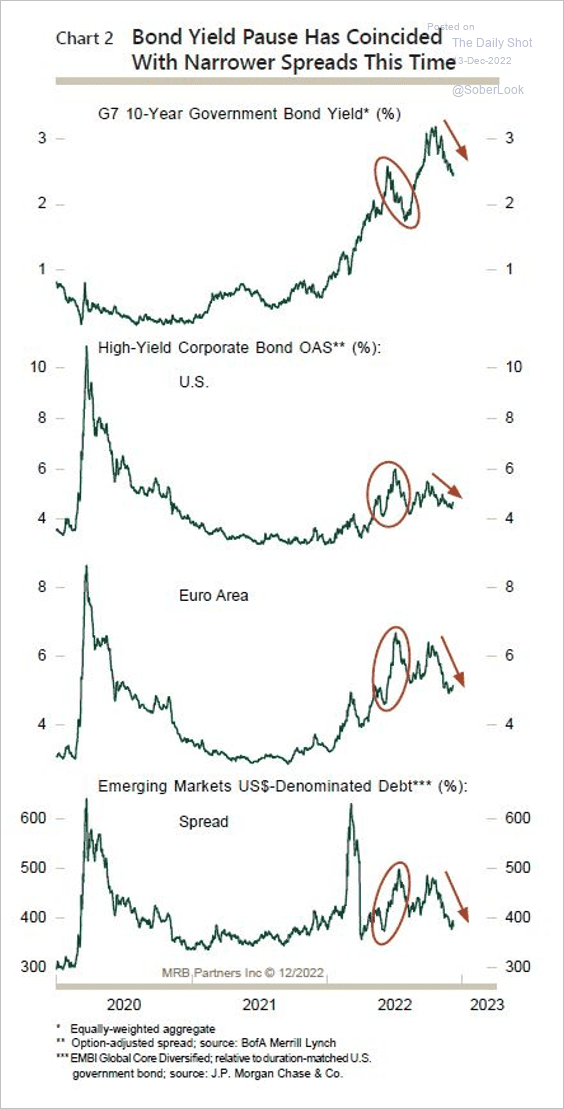 Source: MRB Partners
4. Real wages are down this year as inflation takes a toll.
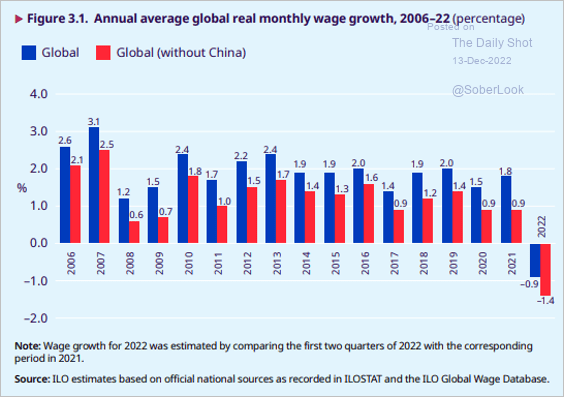 Source: ILO Read full article
——————–
Food for Thought
1. US household size over time:
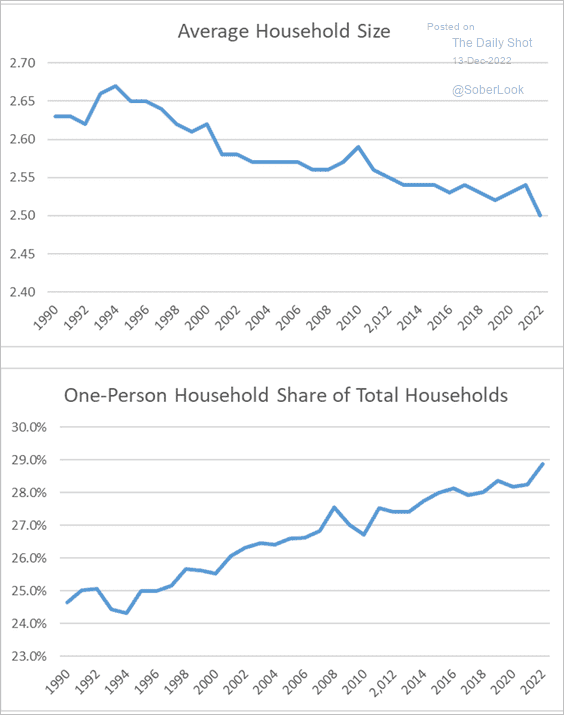 Source: Calculated Risk
2. The cost of student loan payment pause:
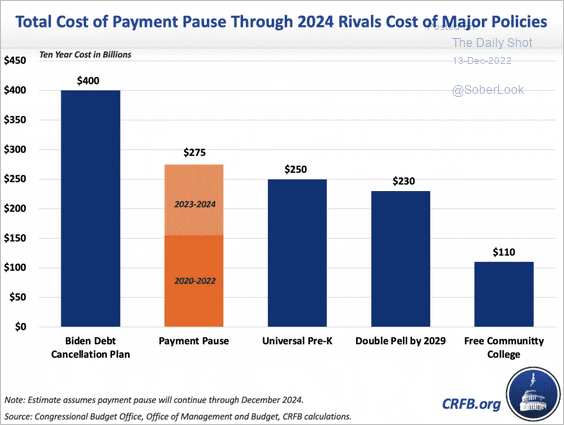 Source: Committee for a Responsible Federal Budget
3. Applying for student loan forgiveness:
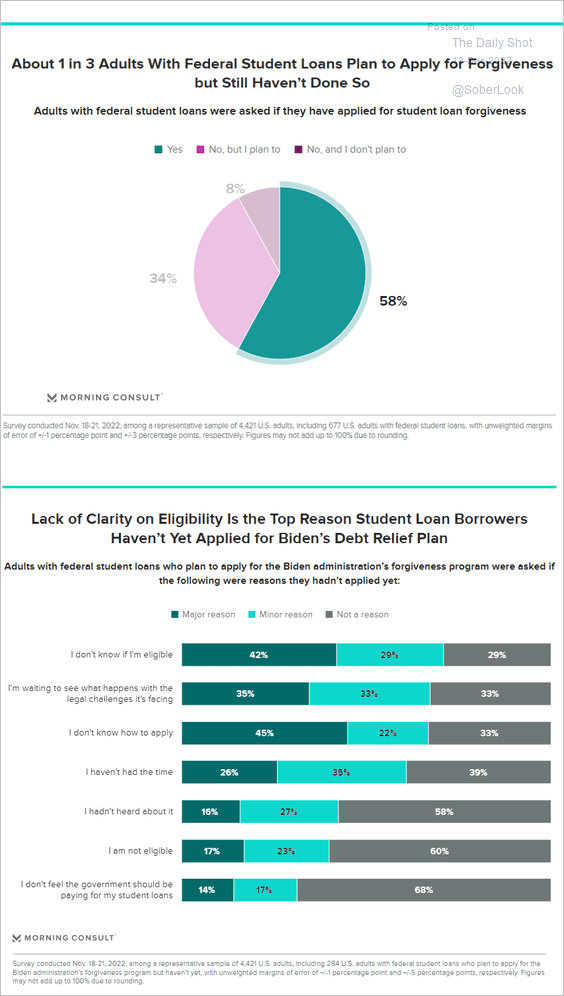 Source: Morning Consult Read full article
4. Major military exercises:
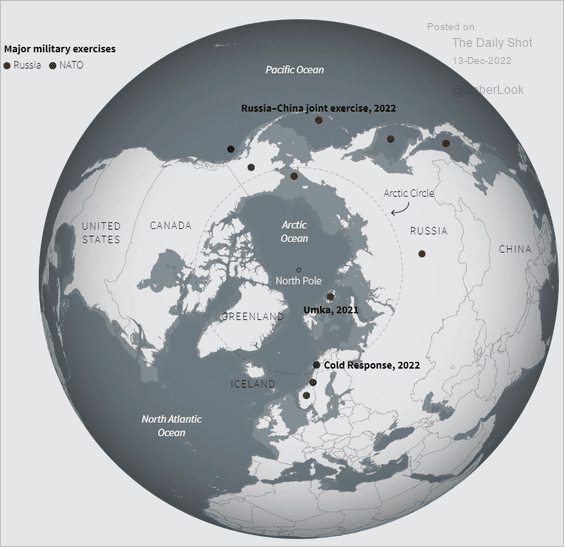 Source: Reuters Read full article
5. US daily COVID hospitalizations by age:
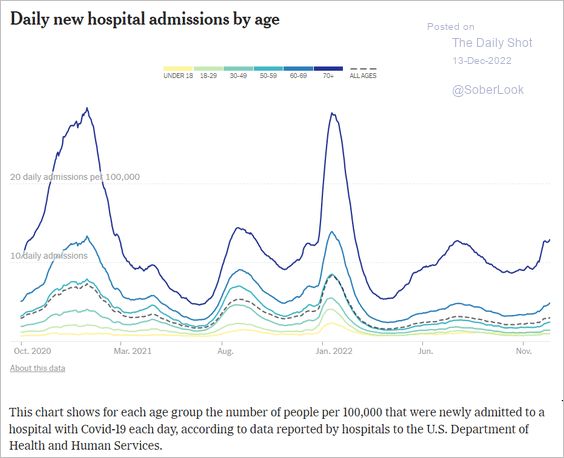 Source: The New York Times Read full article
6. Climate-related litigation:
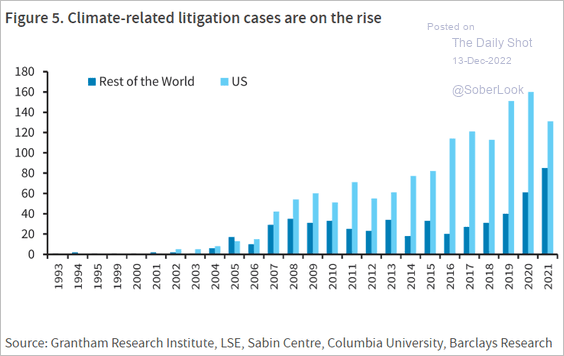 Source: Barclays Research
7. Blog posts on Twitter? No thanks …
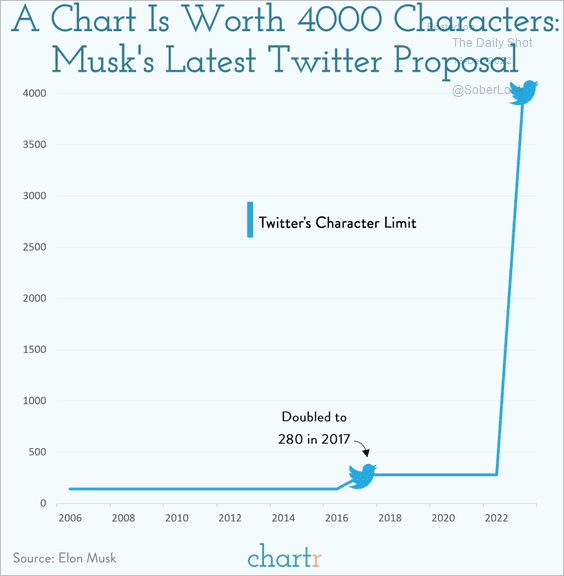 Source: @chartrdaily
8. Internal containment fusion reaction:
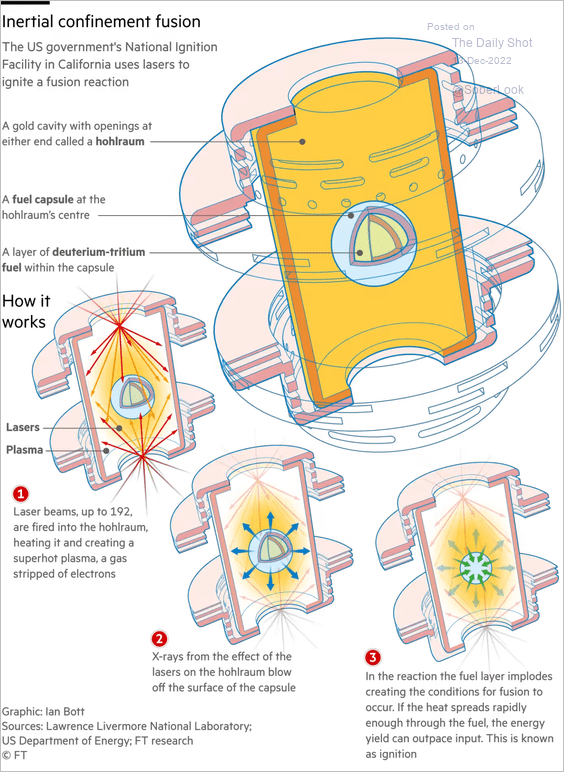 Source: @financialtimes Read full article
——————–
Back to Index