
The Daily Shot: 18-Jan-23
• The United States
• Canada
• The United Kingdom
• The Eurozone
• Japan
• Asia – Pacific
• China
• Emerging Markets
• Cryptocurrency
• Commodities
• Equities
• Credit
• Rates
• Global Developments
• Food for Thought
The United States
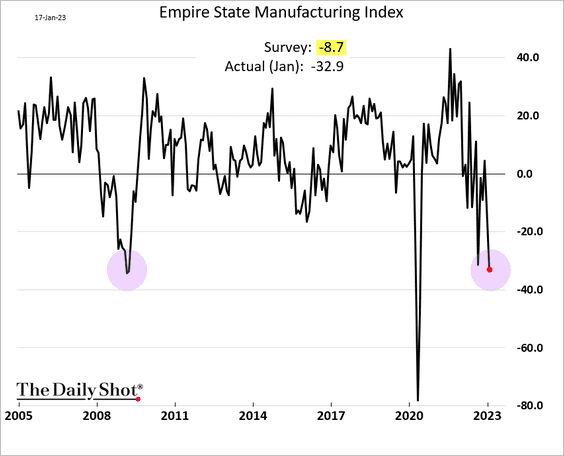
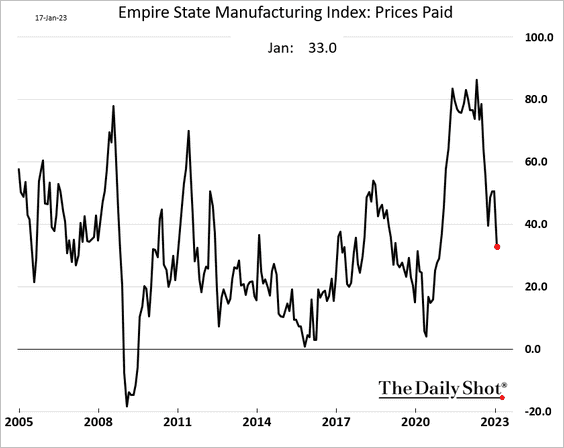
1. The first manufacturing report of the month was a disaster. The NY Fed’s regional factory activity index dipped to the 2008 lows.
 Source: MarketWatch Read full article
This is bad news for manufacturing at the national level (ISM).
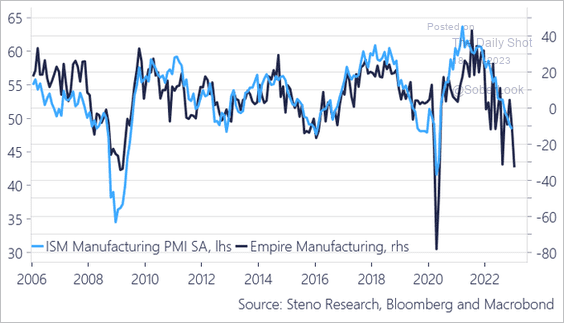 Source: @AndreasSteno
By the way, softer manufacturing activity in China also doesn’t bode well for the ISM index.
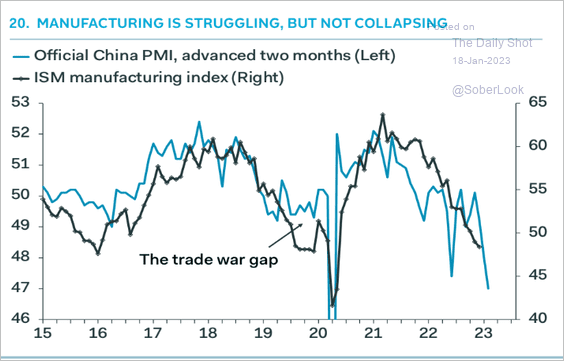 Source: Pantheon Macroeconomics
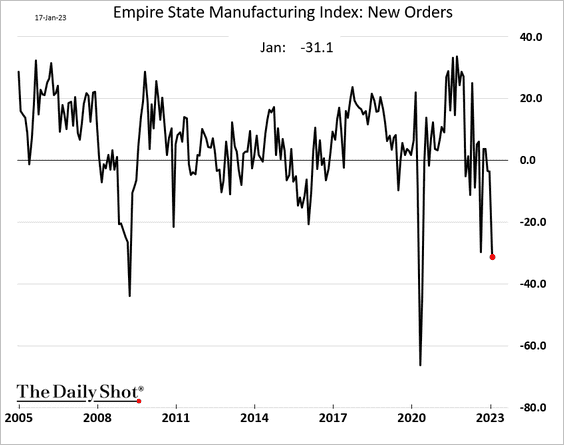
• Demand deteriorated.
• Hiring slowed as factories cut workers’ hours.
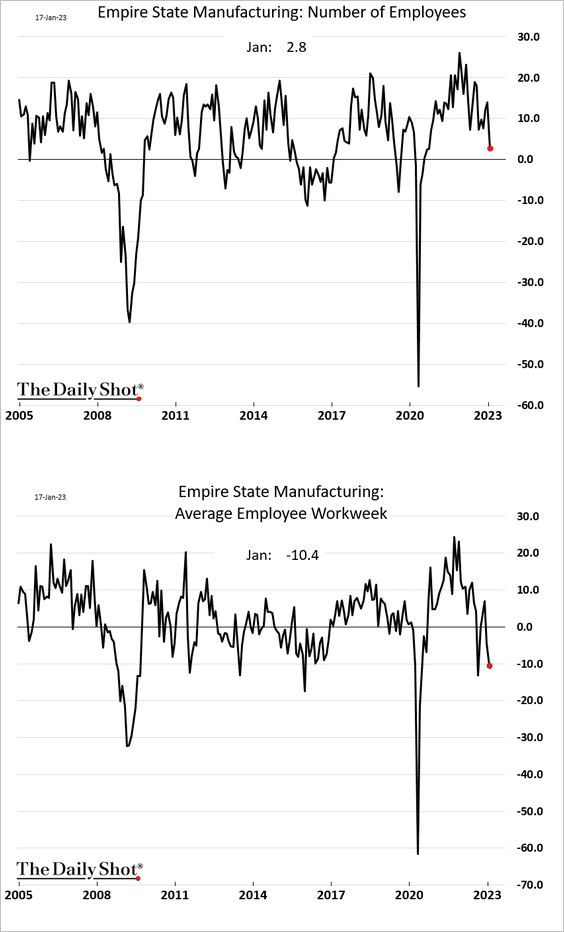
• Price pressures continue to ease.
——————–
2. Next, we have some updates on the labor market and wages.
• Construction jobs will take a hit this year.
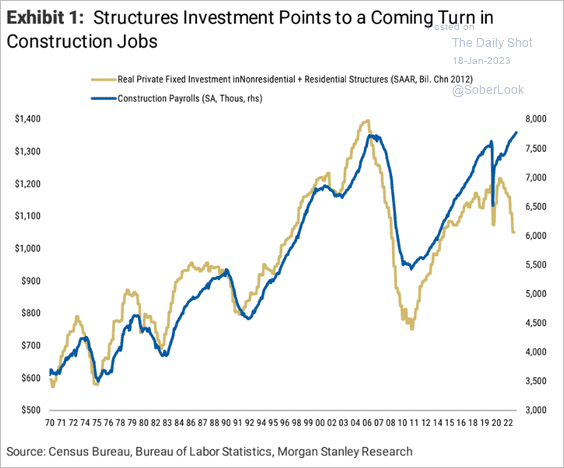 Source: Morgan Stanley Research
• How much will the unemployment rate climb in 2023?
– This chart shows MarketDesk’s unemployment indicator.
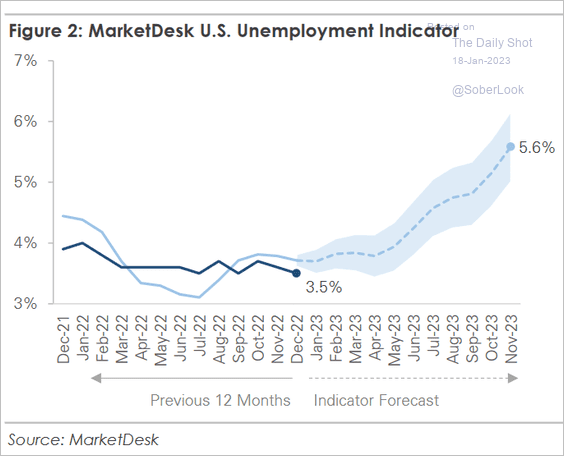 Source: MarketDesk Research
– And here is a forecast from Wells Fargo.
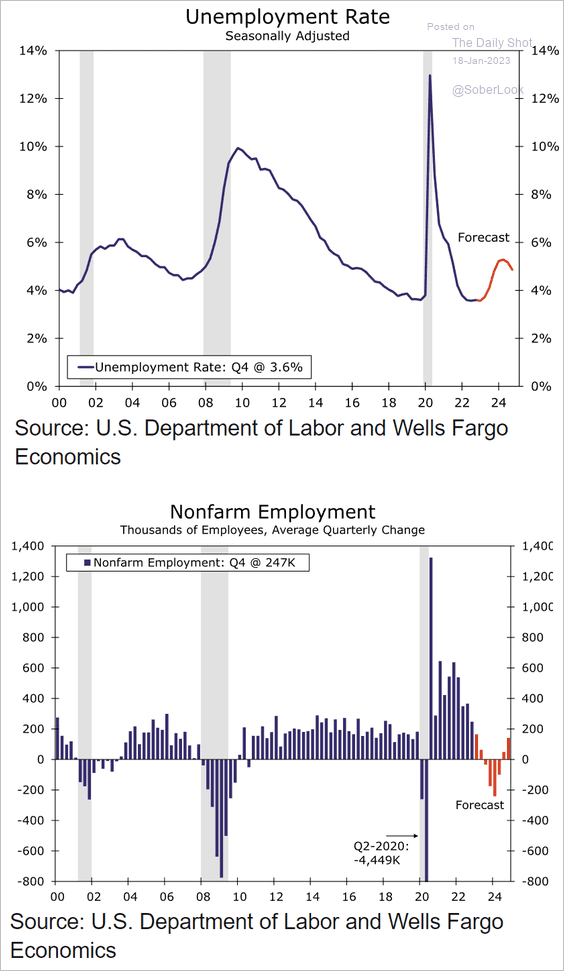 Source: Wells Fargo Securities
• Layoffs are on the rise but still below pre-COVID levels.
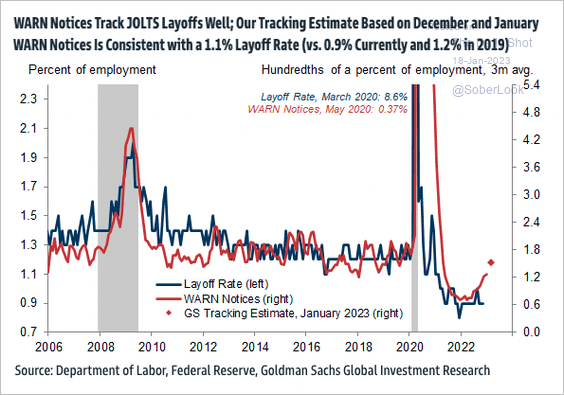 Source: Goldman Sachs; @tracyalloway
Below is Bloomberg’s count of corporate transcripts mentioning “job cuts” (by sector).
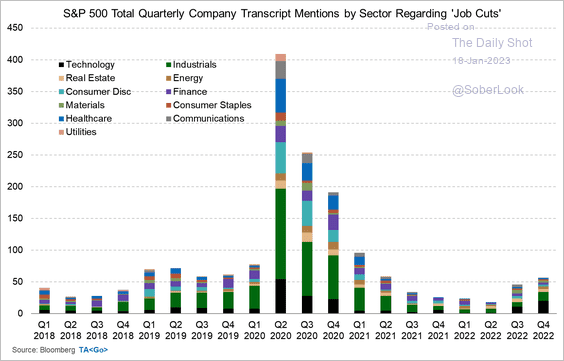 Source: @M_McDonough
• Wage growth has peaked but remains elevated, according to the Atlanta Fed’s wage tracker.
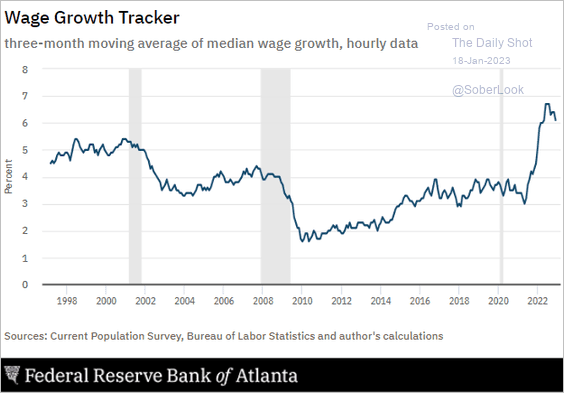 Source: Federal Reserve Bank of Atlanta
– With fewer small businesses complaining about finding workers, wage growth should moderate further.
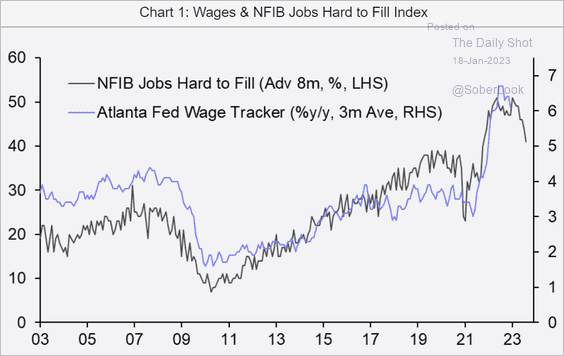 Source: Capital Economics
– Pay growth is slowing faster among low-wage workers.
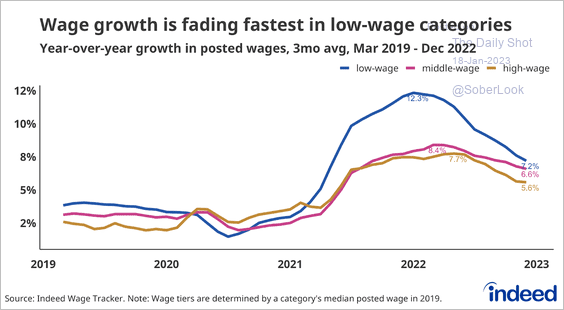 Source: @indeed_labs
– The wage growth gap between job stayers and job switchers still signals an imbalance in the labor market (companies willing to pay a significant premium to attract workers).
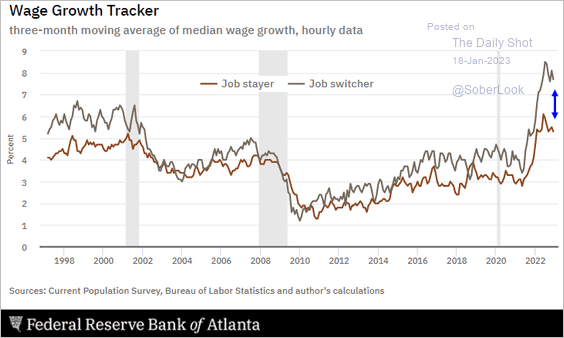 Source: Federal Reserve Bank of Atlanta
——————–
3. The market is betting that the Fed will blink before reaching 5% on the fed funds rate.
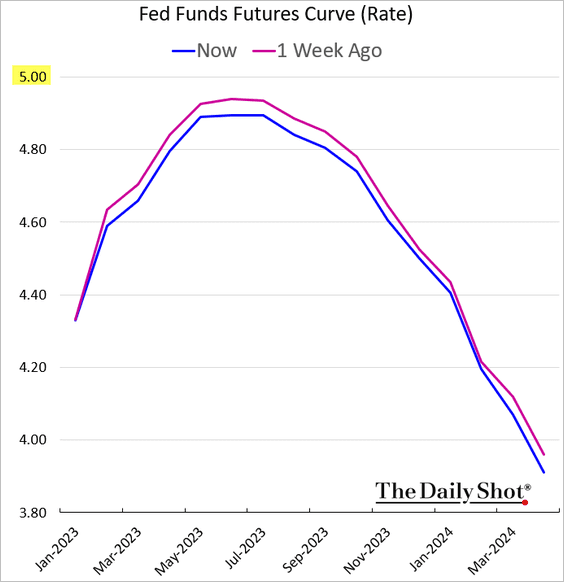
• Investors now see monetary policy as too restrictive.
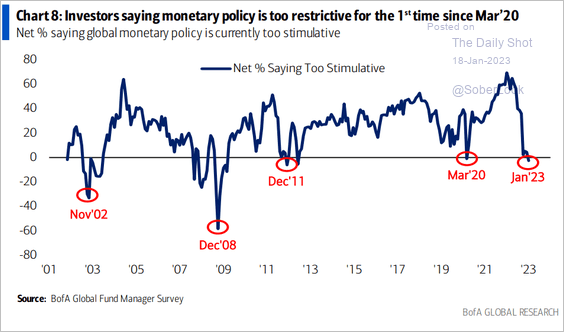 Source: BofA Global Research
• This chart shows the divergence between the Fed’s dot plot and the market.
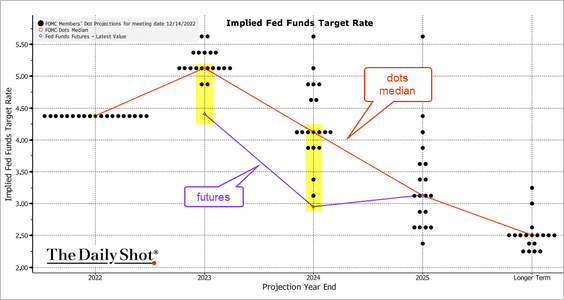 Source: @TheTerminal, Bloomberg Finance L.P.
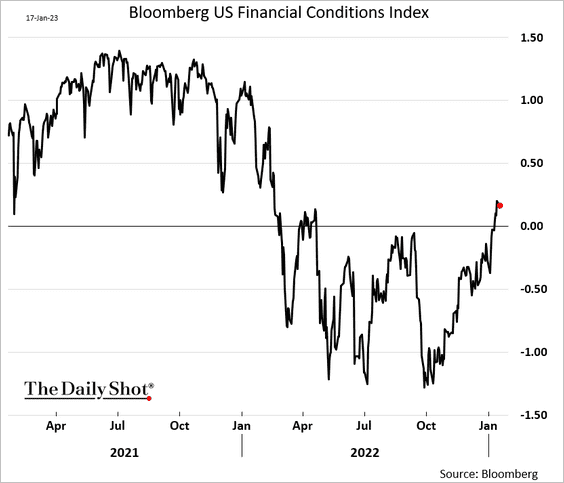
• Financial conditions continue to ease, frustrating Fed officials.
Back to Index
Canada
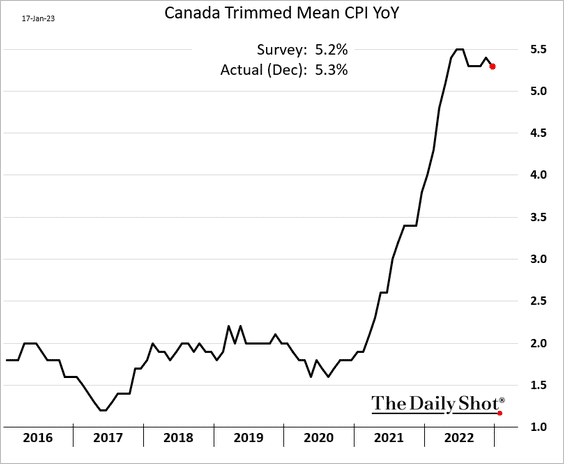
1. Inflation continues to moderate.
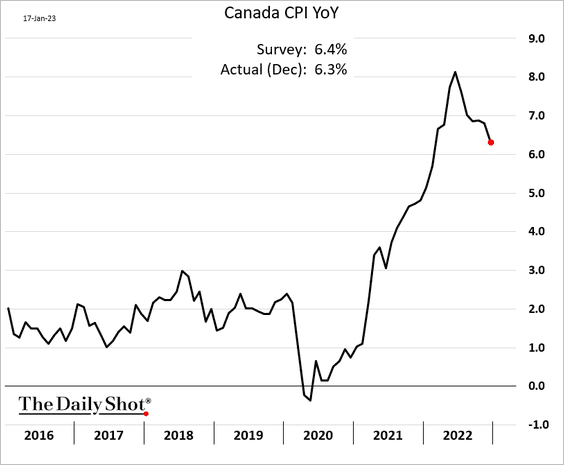
 Source: Reuters Read full article
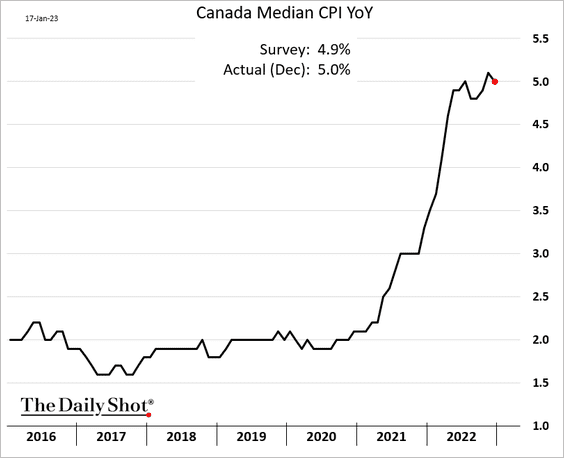
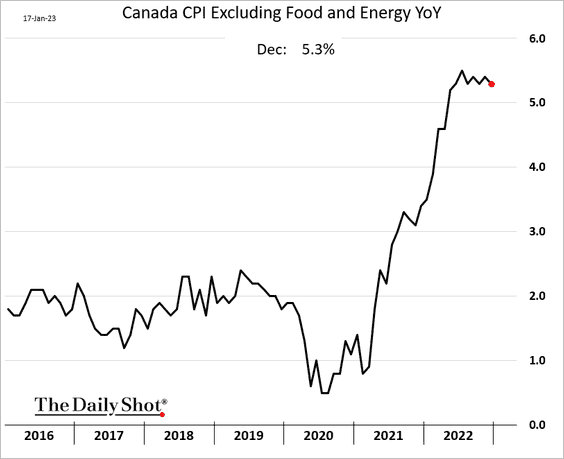
But core inflation remains stubbornly high.
• Trimmed-mean:
• Median:
• Excluding food and energy:
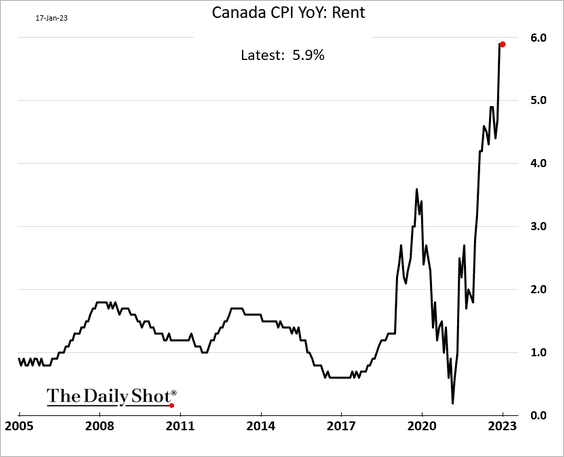
The rise in rent inflation has been severe.
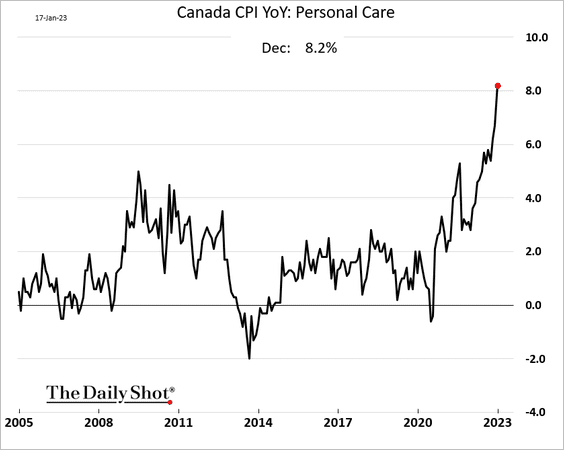
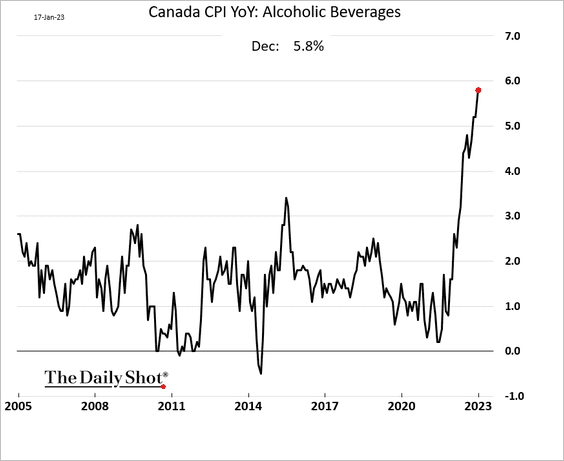
Here are a couple of other CPI components.
• Personal care CPI:
• Alcohol:
——————–
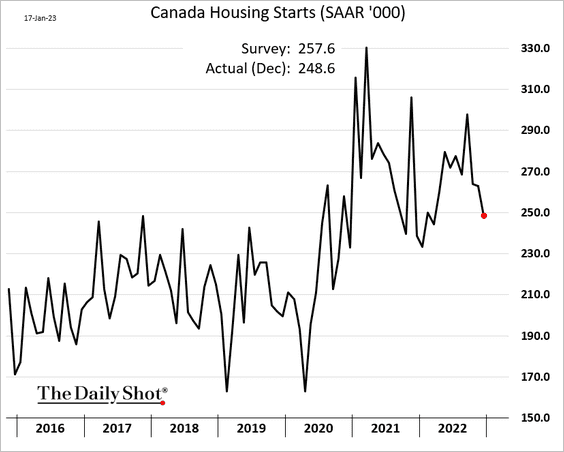
2. Housing starts slowed in December.
3. Home prices will stabilize later this year.
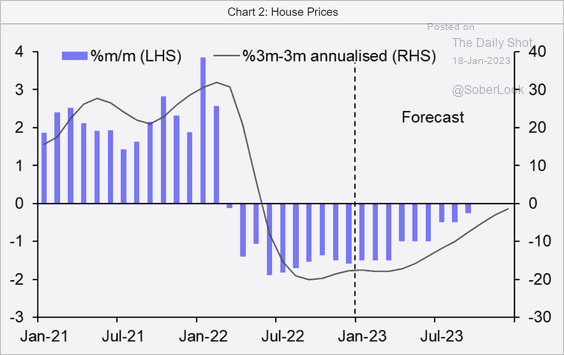 Source: Capital Economics
Back to Index
The United Kingdom
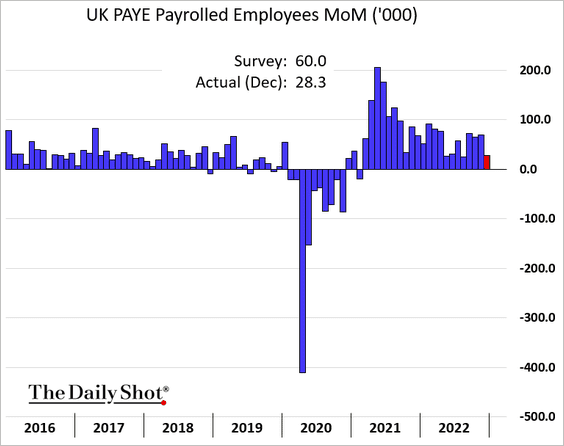
1. Payroll gains in December were smaller than expected.
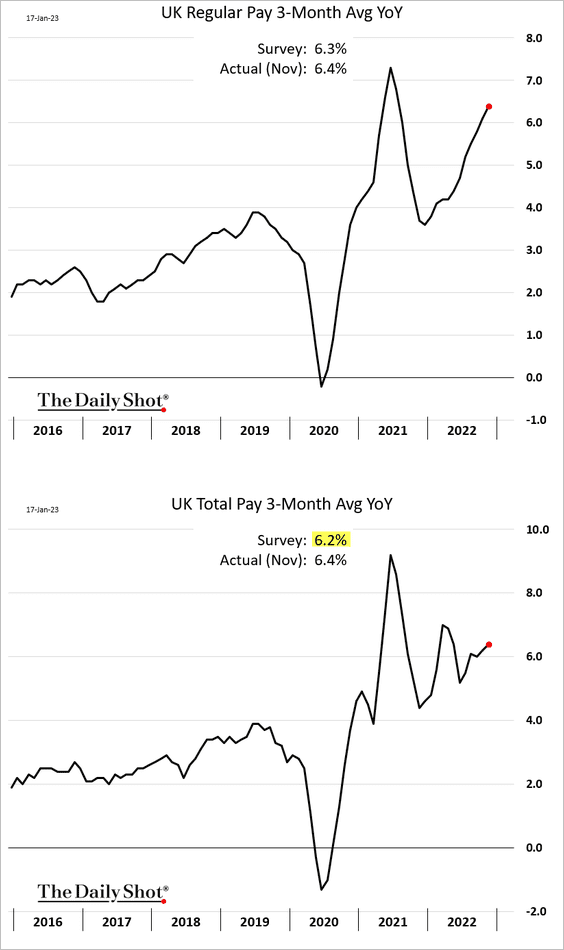
• Wages continue to surge.
 Source: Reuters Read full article
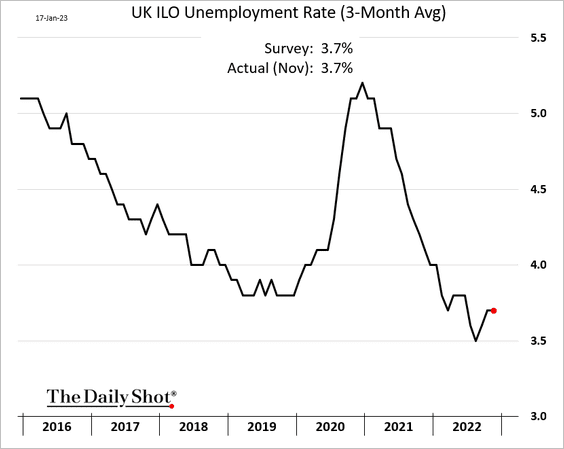
• The unemployment rate remains low.
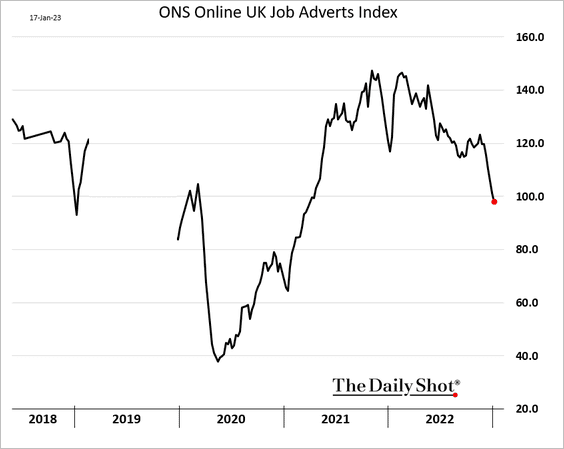
• Just like in the US, job openings have peaked but remain well above pre-COVID levels.
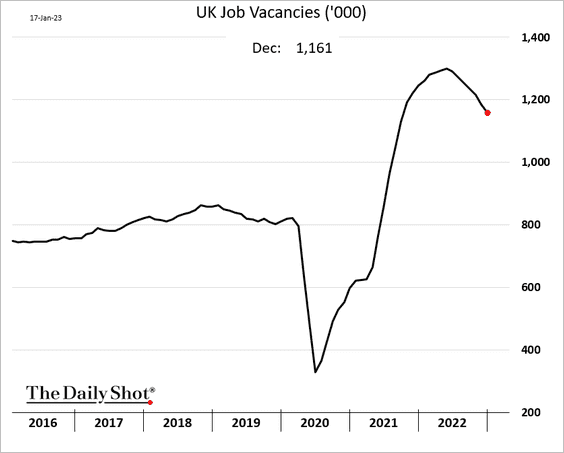
Online job ads have been falling.
• Layoffs are edging up but are still quite low.
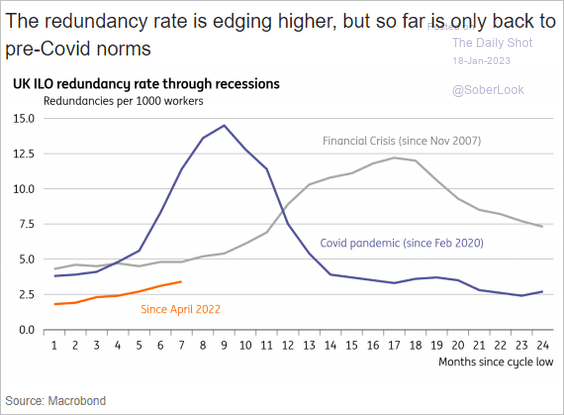 Source: ING
• Inactivity remains elevated.
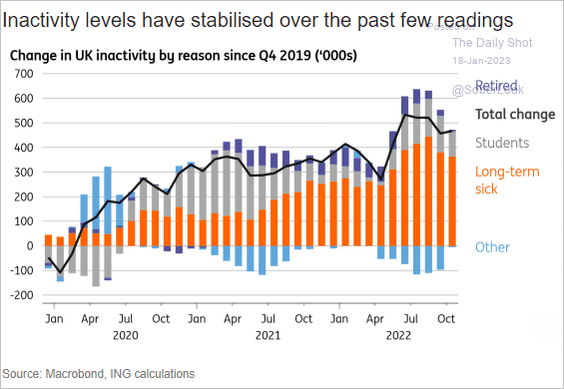 Source: ING
——————–
2. UK business investment has been lagging behind global peers.
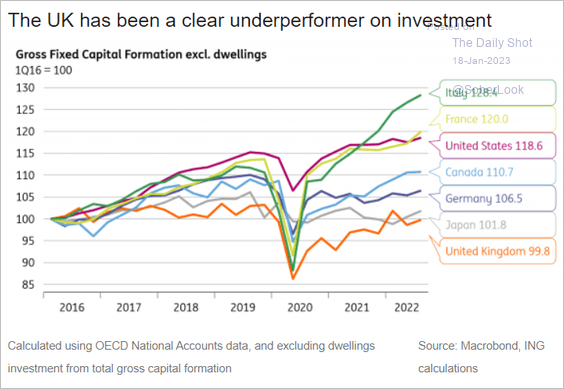 Source: ING
Back to Index
The Eurozone
1. Germany’s economic sentiment is rebounding rapidly (2nd panel).
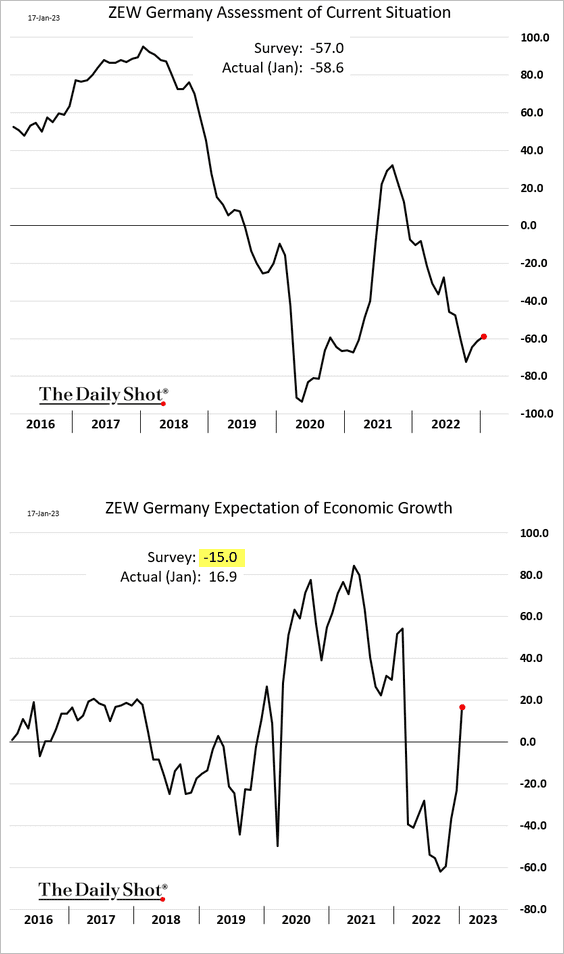
 Source: Reuters Read full article
2. Germany’s real estate finance sentiment has deteriorated.
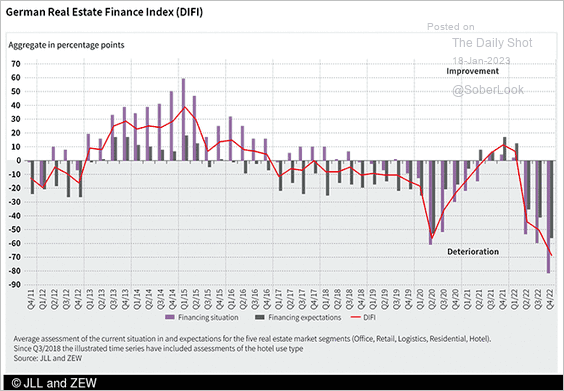 Source: ZEW
But European real estate shares have been outperforming.
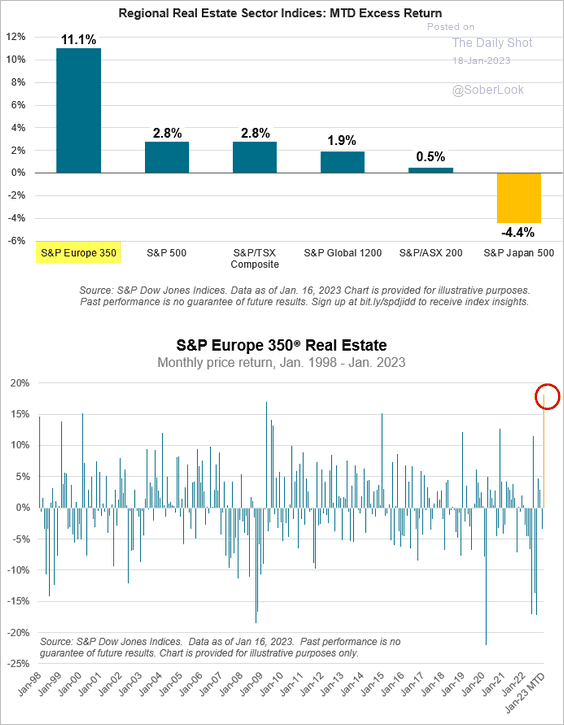 Source: S&P Dow Jones Indices
This chart shows the divergence between home prices and rents in the EU.
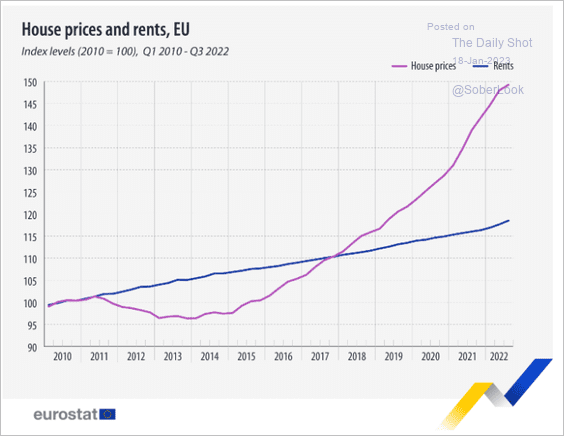 Source: Eurostat Read full article
——————–
3. France and Spain are less reliant on natural gas than Germany and Italy.
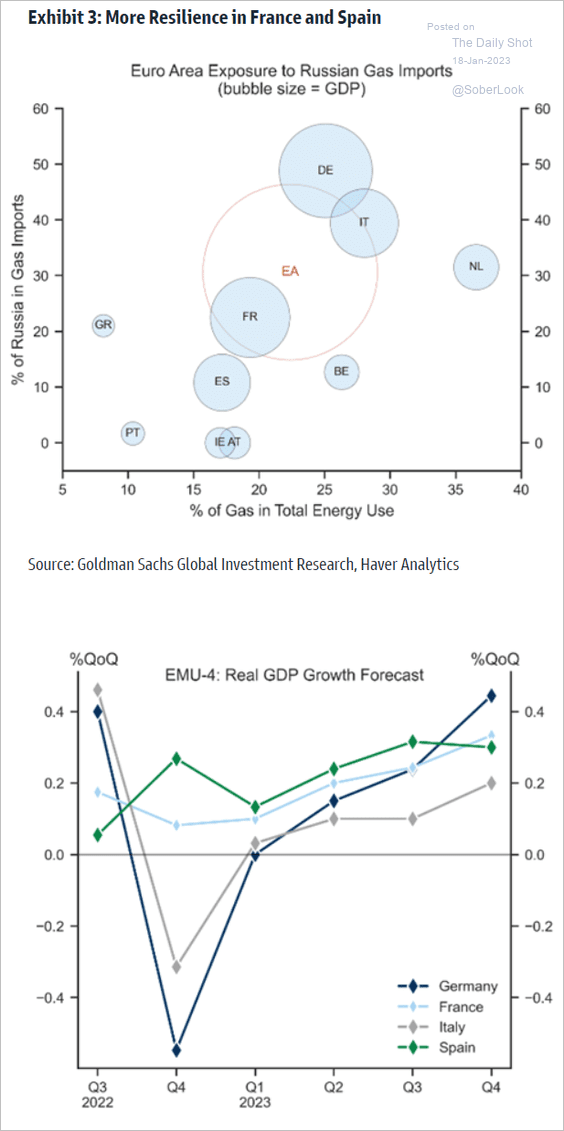 Source: Goldman Sachs
4. Here is Goldman’s wage growth tracker.
![]() Source: Goldman Sachs
Source: Goldman Sachs
5. Euro-area corporate earnings have been resilient over the past year.
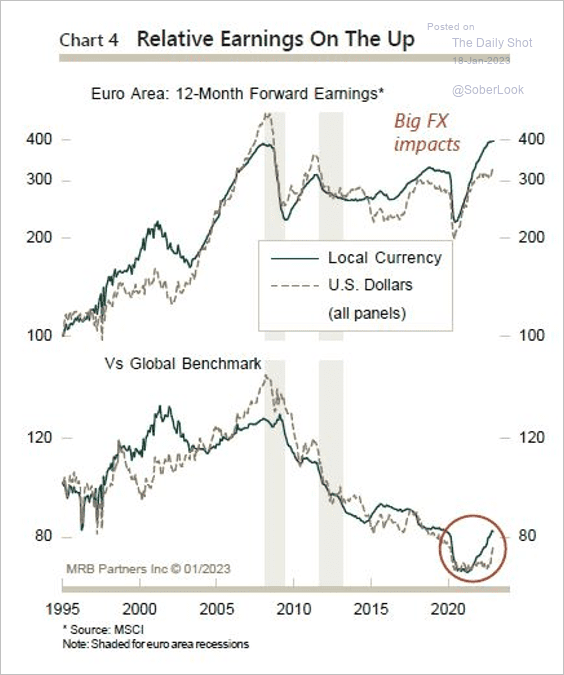 Source: MRB Partners
Investors are turning bullish on Eurozone stocks.
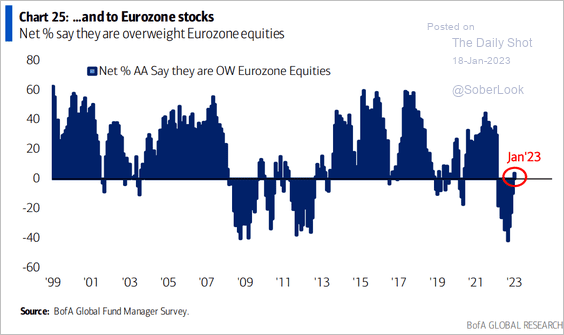 Source: BofA Global Research
——————–
6. Credit standards have been tightening.
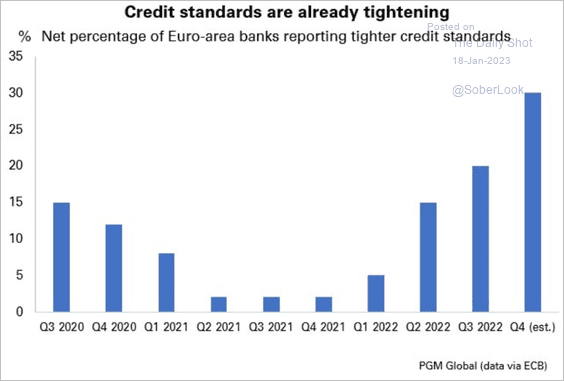 Source: PGM Global
Back to Index
Japan
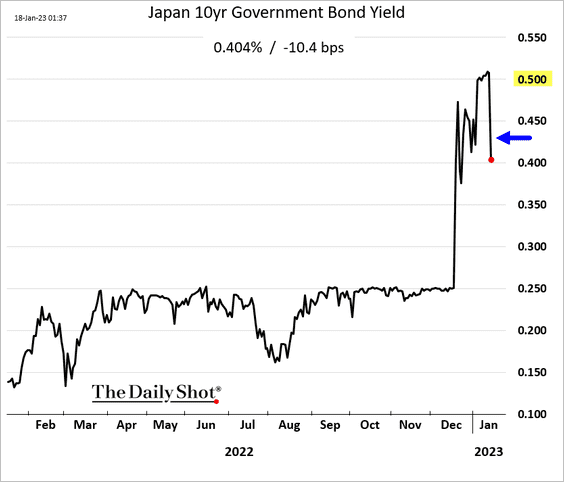
1. The BoJ is not budging on yield control.
 Source: Reuters Read full article
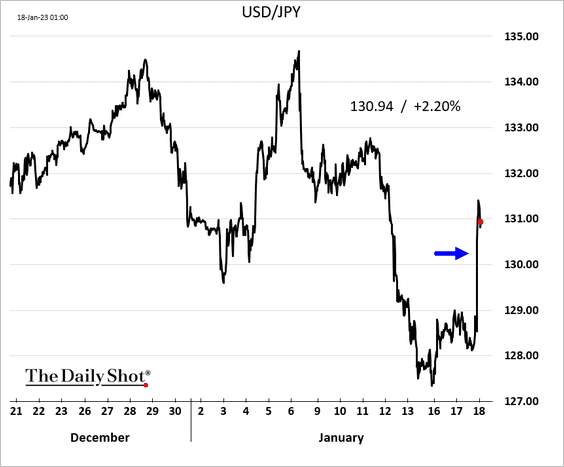
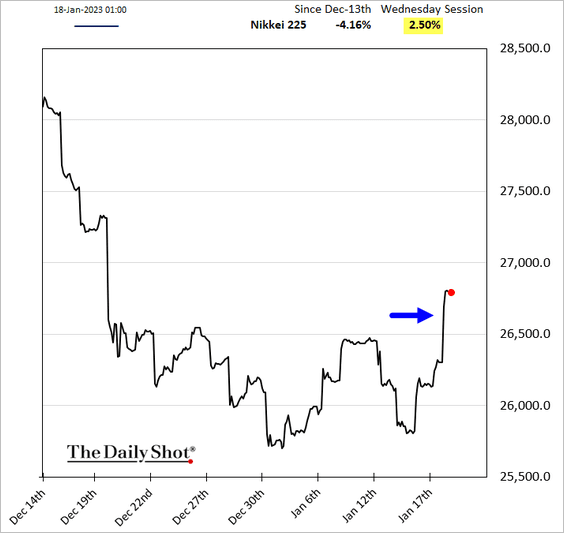
Here is the market reaction.
• The 10yr JGB:
• Dollar-yen (chart shows USD gaining against the yen):
• Stocks:
——————–
2. Is long yen a crowded trade now?
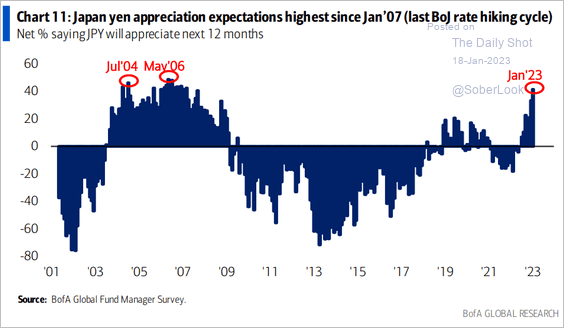 Source: BofA Global Research
3. Machinery orders unexpectedly declined on a year-over-year basis.
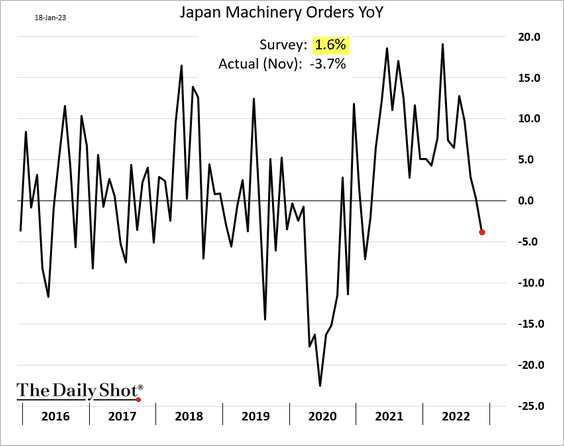
 Source: Reuters Read full article
Back to Index
Asia – Pacific
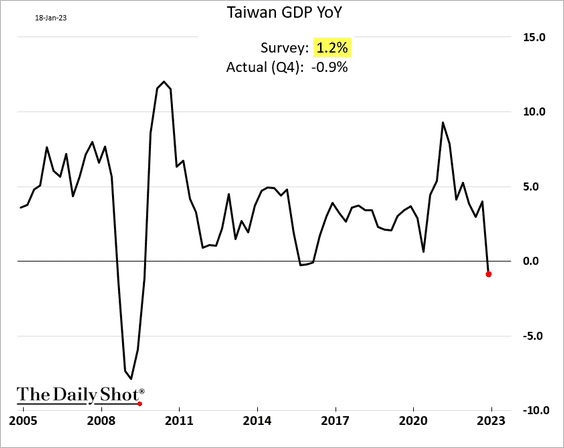
1. Taiwan’s GDP surprised to the downside(an unexpected year-over-year decline).
2. Singapore’s exports tumbled over 20% last year.
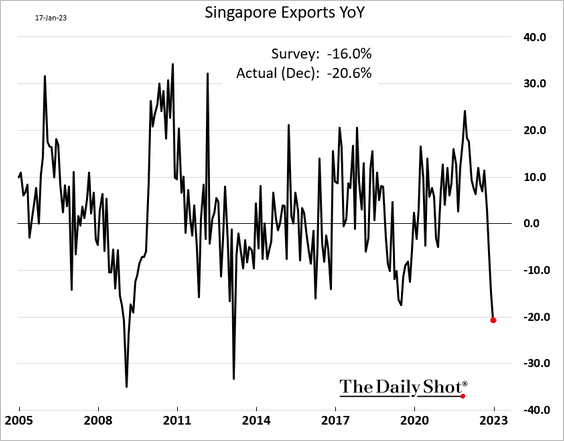
 Source: @economics Read full article
——————–
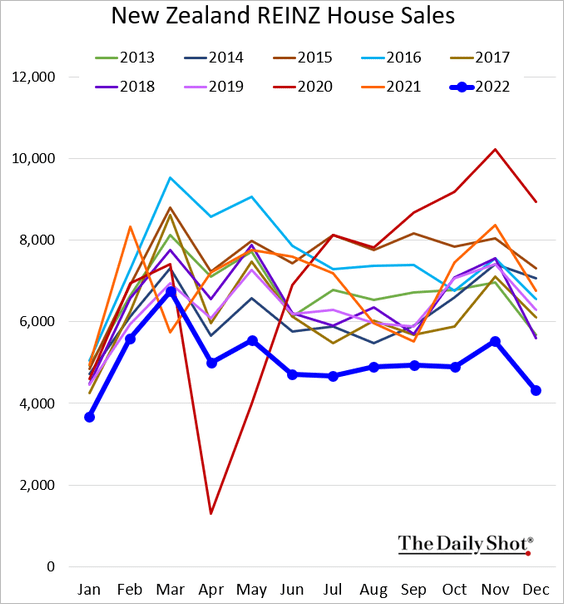
3. New Zealand’s home sales remain depressed.
Back to Index
China
1. Mobility indicators are rebounding.
• Traffic congestion:
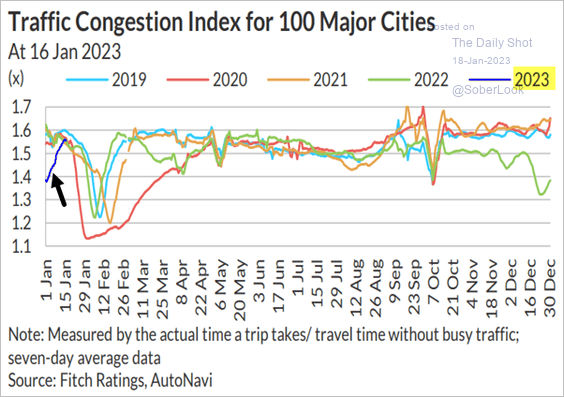 Source: Fitch Ratings
• Subway passenger numbers:
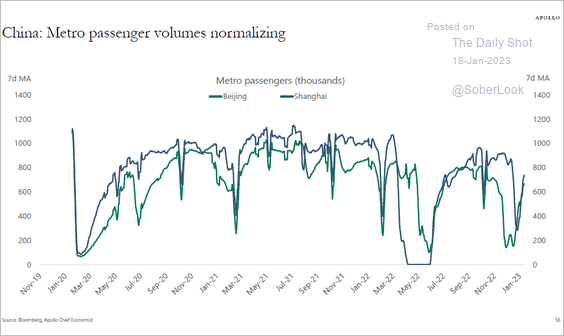 Source: Torsten Slok, Apollo
——————–
2. China’s population declined for the first time in decades.
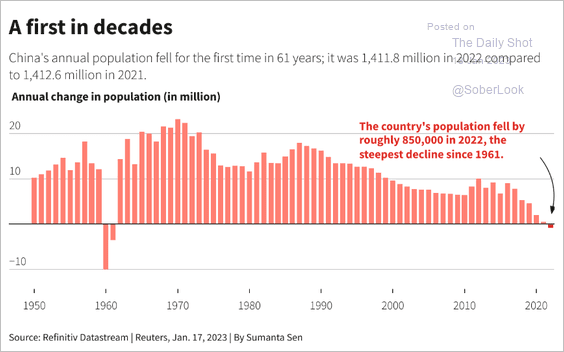 Source: Reuters Read full article
• China’s birth rate hit a record low.
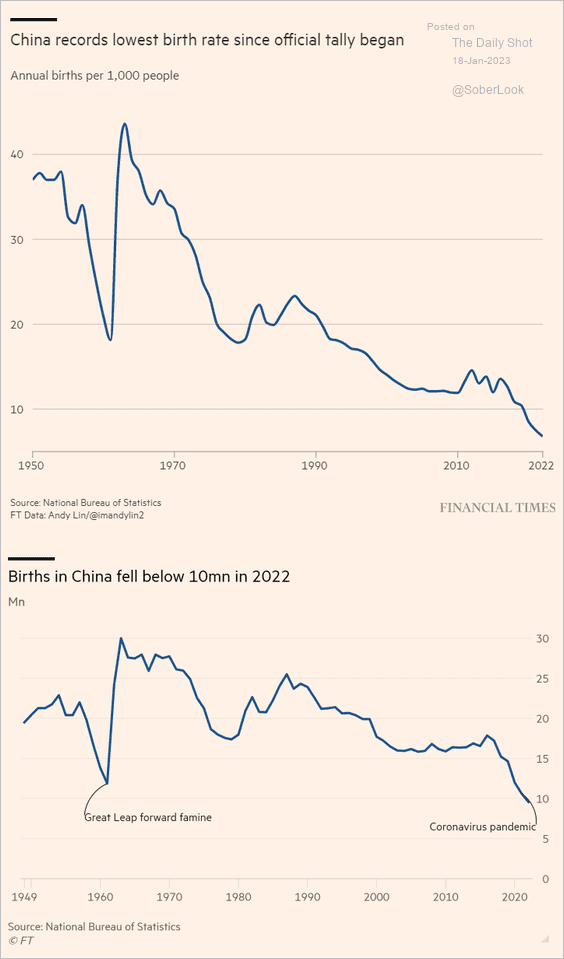 Source: @financialtimes Read full article
Here is a comparison to India.
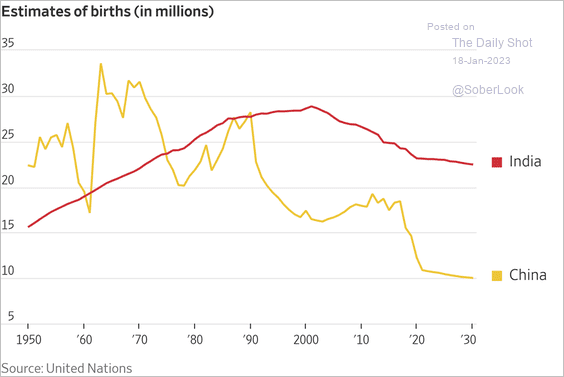 Source: @WSJ Read full article
And this chart compares China’s birth rates to other economies.
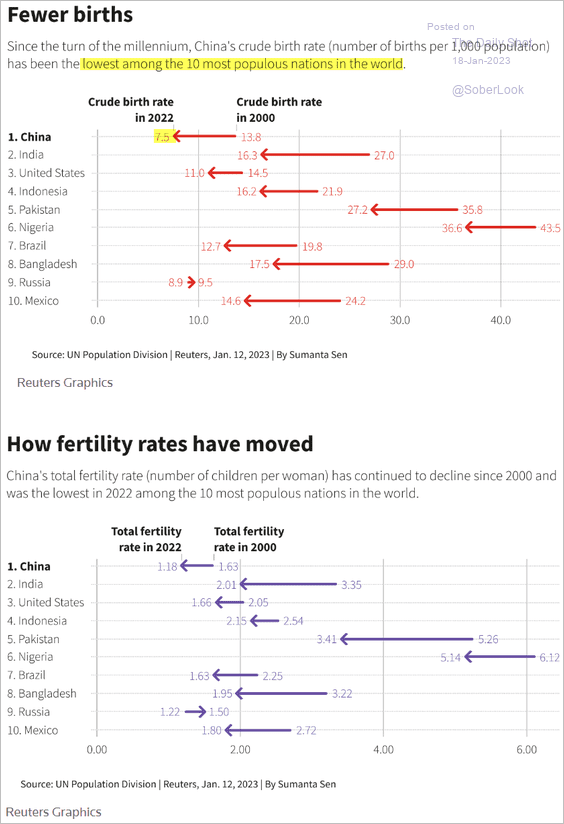 Source: Reuters Read full article
• Deaths are outnumbering births.
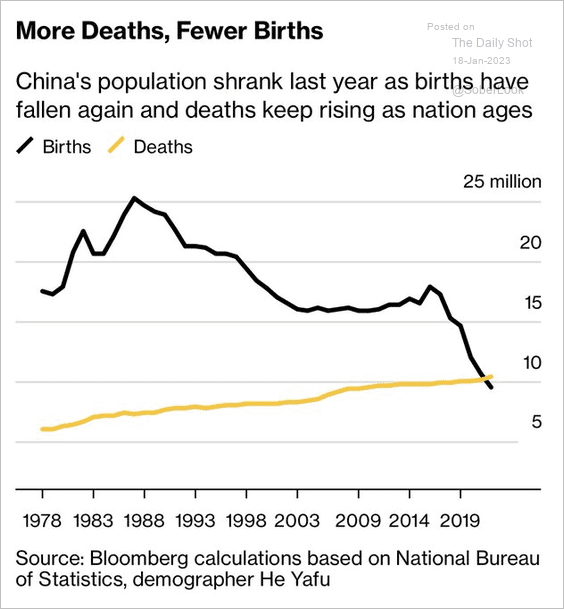 Source: @jessefelder, @bpolitics Read full article
• Urbanisation has been slowing.
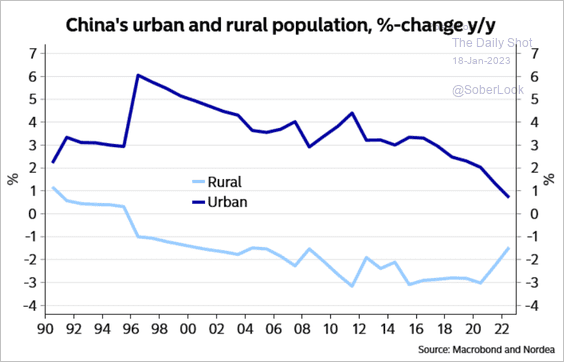 Source: Nordea Markets
• Next, we have China’s and India’s population pyramids.
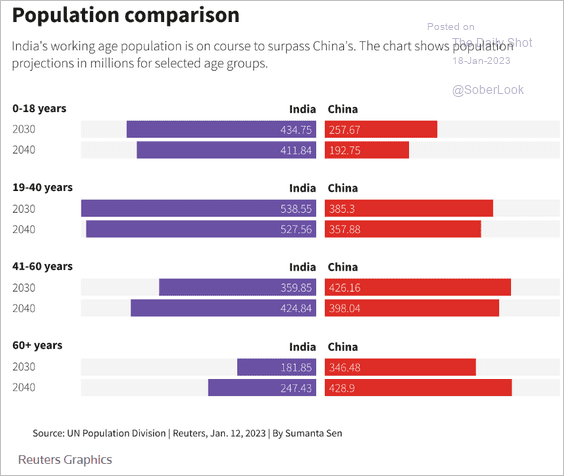 Source: Reuters Read full article
Back to Index
Emerging Markets
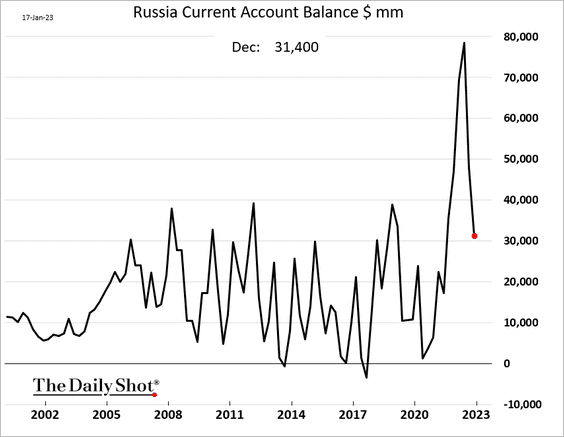
1. Russia’s current account is coming off the highs.
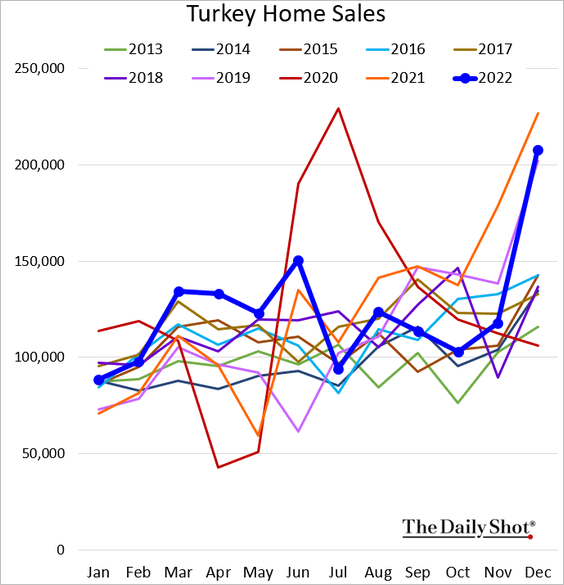
2. Turkey’s home sales remain elevated.
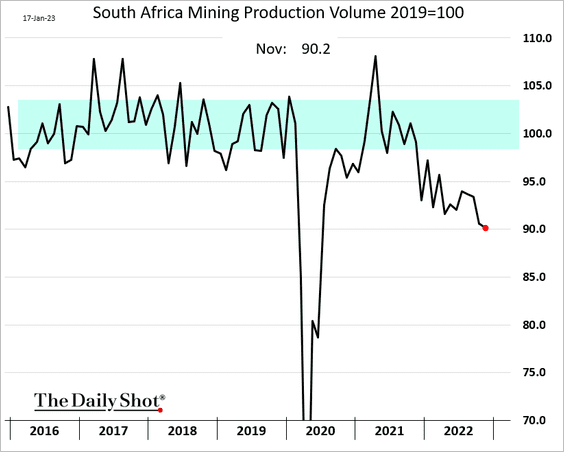
3. South Africa’s mining output continues to deteriorate.
 Source: Reuters Read full article
——————–
4. Commodity-sensitive countries appear overbought relative to broader EM equities.
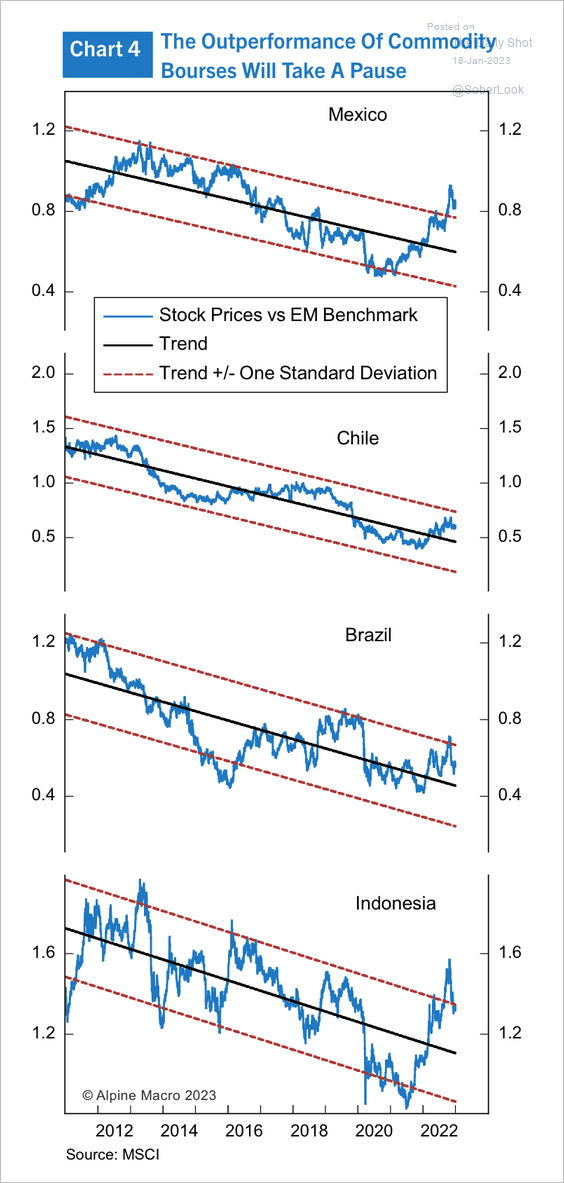 Source: Alpine Macro
The same is true for India and Taiwan.
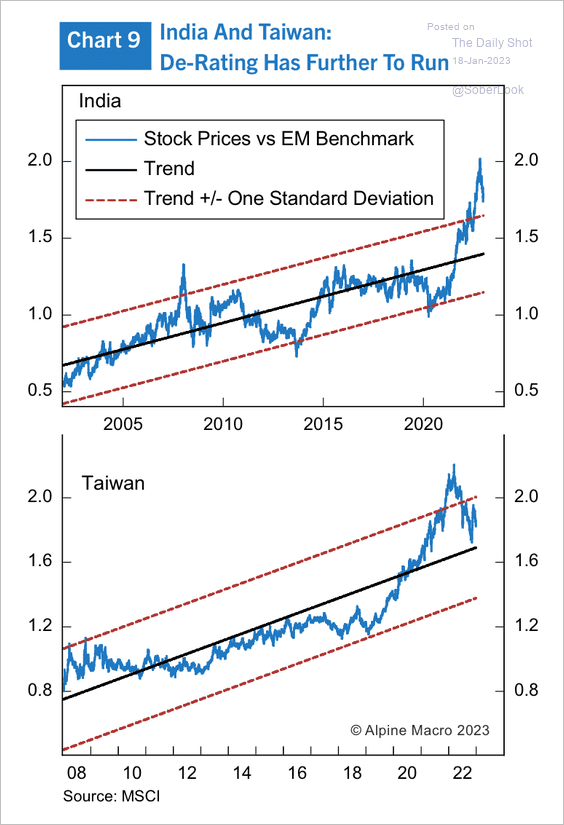 Source: Alpine Macro
——————–
5. Many EM equity markets appear relatively inexpensive.
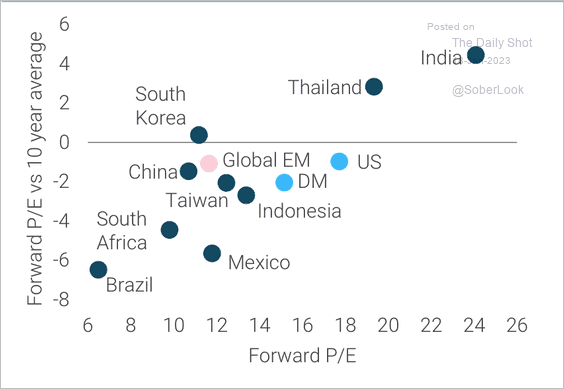 Source: TS Lombard
Back to Index
Cryptocurrency
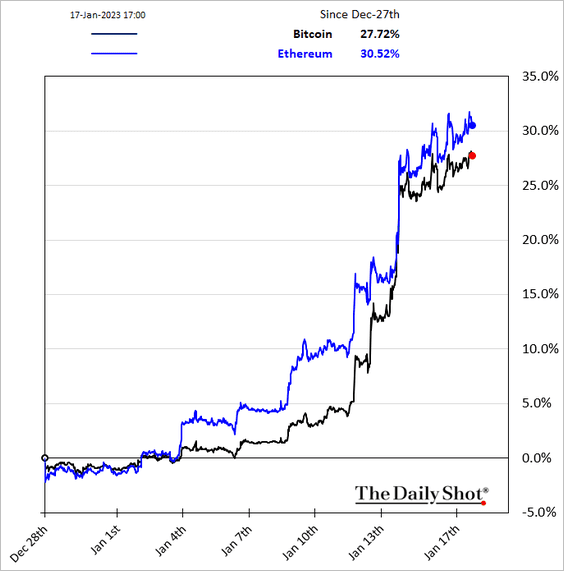
1. Bitcoin blasted past $21k.
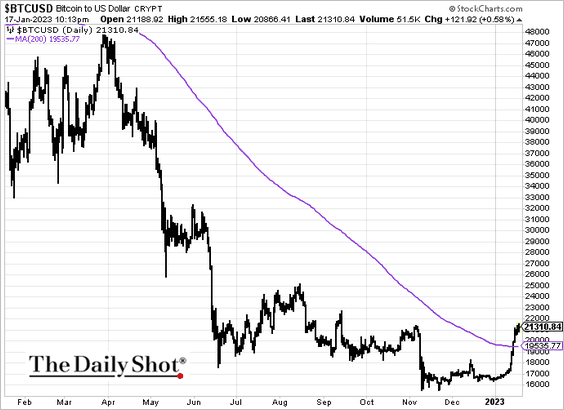
Have investors been too bearish on bitcoin?
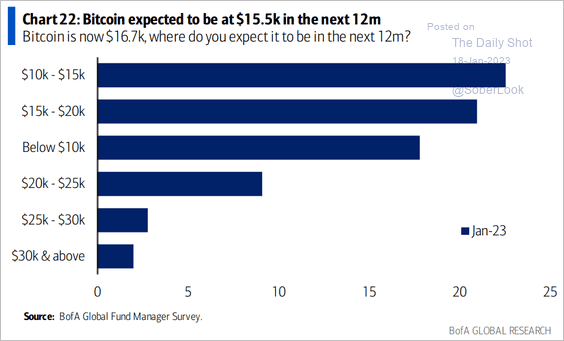 Source: BofA Global Research
——————–
2. Bitcoin appears significantly undervalued based on its market value to realized value (MVRV).
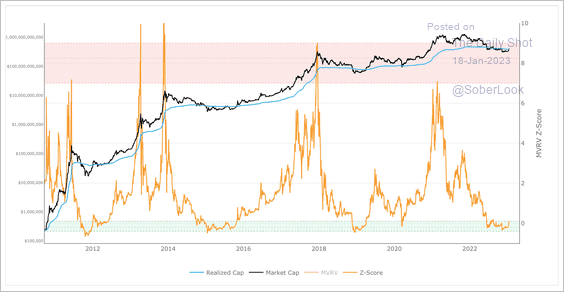 Source: LookIntoBitcoin
3. Crypto funds saw minor inflows last week, led by long bitcoin and ether products.
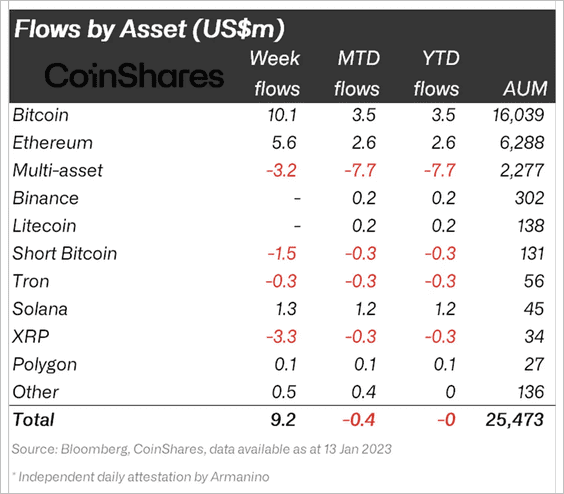 Source: CoinShares Read full article
Canadian-based crypto funds led inflows last week.
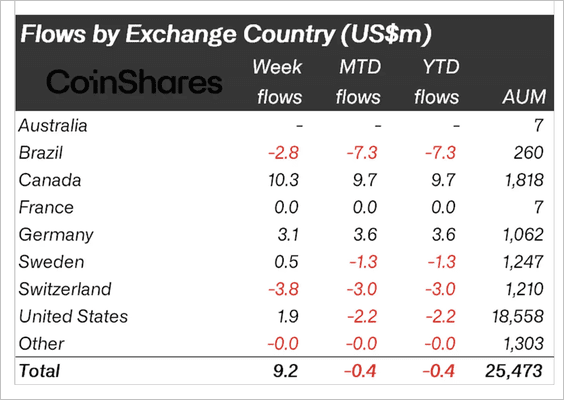 Source: CoinShares Read full article
——————–
4. Asset tokenization is expected to accelerate.
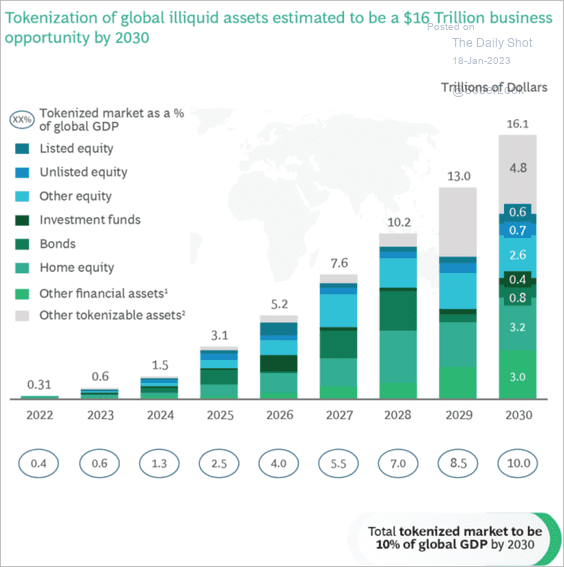 Source: @FactSet Read full article
Back to Index
Commodities
The rally in gold has been too fast relative to the dollar’s decline.
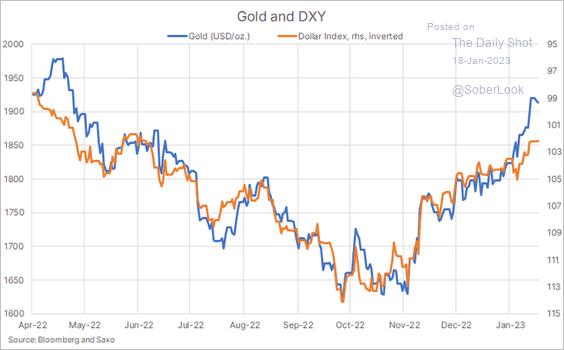 Source: @Ole_S_Hansen
Back to Index
Equities
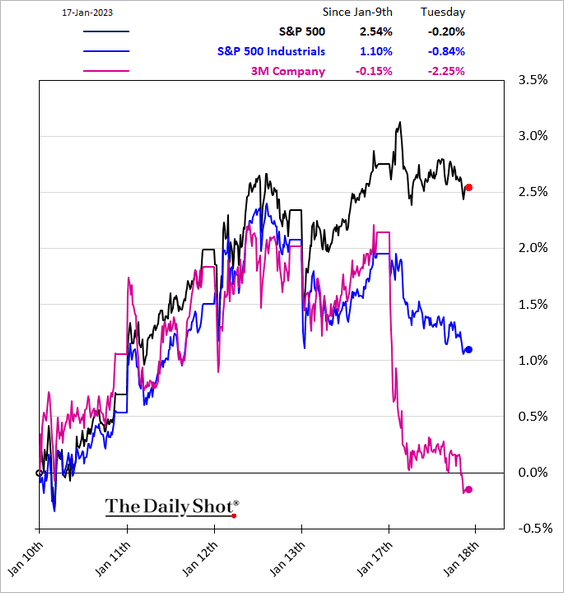
1. Financials dragged the Dow lower on Tuesday.
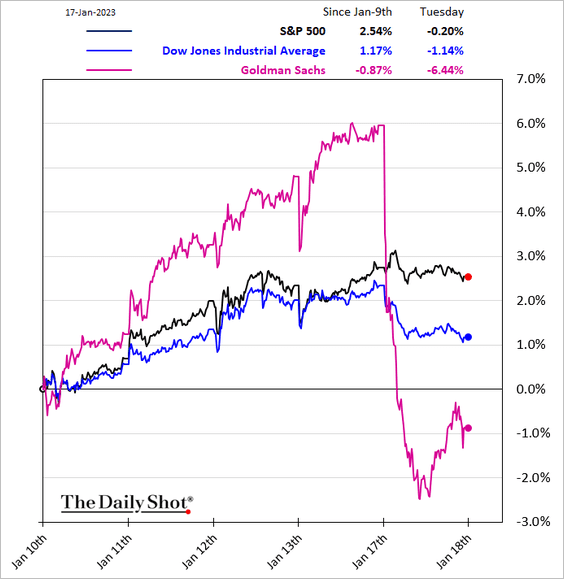
Industrials also underperformed.
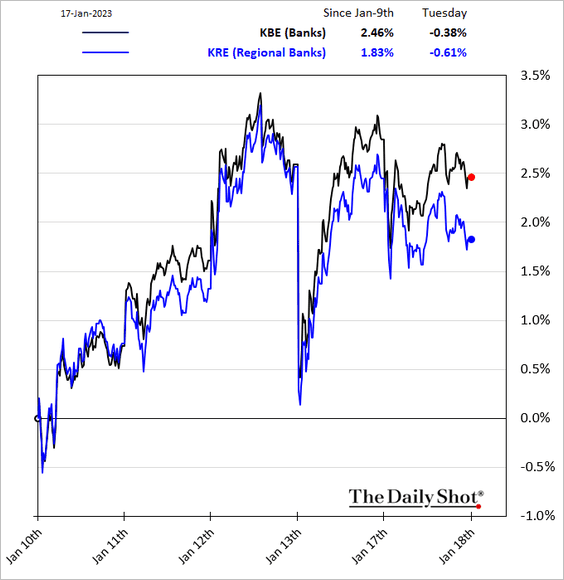
2. Regional banks are lagging behind the broad banking index.
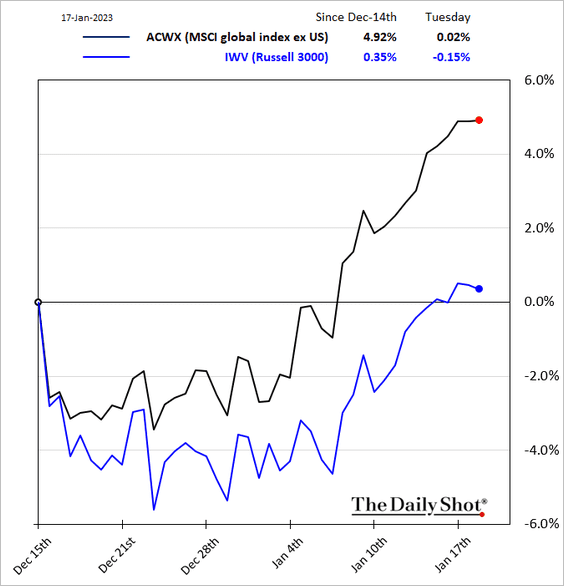
3. Global investors are underweight US shares (2 charts), …
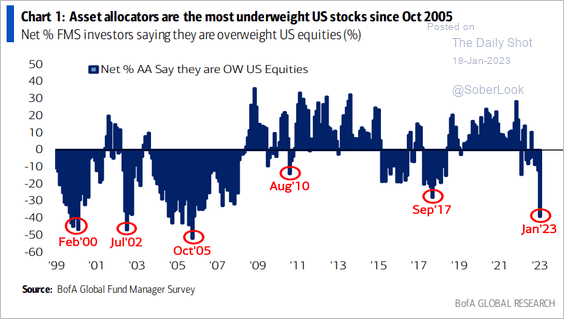 Source: BofA Global Research
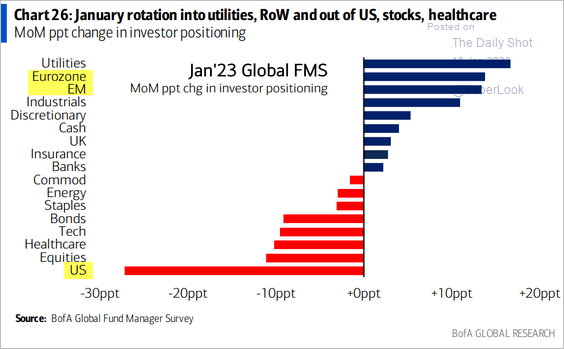 Source: BofA Global Research
… as US stocks continue to lag.
——————–
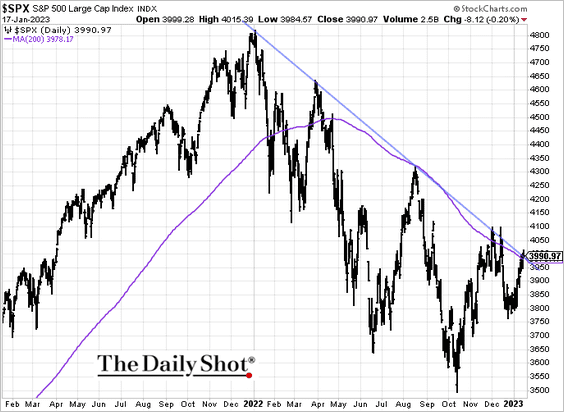
4. The S&P 500 is going to make another run at the downtrend resistance.
5. Equal-weighted indices continue to outperform (2 charts), …
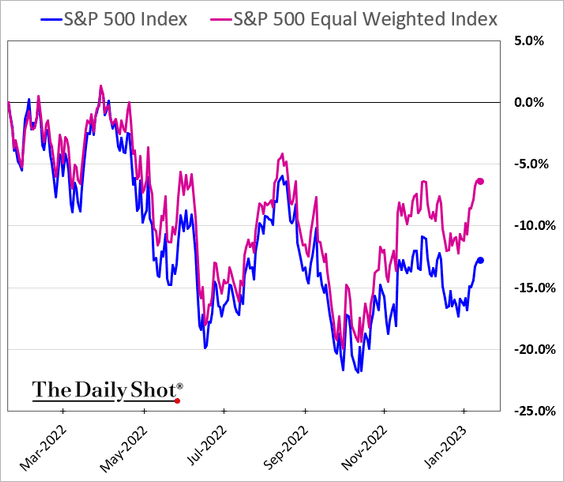
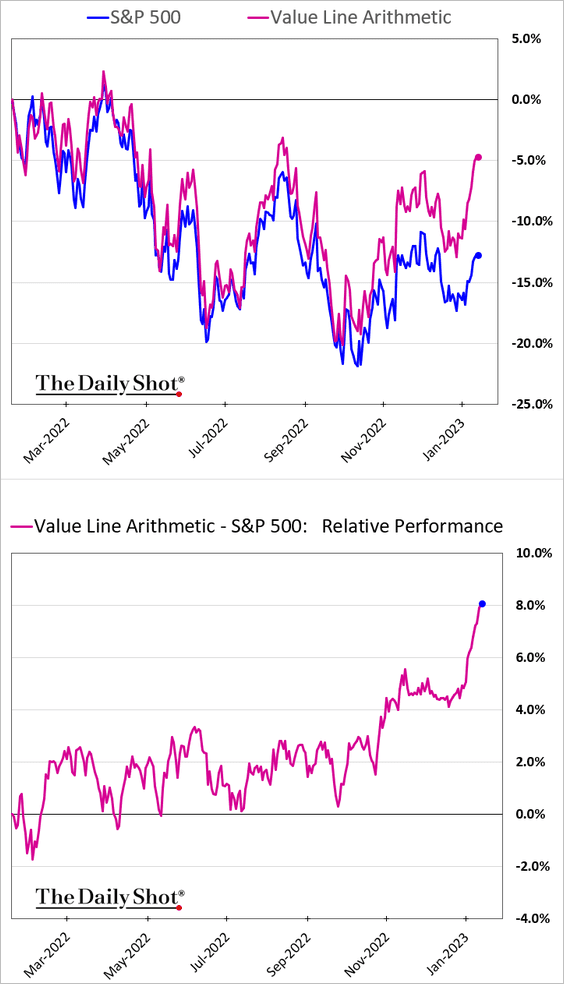
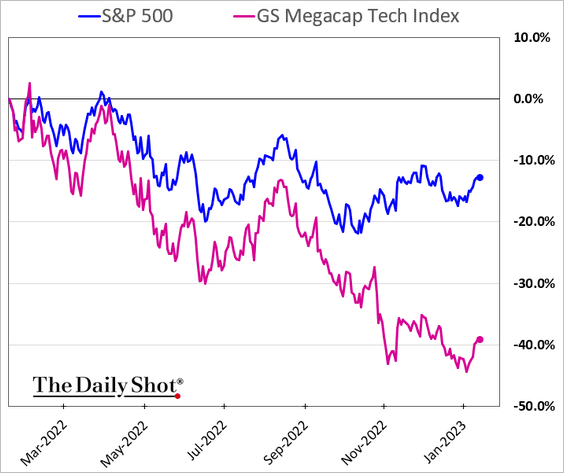
… as mega-caps lag.
——————–
6. Which factors are having a negative impact on earnings?
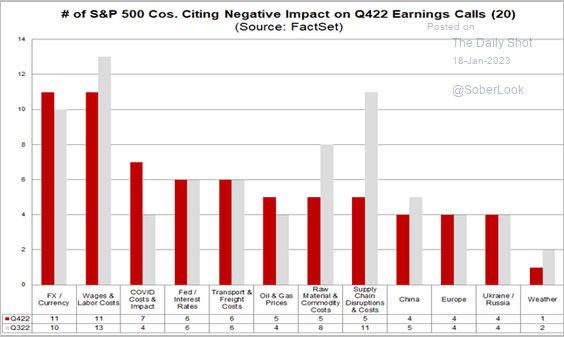 Source: @FactSet Read full article
7. Historically, a trough in the ISM survey has occurred around market bottoms.
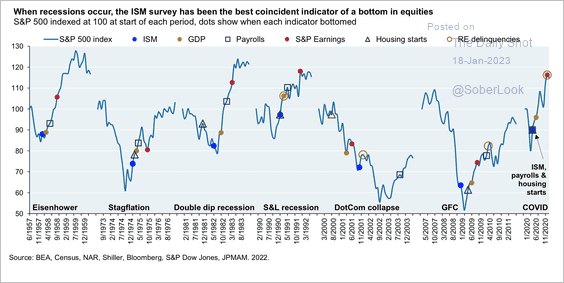 Source: J.P. Morgan Asset Management
8. Options with less than 24 hours to expiration now dominate the market.
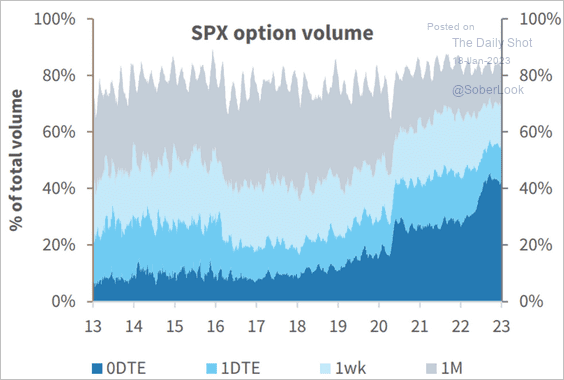 Source: @parrmenidies
Back to Index
Credit
High-yield bonds have been rallying with stocks.
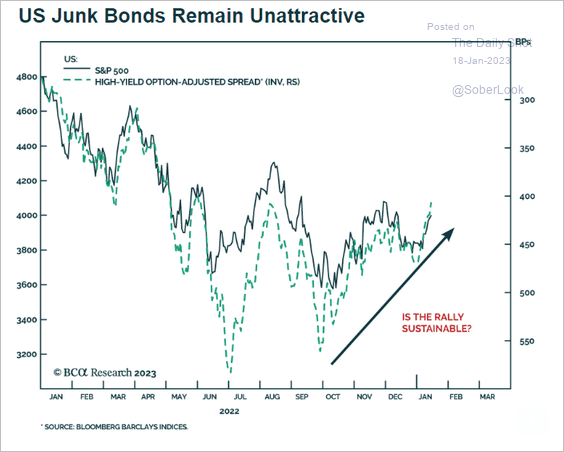 Source: BCA Research
Back to Index
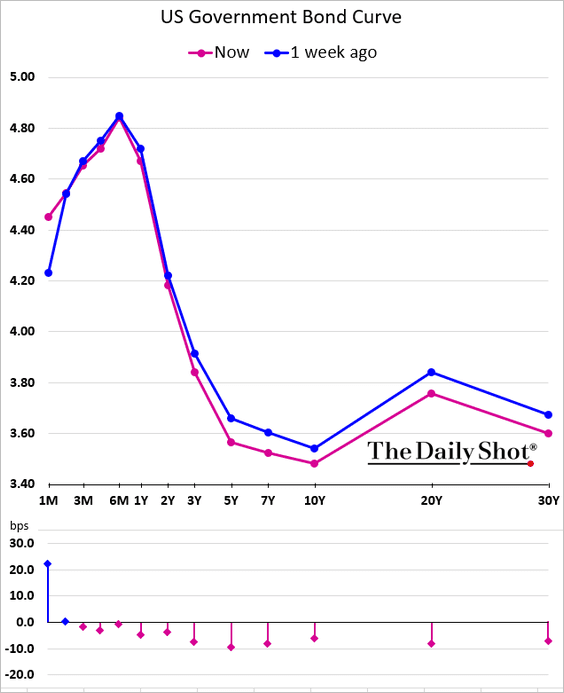
Rates
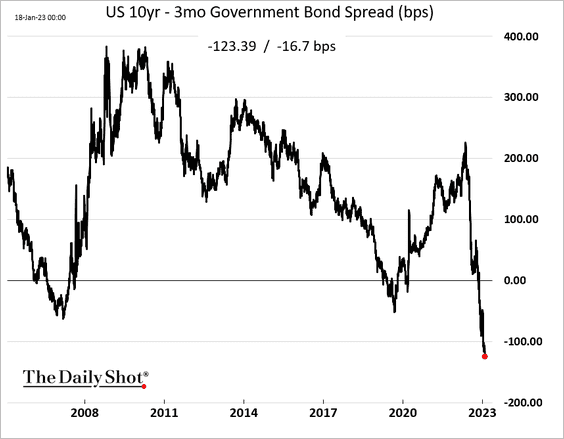
1. The Treasury curve continues to move deeper into inversion territory.
Here is the 10-year/3-month spread.
——————–
2. Long-dated inflation expectations are now roughly in line with the Fed’s target.
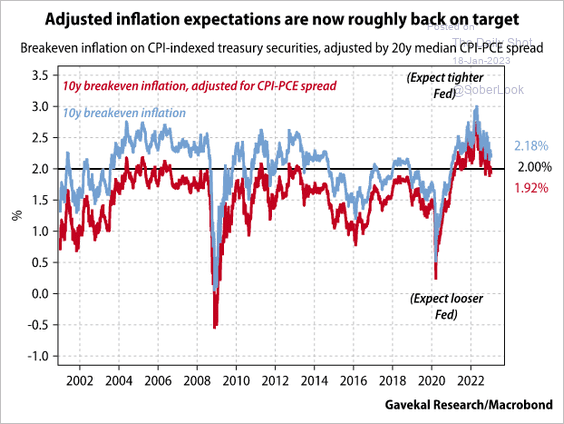 Source: Gavekal Research
This chart shows the change in breakevens’ (inflation expectations) term structure over the past six months).
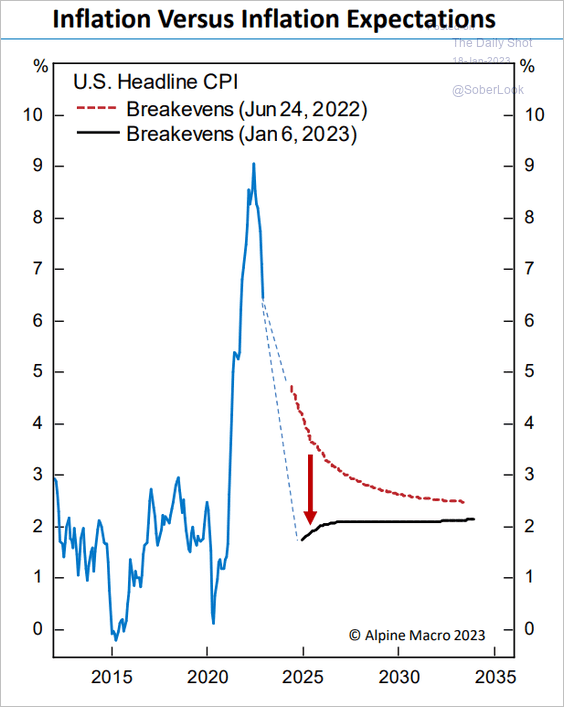 Source: Alpine Macro
——————–
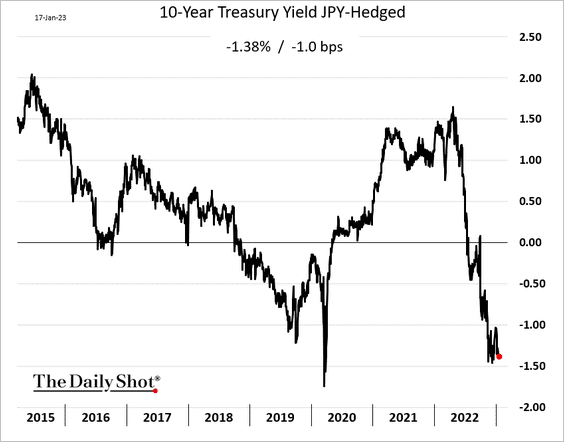
3. Treasuries remain unattractive for Japanese investors.
4. Stabilization in the US terminal rate expectations resulted in rates volatility peaking (MOVE).
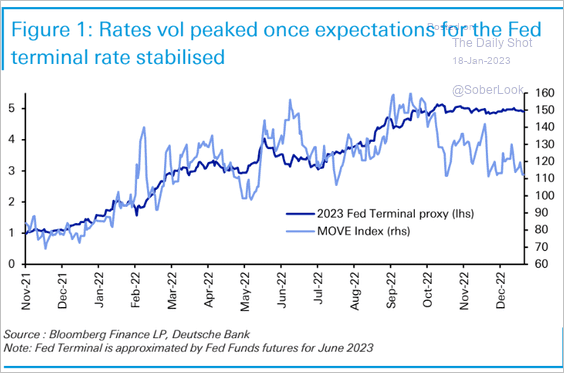 Source: Deutsche Bank Research
Back to Index
Global Developments
1. Global risk assets rebounded after a peak in rates vol (MOVE) in October 2022.
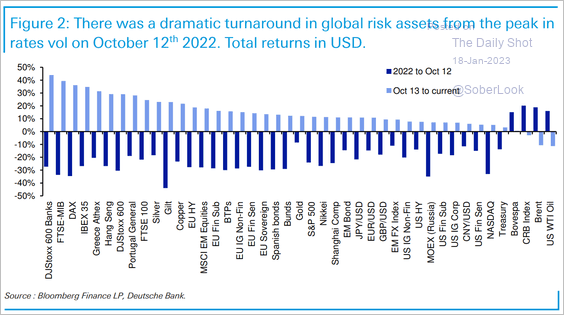 Source: Deutsche Bank Research
2. Next, we have some home price indices and valuations.
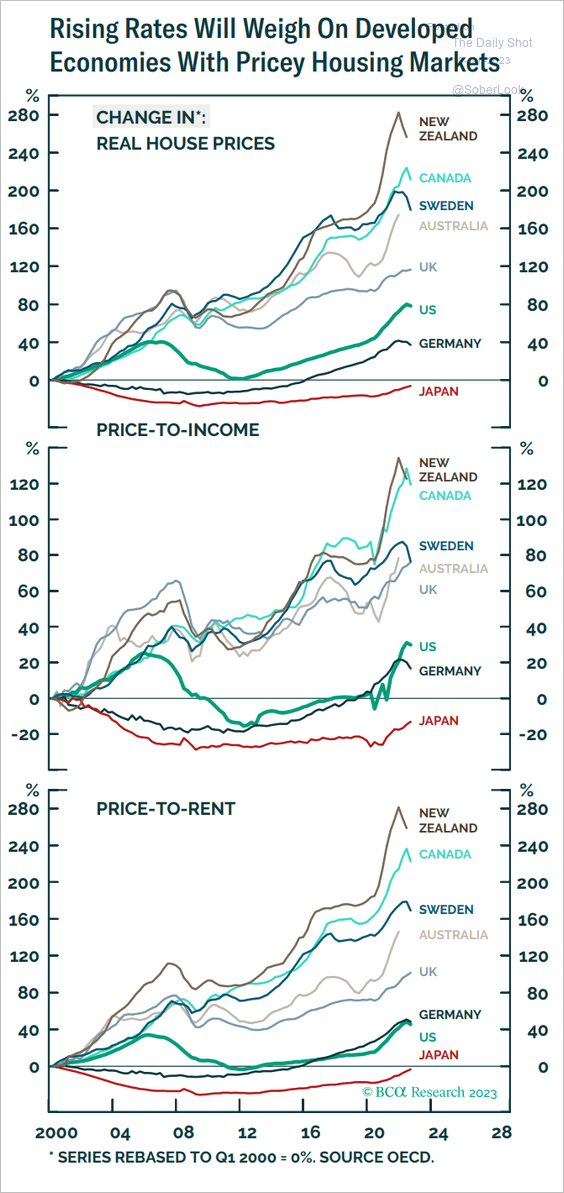 Source: BCA Research
Which housing markets are most vulnerable? This scatterplot shows household leverage vs. the share of adjustable-rate mortgages.
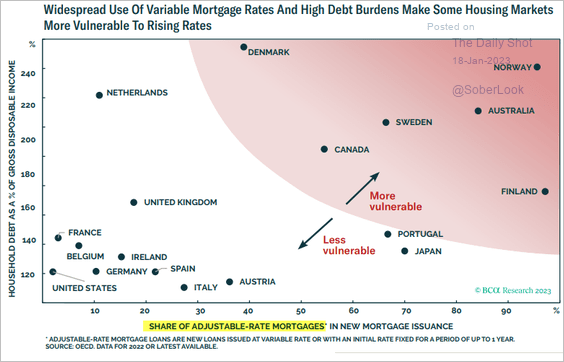 Source: BCA Research
——————–
3. The COVID-era recovery in global trade has been slower than after previous recessions.
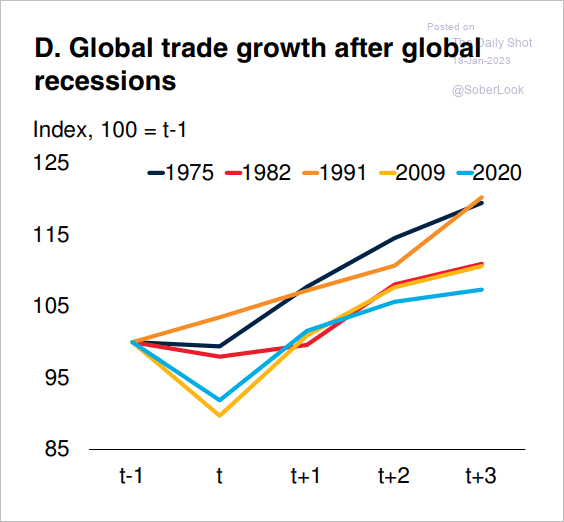 Source: World Bank Read full article
——————–
Food for Thought
1. Best and worst-performing hard commodities in 2022:
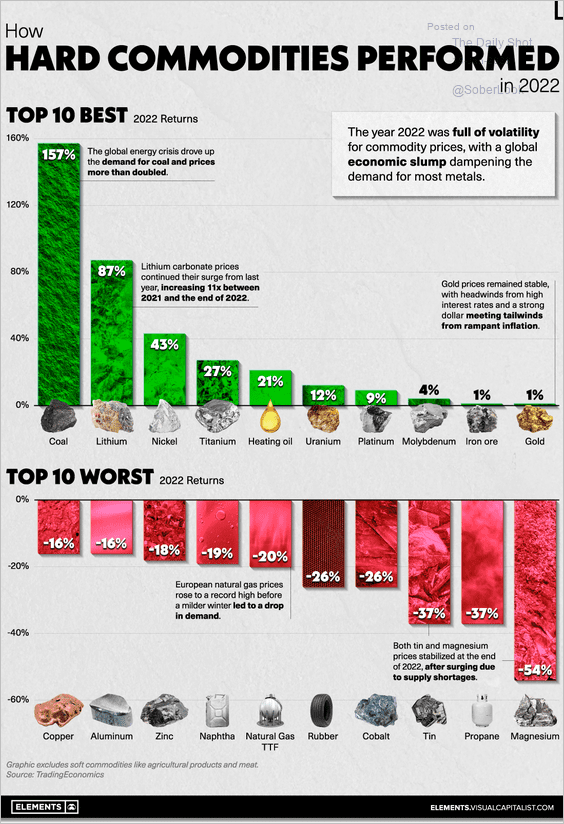 Source: Visual Capitalist, h/t Walter Read full article
2. Global oil production:
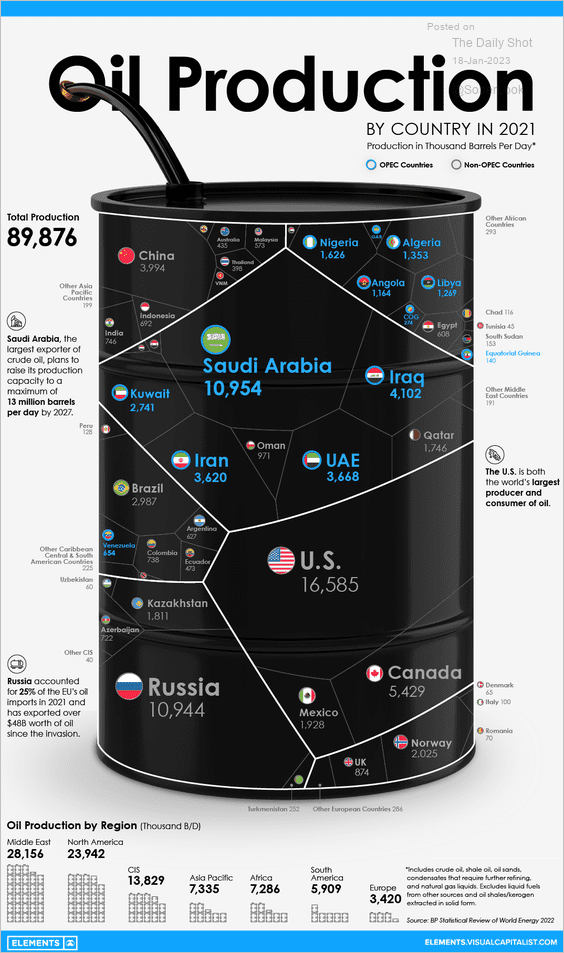 Source: Visual Capitalist Read full article
3. Davos attendees:
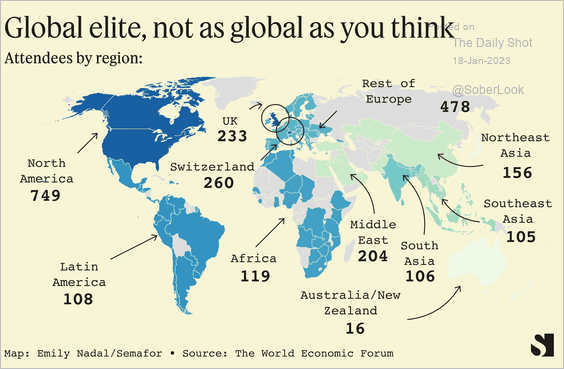 Source: @semafor Read full article
4. Share of foreign companies staying in Russia:
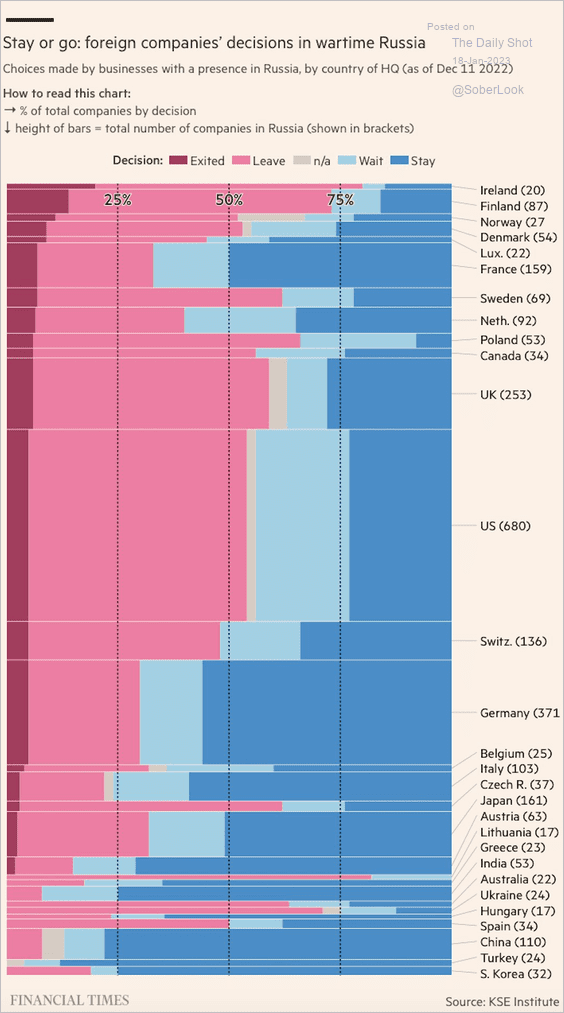 Source: @acemaxx, @FT Read full article
5. Water usage in clothing manufacturing:
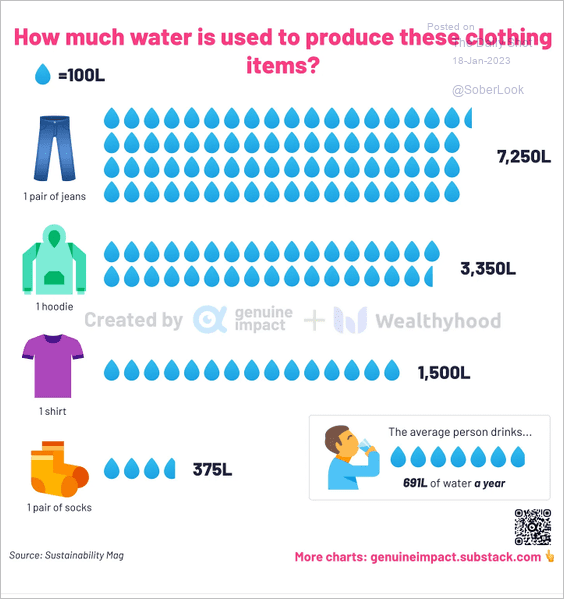 Source: @genuine_impact
6. The cost of computer processing power and data storage:
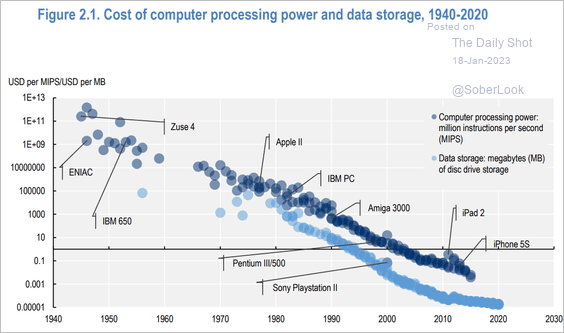 Source: OECD Read full article
7. “Quiet quitter” worker satisfaction factors:
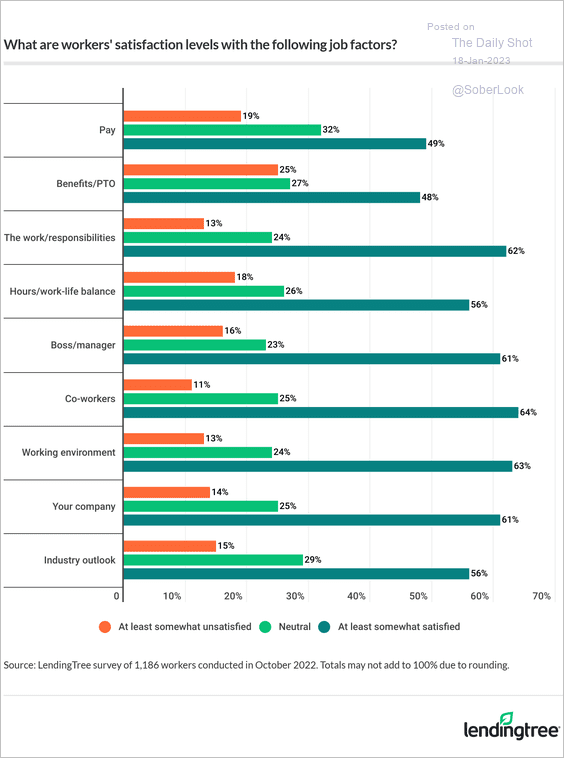 Source: LendingTree Read full article
8. Human composting:
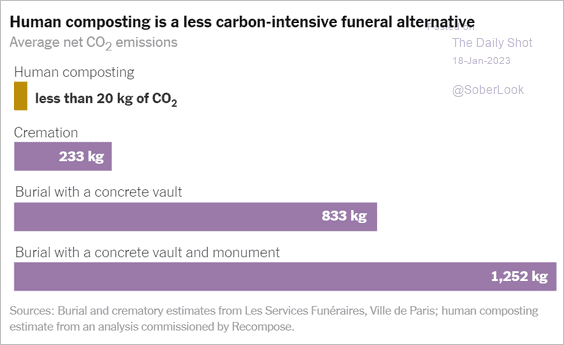 Source: The New York Times Read full article
——————–
Back to Index