
The Daily Shot: 23-Jan-23
• The United States
• The United Kingdom
• The Eurozone
• Asia – Pacific
• China
• Emerging Markets
• Commodities
• Energy
• Equities
• Credit
• Global Developments
• Food for Thought
The United States
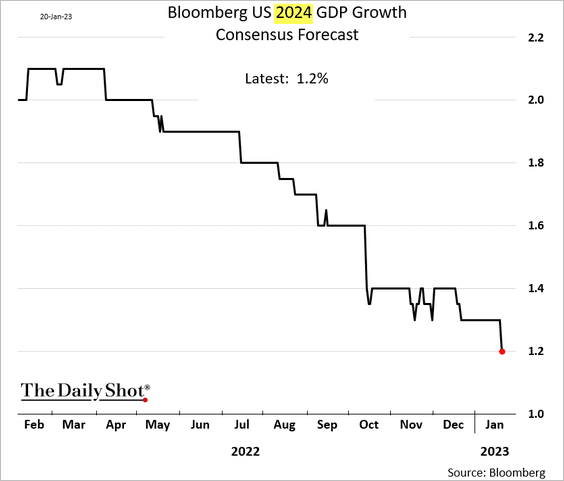
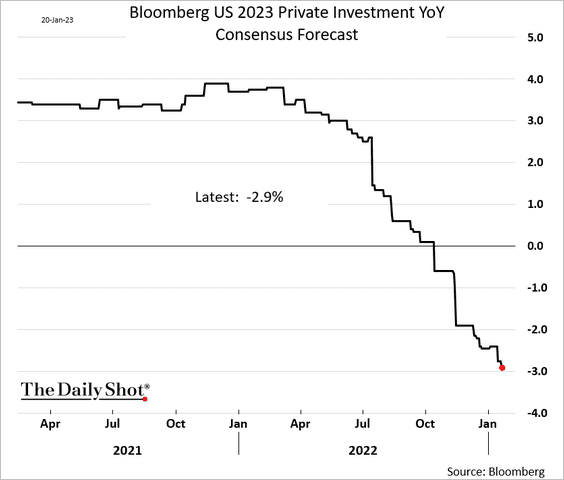
1. This month, economists upgraded their forecasts for US GDP growth in 2023.
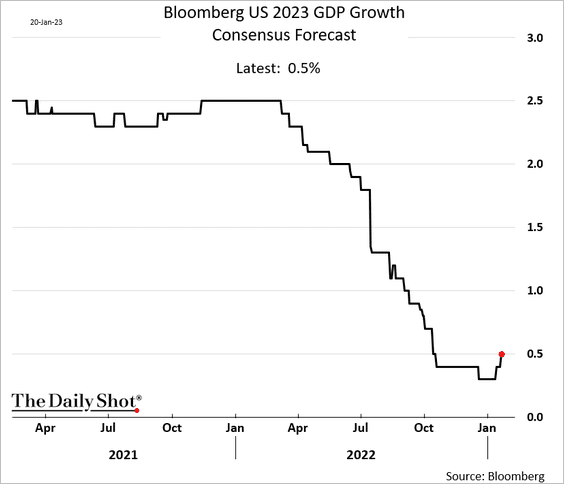
But they lowered their projections for 2024.
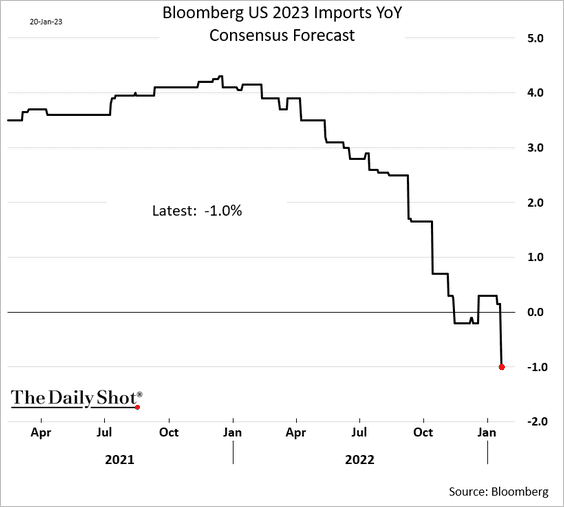
• Slower imports will be a tailwind for US GDP this year.
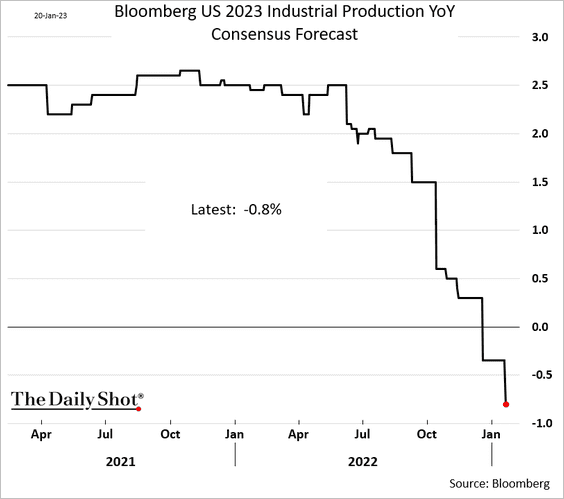
• As we saw last week, manufacturing recession is here, and forecasts are now reflecting that reality.
• It is anticipated that private investment will decrease, particularly in the area of residential construction.
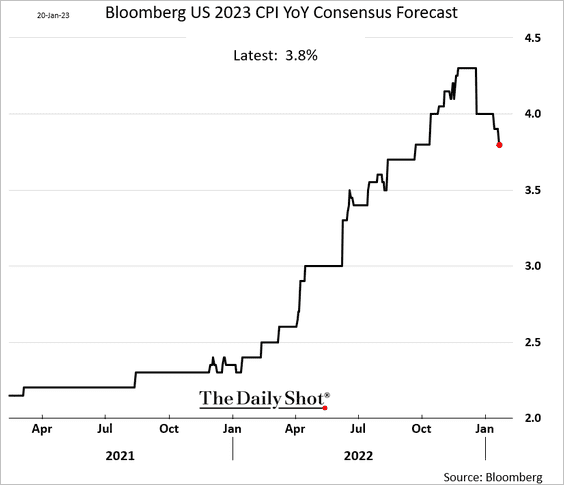
• Inflation estimates have been coming down.
——————–
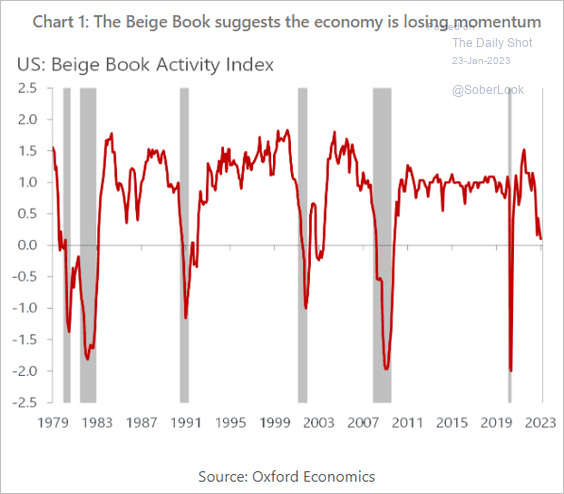
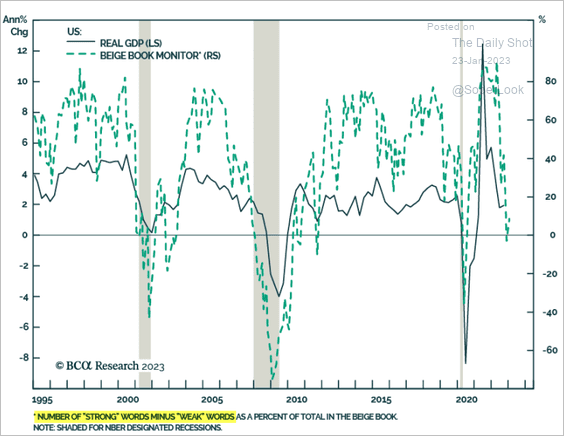
2. The Fed’s Beige Book sentiment indicators (based on the language used) signal softer economic activity.
 Source: Oxford Economics
 Source: BCA Research
Price concerns remain elevated.
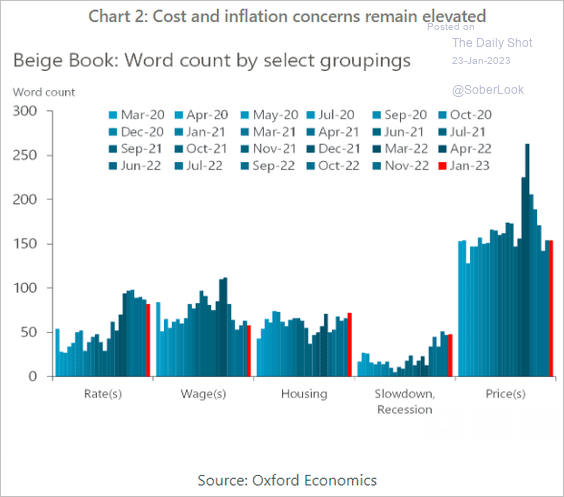 Source: Oxford Economics
——————–
3. The Philly Fed’s regional manufacturing index edged higher this month. However, it continues to indicate contraction.
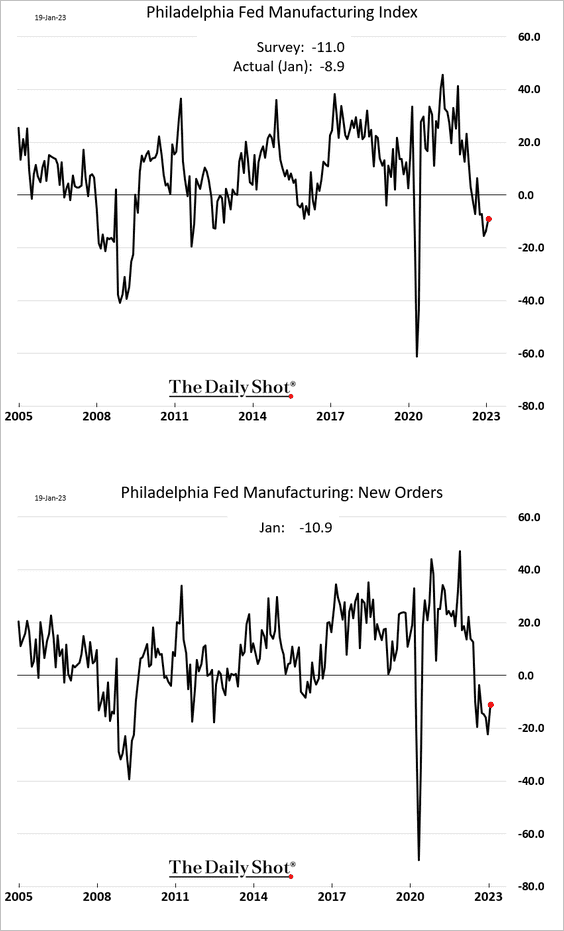
• Factories expect to cut workers’ hours …
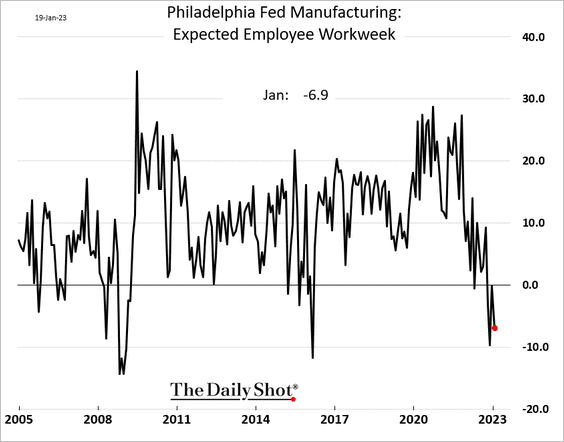
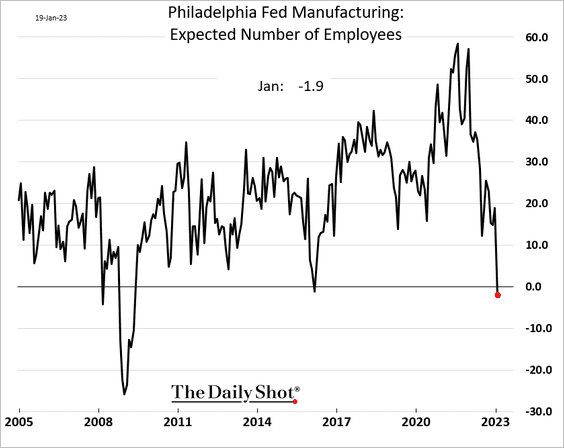
… and shed some jobs.
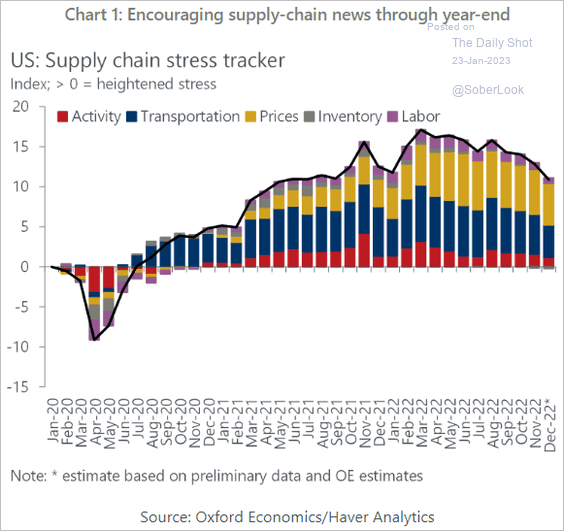
• Price pressures continue to moderate, …
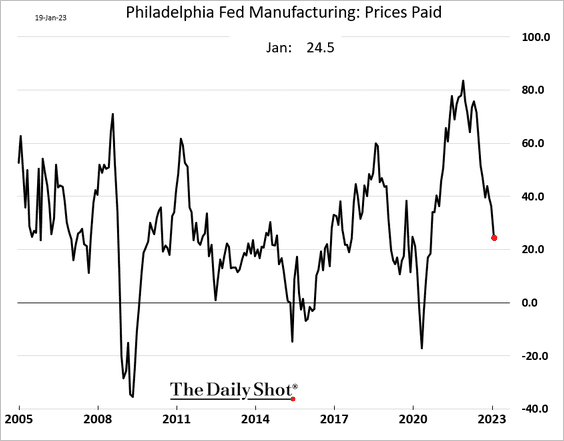
… as supply stress eases.
 Source: Oxford Economics
——————–
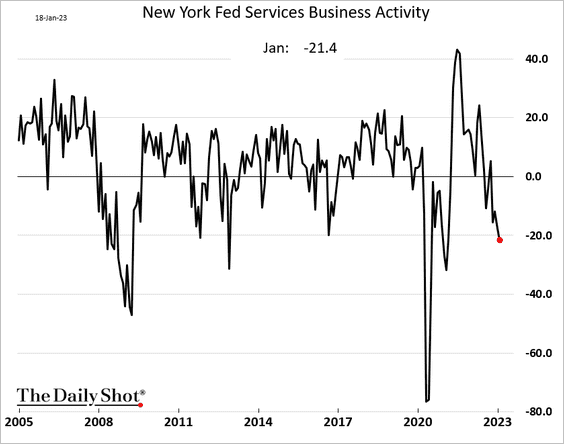
4. The NY Fed’s regional services activity index showed further deterioration this month.
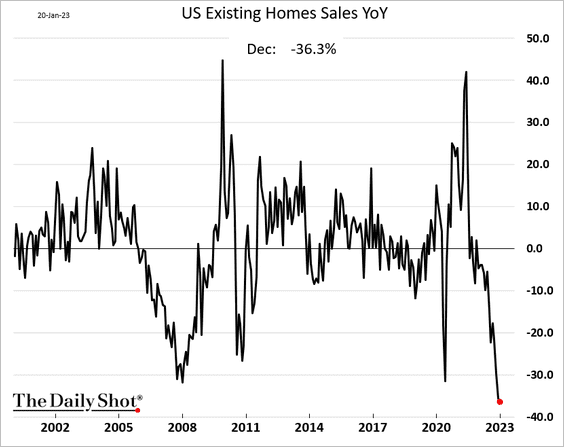
5. Next, we have some updates on the housing market.
• Existing home sales were very weak in December, …
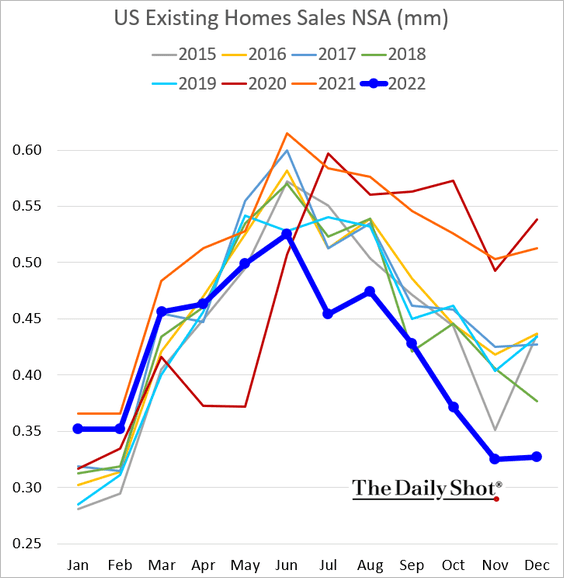
… down 36% in 2022. This is the biggest annual decline in decades.
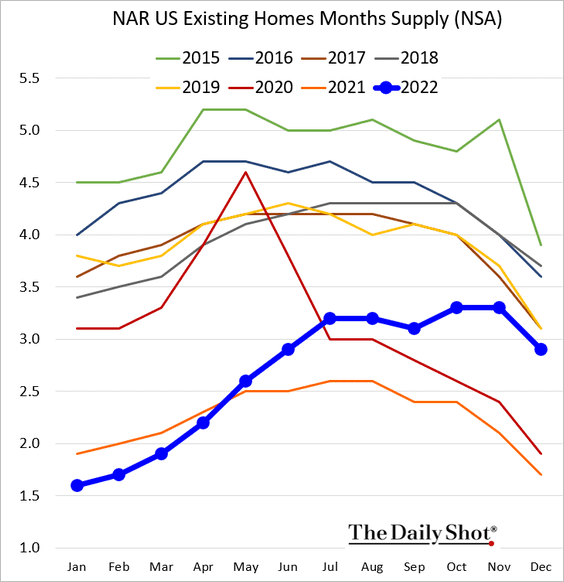
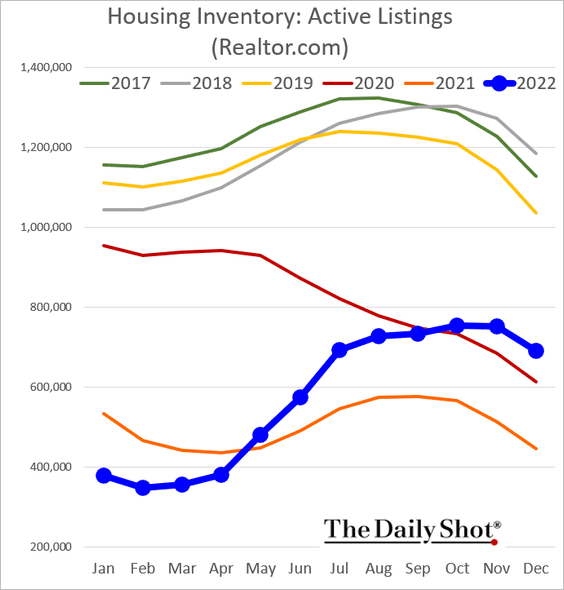
• Housing inventories remain tight in absolute terms, …
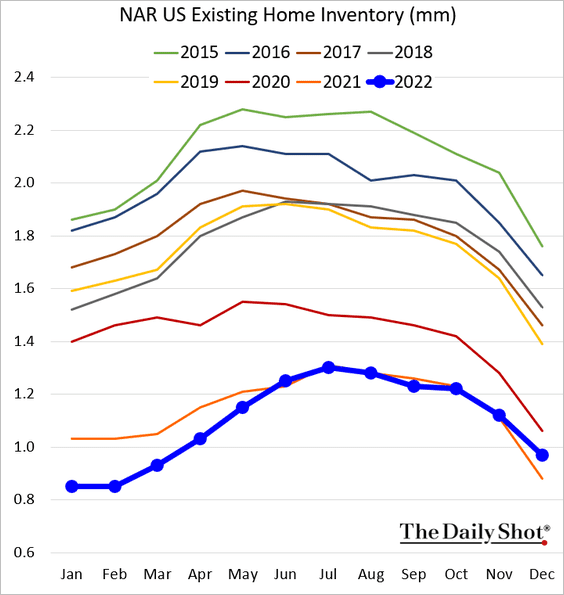
… but they have risen substantially when measured in months of supply (2 charts).
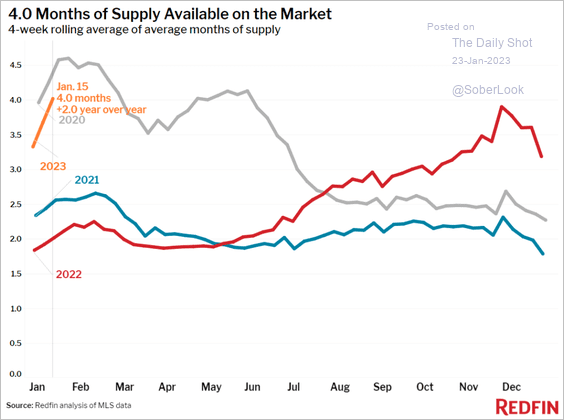 Source: Redfin
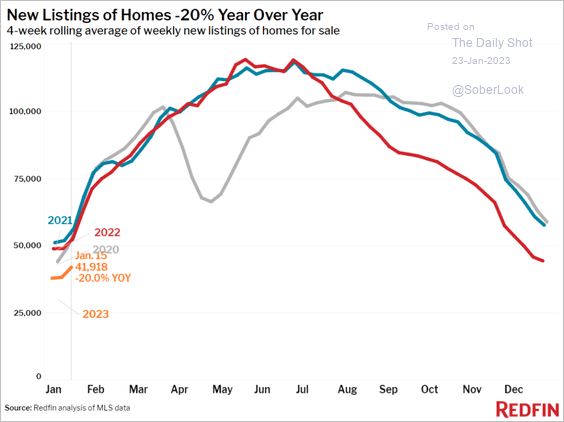
– This chart shows the number of active listings.
New listings are down 20% this month versus January 2022.
 Source: Redfin
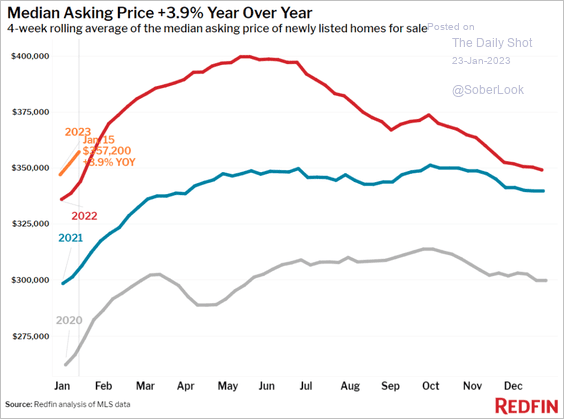
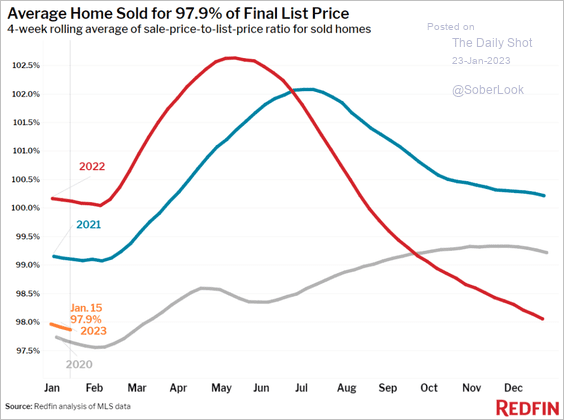
• The median sale price was still above 2021 levels, …
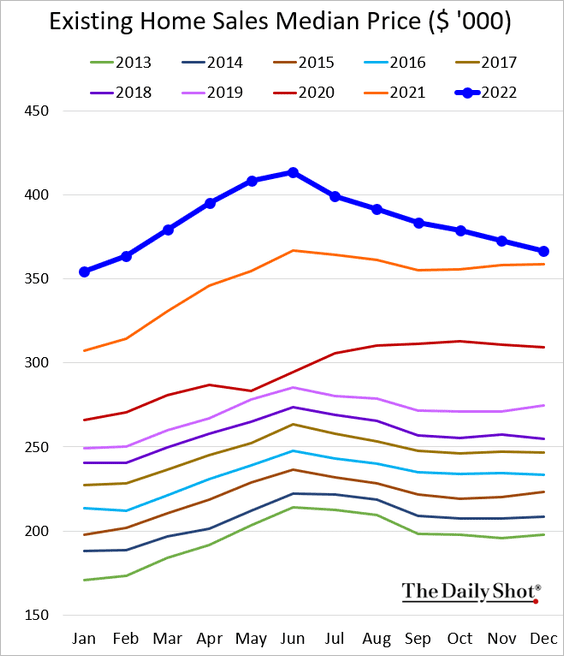
… a trend that continued into January.
 Source: Redfin
– Homes are taking longer to sell, with deals closing below the final list price.
 Source: Redfin
• This chart shows population-adjusted housing starts.
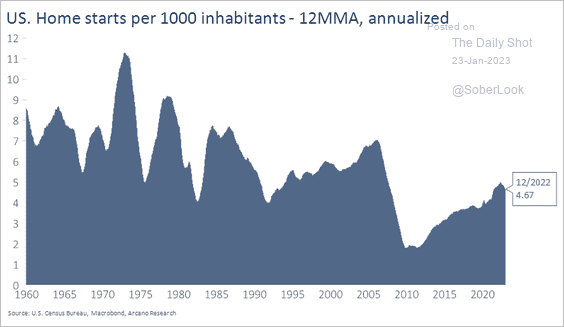 Source: Arcano Economics
• Finally, we have housing months of supply vs. price appreciation.
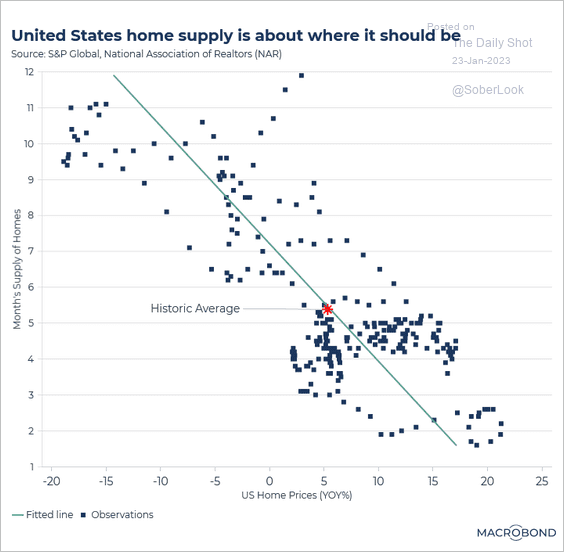 Source: Macrobond
——————–
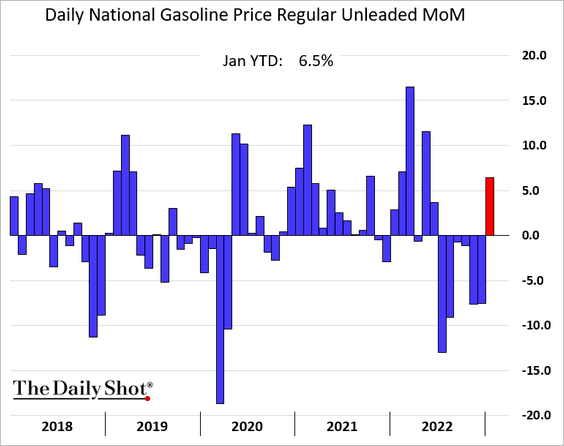
6. US gasoline prices are on track for their first monthly gain since last June.
Back to Index
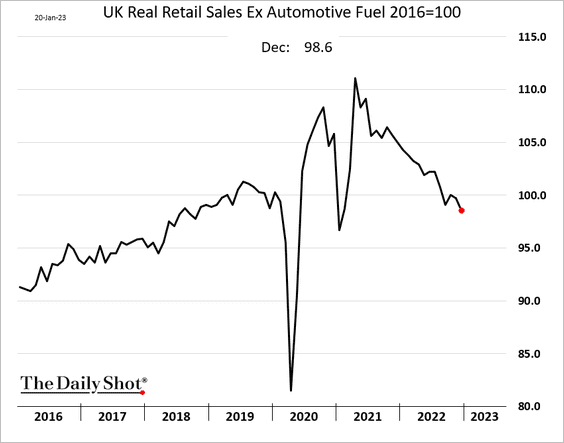
The United Kingdom
1. Real retail sales continue to deteriorate.
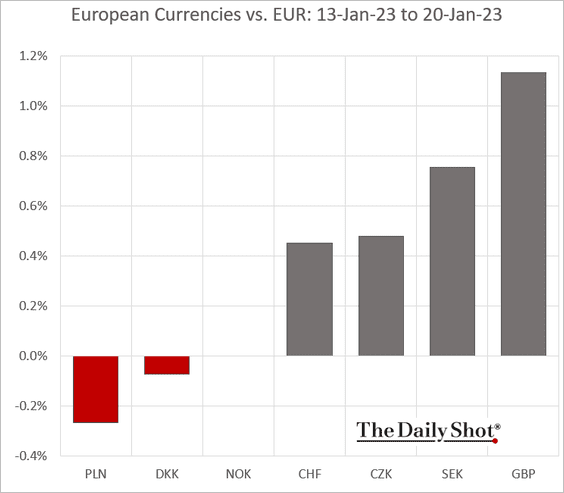
2. The pound performed well against the euro last week.
3. Housieholds’ cash flow will turn negative this year, according to Longview Economics.
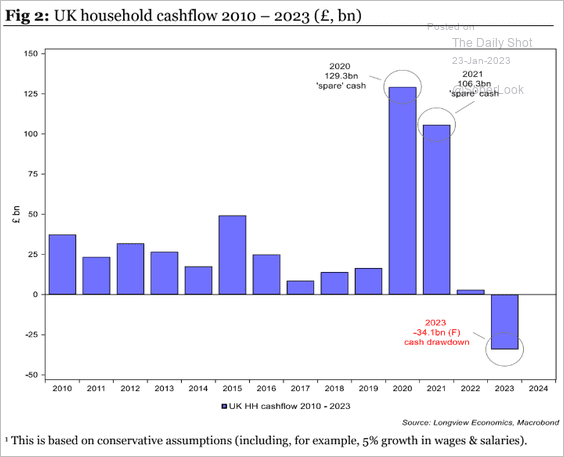 Source: Longview Economics
4. Leading indicators signal a recession ahead.
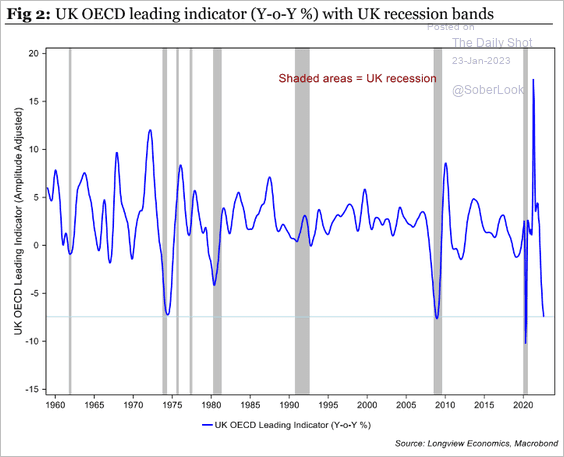 Source: Longview Economics
5. UK adoptions have stalled.
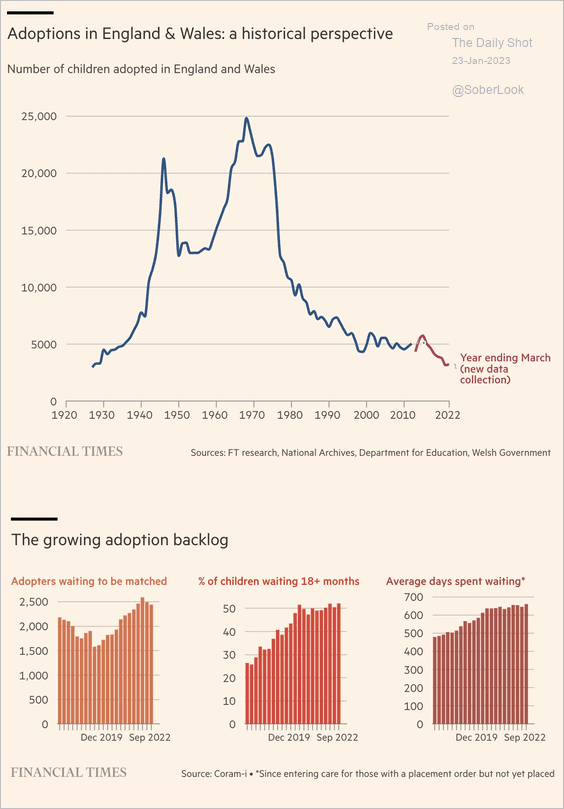 Source: @financialtimes Read full article
Back to Index
The Eurozone
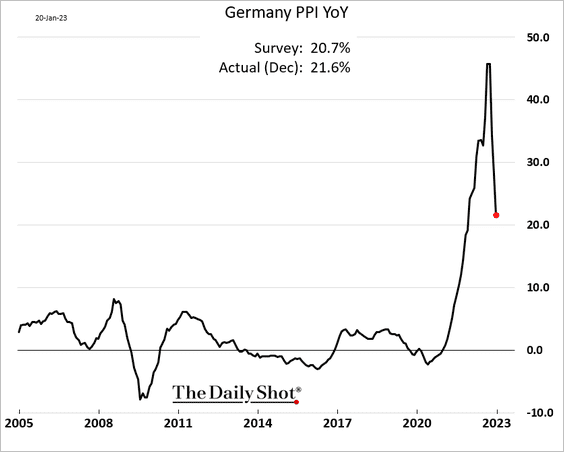
1. Germany’s PPI continues to ease.
2. Consumer inflation has peaked, according to Goldman.
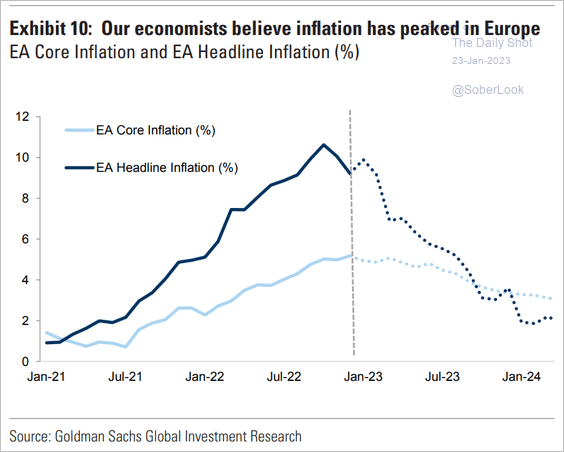 Source: Goldman Sachs
But the ECB remains concerned about underlying inflationary pressures.
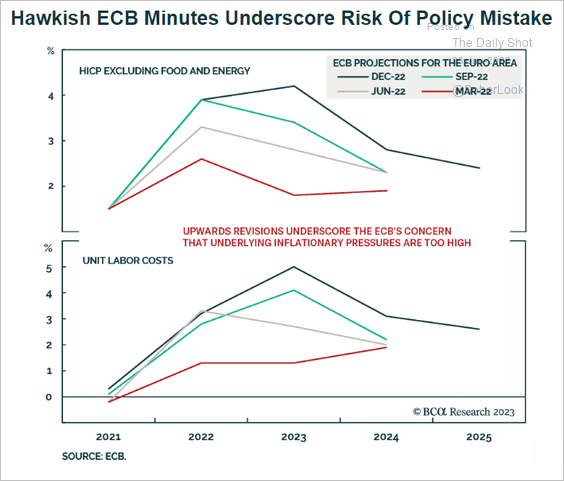 Source: BCA Research
——————–
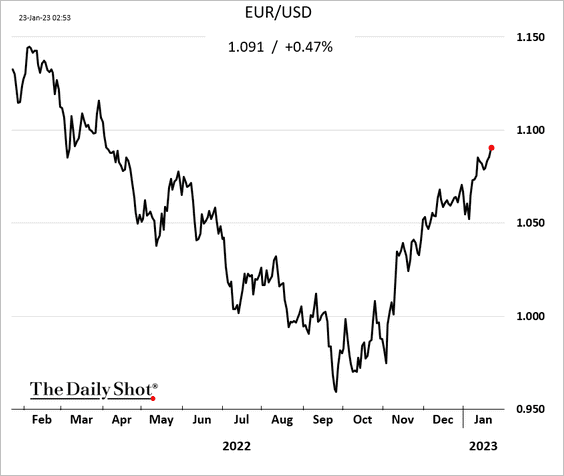
3. The euro continues to rally.
4. German negotiated wages are barely growing in nominal terms and have contracted in real terms.
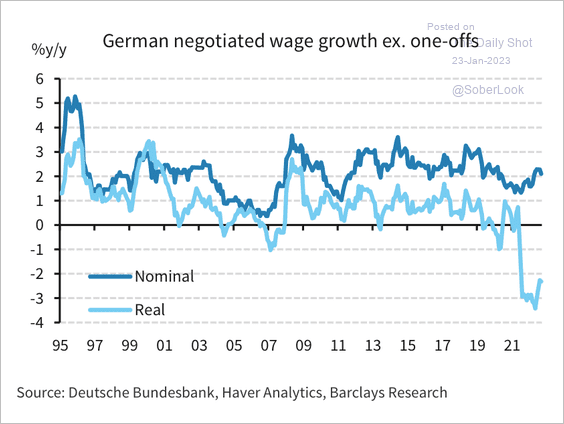 Source: Barclays Research
Negotiated wages should peak at 3.3% year-over-year in Q3, according to Barclays.
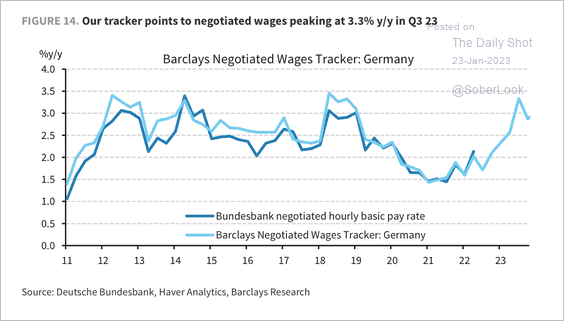 Source: Barclays Research
• In Spain, negotiated wage growth is rising toward pre-financial crisis levels …
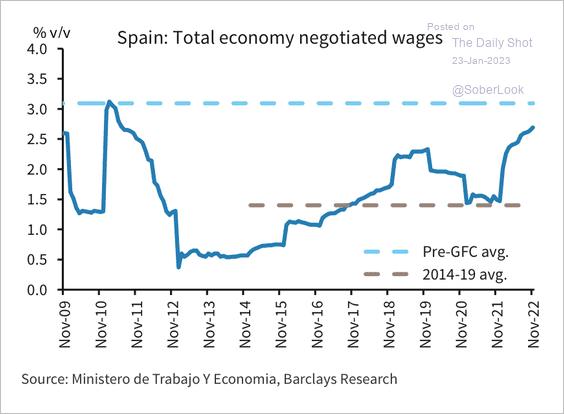 Source: Barclays Research
… driven by industry and construction workers.
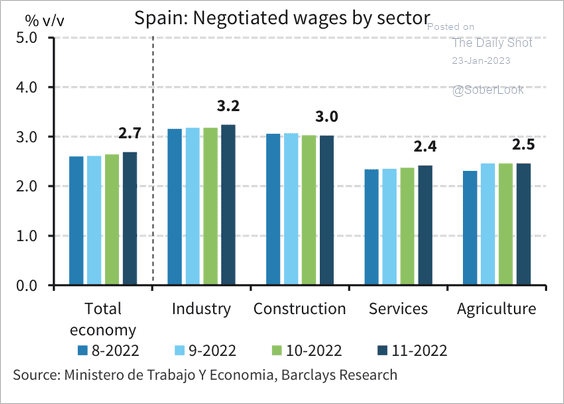 Source: Barclays Research
——————–
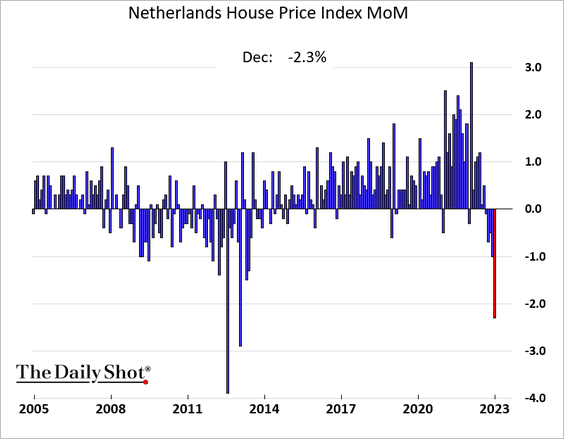
5. Dutch home price declines have accelerated.
6. The public sector has been hiring.
 Source: BlackRock Investment Institute
Back to Index
Asia – Pacific
1. This is an approximation of how the JGB yield curve may appear without the influence of the Bank of Japan’s interventions.
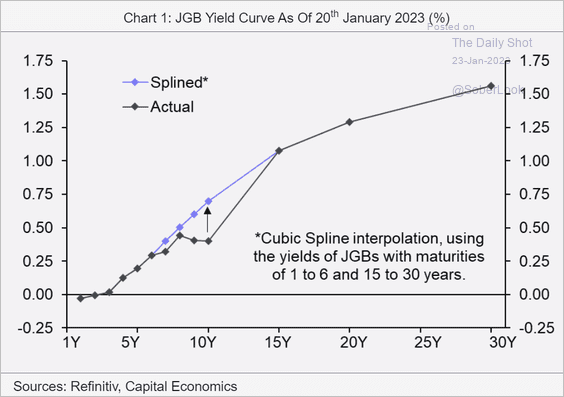 Source: Capital Economics
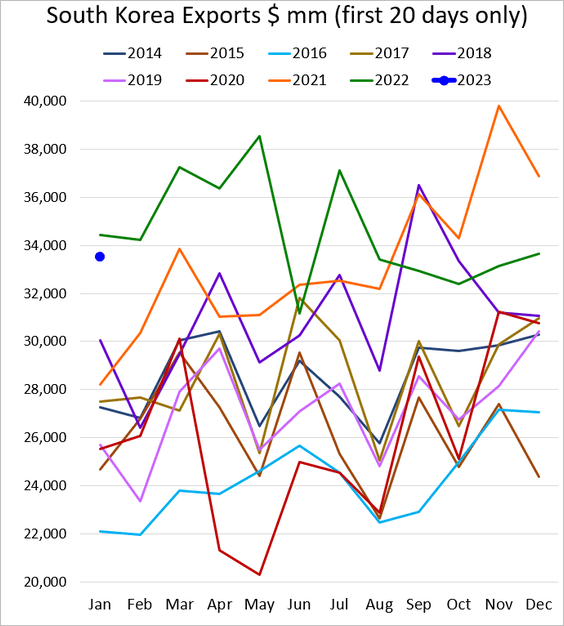
2. South Korea’s exports remain robust.
3. Australia’s coal sales to China will probably resume soon after the détente.
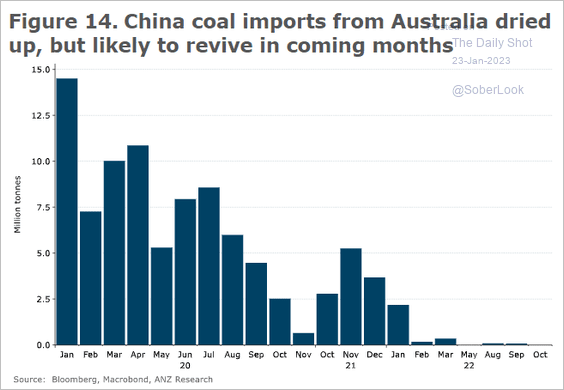 Source: @ANZ_Research
Back to Index
China
1. Mobility remains strong despite the surge in COVID cases.
 Source: @ANZ_Research
2. Infrastructure spending is headed lower.
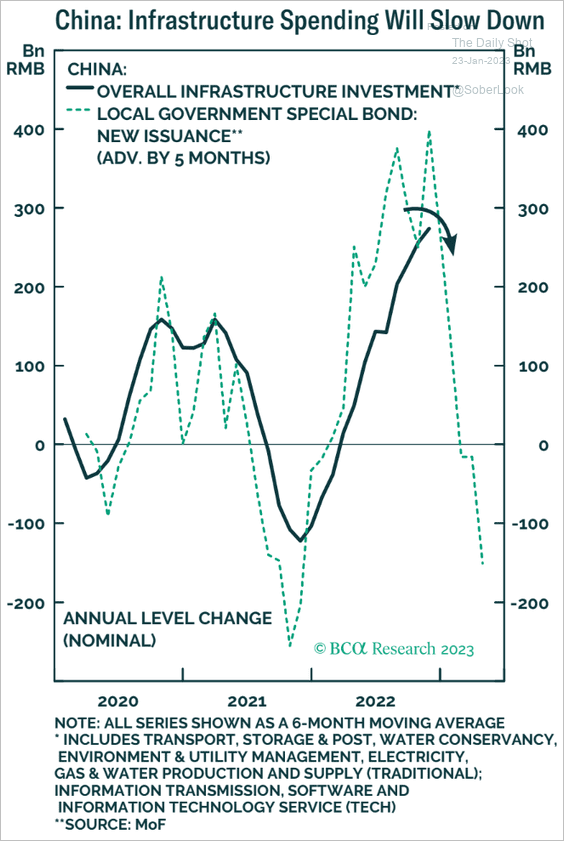 Source: BCA Research
3. Here is a comparison of key consumption components for the US and China.
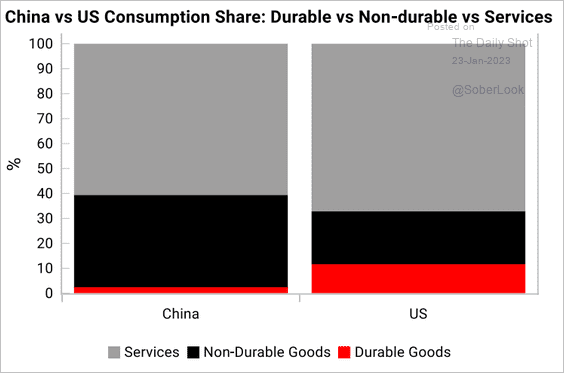 Source: Variant Perception
Back to Index
Emerging Markets
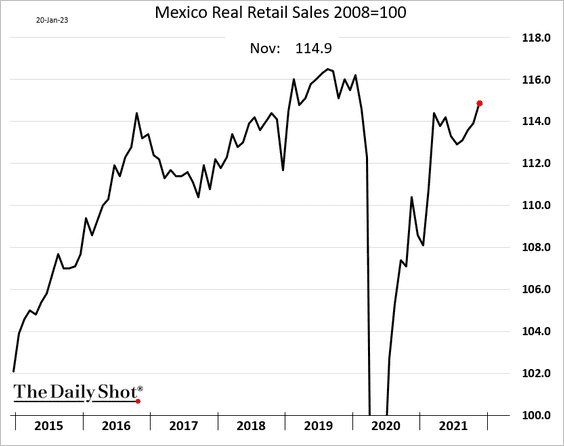
1. Mexican retail sales continue to climb
2. The Peruvian sol has been under a bit of pressure amid growing protests.
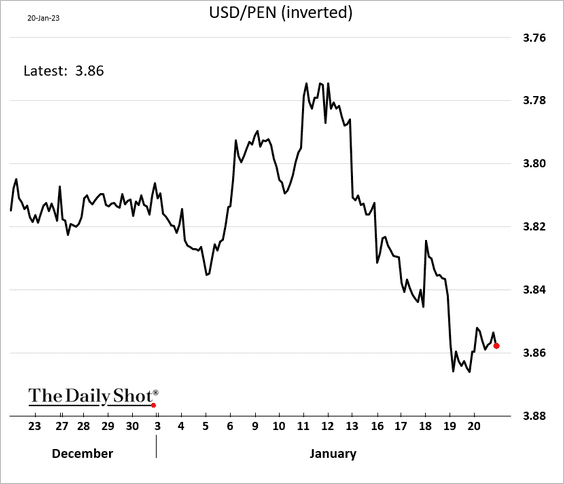
 Source: Reuters Read full article
——————–
3. Where do LatAm investors see the biggest tail risks?
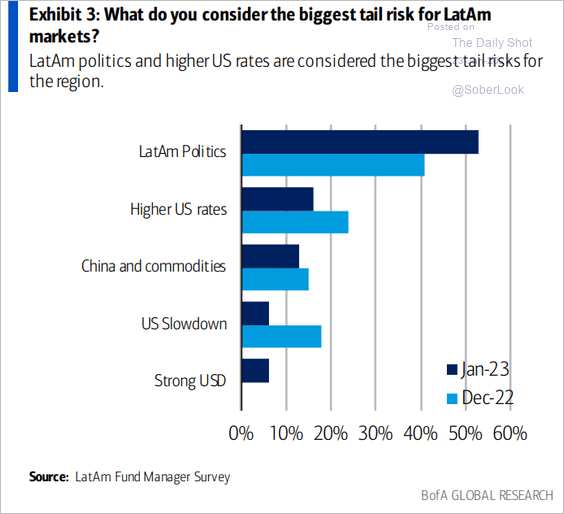 Source: BofA Global Research
4. EM total equity returns have significantly underperformed developed markets in the past decade, having significantly outperformed in the previous decade.
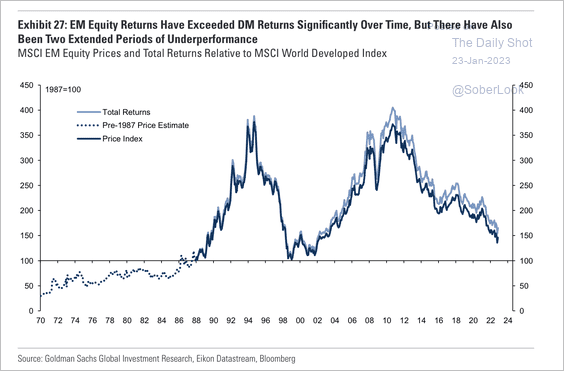 Source: Goldman Sachs
5. EM bond spreads have narrowed as trade conditions weakened.
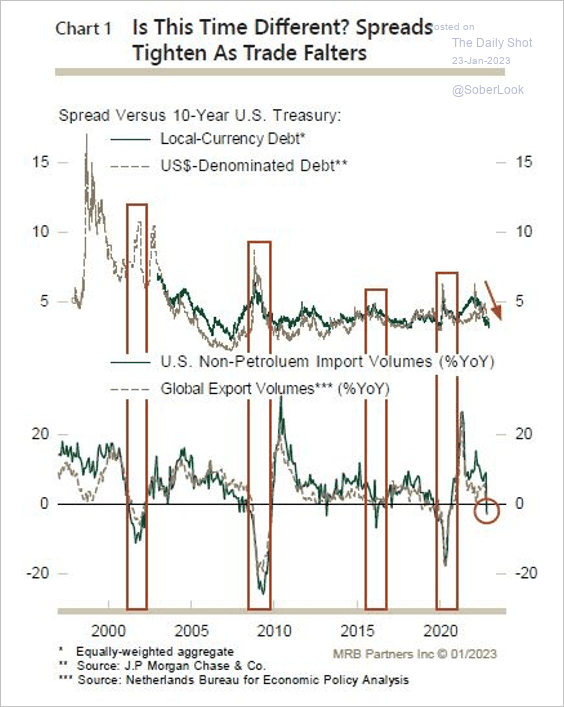 Source: MRB Partners
6. Bond fund flows remain depressed, while equity funds continue to see inflows.
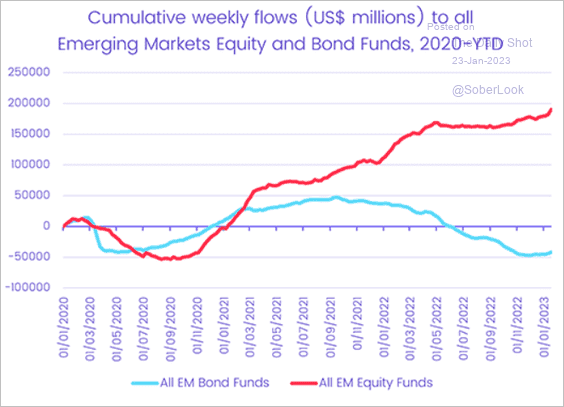 Source: EPFR
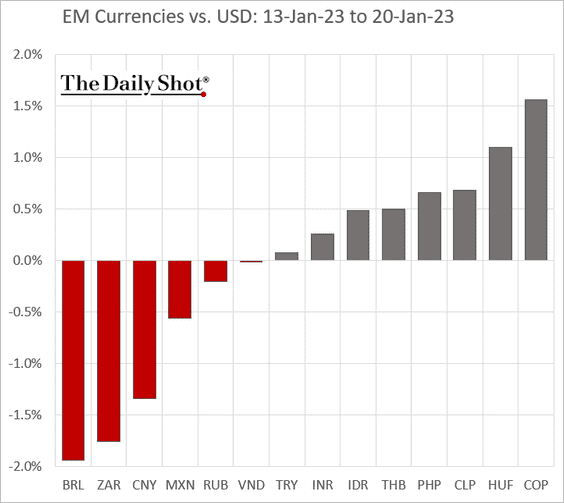
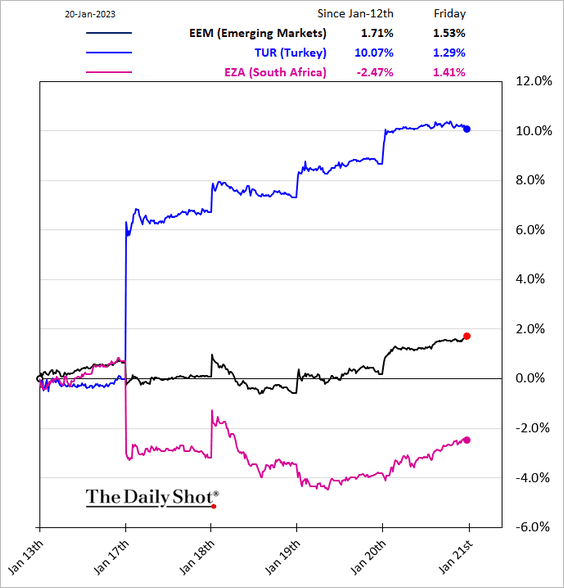
7. Finally, we have some performance data from last week.
• Currencies:
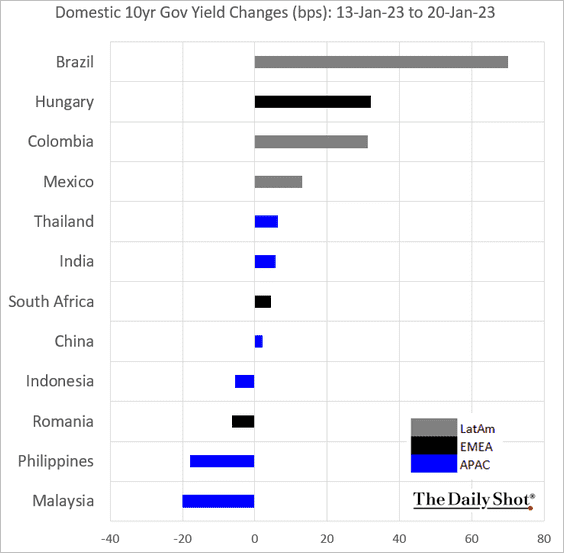
• Bond yields:
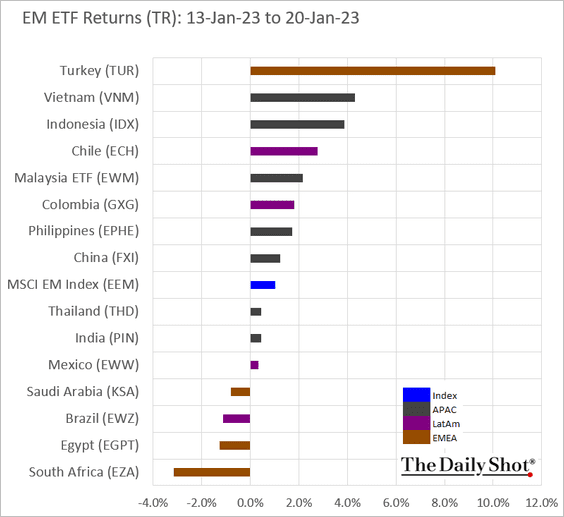
• Equity ETFs (2 charts):
Back to Index
Commodities
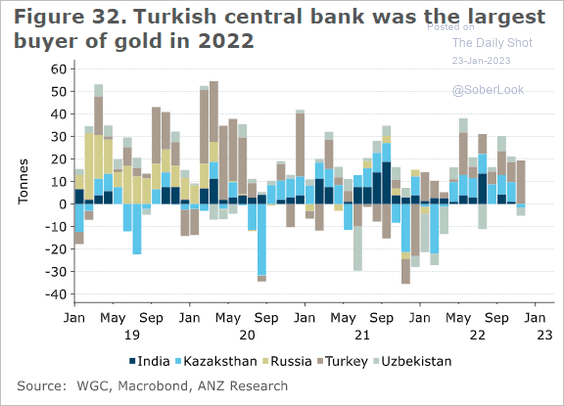
1. Turkish central bank has been buying a lot of gold.
 Source: @ANZ_Research
2. This map shows the global soybean trade, with much of it headed for China.
 Source: @kannbwx
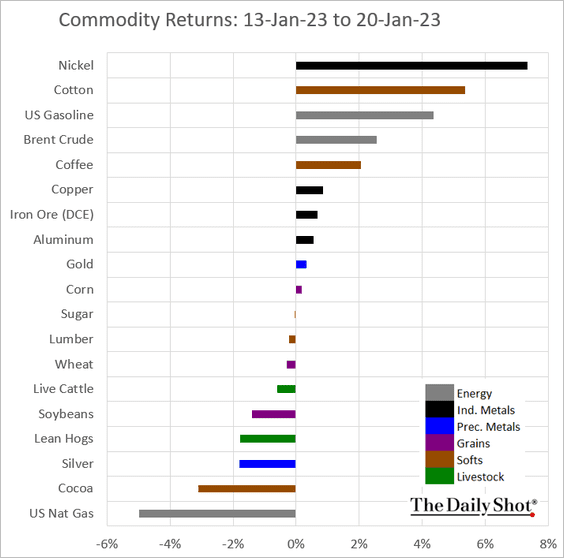
3. Here is last week’s performance across key markets.
Back to Index
Energy
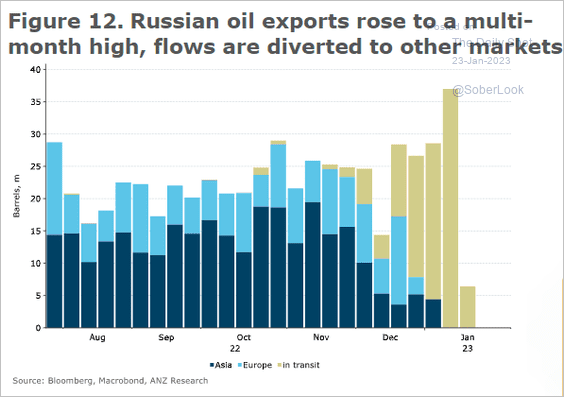
1. Russia sold a lot of oil in December (which will buy plenty of cheap North Korean artillery shells and rockets).
 Source: @ANZ_Research
2. US LNG export capacity is expected to surge in the next few years.
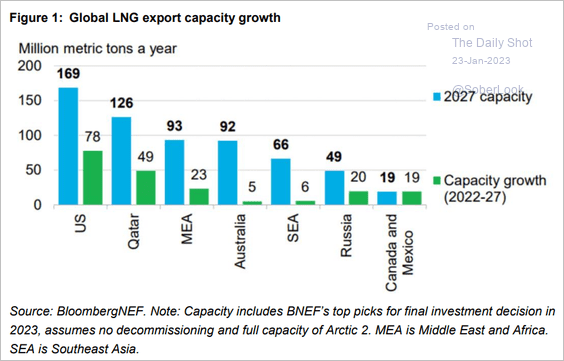 Source: BloombergNEF Read full article
Back to Index
Equities
1. US corporate profits are at risk this year as the economy weakens.
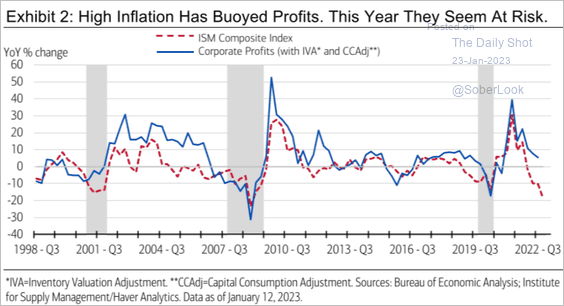 Source: Merrill Lynch
But US economic surprises have turned higher.
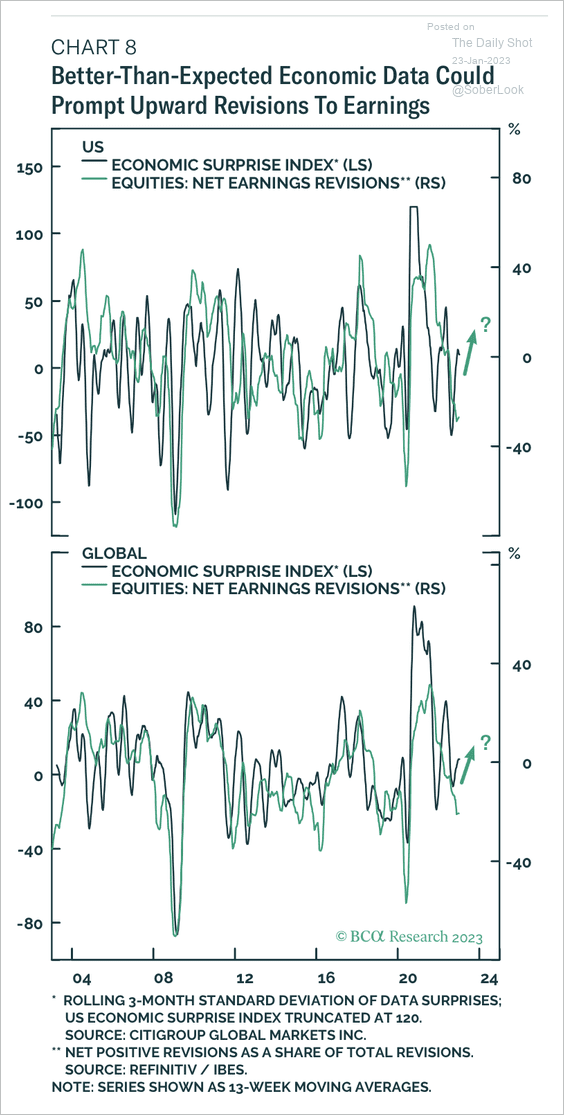 Source: BCA Research
——————–
2. Rising interest rates and reduced liquidity in the context of accelerating inflation weighed on developed market stocks last year. As a result, Numera Analytics sees continued downside risks as major economies enter a recession.
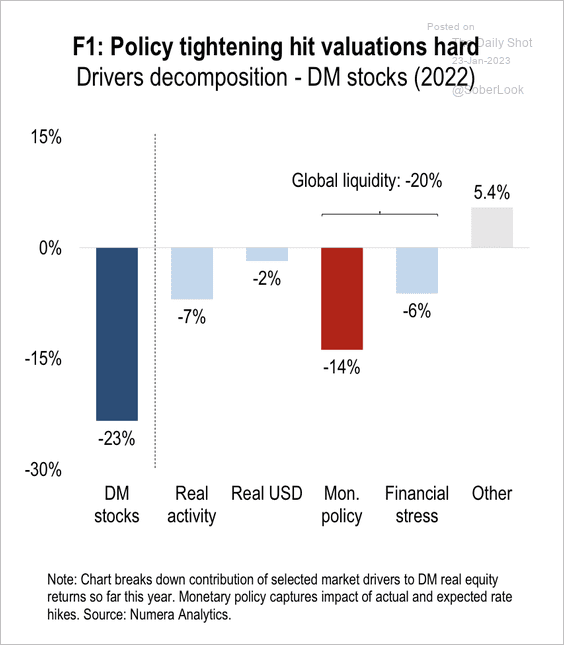 Source: Numera Analytics (@NumeraAnalytics)
3. Global equity fund flows have stalled, …
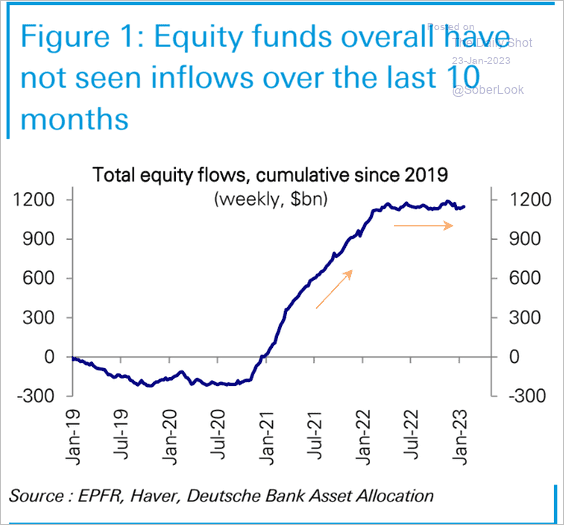 Source: Deutsche Bank Research
… but rotation out of the US continues.
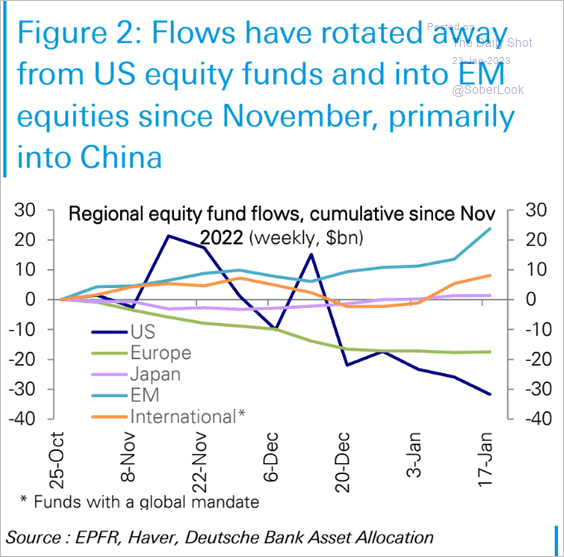 Source: Deutsche Bank Research
——————–
4. The stock market tends to perform better when unemployment is high.
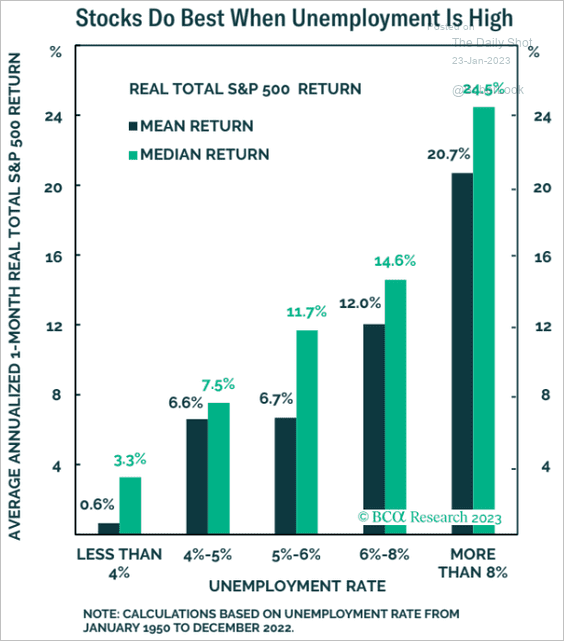 Source: BCA Research
5. This chart shows the US M&A activity over time.
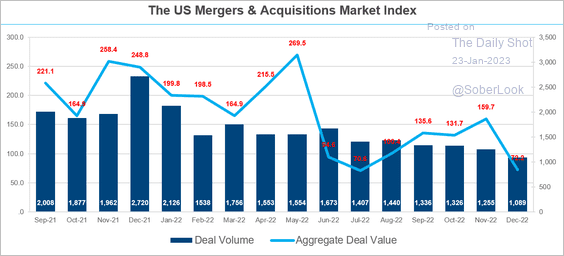 Source: @FactSet Read full article
6. These are the returns from buying S&P 500 when VIX is over 30 and closing the trade when VIX is under 20.
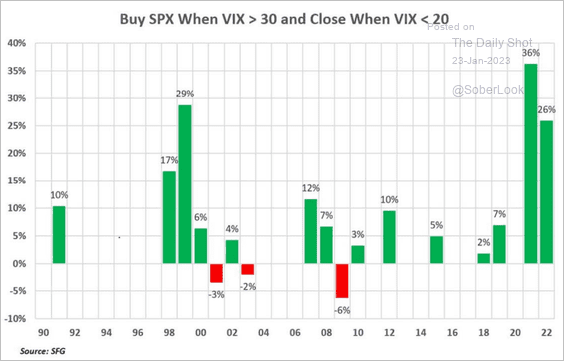 Source: Chris Murphy, Susquehanna International Group
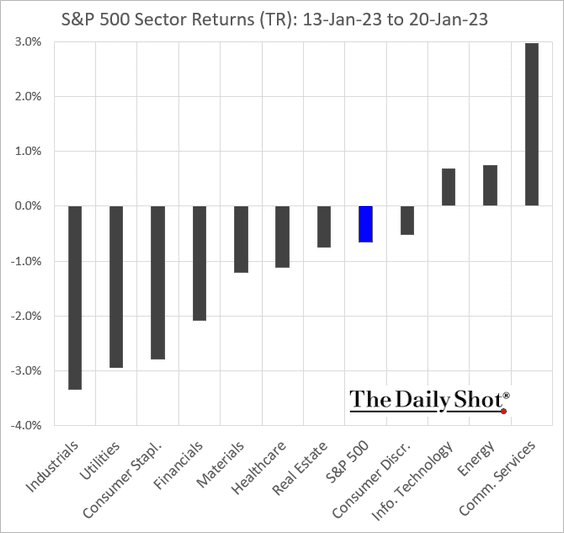
7. Finally, we have some performance data from last week.
• Sectors:
The market rewards tech layoffs …
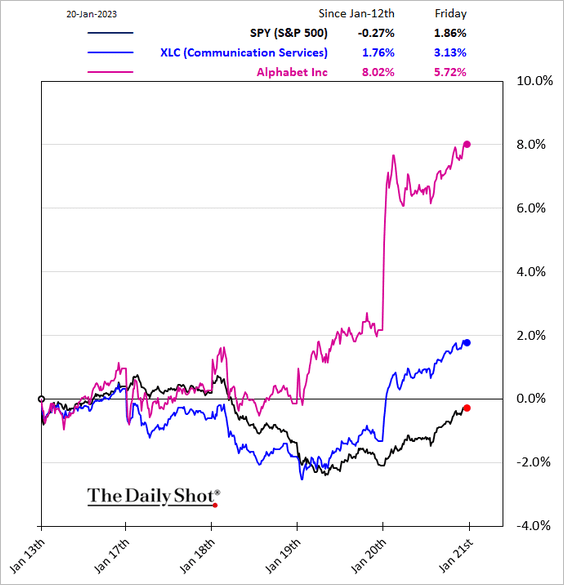
 Source: CNBC Read full article
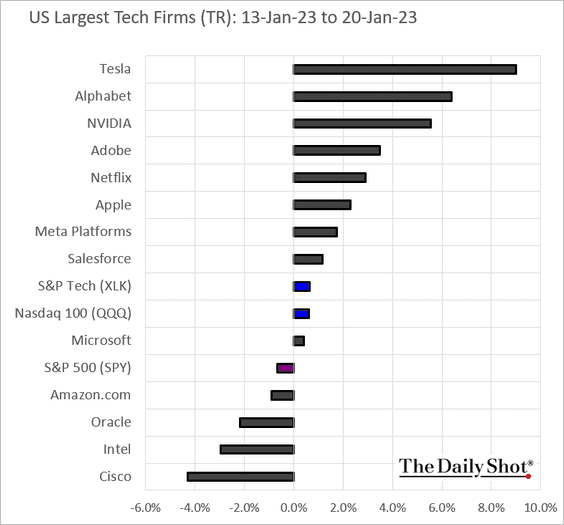
• Largest US tech firms:
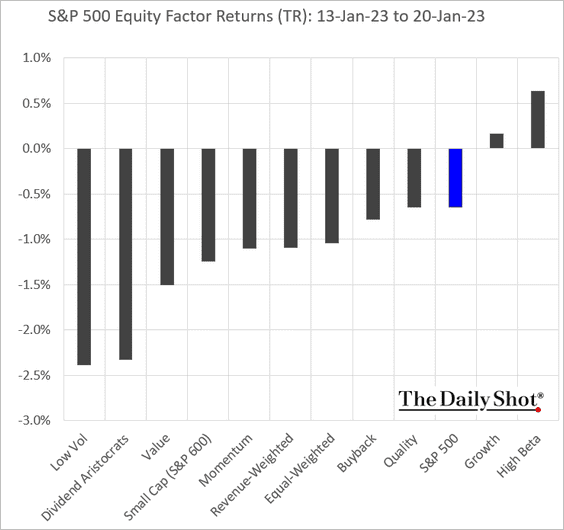
• Equity factors:
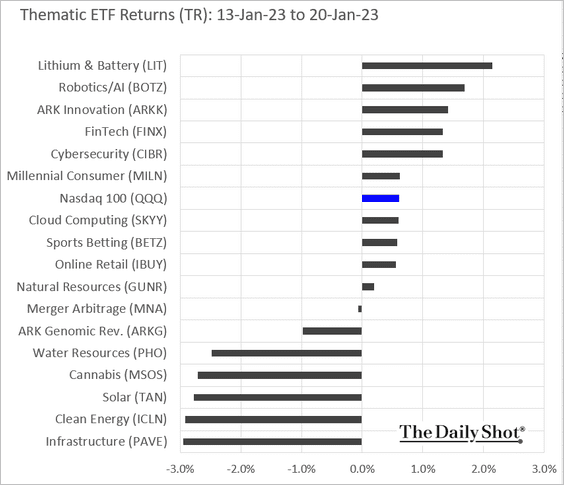
• Thematic ETFs:
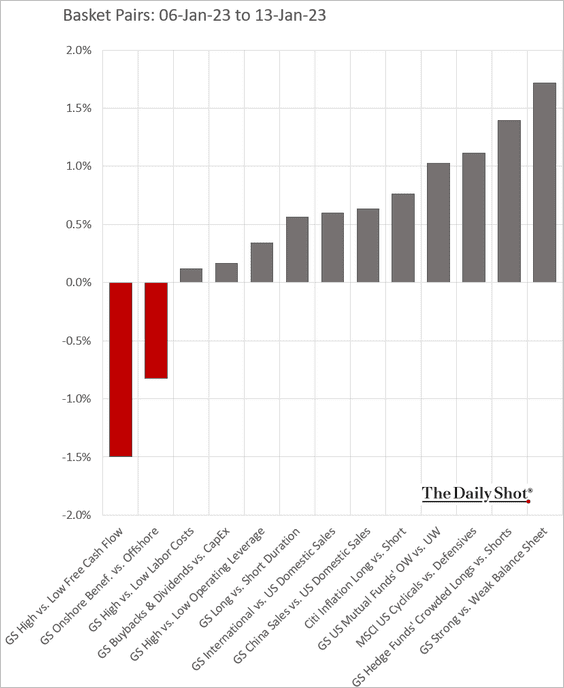
• Relative performance of thematic basket pairs:
Back to Index
Credit
1. Overall, US credit growth remains strong.
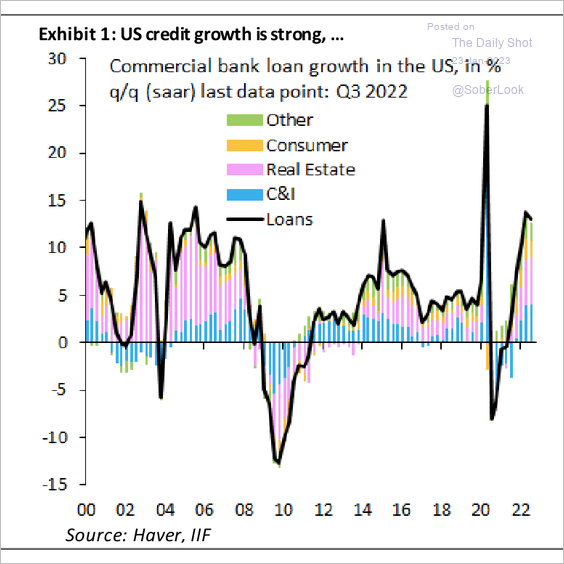 Source: IIF
2. High-yield muni issuers have aggressively extended borrowing horizons amid low rates.
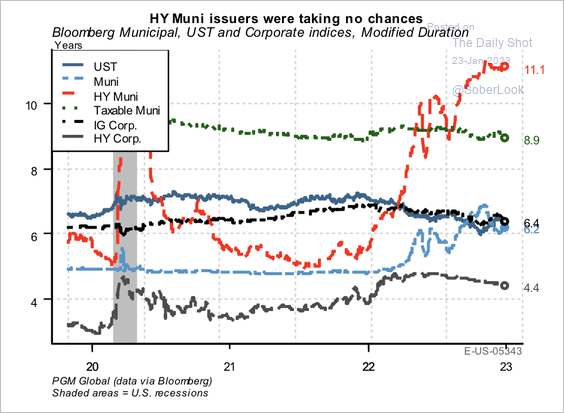 Source: PGM Global
3. US corporate pension funds are well funded, with the GAAP discounts boosted by higher interest rates.
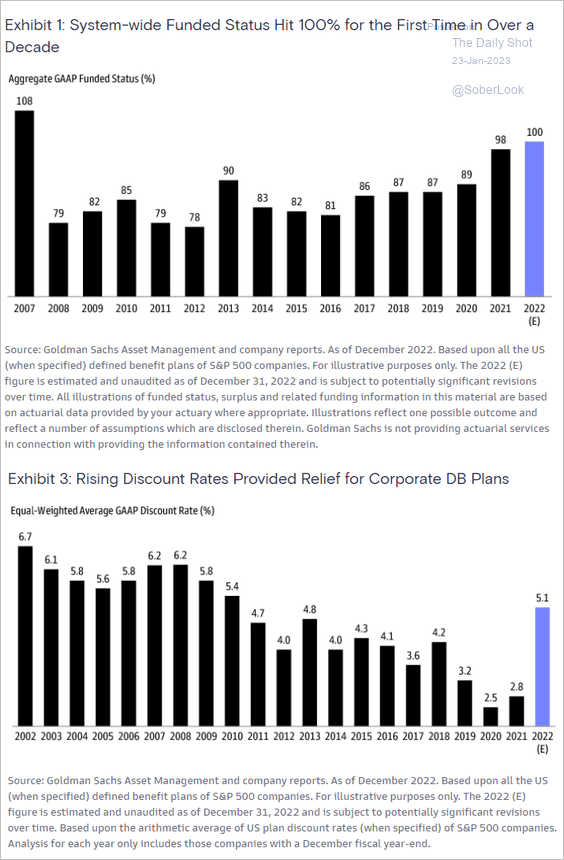 Source: Goldman Sachs
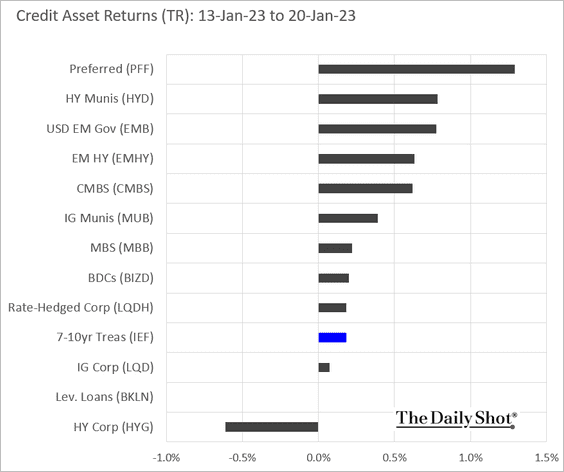
4. Finally, we have last week’s performance by asset class.
Back to Index
Global Developments
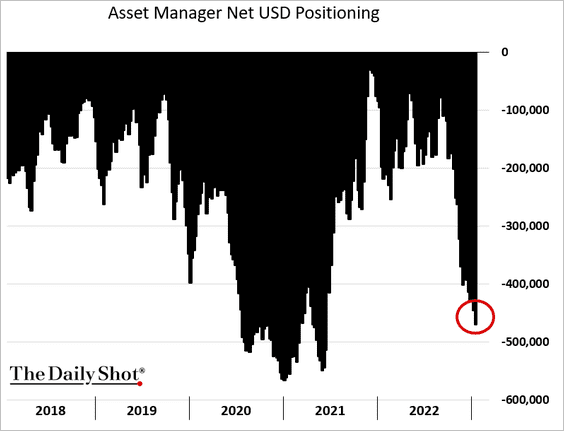
1. The dollar continues to move lower.
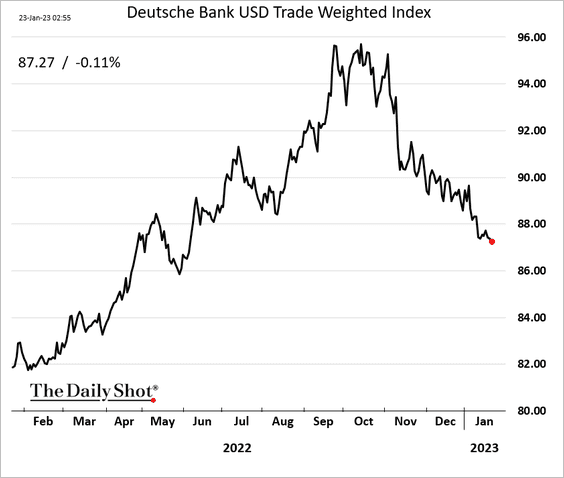
• Asset managers keep boosting their bets against the dollar.
• The US dollar remains overvalued:
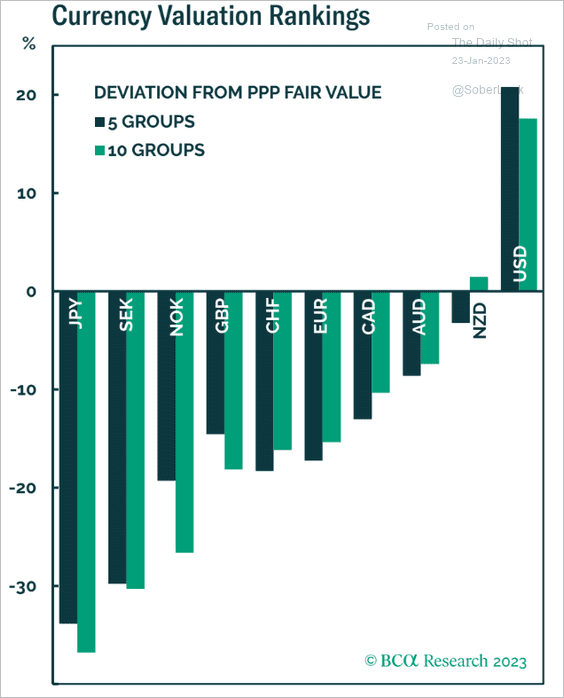 Source: BCA Research
——————–
2. China will likely export disinflation, according to Pantheon Macroeconomics.
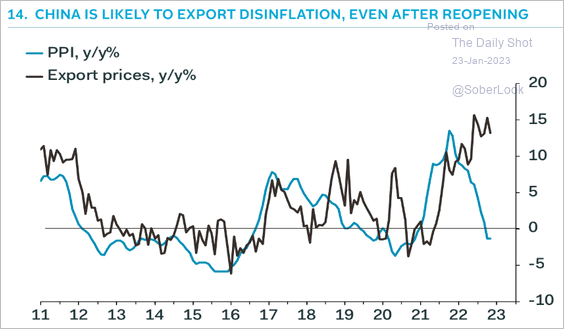 Source: Pantheon Macroeconomics
3. Spikes in energy spending tend to coincide with recessions.
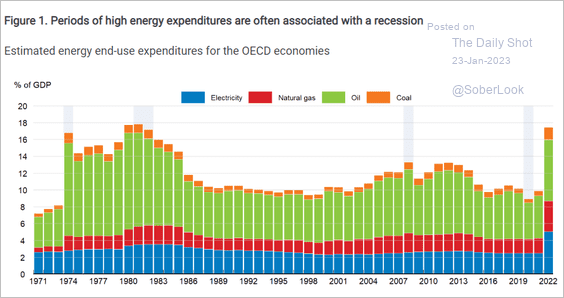 Source: OECD Read full article
4. Oxford Economics has downgraded its forecasts for productivity growth.
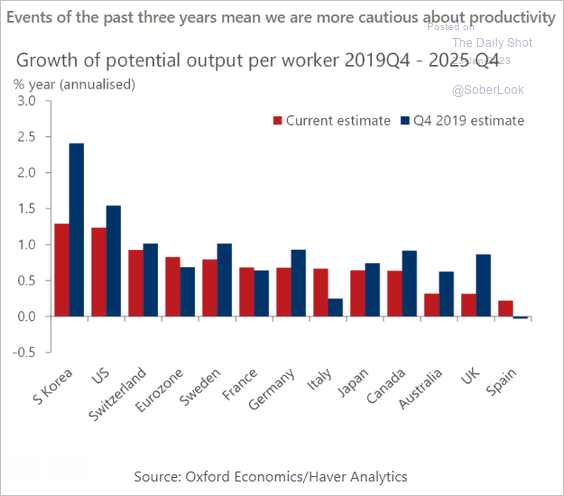 Source: Oxford Economics
5. Finally, we have some performance data from last week.
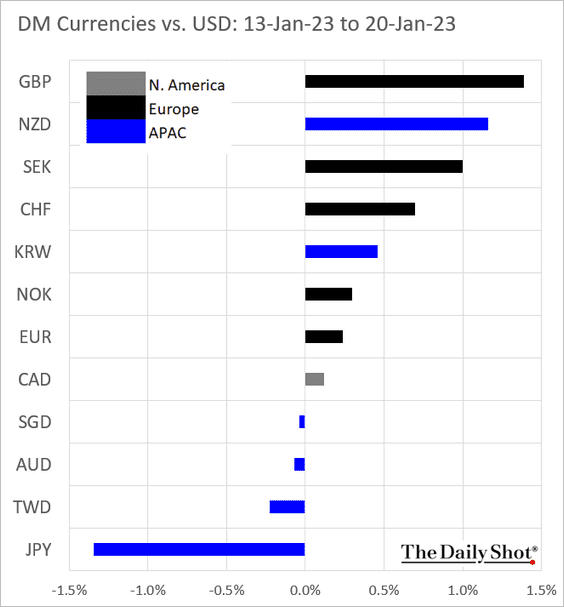
• Currencies:
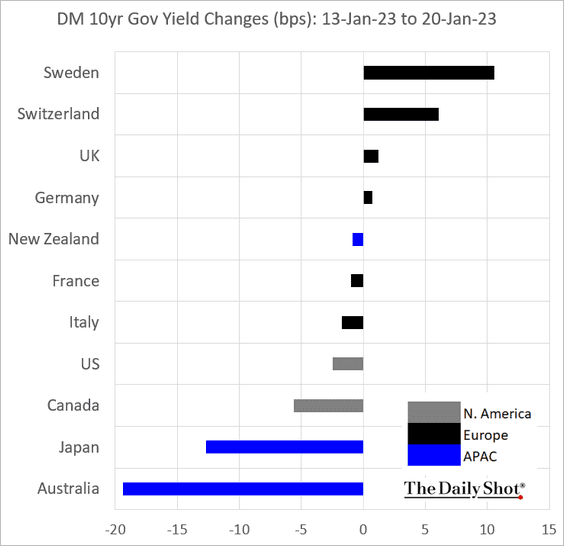
• Bond yields:
——————–
Food for Thought
1. Annual earnings vs. the number of days working from home:
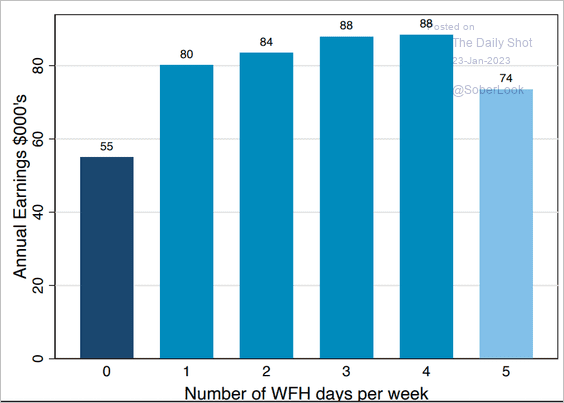 Source: WFH Research Read full article
2. Remote and hybrid workers on the move:
 Source: Apartment List
3. Audio streaming platform preferences:
 Source: Statista
5. Posts that Facebook users see:
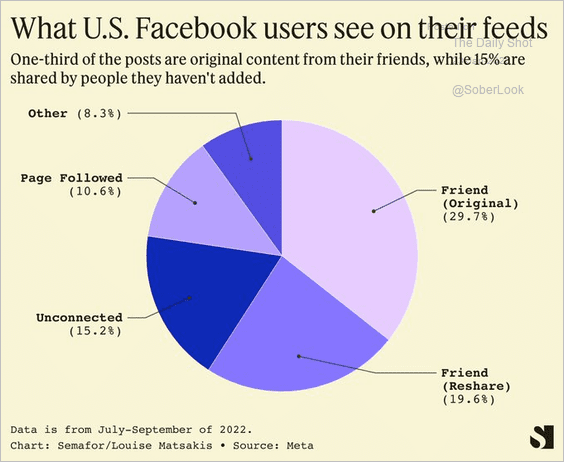 Source: @semafor
6. EV and hybrid sales:
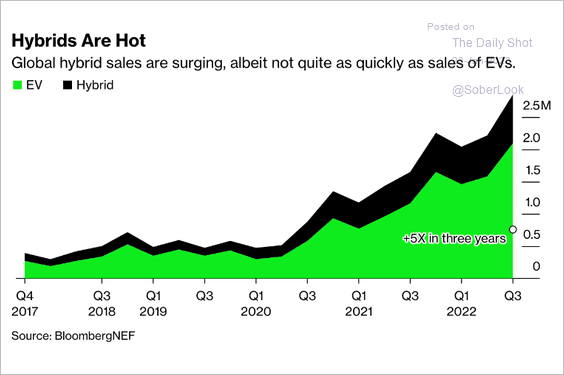 Source: @KyleStock, @business Read full article
7. The US federal budget:
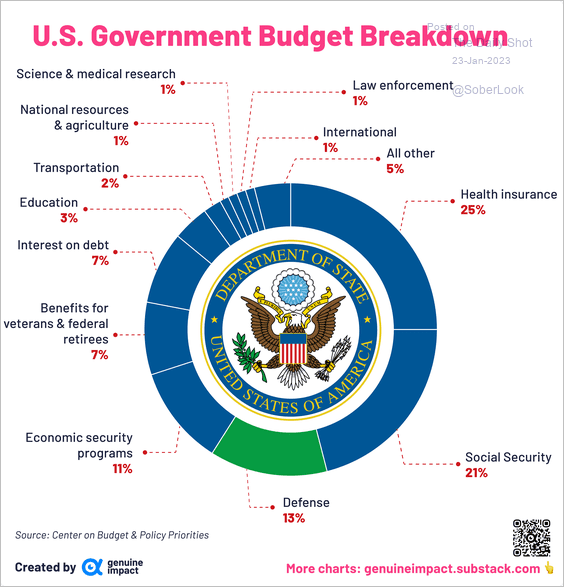 Source: @genuine_impact
8. Gym memberships, by country:
 Source: @OpenAxisHQ
Gyms per 100k people:
 Source: @OpenAxisHQ
——————–
Back to Index