
The Daily Shot: 05-Apr-23
• The United States
• Canada
• The Eurozone
• Europe
• Asia – Pacific
• Emerging Markets
• Commodities
• Energy
• Equities
• Credit
• Food for Thought
The United States
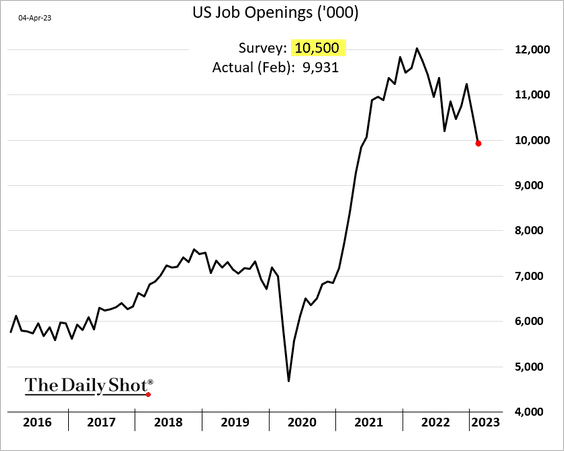
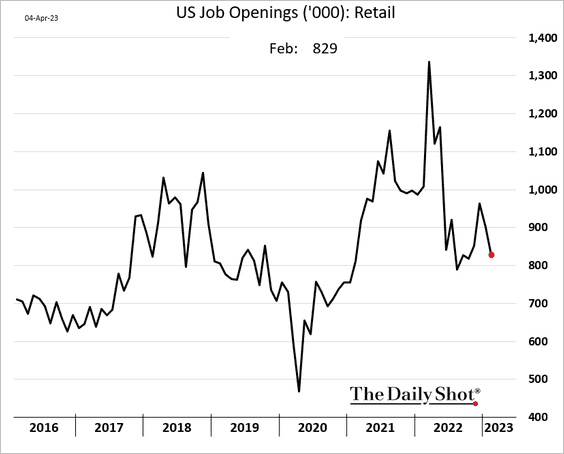
1. Job openings declined more than expected in February.
• Here are the monthly changes with contributions
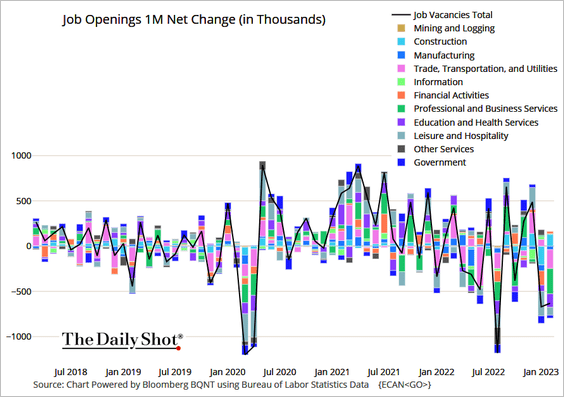 Source: @TheTerminal, Bloomberg Finance L.P.
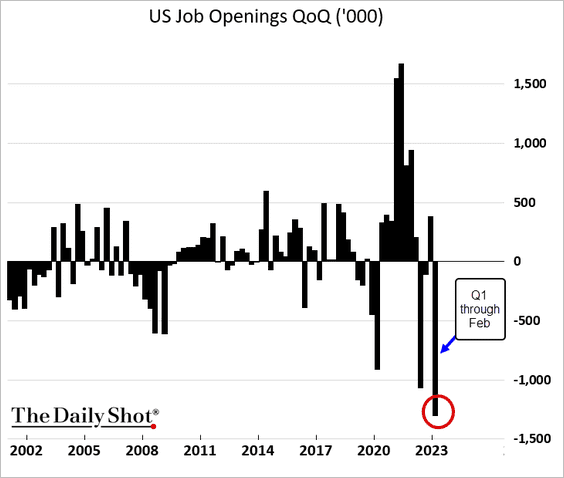
And this chart shows the quarterly changes in job openings over the past couple of decades.
• Job vacancies are now more in line with postings on Indeed.
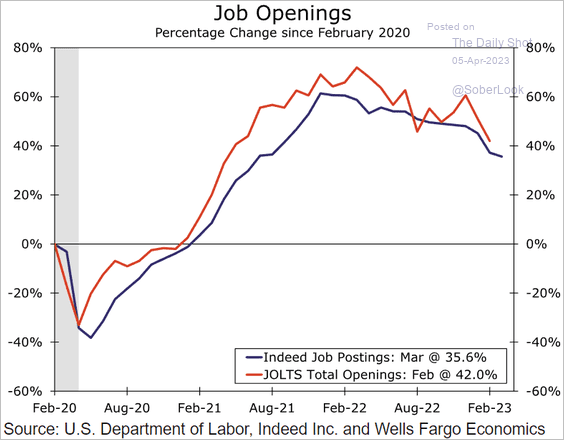 Source: Wells Fargo Securities
• Here is the number of openings per unemployed person, suggesting that the labor market imbalance persists.
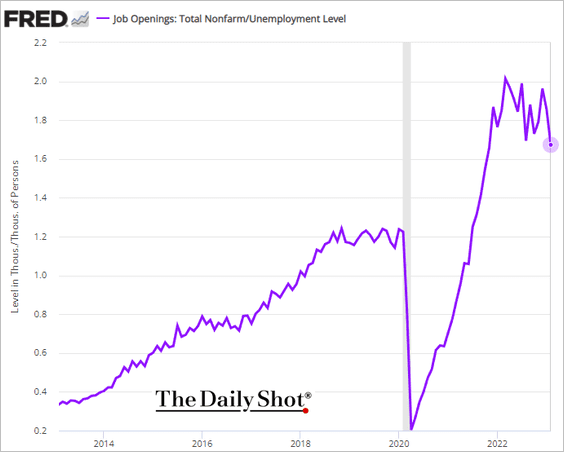
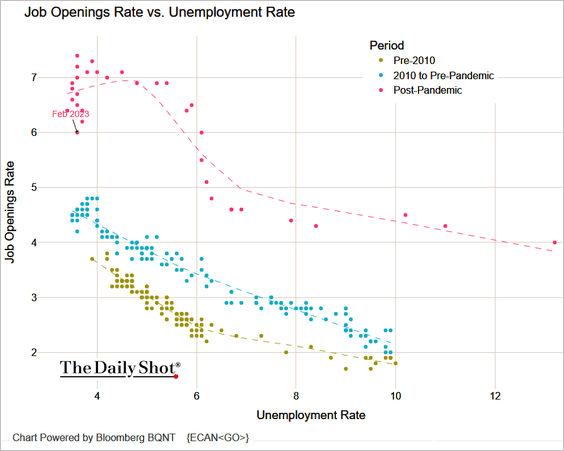
The Beveridge Curve also points to job market imbalances.
 Source: @TheTerminal, Bloomberg Finance L.P.
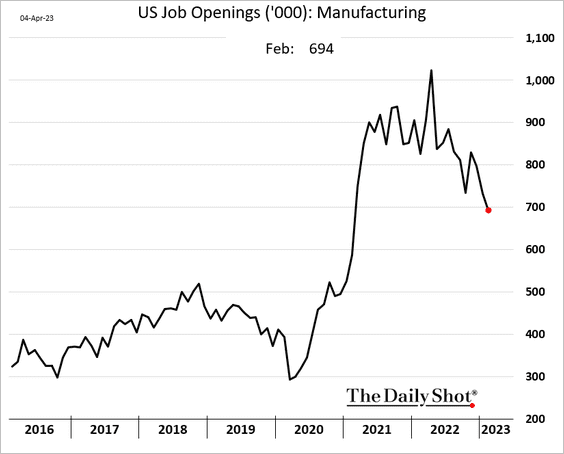
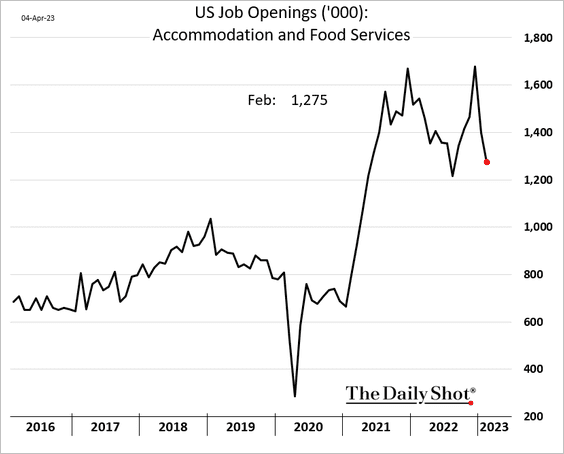
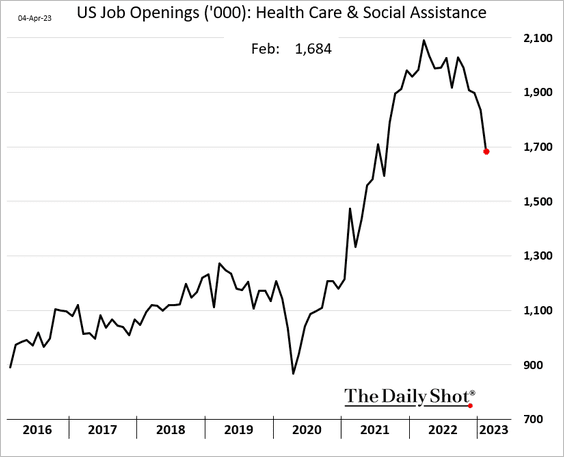
• Below are some trends by sector.
– Manufacturing:
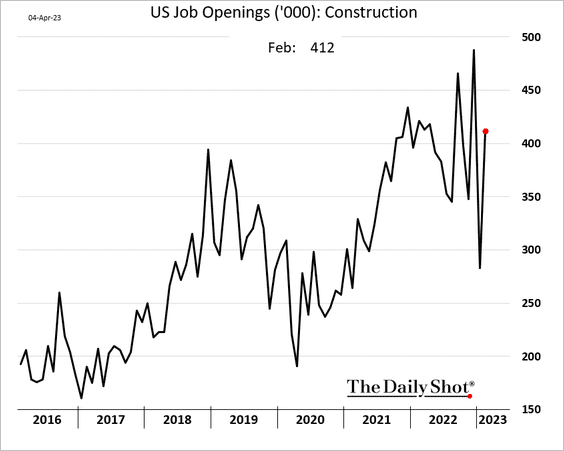
– Construction (a surprise increase):
– Retail:
– Hotels and restaurants/bars:
– Healthcare:
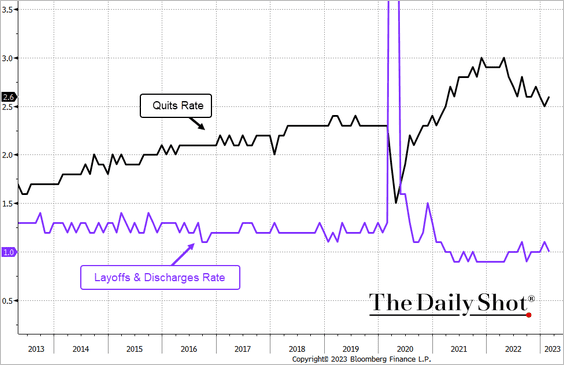
• Surprisingly, the number of voluntary resignations (quits) increased in February, signaling confidence in the job market.
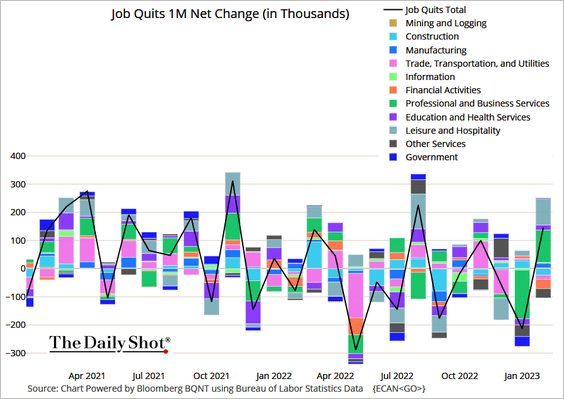 Source: @TheTerminal, Bloomberg Finance L.P.
Here are the quits and the layoffs rates.
 Source: @TheTerminal, Bloomberg Finance L.P.
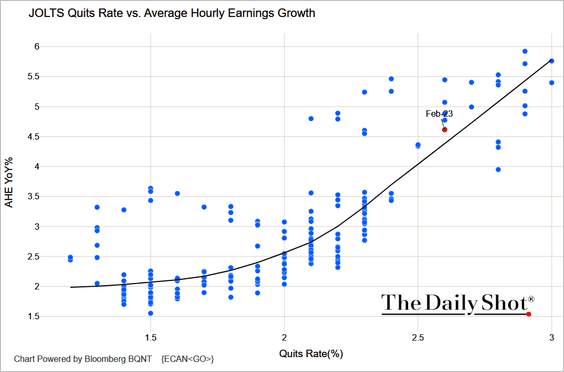
• Finally, this scatterplot shows the quits rate and wage growth.
 Source: @TheTerminal, Bloomberg Finance L.P.
——————–
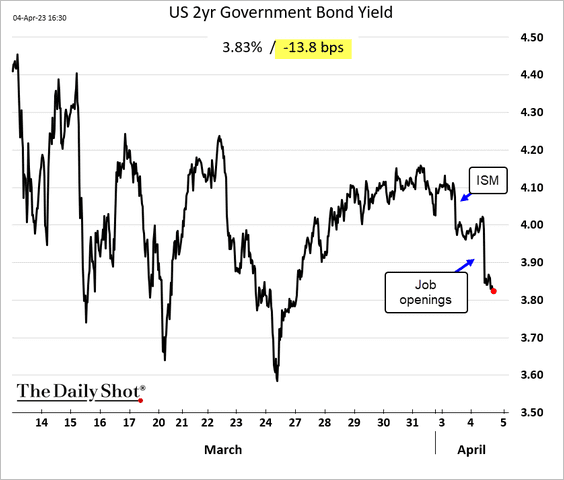
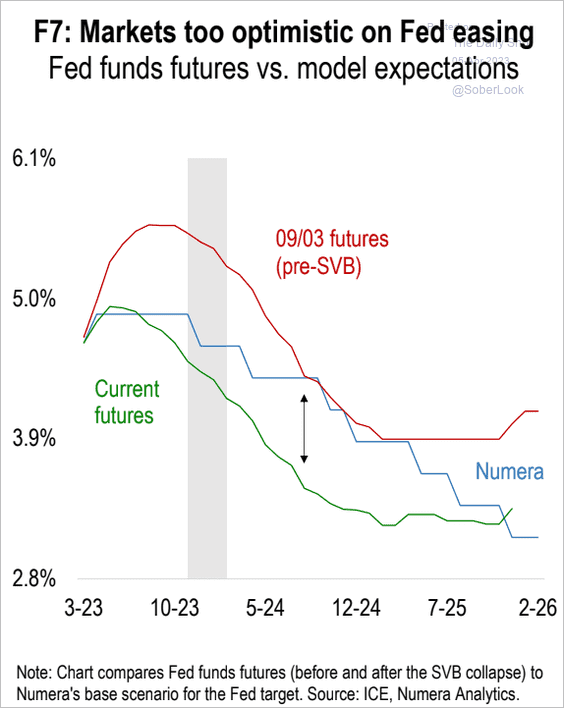
2. The faster-than-expected decline in job openings sent Treasury yields sharply lower.
• The market is pricing a faster pace of Fed rate cuts starting this summer.
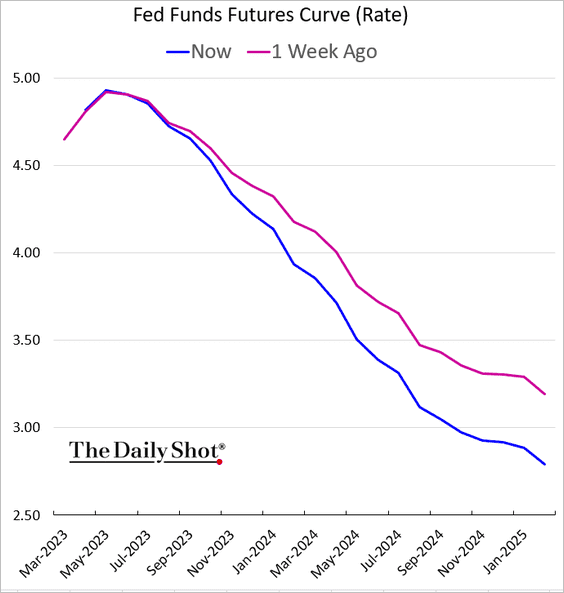
Too much enthusiasm?
 Source: Numera Analytics (@NumeraAnalytics)
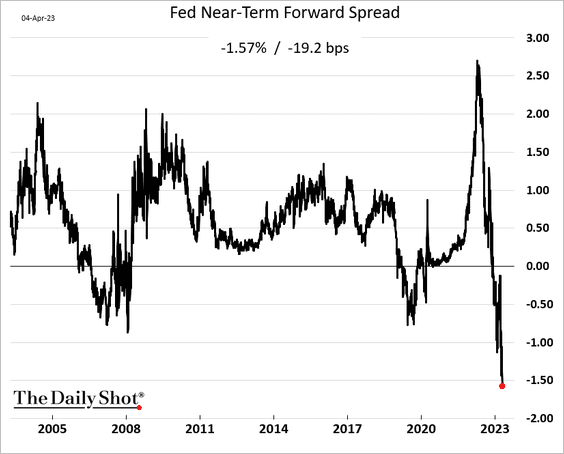
• This chart shows the near-term forward spread, the Fed’s preferred yield curve leading indicator. It is the expected three-month Treasury yield 18 months from now (market expectations) minus the current 3-month yield. Some Fed officials view this as a better indicator than the 10yr – 2yr spread (see research). The near-term forward spread is signaling a sharp economic downturn.
——————–
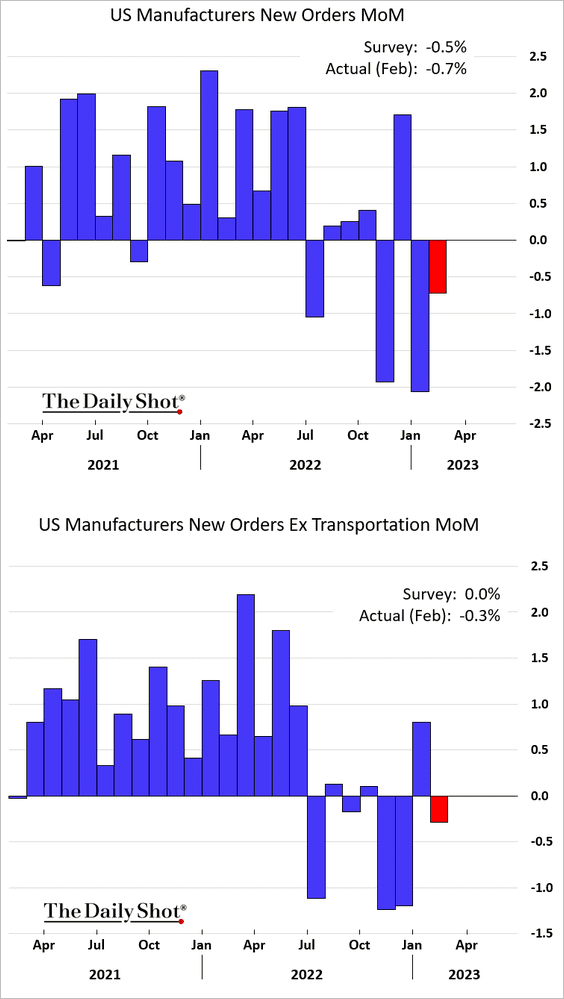
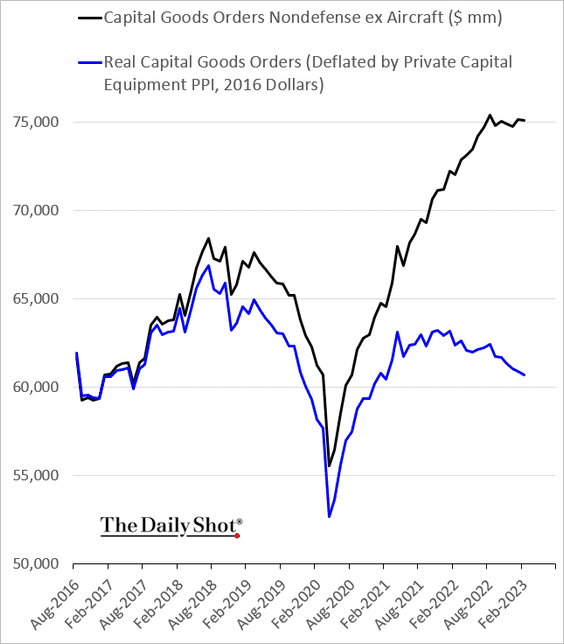
3. Factory orders declined in February.
Real capital goods orders continue to fall, signaling slowing CapEx.
——————–
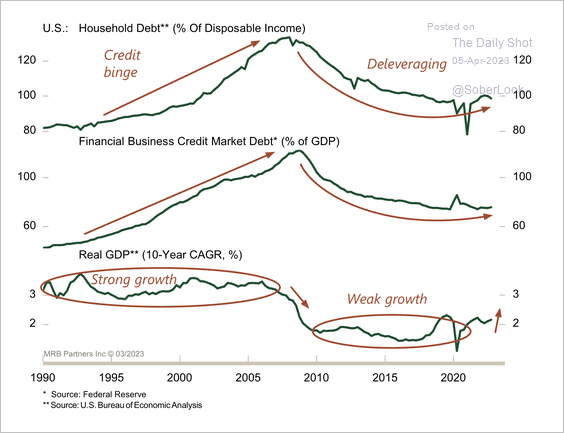
4. The economy is still coming off a long period of deleveraging following a credit binge in the 1990s/early-2000s.
 Source: MRB Partners
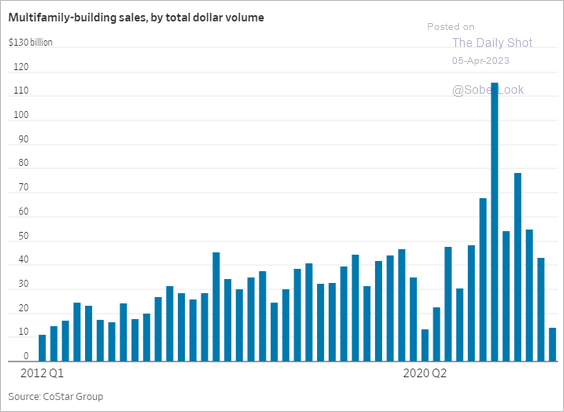
5. Multi-family (apartment) building sales are down sharply.
 Source: @WSJ Read full article
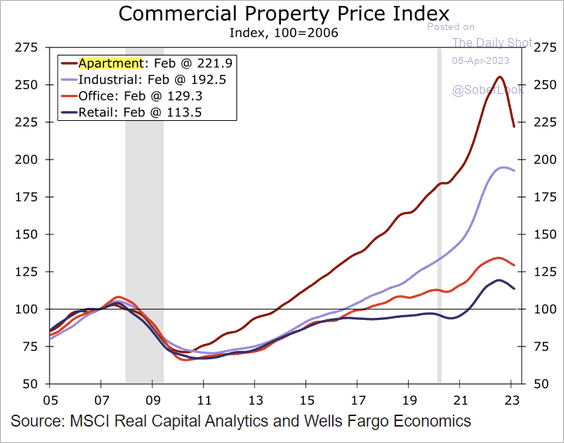
Prices have been falling recently.
 Source: Wells Fargo Securities
——————–
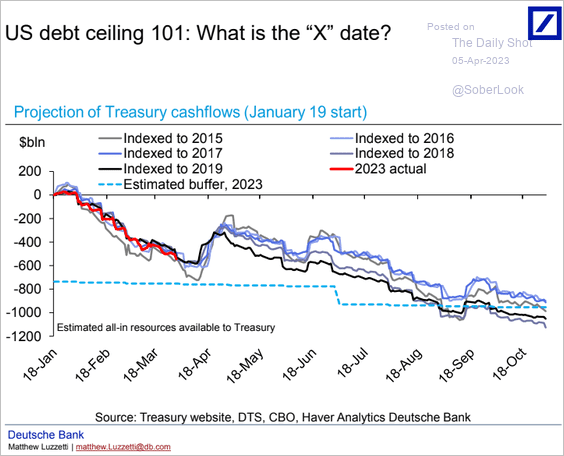
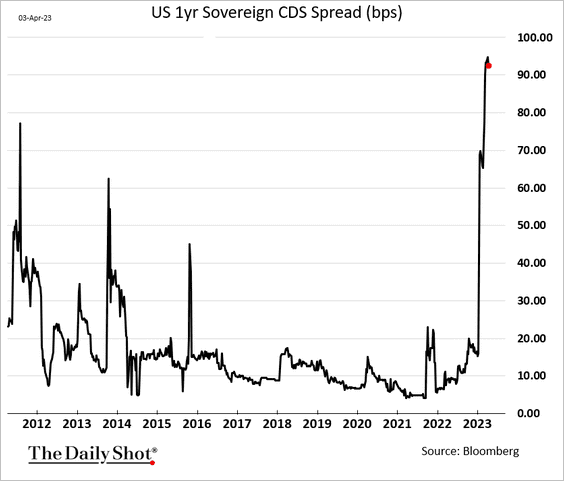
6. When is the X-date? Here are some scenarios based on the US Treasury’s cash flows in previous years.
 Source: Deutsche Bank Research
The market remains very concerned about the debt ceiling impasse.
Back to Index
Canada
1. Consumer inflation expectations are moderating.
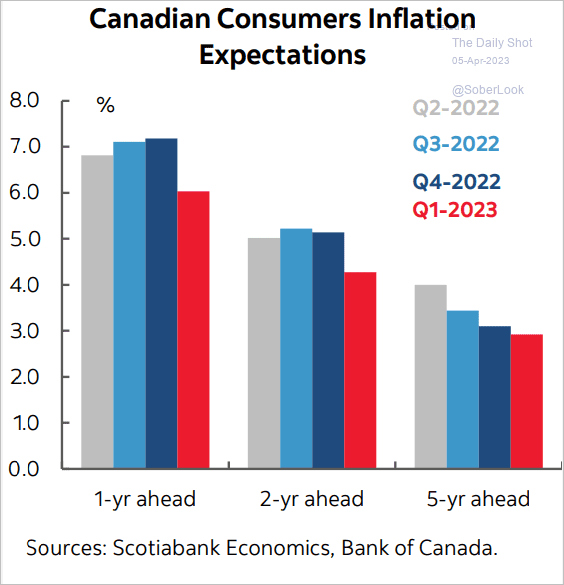 Source: Scotiabank Economics
2. Lower inflation could take the pressure off the BoC, possibly leading to a pause/pivot.
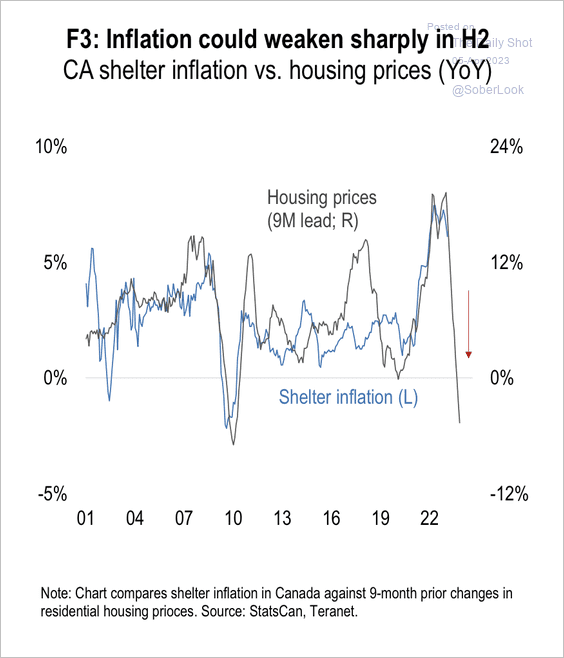 Source: Numera Analytics (@NumeraAnalytics)
3. The inverted yield curve has been a drag on financial stocks, similar to previous occurrences.
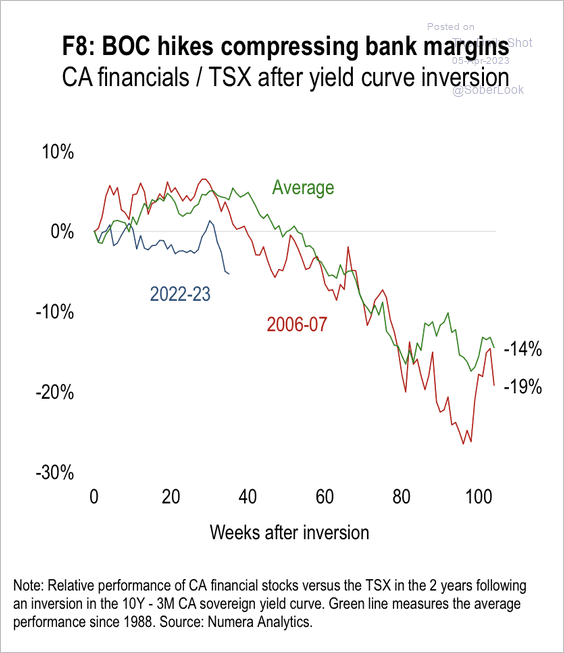 Source: Numera Analytics (@NumeraAnalytics)
4. Canadian stocks have underperformed developed market peers during the recent correction in oil prices.
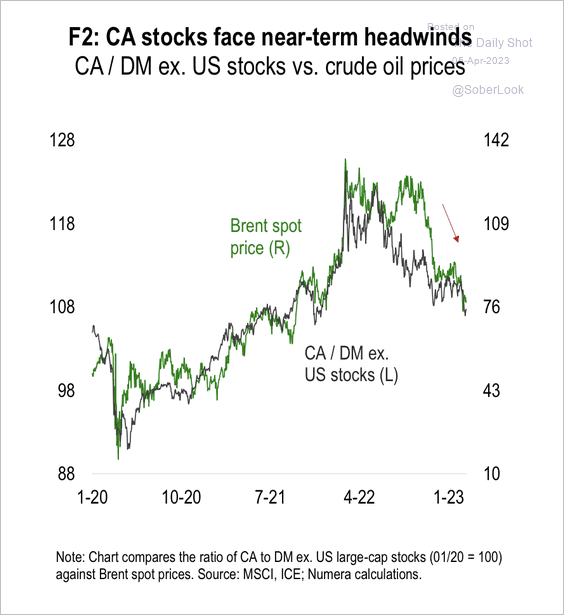 Source: Numera Analytics (@NumeraAnalytics)
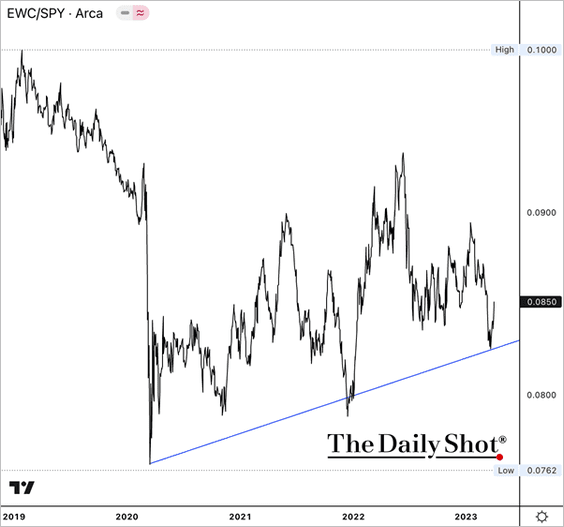
However, the iShares Canada ETF (EWC) is holding long-term support relative to the S&P 500, aided by the recent bounce in crude prices.
Back to Index
The Eurozone
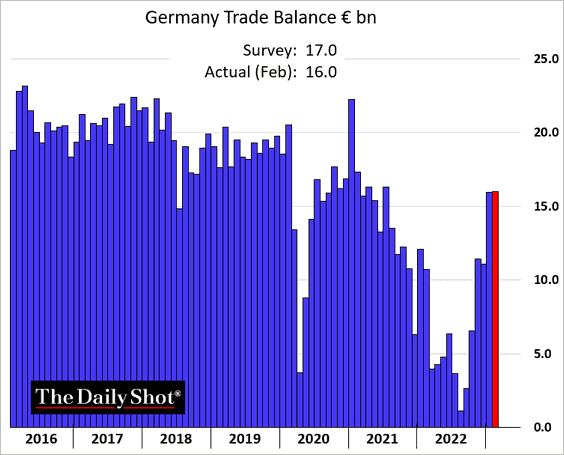
1. Germany’s trade surplus was a bit lower than expected.
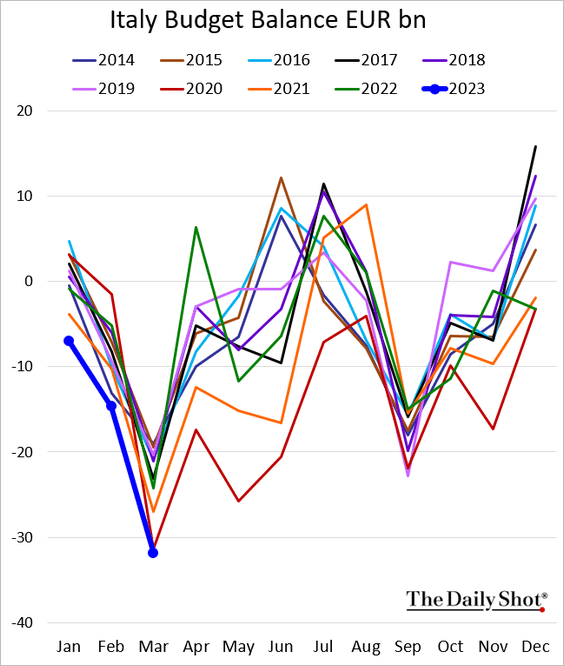
2. Italy’s budget deficit exceeded the 2020 levels in March.
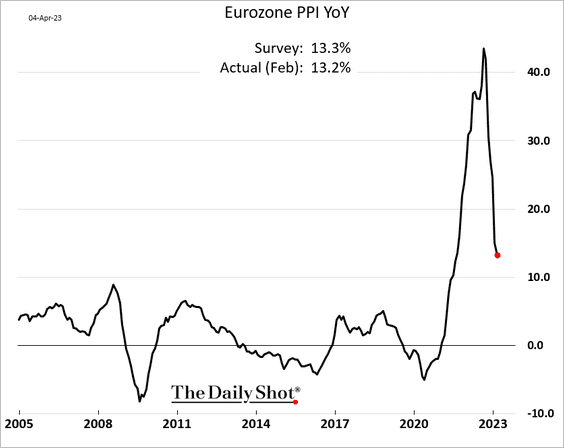
3. The euro-area PPI continues to moderate.
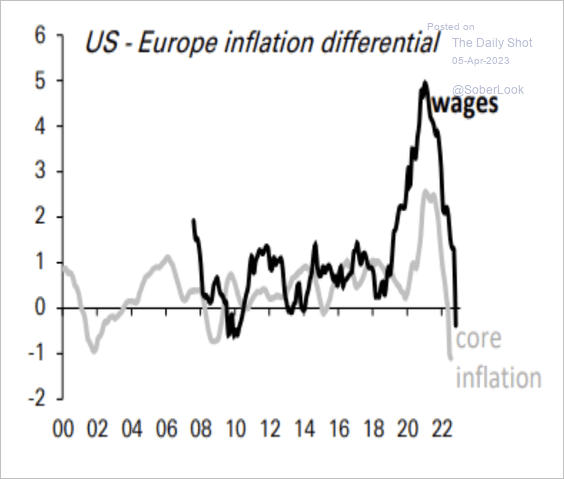
4. Wage growth and CPI are now higher in the Eurozone versus the US.
 Source: Deutsche Bank Research
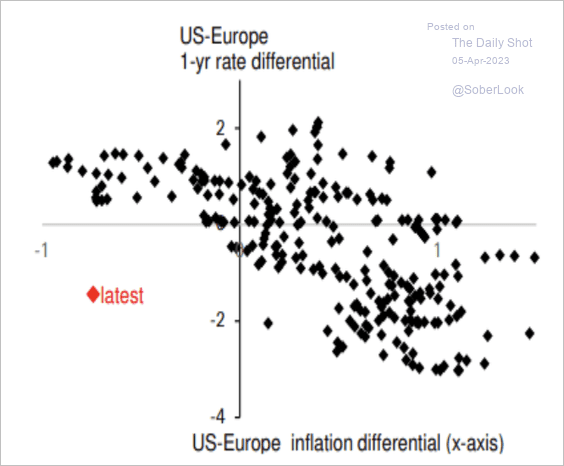
The wide gap between Europe and US inflation points to a wider interest rate differential and a higher EUR/USD.
 Source: Deutsche Bank Research
Back to Index
Europe
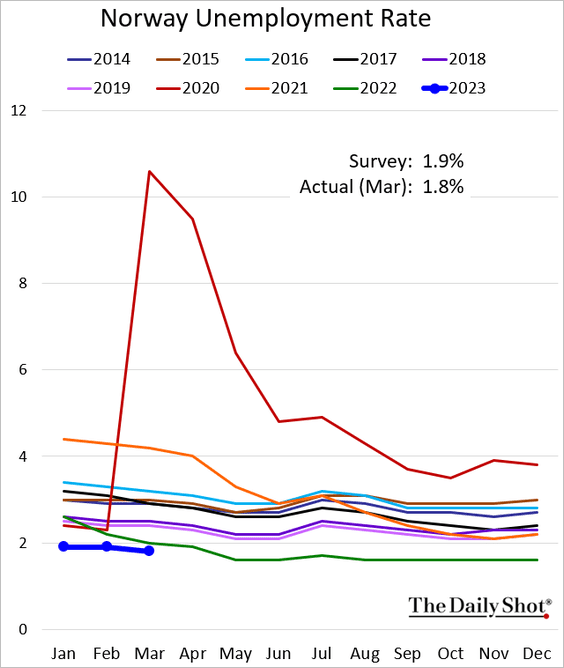
1. Norway’s unemployment rate remains very low for this time of the year.
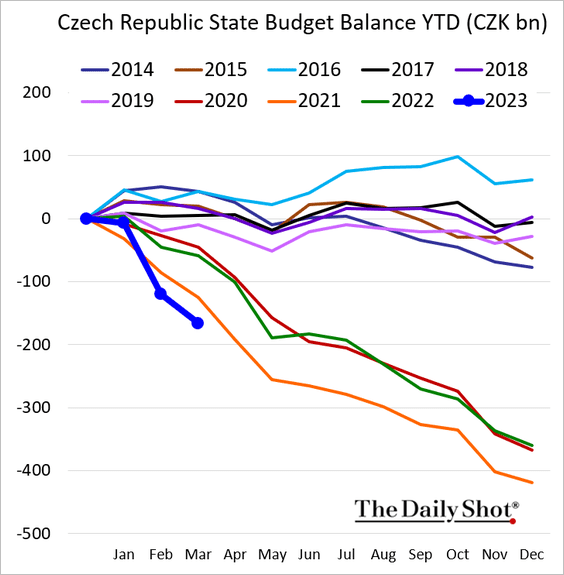
2. Here is the Czech Republic’s year-to-date budget deficit.
3. Below is a look at aviation strikes in Europe’s largest economies.
 Source: @WillWilkesNews, @tomelleryrees, @eckldorna, @bpolitics Read full article
Back to Index
Asia – Pacific
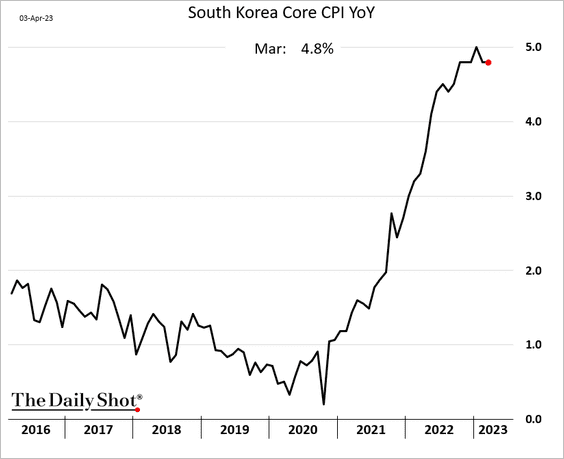
1. South Korea’s core CPI remains elevated.
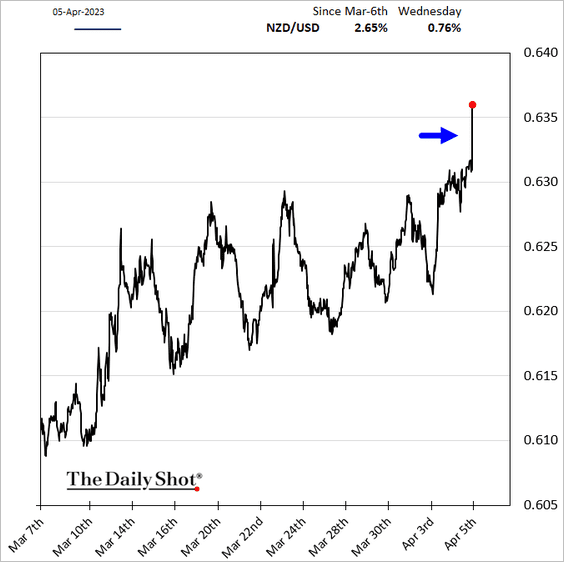
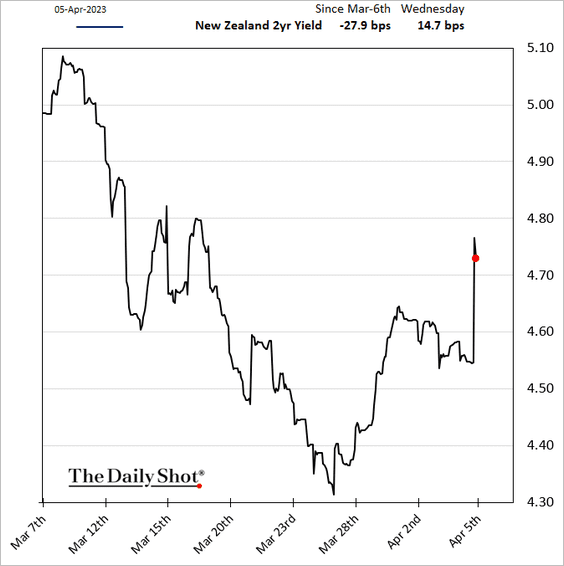
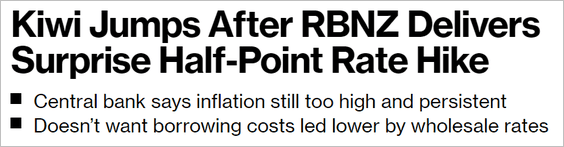
2. New Zealand’s central bank hiked rates by 50 bps, surprising the market.
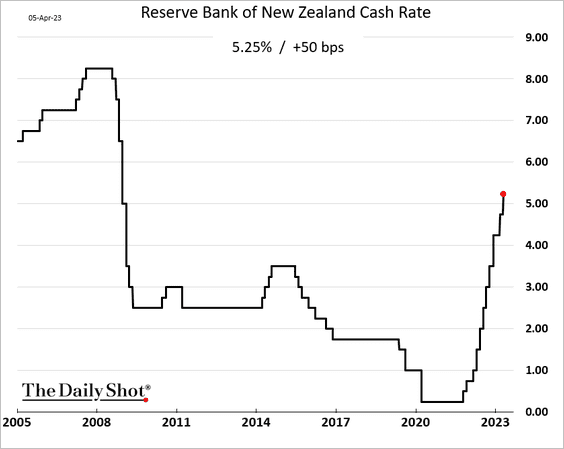
The Kiwi dollar and bond yields jumped.
 Source: @tracywwithers, @markets Read full article
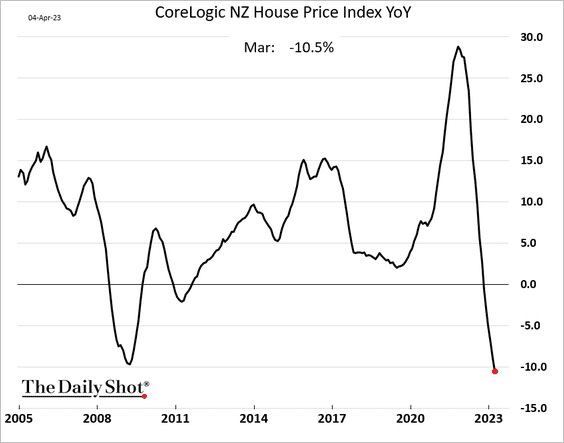
• Separately, New Zealand’s home price declines are now worse than during the GFC.
——————–
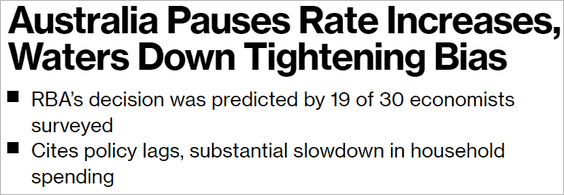
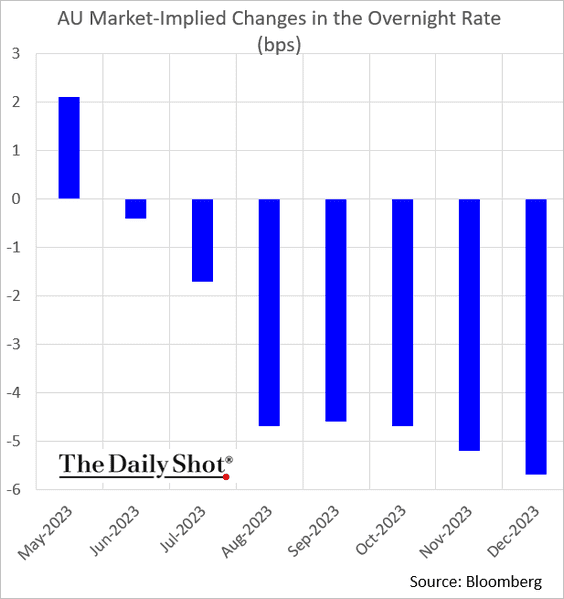
3. Australia’s central bank left rates unchanged.
 Source: @Swatisays, @economics Read full article
Some analysts still expect a rate hike in May. The market is assigning less than a 10% chance of such an outcome.
Back to Index
Emerging Markets
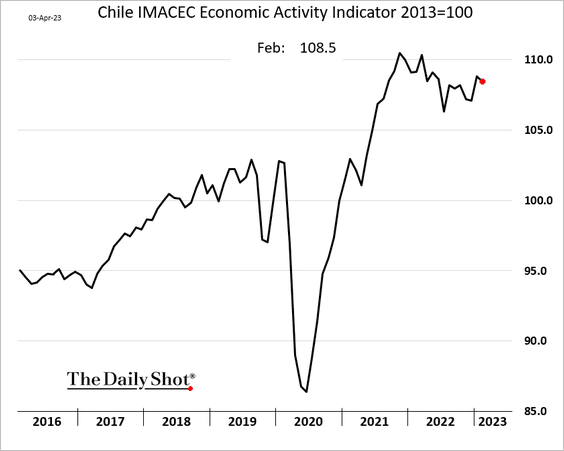
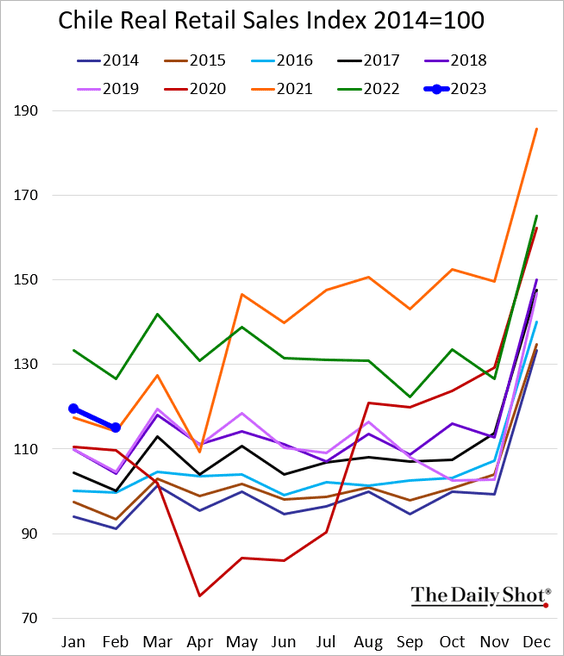
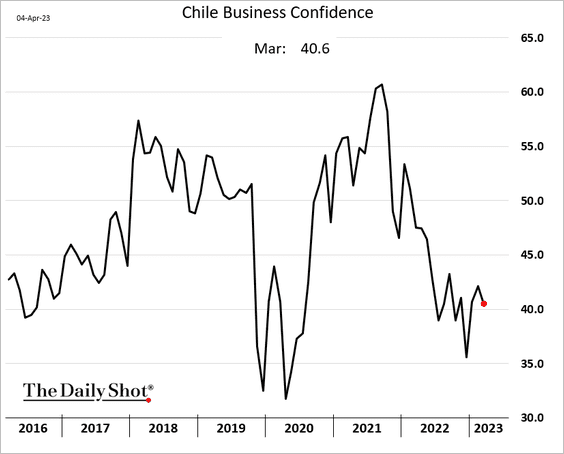
1. Let’s begin with Chile.
• Economic activity (a slight decline in February):
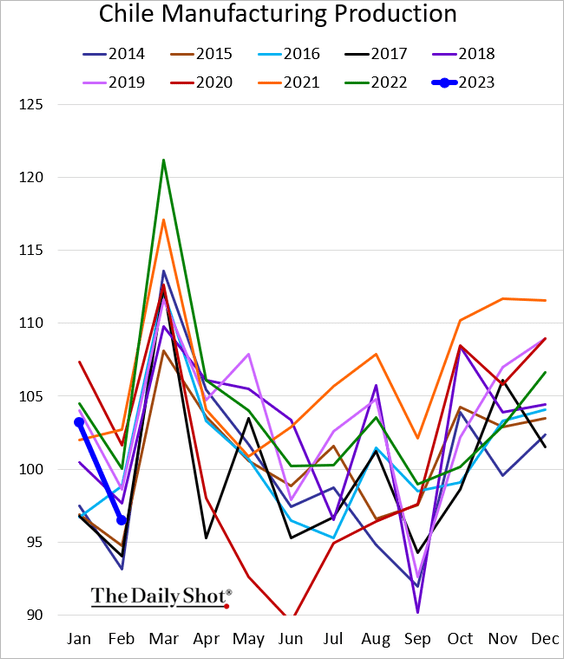
• Manufacturing production (well below last year’s levels):
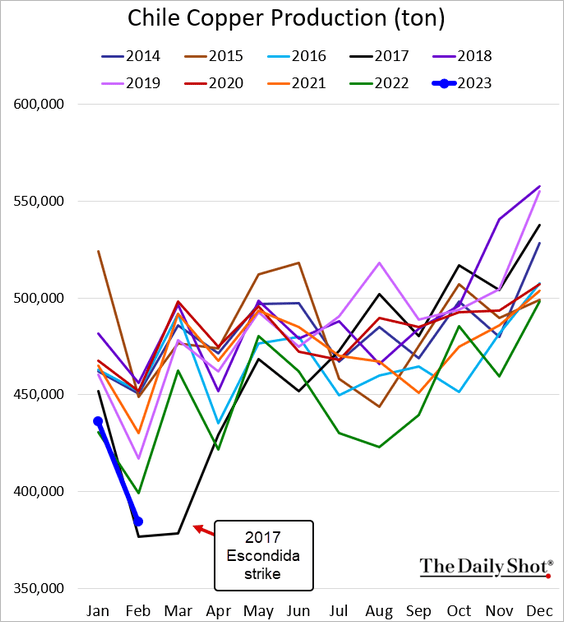
• Copper production (very soft):
• Retail sales (in line with 2021 levels):
• Business sentiment (depressed):
——————–
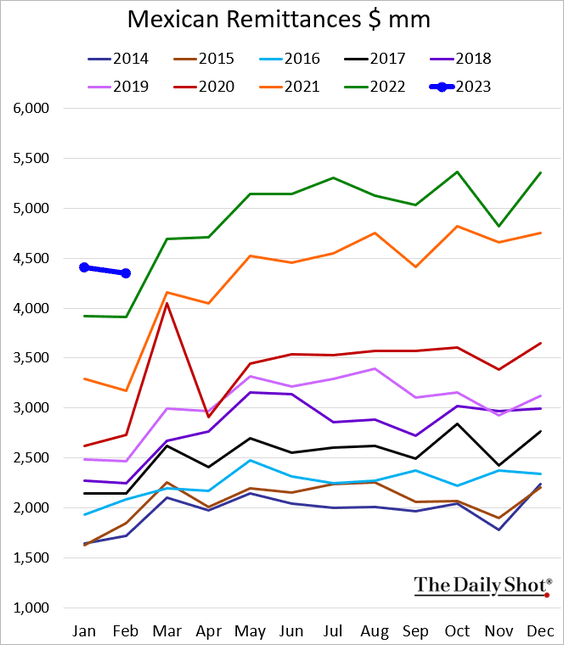
2. Mexican vehicle sales are rebounding.

Remittances remain at record highs.
——————–
3. The gap between the official and the “blue-chip” USD/ARS (Argentine peso) rates continues to widen. This trend is not sustainable (amid reduced FX reserves).
 Source: @TheTerminal, Bloomberg Finance L.P.
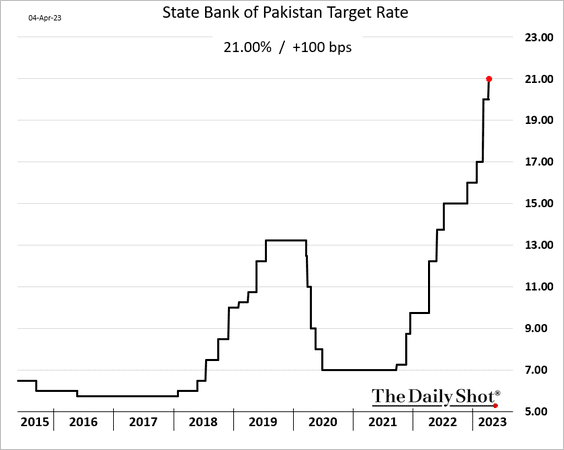
4. Pakistan’s central bank hiked rates again as inflation surges.
Back to Index
Commodities
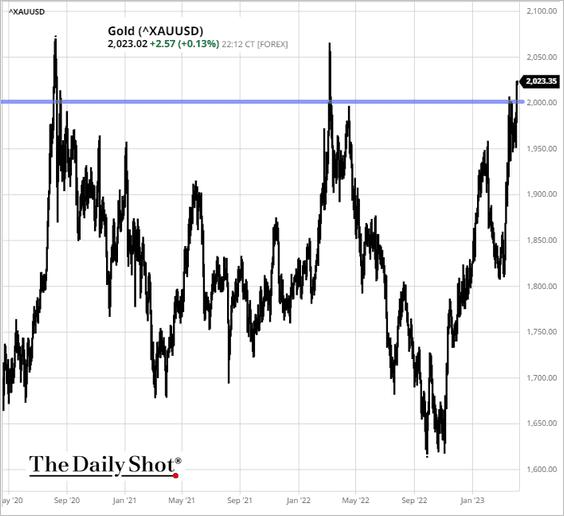
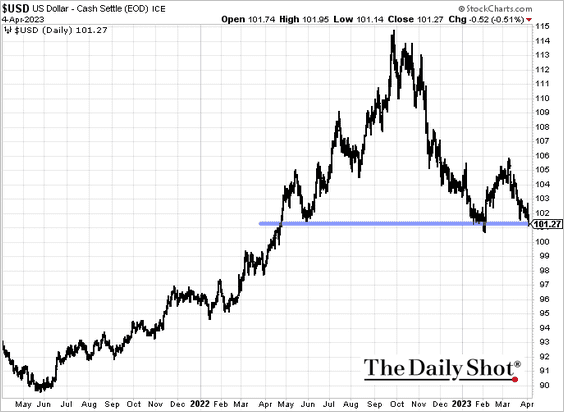
1. Gold blasted past $2,000/oz, as …
 Source: barchart.com
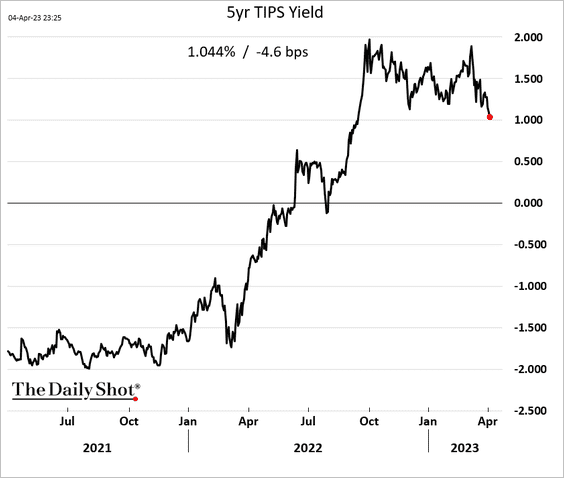
… the US dollar weakens and real yields decline.
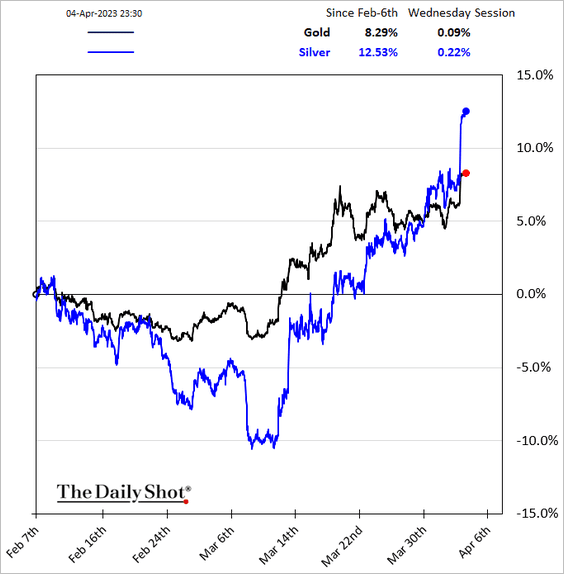
• Silver has also been surging.
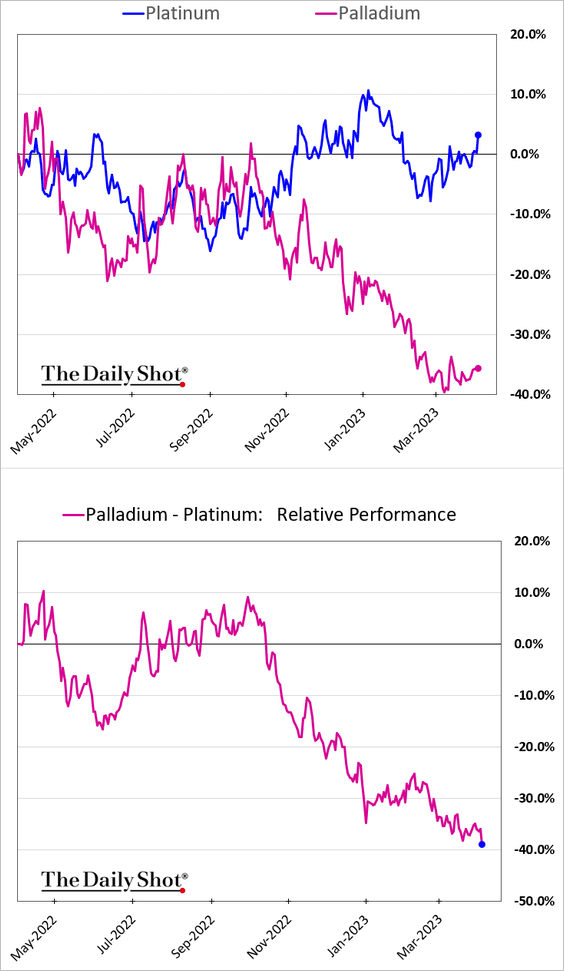
• Palladium’s underperformance widened further as platinum prices jumped.
• Oxford Economics sees gold prices retreating in the months ahead.
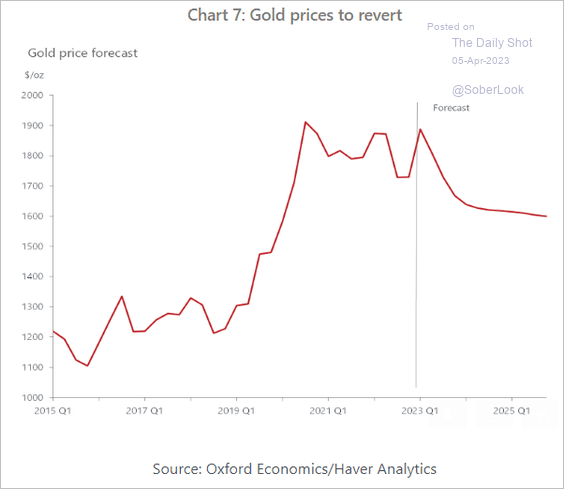 Source: Oxford Economics
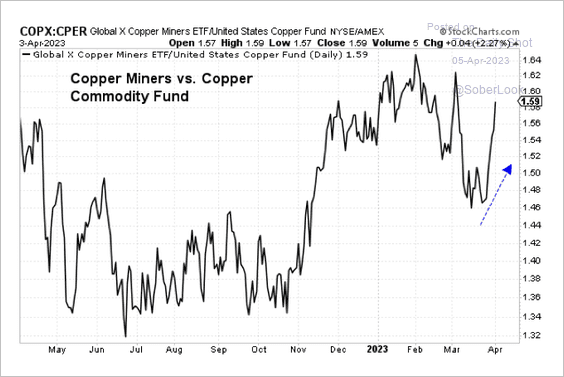
2. Gold and copper stocks have outperformed their respective physical commodity ETFs. (2 charts)
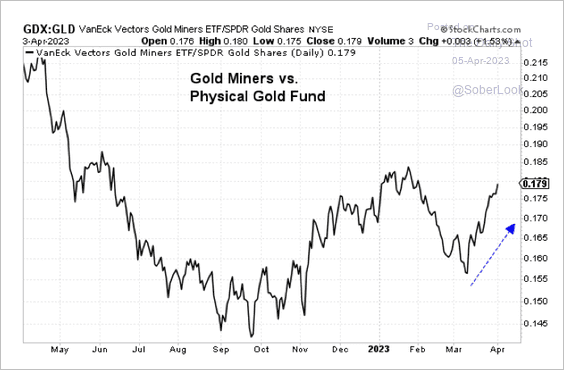 Source: Aazan Habib, Paradigm Capital
 Source: Aazan Habib, Paradigm Capital
——————–
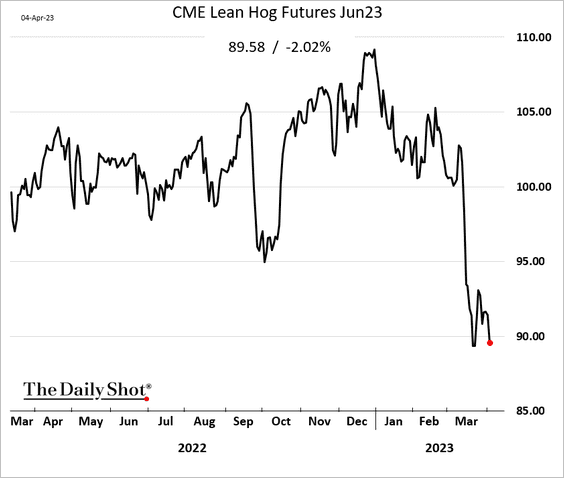
3. US hog futures remain under pressure amid ample supplies and weak cash prices.
Back to Index
Energy
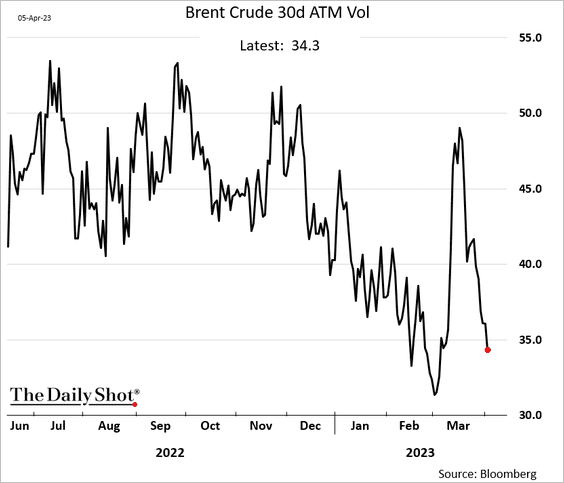
1. Despite a sharp increase in oil prices this week, oil implied vol has been declining.
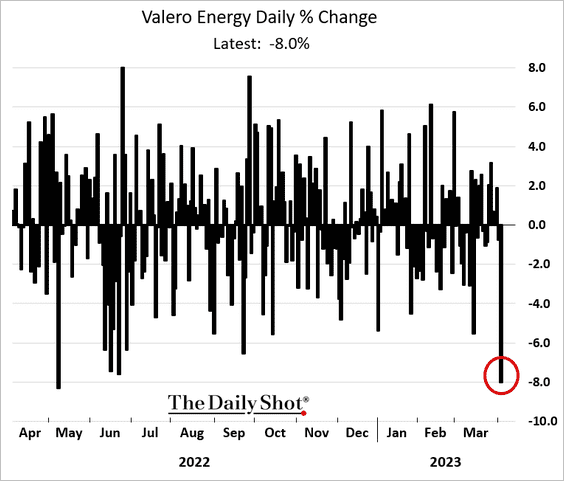
2. Crack spreads dropped this week, …
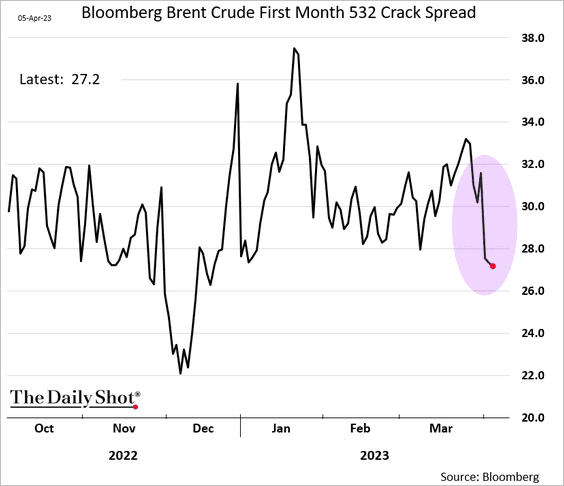
… which is a headwind for refiners.
——————–
3. Oil and gas exploration & production stocks (XOP) have underperformed crude oil (USO).
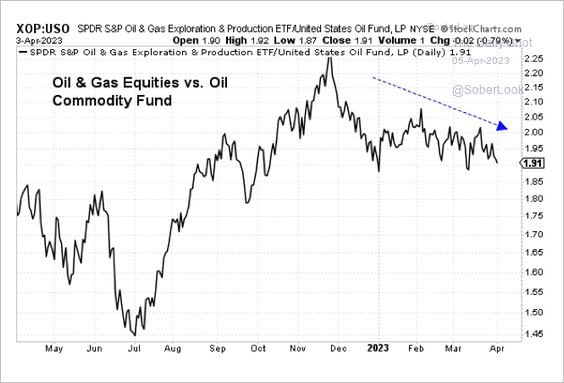 Source: Aazan Habib, Paradigm Capital
Back to Index
Equities
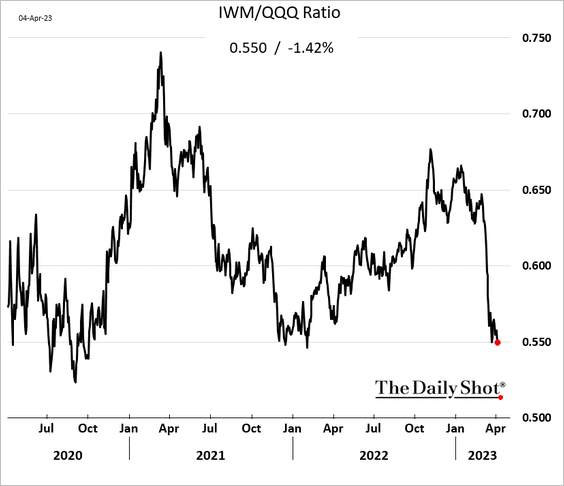
1. The recent Russell 2000 underperformance vs. the Nasdaq 100 has been remarkably rapid.
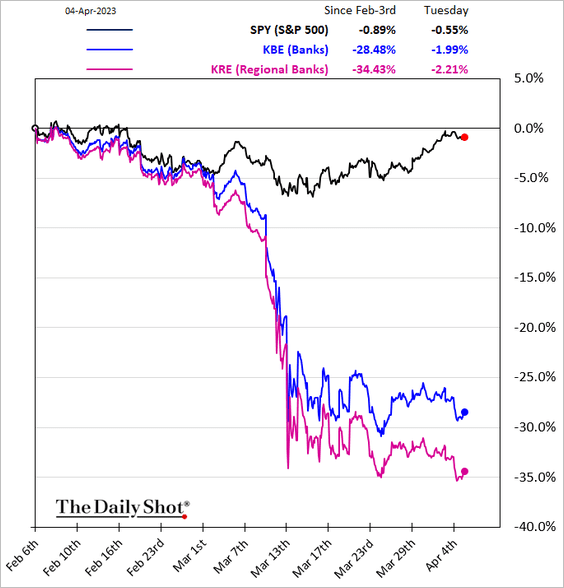
2. Bank shares continue to struggle.
• Regional banks don’t look as cheap when the price-to-book ratio is adjusted for unrealized losses.
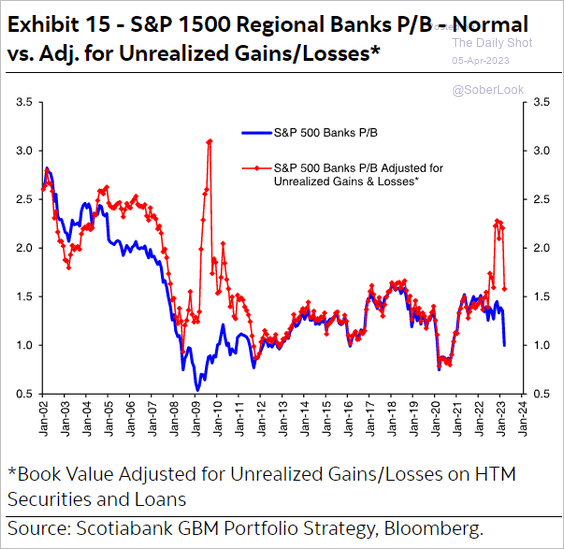 Source: Hugo Ste-Marie, Portfolio & Quantitative Strategy Global Equity Research, Scotia Capital
• Bank stocks typically outperform during the recovery phase, while insurance stocks underperform.
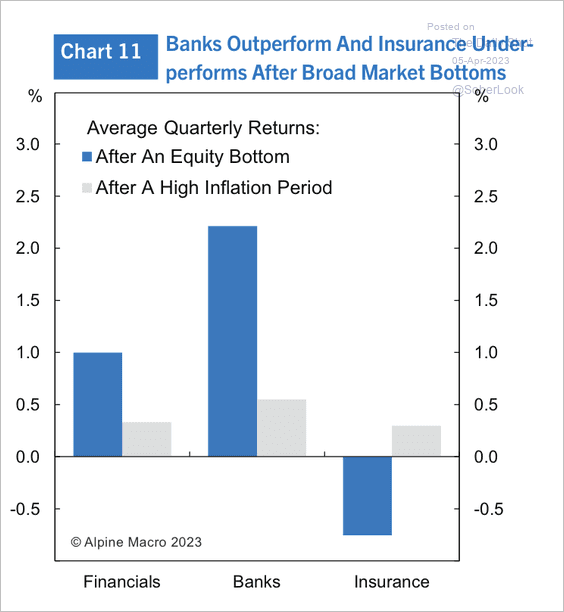 Source: Alpine Macro
——————–
3. Deutsche Bank is bullish on mega-cap stocks (MCG & Tech = “mega-cap growth and tech”).
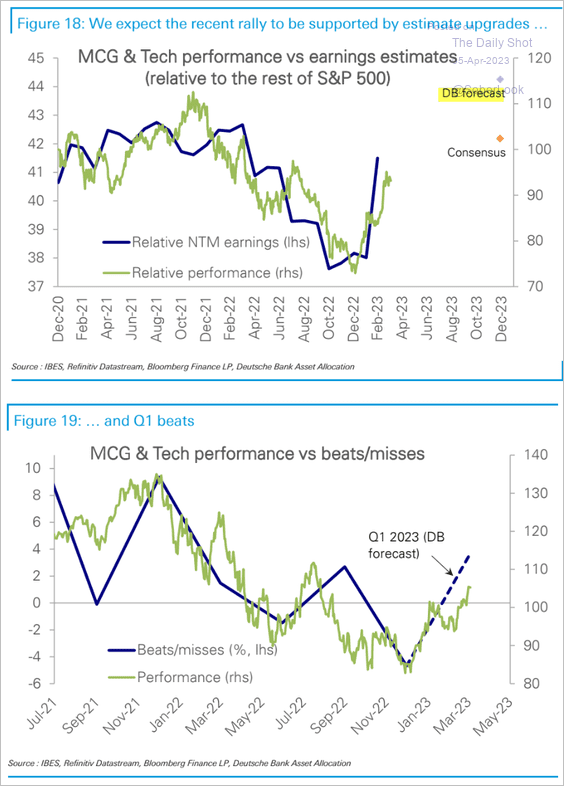 Source: Deutsche Bank Research
4. S&P 500 forward earnings have not fully priced in a recession.
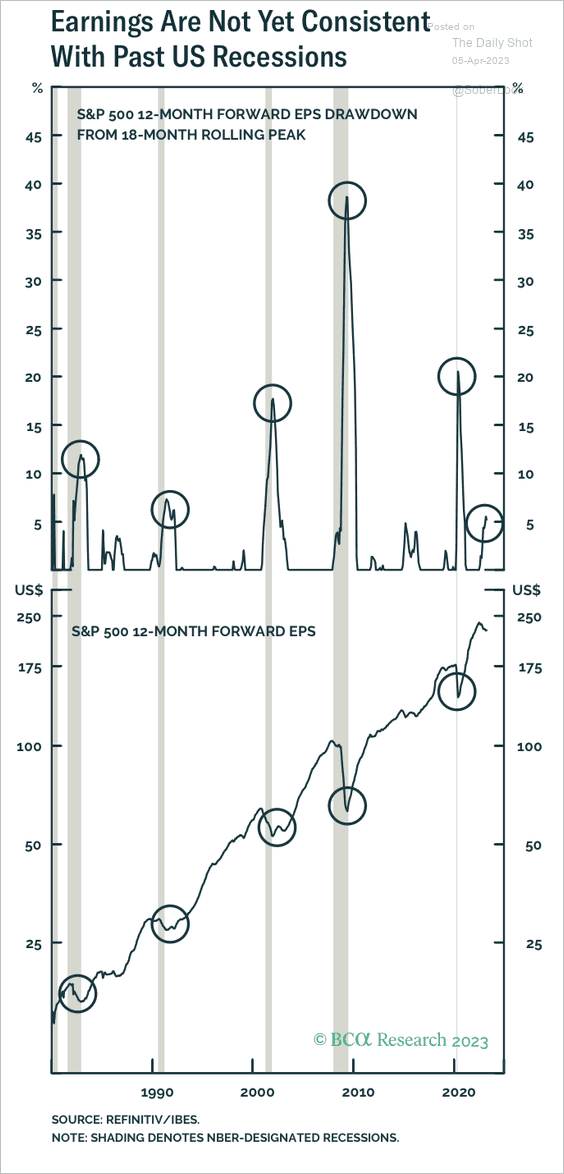 Source: BCA Research
5. Analysts continue to downgrade profit margin projections.
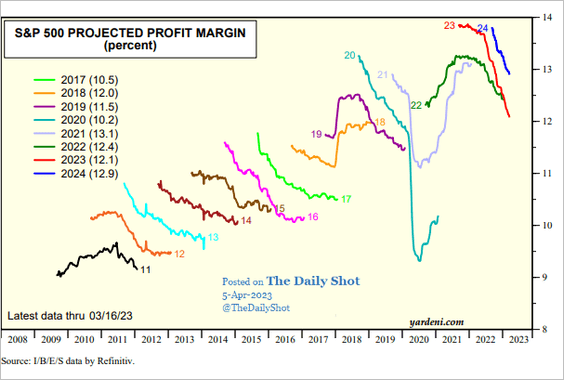 Source: Yardeni Research
Back to Index
Credit
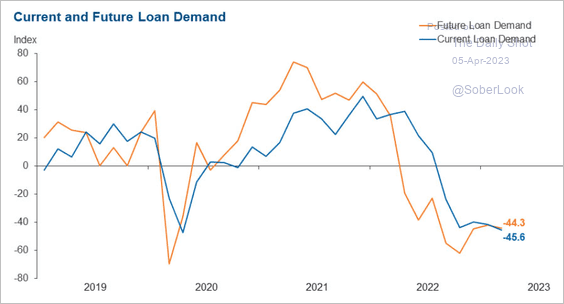
1. A survey from the Dallas Fed indicates deteriorating loan volumes and demand in March.
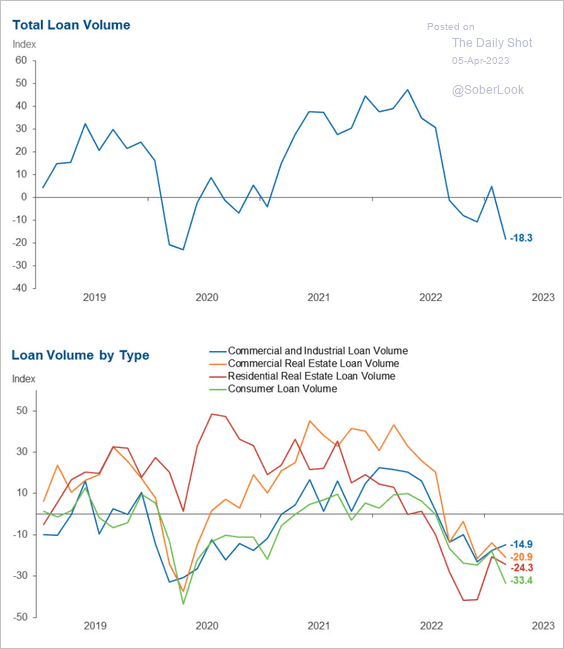 Source: Dallas Fed
 Source: Dallas Fed
——————–
2. This chart shows the evolution of the hold-to-maturity portfolios in the banking system.
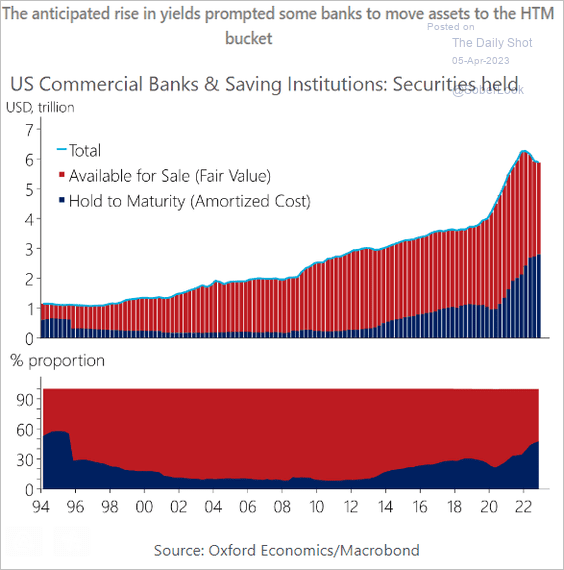 Source: Oxford Economics
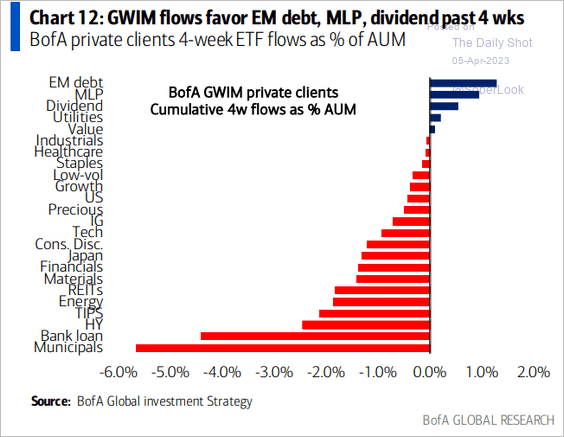
3. Leveraged loan and high-yield funds continue to see outflows.
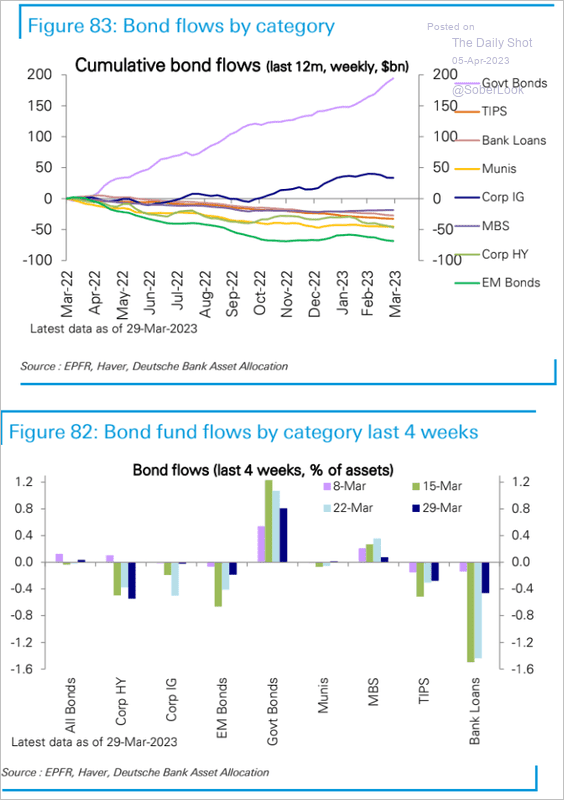 Source: Deutsche Bank Research
BofA’s private clients have also been getting out of munis.
 Source: BofA Global Research
——————–
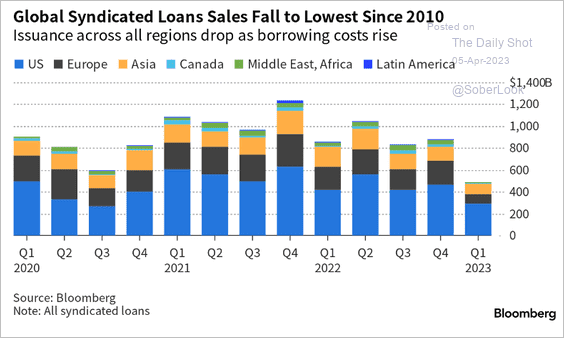
4. Leveraged loan sales slowed sharply in Q1.
 Source: Bloomberg Law Read full article
——————–
Food for Thought
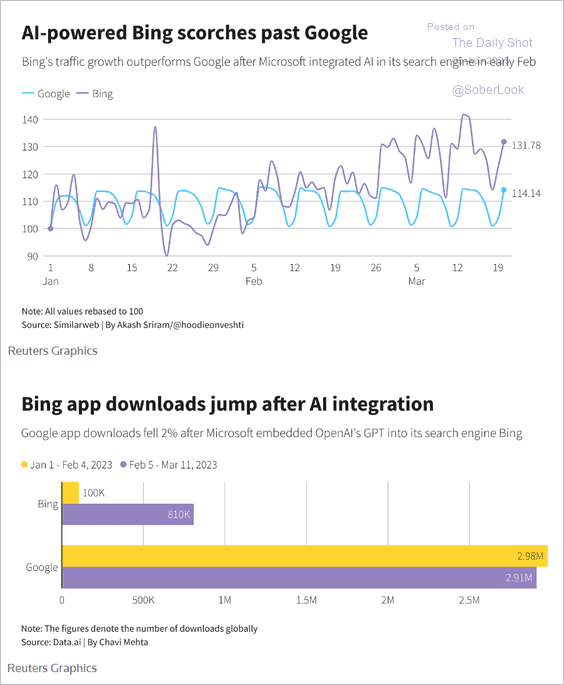
1. The AI feature helping Bing’s popularity:
 Source: Reuters Read full article
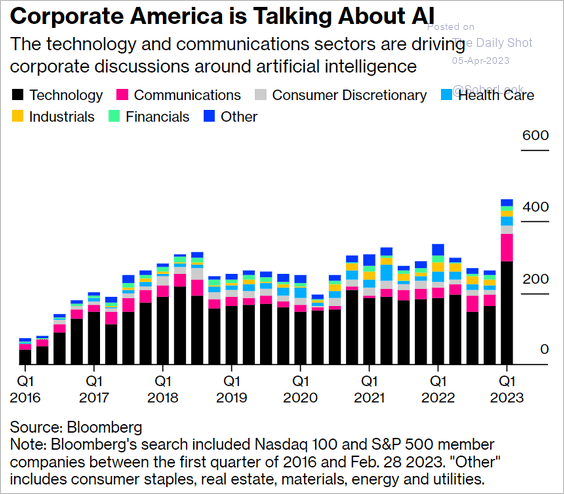
2. Companies discussing AI:
 Source: @Subrat_Patnaik, @technology Read full article
3. TikTok’s popularity with adults:
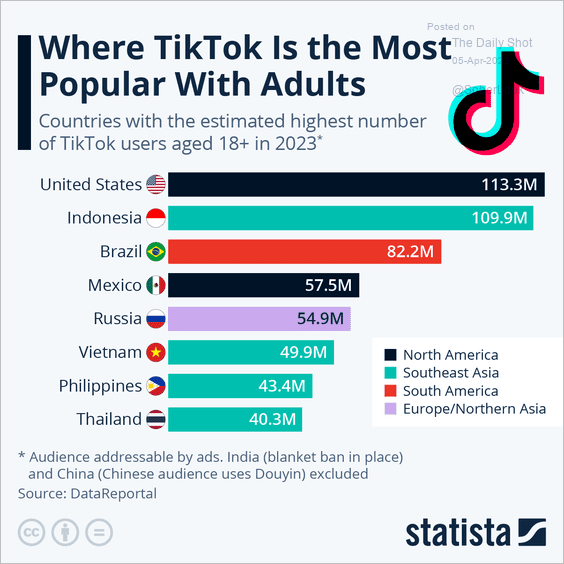 Source: Statista
4. Researching a major news event:
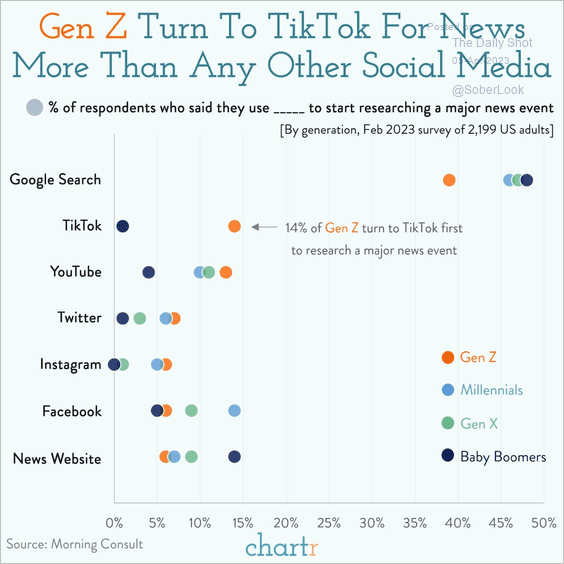 Source: @chartrdaily
5. Religious participation and “deaths of despair”:
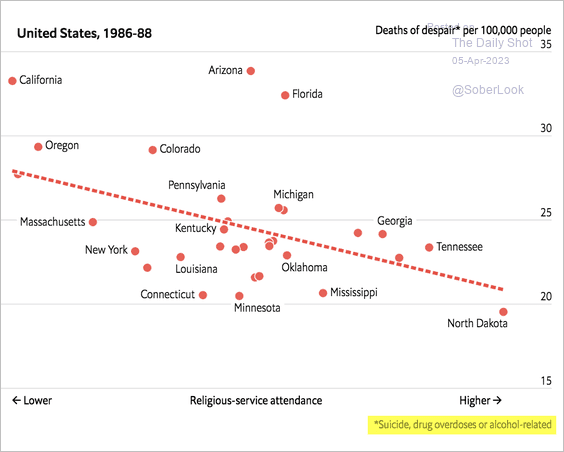 Source: The Economist Read full article
Deaths of despair over time:
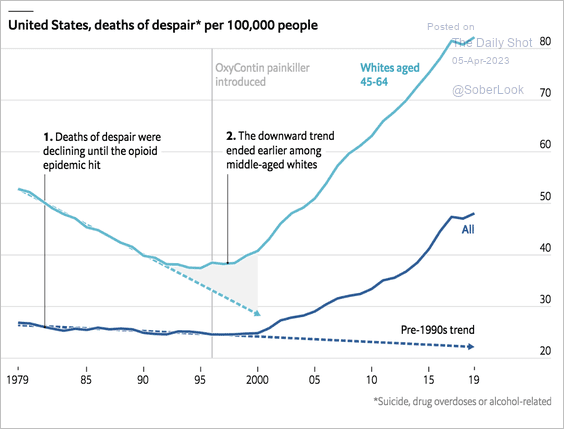 Source: The Economist Read full article
——————–
6. Projected prevalence of obesity in the US and its impact on the economy:
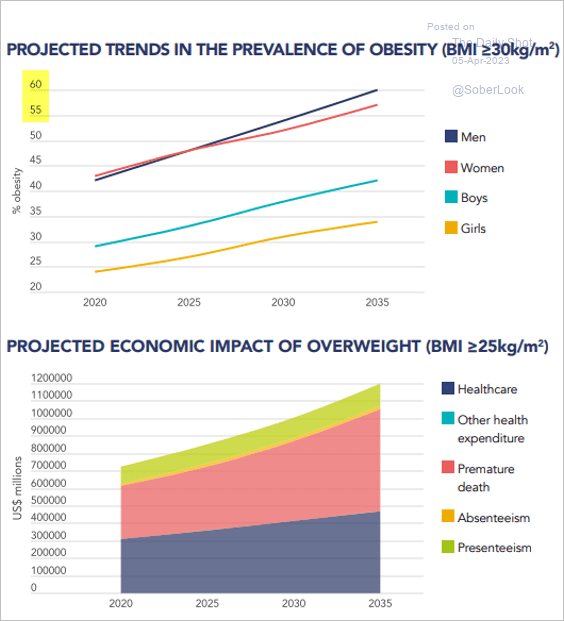 Source: World Obesity Day
7. Weeks of income needed to purchase a new vehicle in the US:
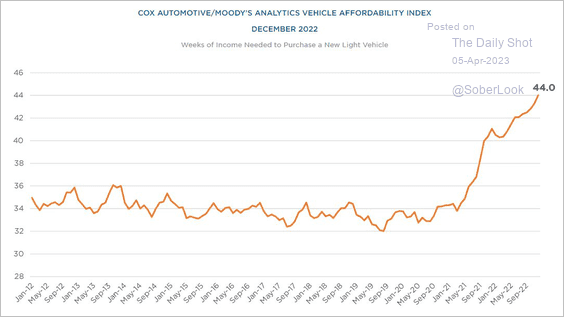 Source: @KailashConcepts, @TheStreet Read full article
8. Highest-paid actors and actresses of all time:
 Source: @genuine_impact
——————–
Back to Index