
The Daily Shot: 12-Apr-23
• The United States
• Europe
• Japan
• Asia – Pacific
• China
• Emerging Markets
• Commodities
• Energy
• Equities
• Alternatives
• Credit
• Global Developments
• Food for Thought
The United States
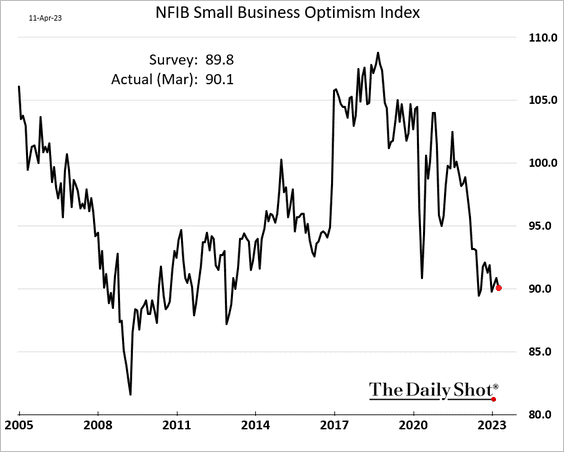
1. The NFIB small business sentiment index edged lower last month.
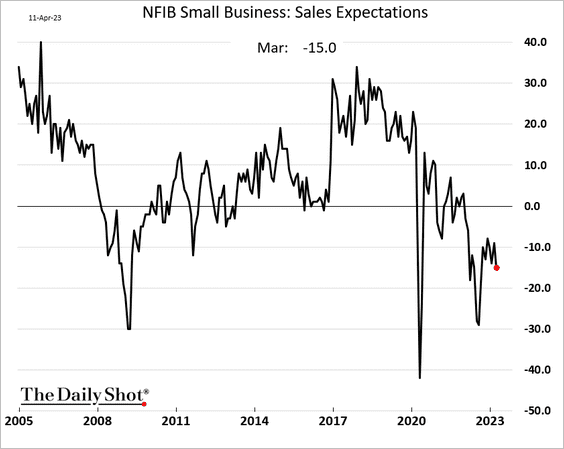
• Sales expectations remain depressed.
• The compensation plans index ticked down, …
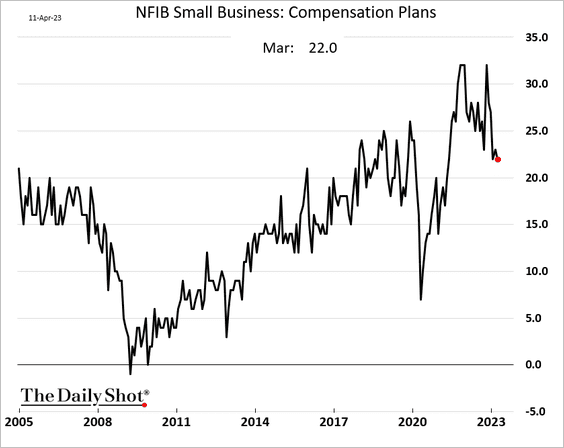
… signaling slower wage growth ahead.
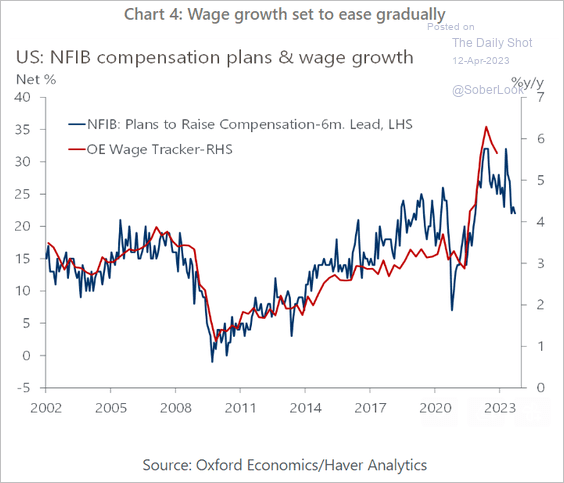 Source: Oxford Economics
• Small businesses’ weakening hiring plans are a sign of declining national payrolls growth.
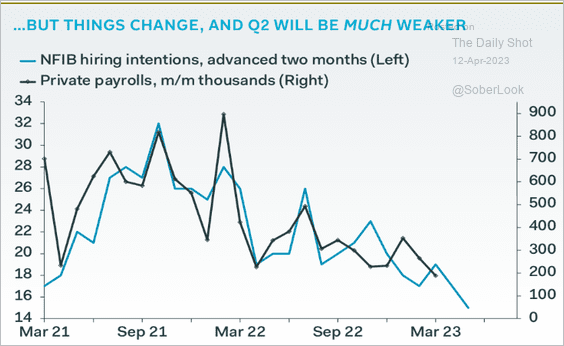 Source: Pantheon Macroeconomics
• However, many firms still can’t fill their job openings.
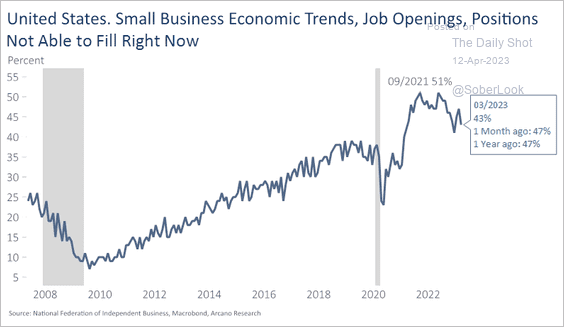 Source: Arcano Economics
• The price plans indicator points to softer inflation ahead.
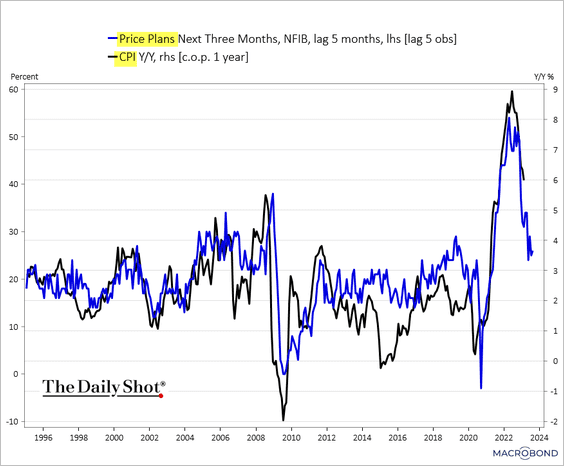 Source: Chart and data provided by Macrobond
• Small firms’ CapEx plans signal sharp declines in business investment going forward.
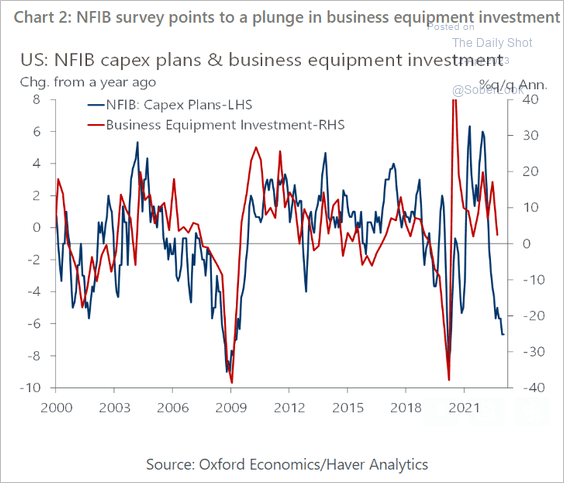 Source: Oxford Economics
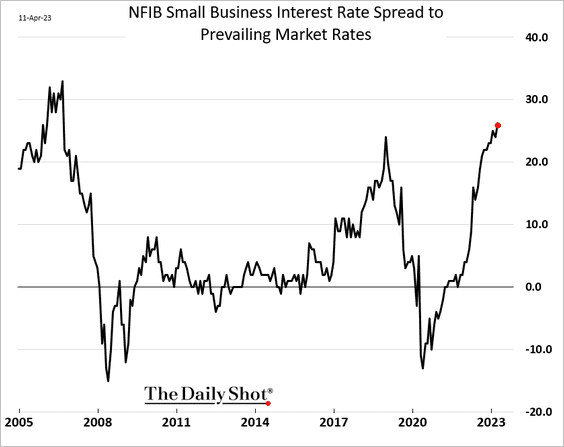
• The most striking change in the NFIB report was the deterioration in credit conditions in March.
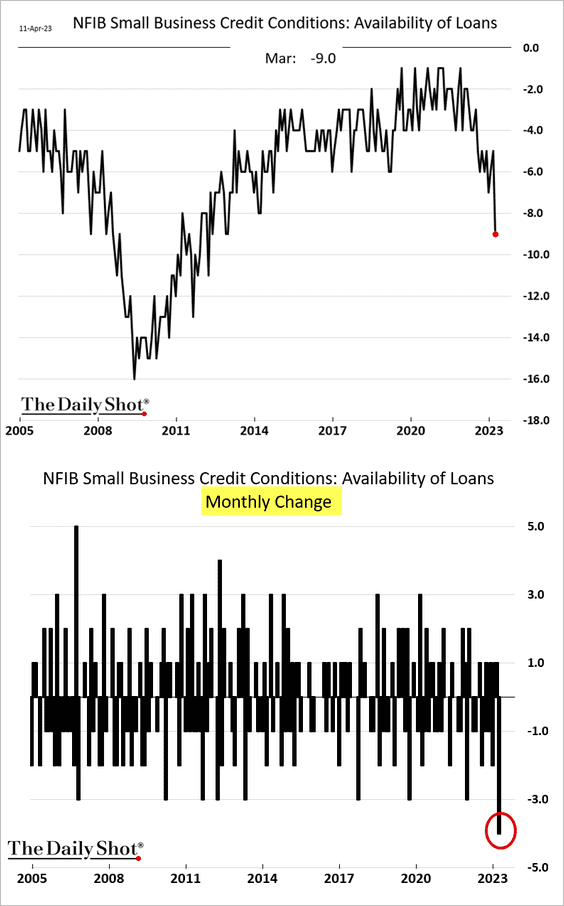
Small firms are increasingly paying above-market rates on loans.
——————–
2. Next, we have some updates on the labor market.
• Here are the changes in US payrolls by sector (2 charts).
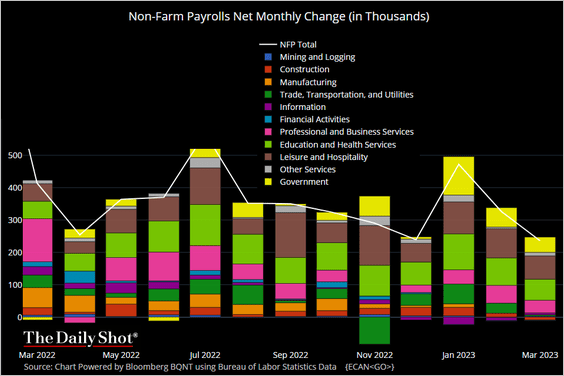 Source: @TheTerminal, Bloomberg Finance L.P.
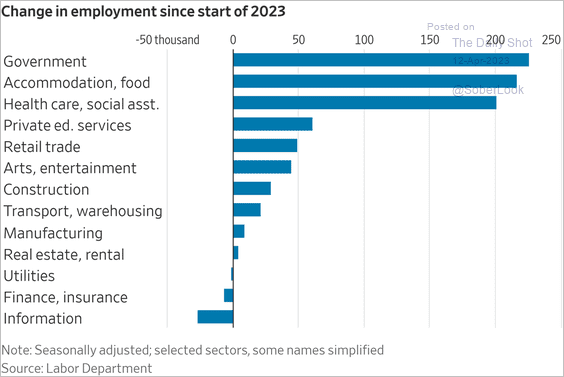 Source: @WSJ Read full article
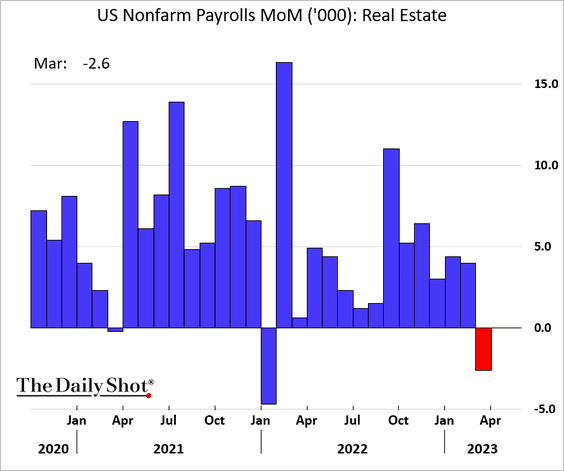
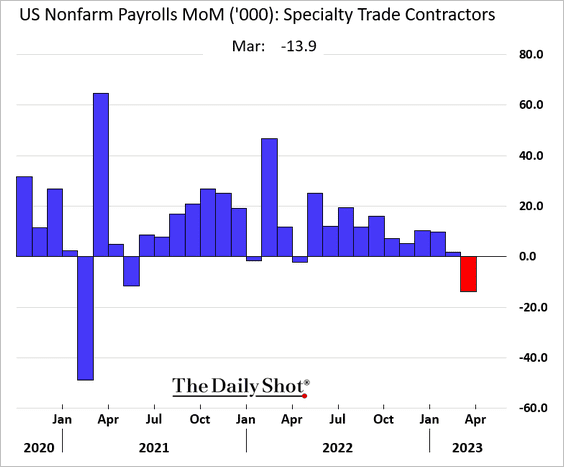
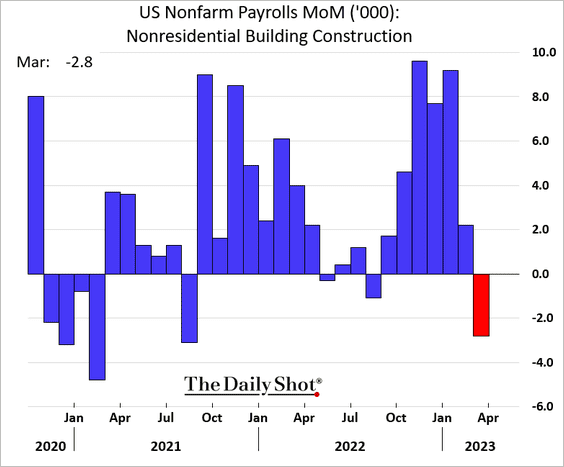
• Real estate and related sectors are seeing a pullback in hiring (3 charts).
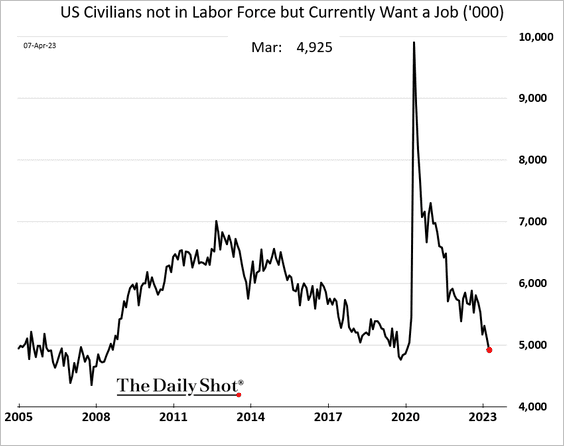
• The number of Americans on the sidelines who would like a job is near pre-COVID lows.
• The number of multiple jobholders continues to climb.
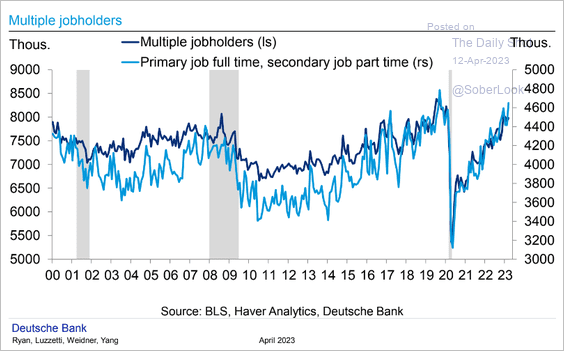 Source: Deutsche Bank Research
 Source: MarketWatch Read full article
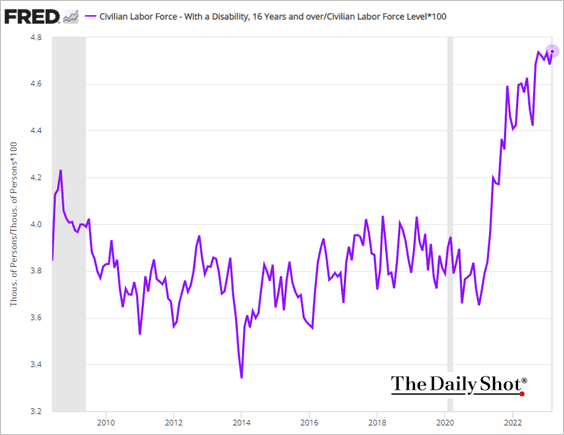
• Here are some additional trends from the jobs report.
– Rising labor force participation among Americans with disabilities:
– Full- vs. part-time employment:
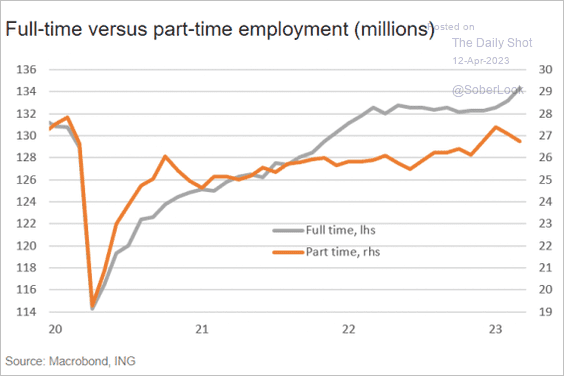 Source: ING
– Employment by earnings tier:
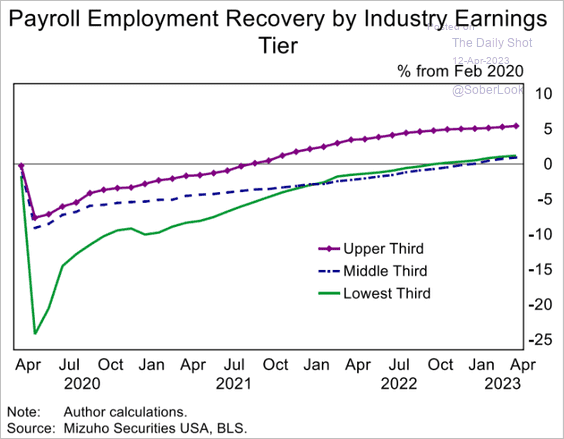 Source: Mizuho Securities USA
– The geographic labor market mismatch:
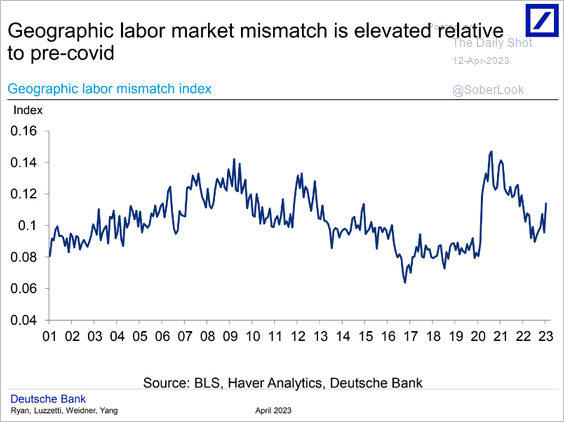 Source: Deutsche Bank Research
– The jobs/workers gap has been shrinking. Here are the contributions.
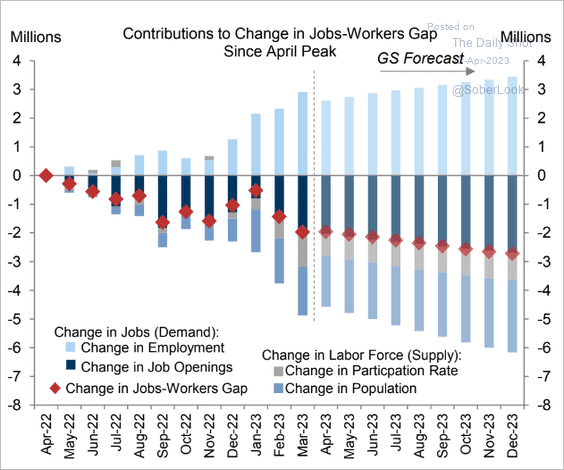 Source: Goldman Sachs
– The Phillipps Curve:
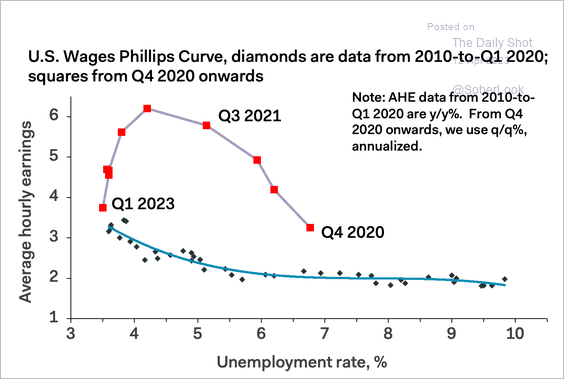 Source: Pantheon Macroeconomics
——————–
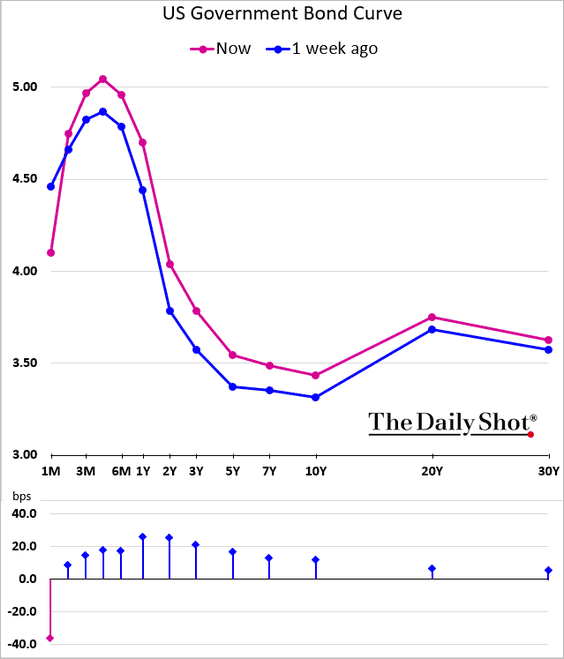
3. The inversion in the 10-year/3-month portion of the Treasury curve has been hitting multi-decade extremes.
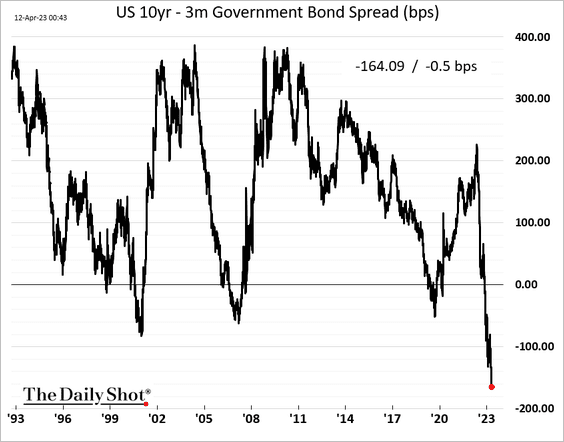
Here are the yield curve changes over the past five business days.
Back to Index
Europe
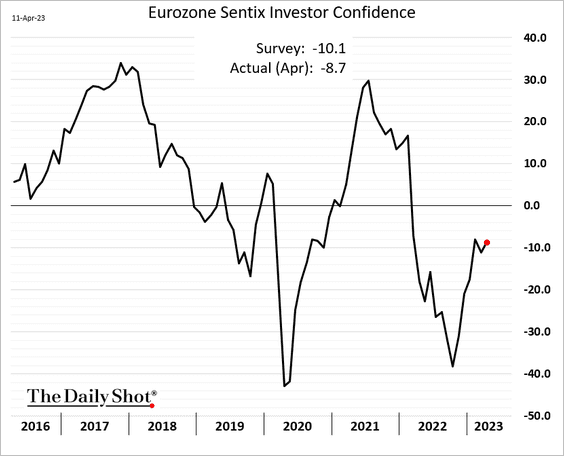
1. The Eurozone Sentix investor sentiment indicator improved this month.
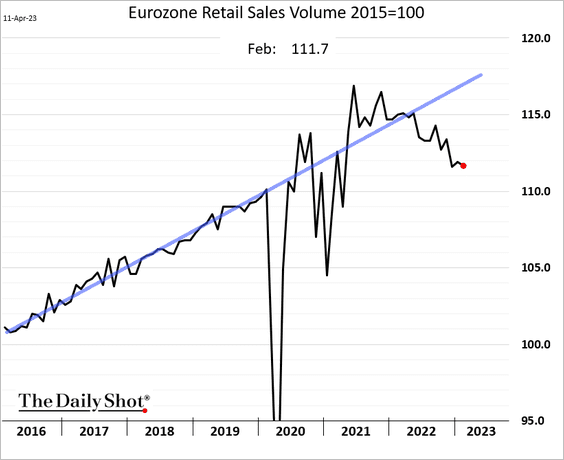
2. Euro-area real retail sales declined again in February.
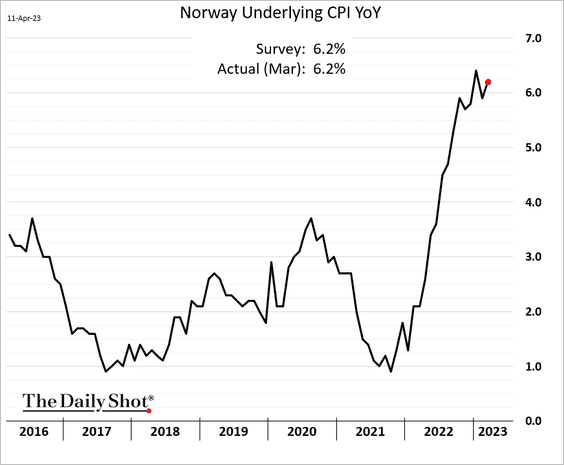
3. Norway’s underlying inflation remains elevated.
4. A significant number of young people in the EU are at risk of poverty.
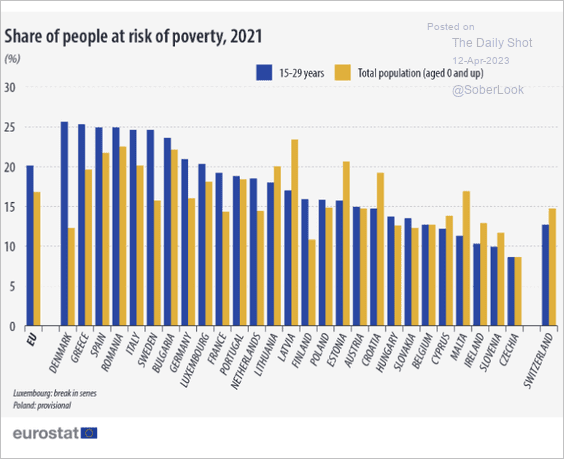 Source: Eurostat Read full article
Back to Index
Japan
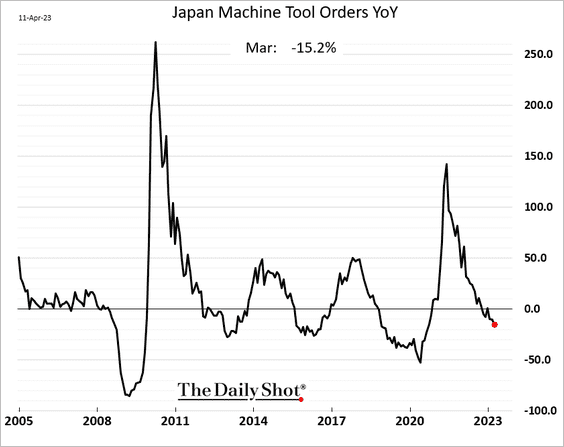
1. Machinery orders declined in February.
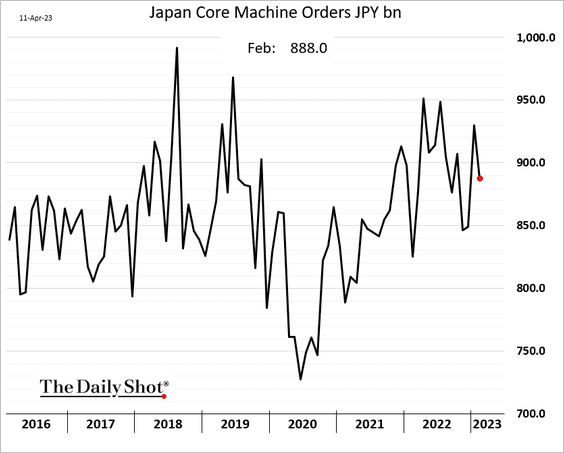
Machine tool orders are down 15% from a year ago.
——————–
2. Japanese firms expect higher inflation despite the recent softness in sales prices.
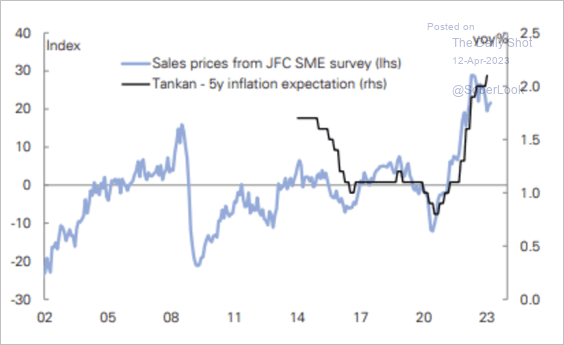 Source: Deutsche Bank Research
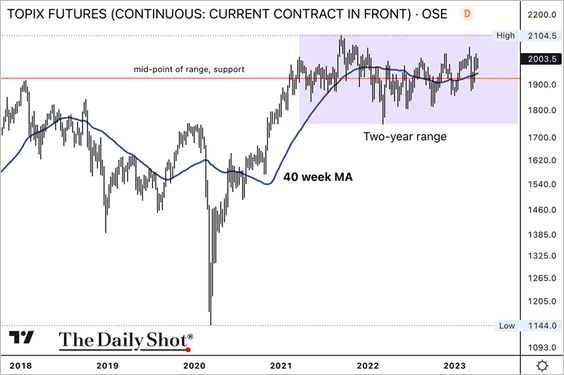
3. Next, we have some updates on the equity market.
• The TOPIX Index is holding support above its 40-week moving average, albeit confined to a two-year long range.
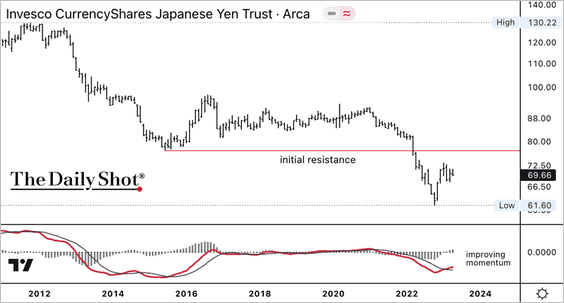
• The Invesco Japanese Yen ETF (FXY) is testing resistance, but long-term momentum has improved since the October 2022 low.
• High dividend yield stocks have outperformed in recent years.
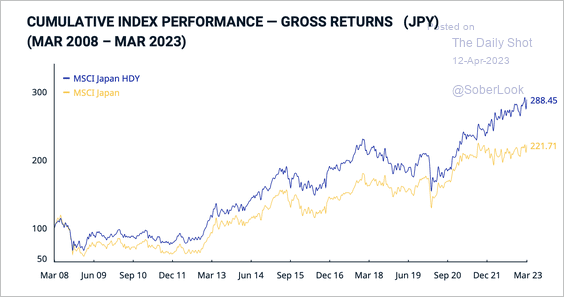 Source: MSCI Read full article
• The BoJ is collecting rich dividends from ETFs it owns.
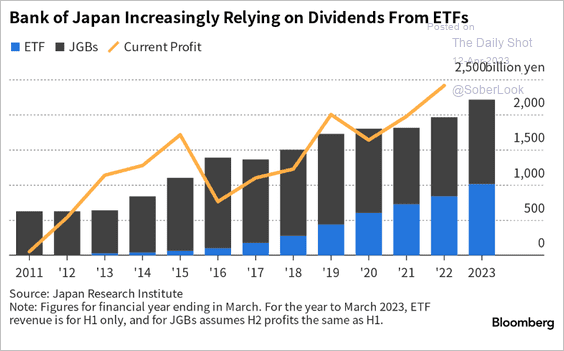 Source: Hideyuki Sano, @TakingStock Read full article
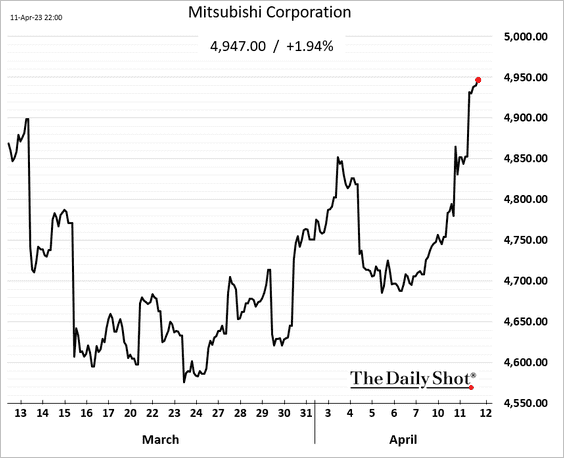
• Buffett plans to increase his investments in Japan’s biggest trading houses.
 Source: Barron’s Read full article
Back to Index
Asia – Pacific
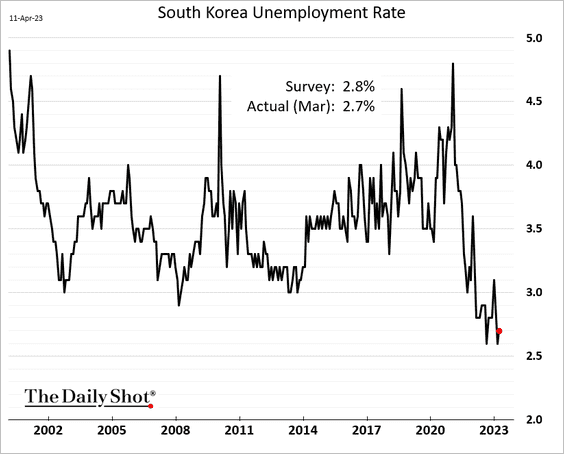
1. South Korea’s unemployment remains near multi-decade lows.
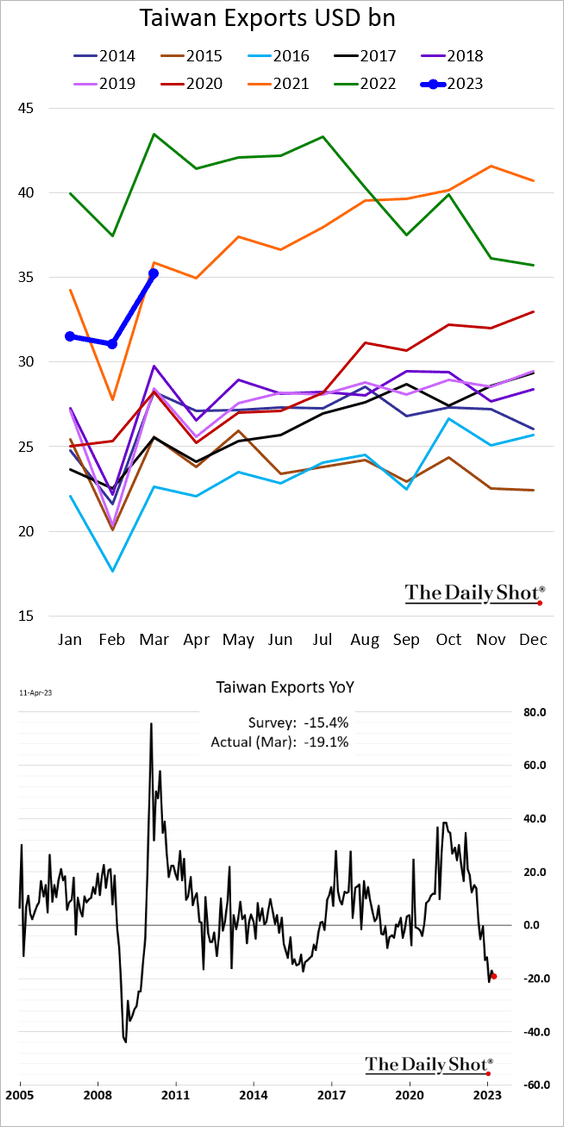
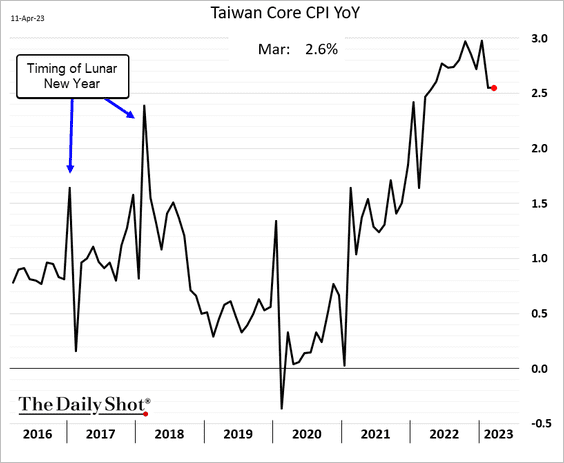
2. Taiwan’s exports were softer than expected in March.
Taiwan’s core CPI held steady last month.
Back to Index
China
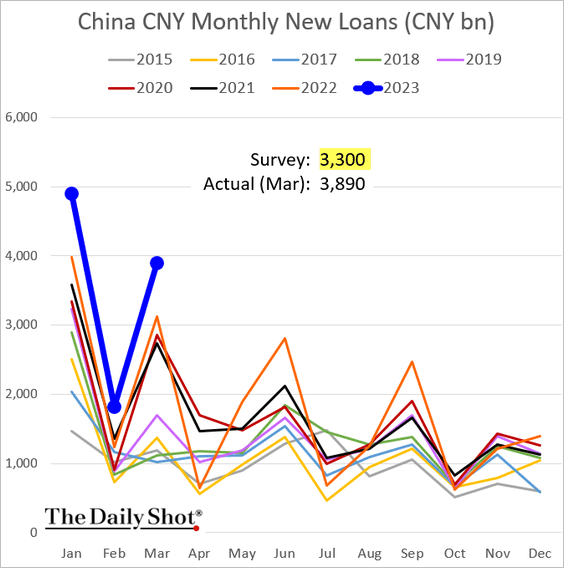
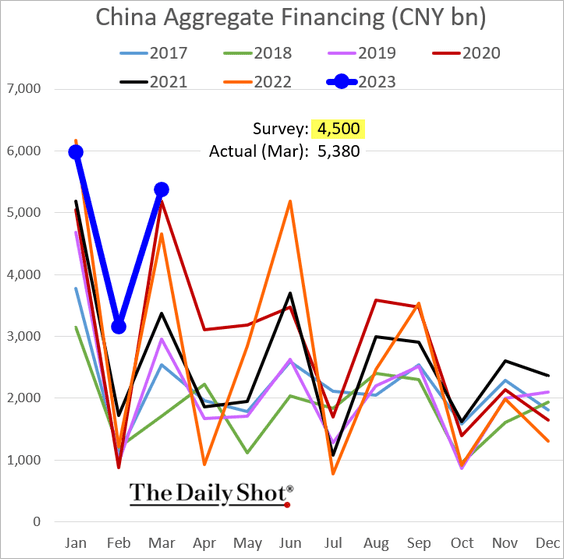
1. Credit growth topped expectations, signaling increased investment.
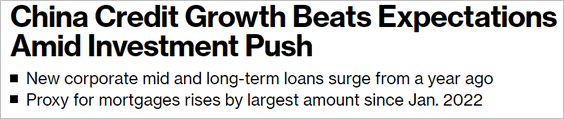 Source: @markets Read full article
• CNY loans:
• Aggregate financing:
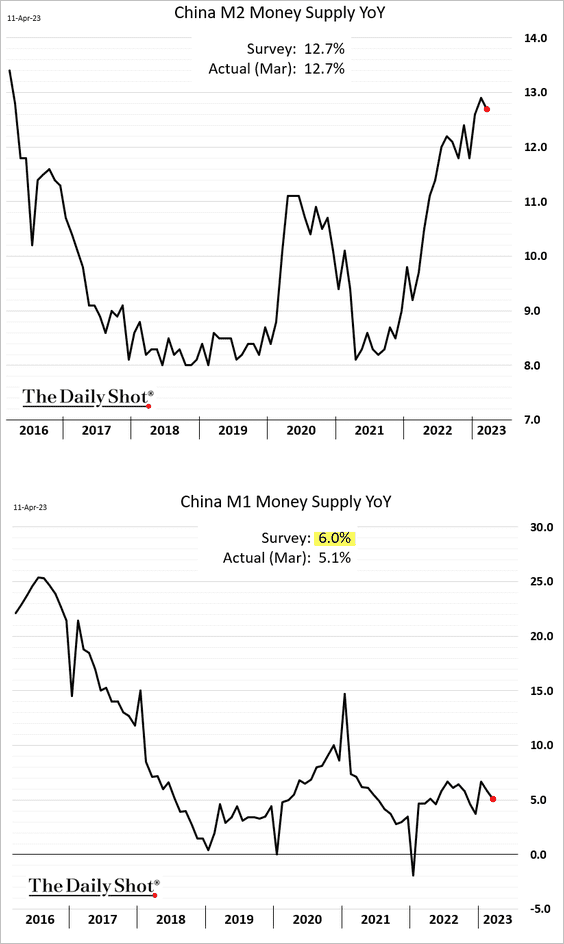
2. The money supply growth slowed.
Back to Index
Emerging Markets
1. Brazil’s inflation declined again last month.
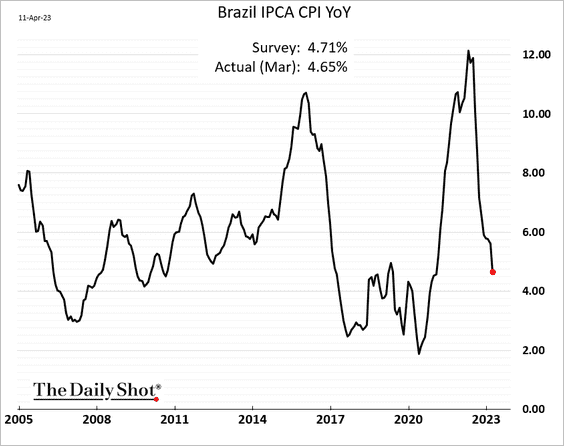
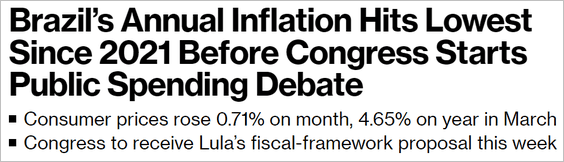 Source: @andrewrosati, @economics Read full article
——————–
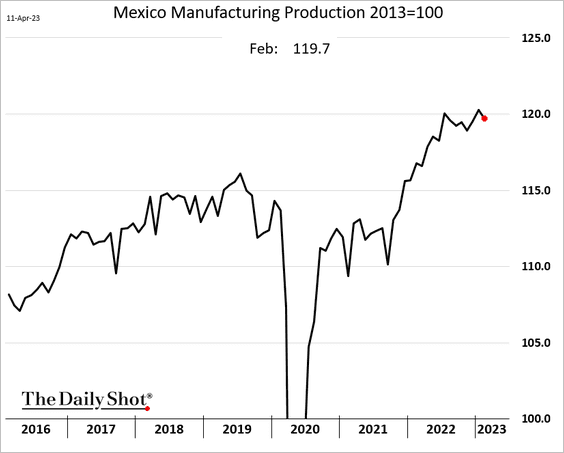
2. Mexico’s manufacturing output inched lower in February.
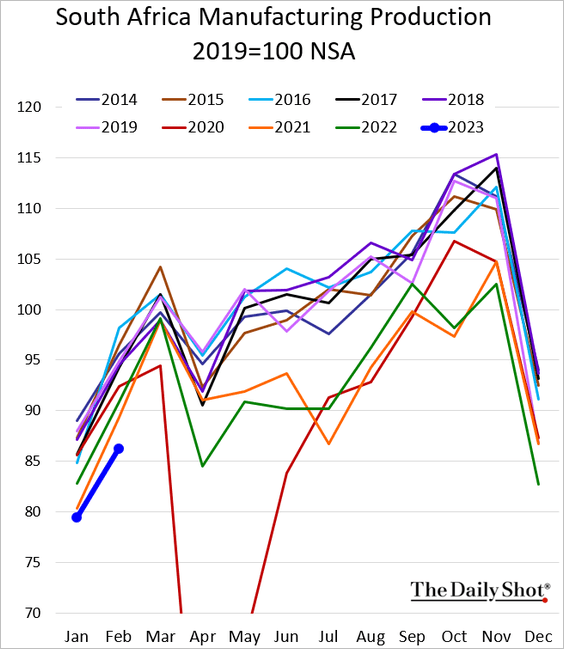
3. South Africa’s manufacturing production remains at multi-year lows.
4. Turkey’s industrial production dropped sharply in February.
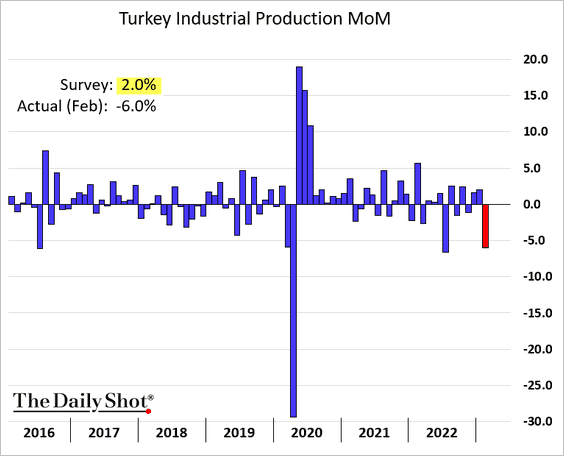
 Source: @berilakman, @economics Read full article
——————–
5. Tighter liquidity signals a deeper corporate profit contraction across emerging markets.
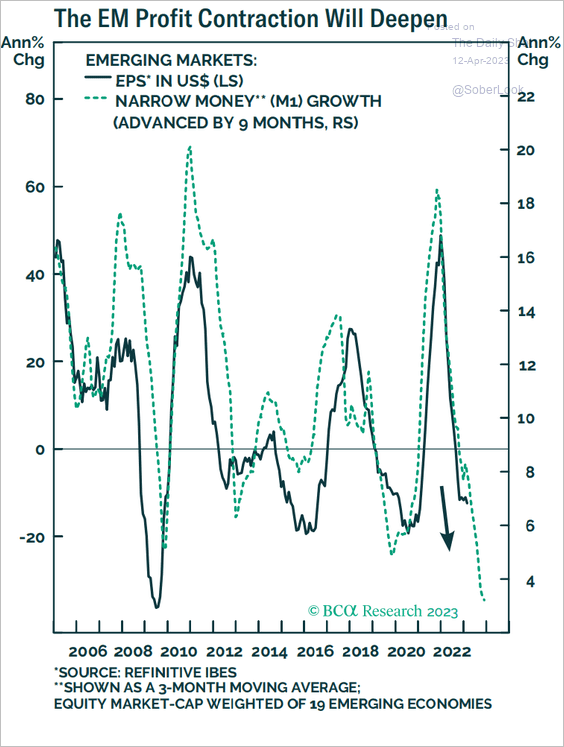 Source: BCA Research
Back to Index
Commodities
1. Gold mining shares have lagged gold prices, but the rally continues.
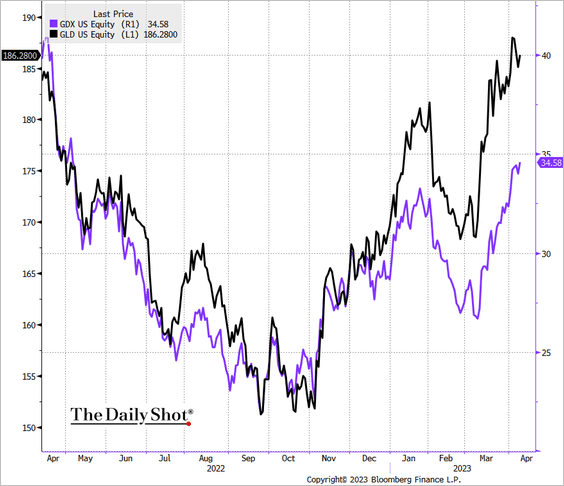 Source: @TheTerminal, Bloomberg Finance L.P.
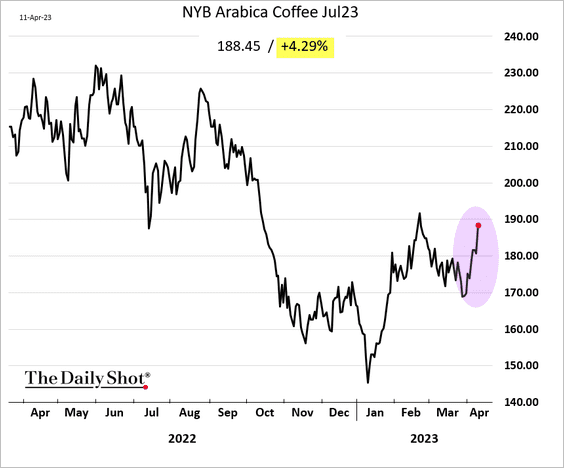
2. Softs have been on fire.
• Coffee futures are surging amid concerns over short-term supply tightness. Brazilian and Colombian farmers are in no rush to sell.
• Sugar prices are hitting multi-year highs.
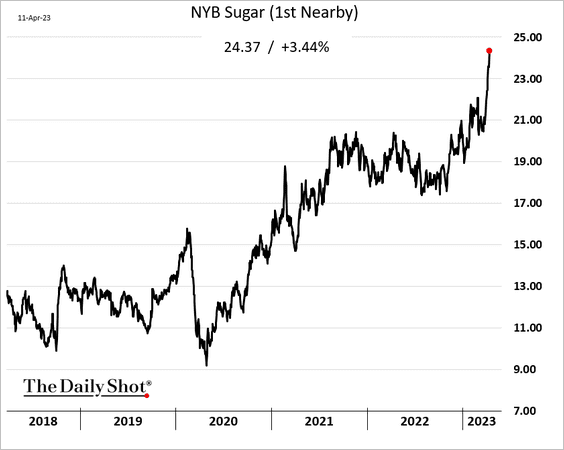
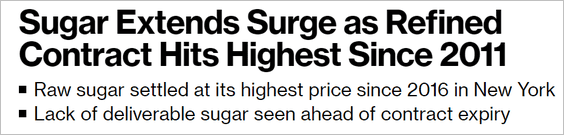 Source: @MumbiGitau, @markets Read full article
Back to Index
Energy
1. Asset managers were squeezed by OPEC’s surprise production cut (2 charts).
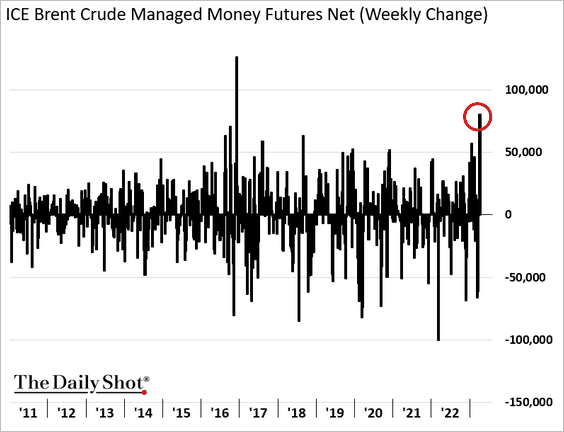
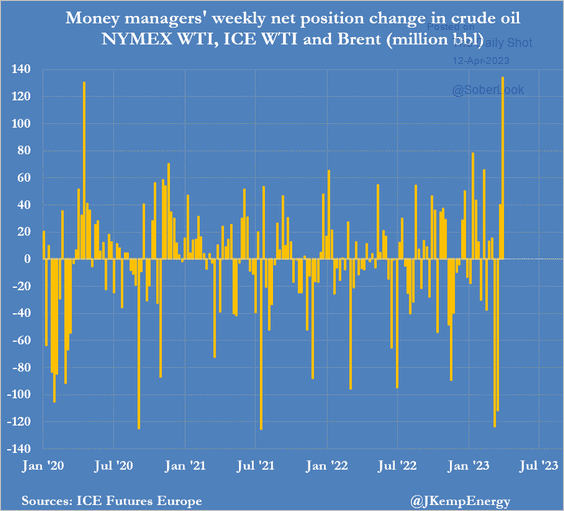 Source: @JKempEnergy
——————–
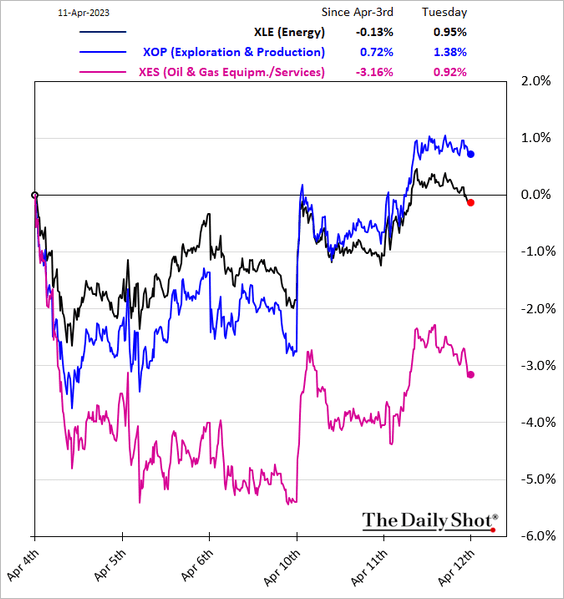
2. Shares of oil & gas services firms have been underperforming.
3. This chart shows US power generation from renewables.
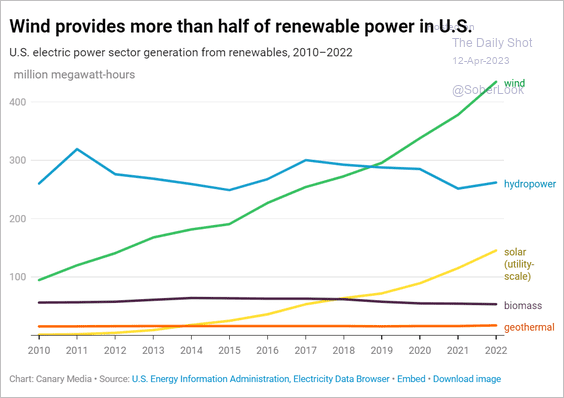 Source: Canary Media Read full article
Back to Index
Equities
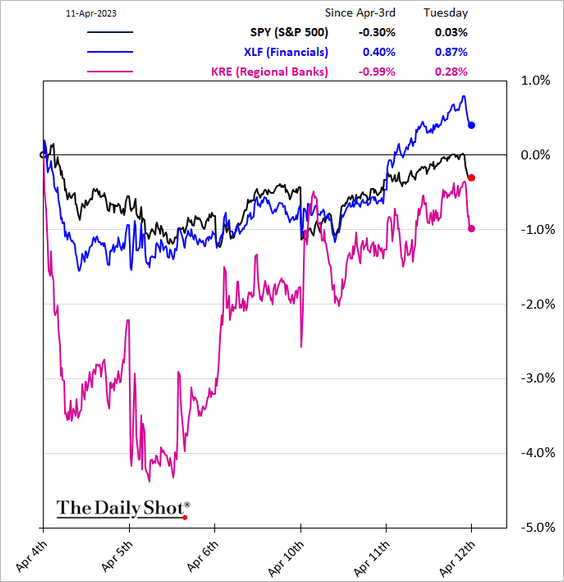
1. Financials have been rebounding.
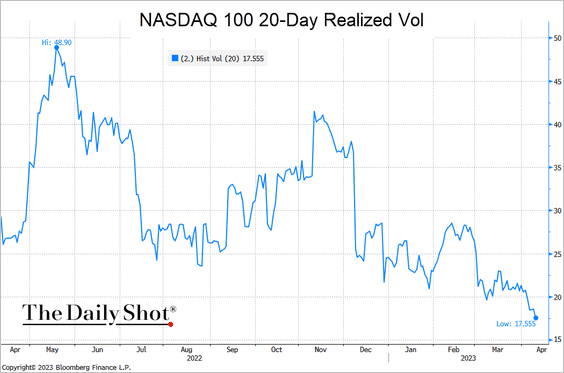
2. The calm before the storm?
3. The market is signaling an economic slowdown.
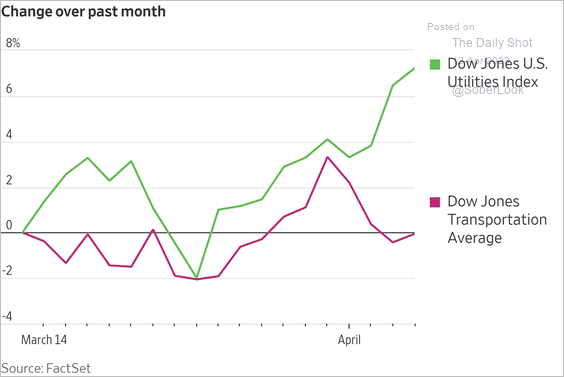 Source: @WSJ Read full article
4. Analysts continue to downgrade their S&P 500 earnings estimates for 2023 and 2024.
 Source: Yardeni Research
Here are the estimates by quarter.
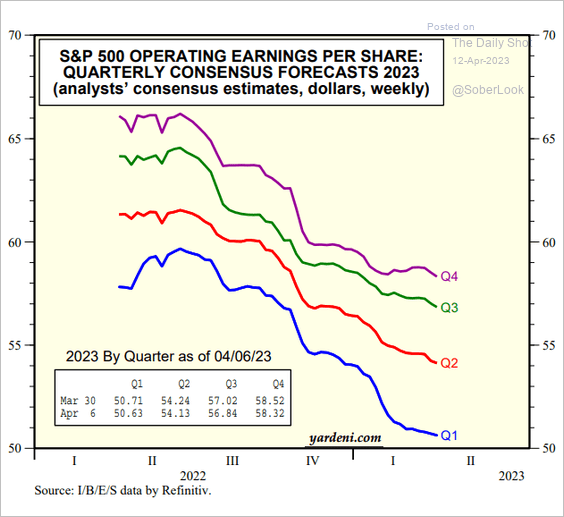 Source: Yardeni Research
Are the Q1 downgrades overdone? There is a great deal of uncertainty associated with last quarter’s earnings.
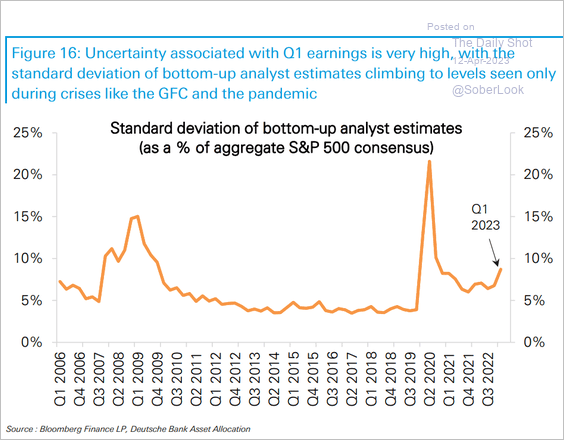 Source: Deutsche Bank Research
——————–
5. Here is a look at recent QQQ (Nasdaq 100) returns: morning vs. afternoon and overnight vs. day.
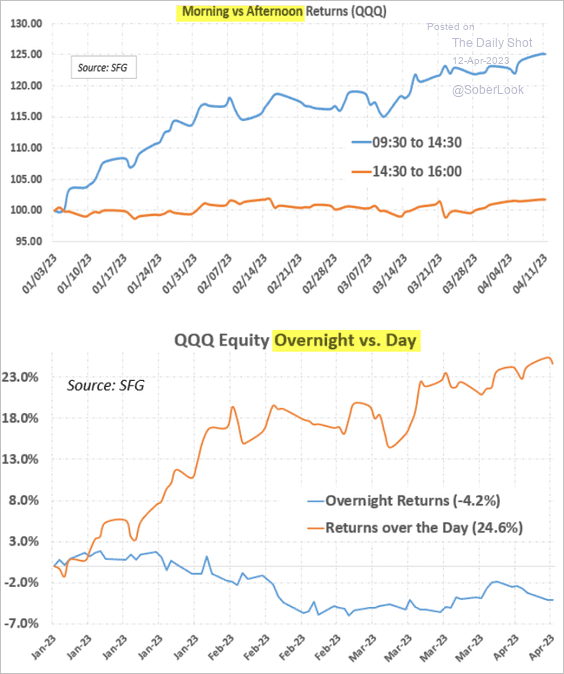 Source: Chris Murphy, Susquehanna International Group
6. The S&P 500 tends to rise 12 months after a trough in the 10s/2s Treasury curve. The yield curve leads cycle recoveries by roughly four to eight quarters, while equities lead by two to three quarters, according to Deutsche Bank.
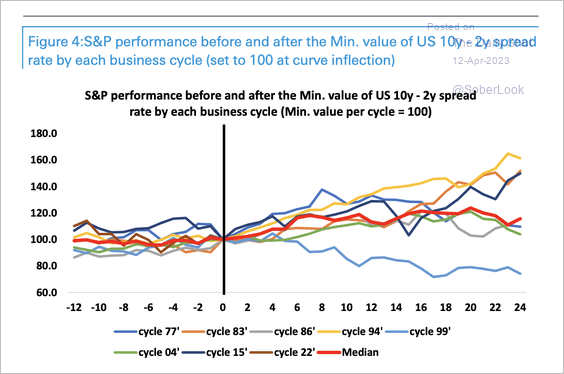 Source: Deutsche Bank Research
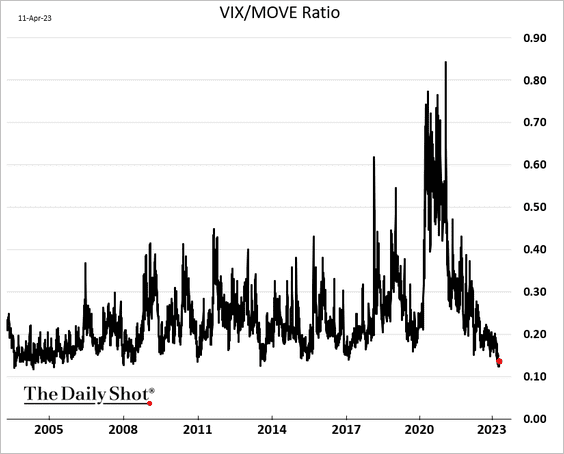
7. Equity market implied volatility remains very low relative to rates vol.
Back to Index
Alternatives
1. Let’s start with some data on private credit funds.
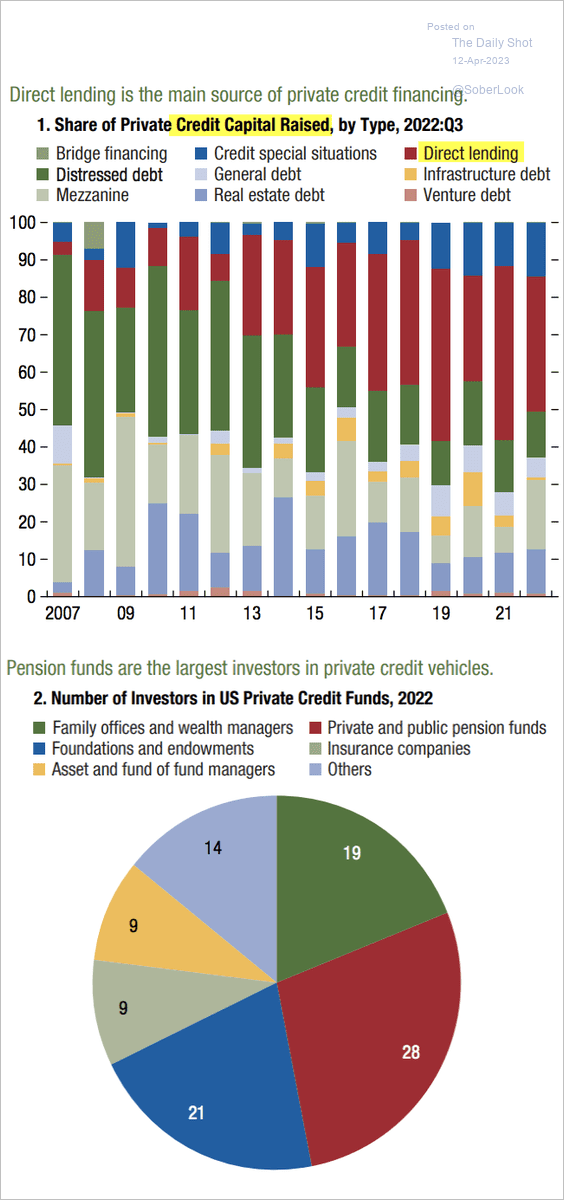 Source: IMF Read full article
2. March saw a pickup in private equity activity.
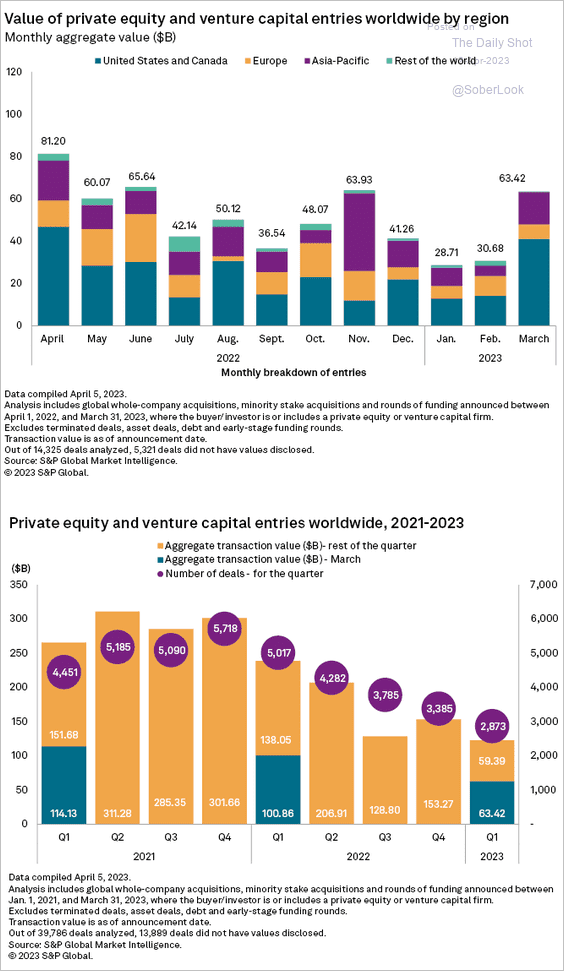 Source: S&P Global Market Intelligence
3. State and local pension plans expect higher allocations to alternatives.
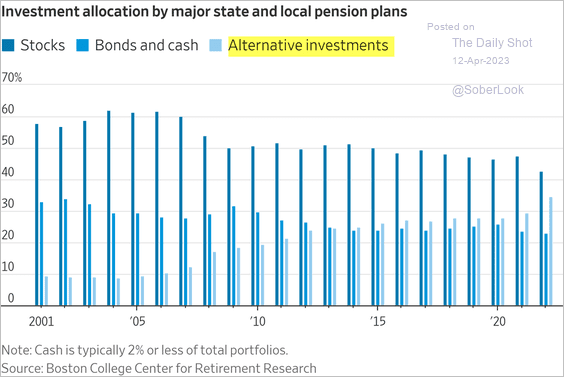 Source: @WSJ Read full article
4. Information technology and healthcare have driven median buyout multiples higher in Europe and the US.
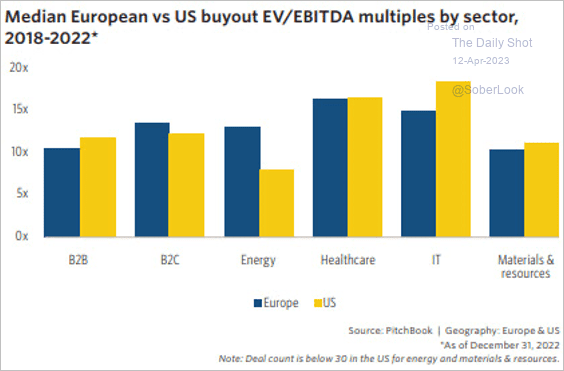 Source: PitchBook
5. There has been a significant drop in venture capital exits. Companies are finding it difficult to raise money at the multiples they hoped for, leading to smaller valuation step-ups and increased dilution, according to PitchBook.
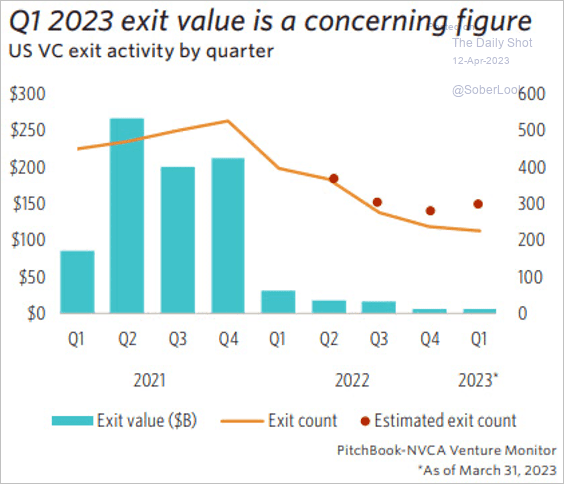 Source: PitchBook
The one-year horizon performance for $1 billion+ venture capital funds is negative.
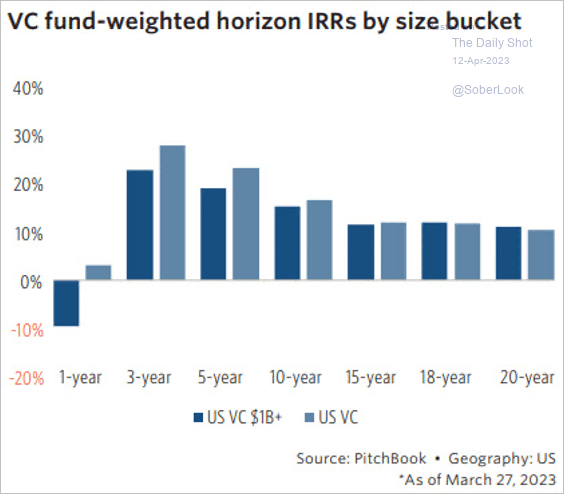 Source: PitchBook
——————–
6. Globally, only 18 unicorns (startups valued at over $1 billion) were minted in Q1 at a combined valuation of $27.1 billion, according to PitchBook. This is the lowest quarterly new unicorn count since 2017.
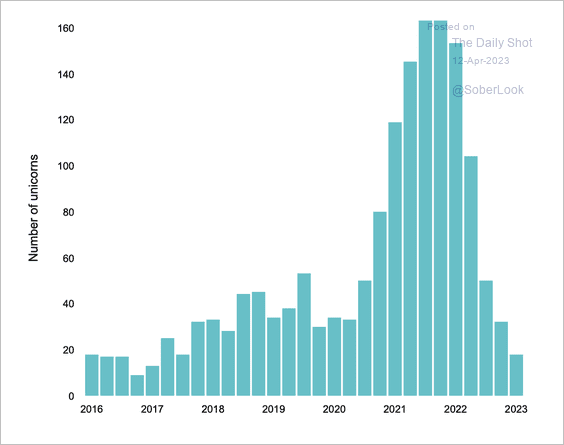 Source: PitchBook Read full article
Back to Index
Credit
1. This chart shows retail deposits, by bank.
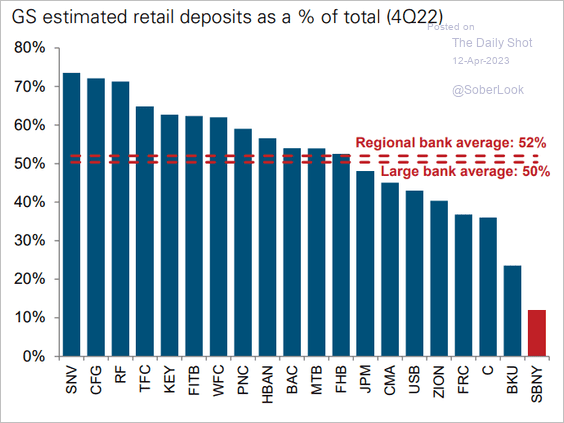 Source: Goldman Sachs
2. Community banks see a recession ahead.
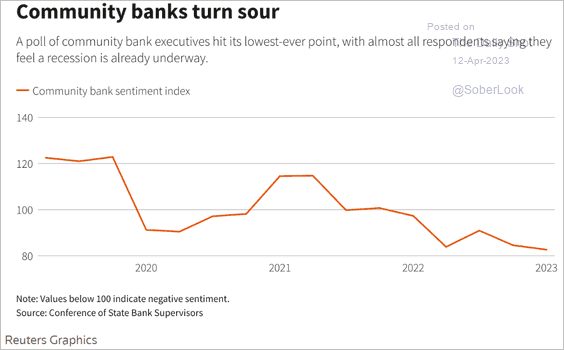 Source: Reuters Read full article
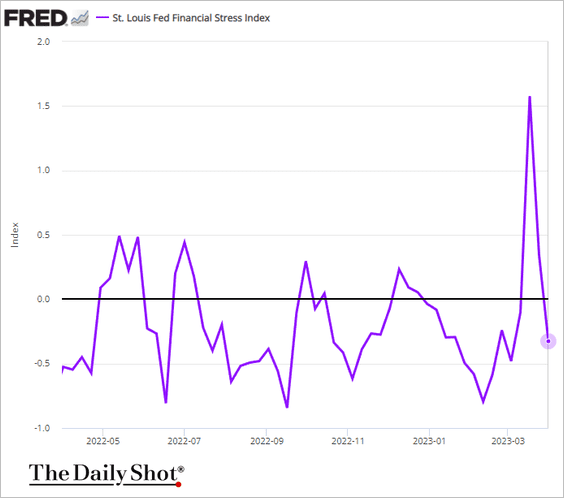
3. The St. Louis Fed Financial Stress Index is back at pre-SVB levels.
4. Here is a look at Fed liquidity usage compared to past financial shocks. (2 charts)
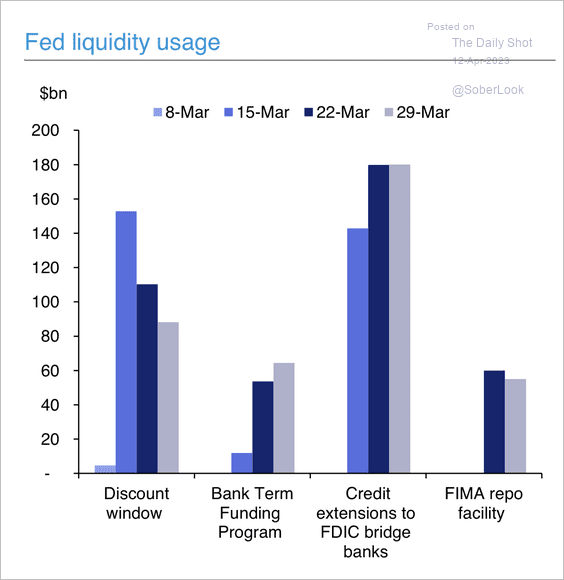 Source: Deutsche Bank Research
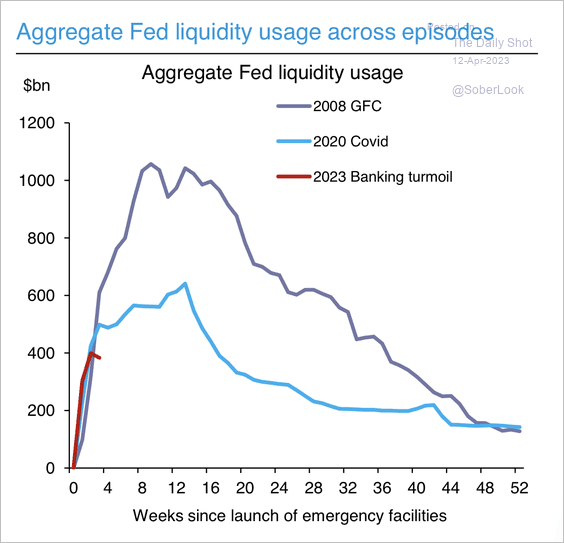 Source: Deutsche Bank Research
——————–
5. Investment-grade downgrades increased in February.
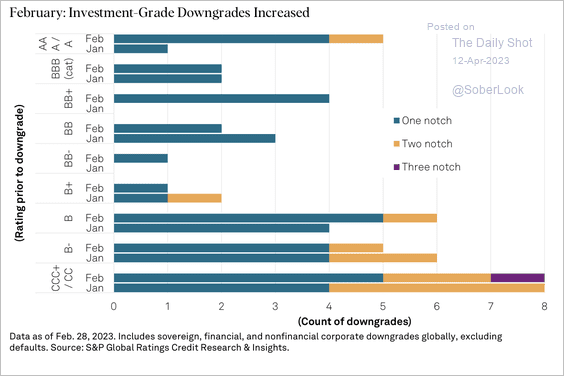 Source: S&P Global Ratings
6. Higher interest rates, wider credit spreads, and tightening lending standards will make it difficult for commercial real estate borrowers to obtain new loans.
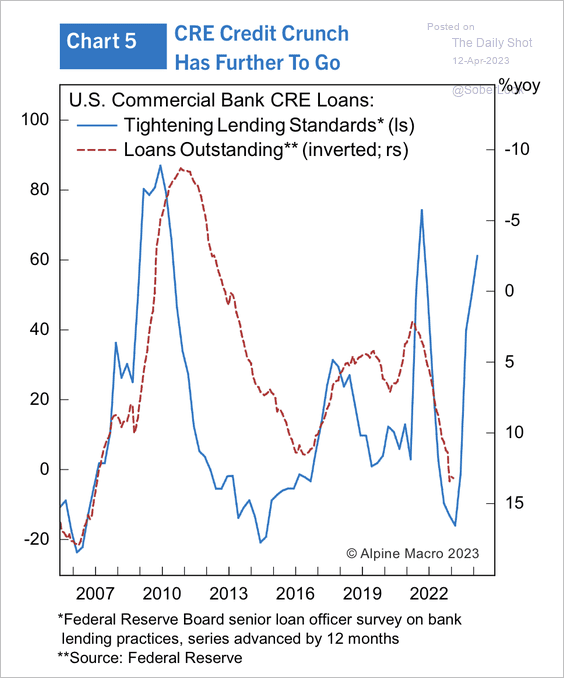 Source: Alpine Macro
7. Corporate bond settlement fails have been very high.
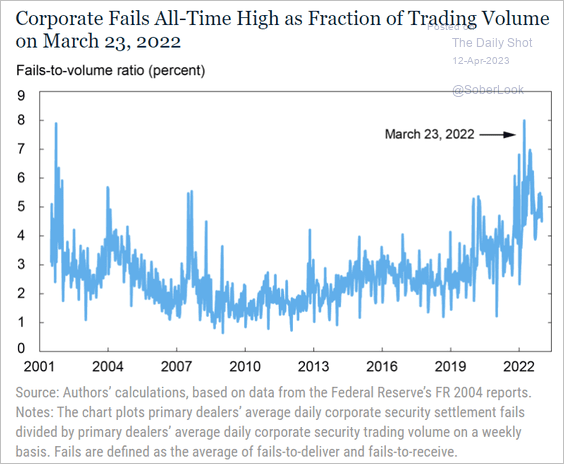 Source: Federal Reserve Bank of New York Read full article
8. Munis appear to be richly priced.
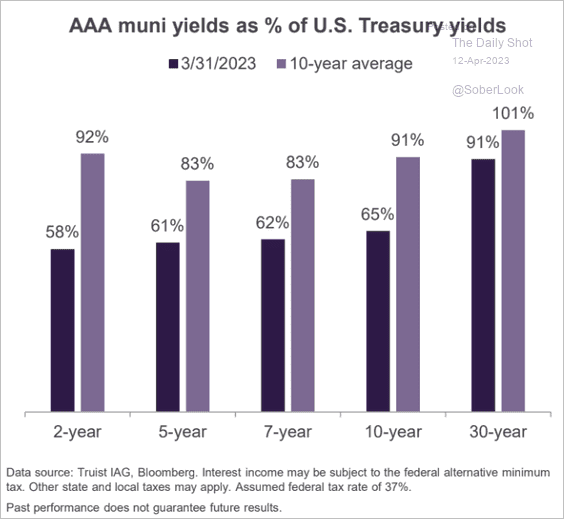 Source: Truist Advisory Services
Back to Index
Global Developments
1. Let’s start with the IMF’s GDP and inflation forecasts for selected economies.
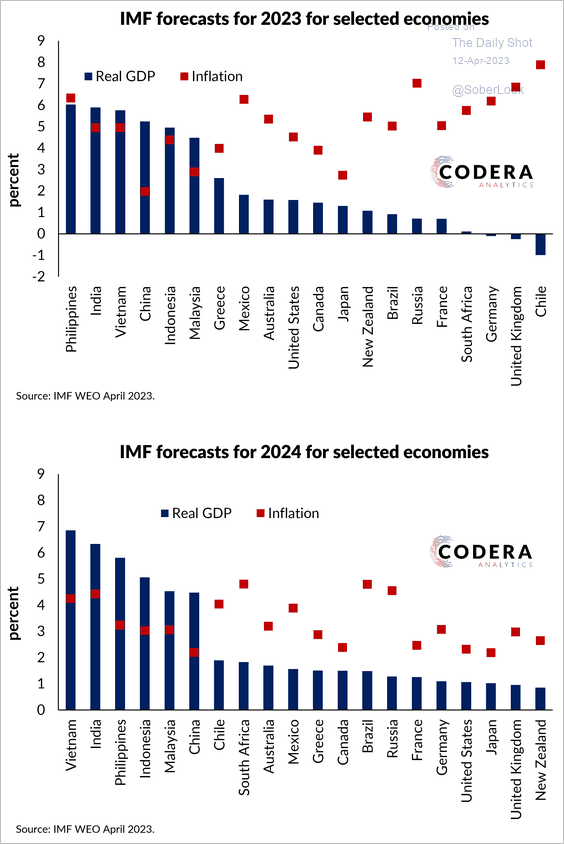 Source: Codera Analytics
Oxford Economics has a more pessimistic outlook for G7 growth than the IMF.
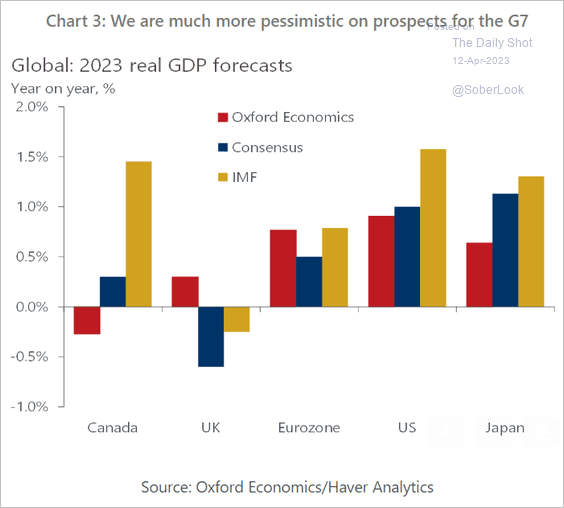 Source: Oxford Economics
——————–
2. This chart shows global equity valuations relative to the historical average and range.
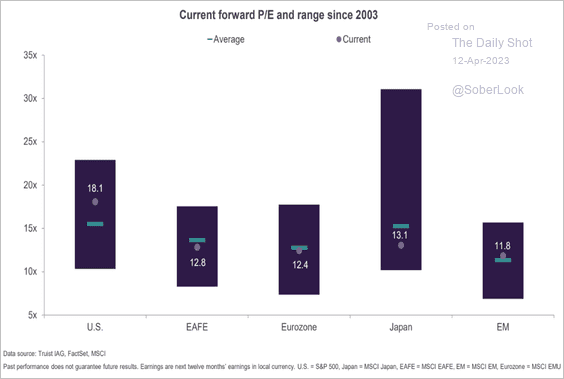 Source: Truist Advisory Services
3. Global sovereign bonds became undervalued a decade ago, which preceded a bull market. Equities reached peak valuation after the post-COVID rally.
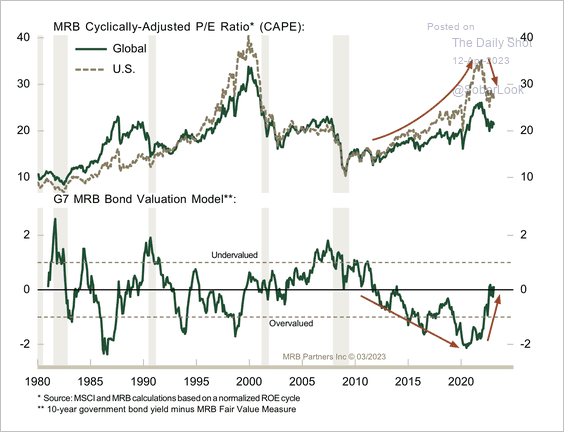 Source: MRB Partners
——————–
Food for Thought
1. Mall visits:
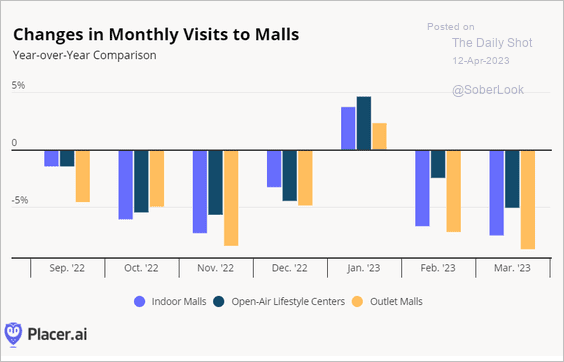 Source: Placer.ai
2. Central banks’ gold purchases:
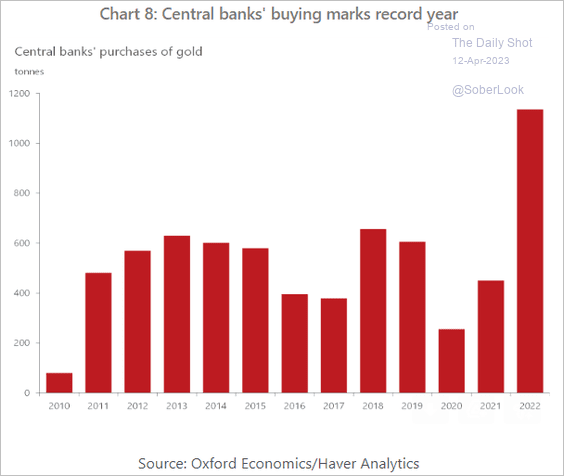 Source: Oxford Economics
3. CEO compensation in the US and UK:
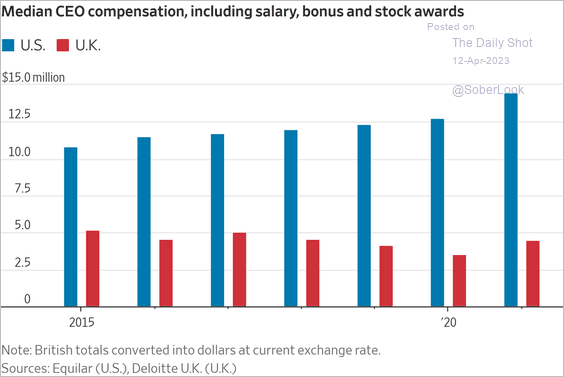 Source: @WSJ Read full article
4. US households’ prioritization of payments:
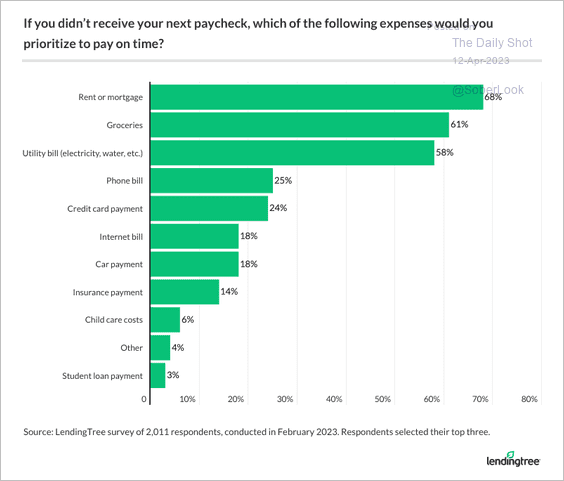 Source: LendingTree Read full article
5. Space program expenditures as a share of government spending:
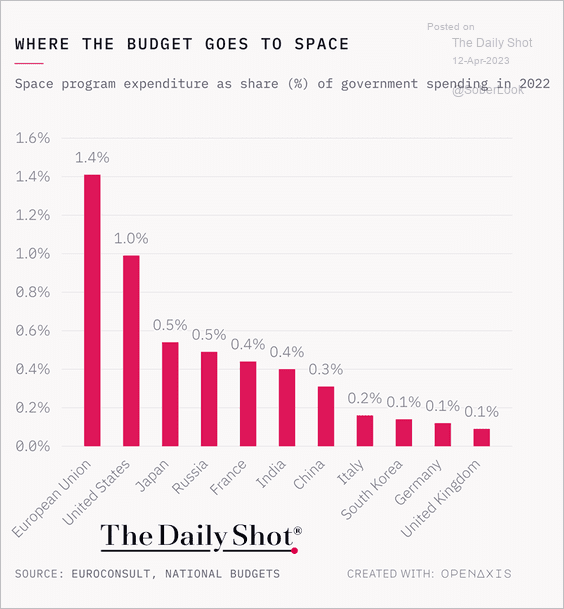 Source: @TheDailyShot
6. US hourly electricity generation by source:
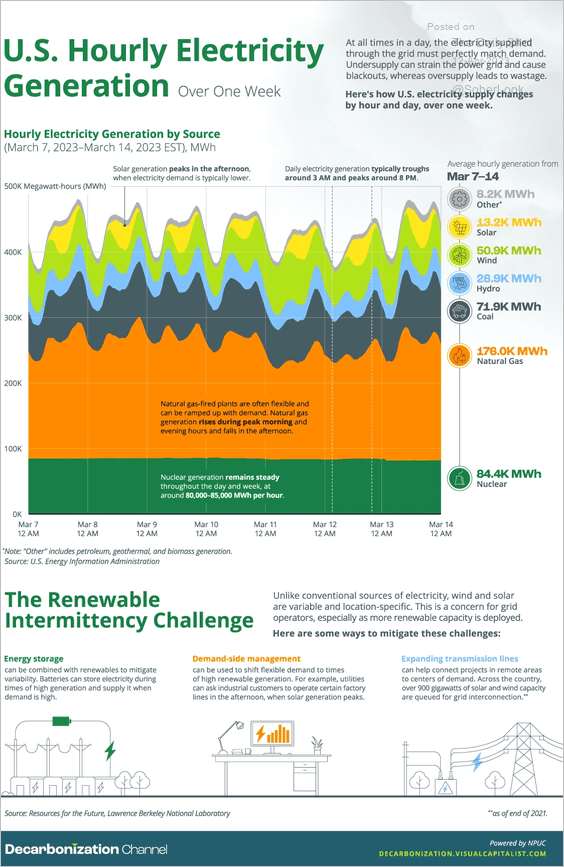 Source: Visual Capitalist Read full article
7. Political ad spending on Facebook and Google:
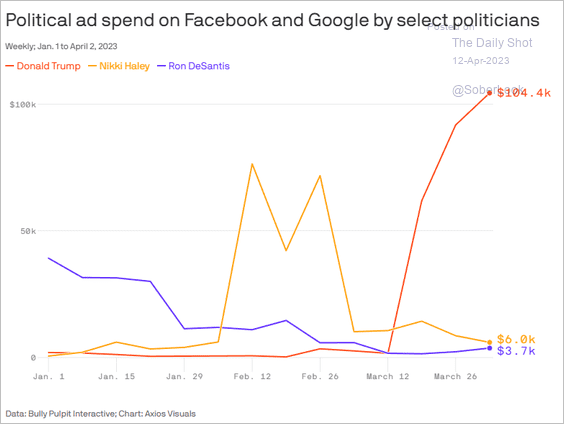 Source: @axios Read full article
8. Big chickens:
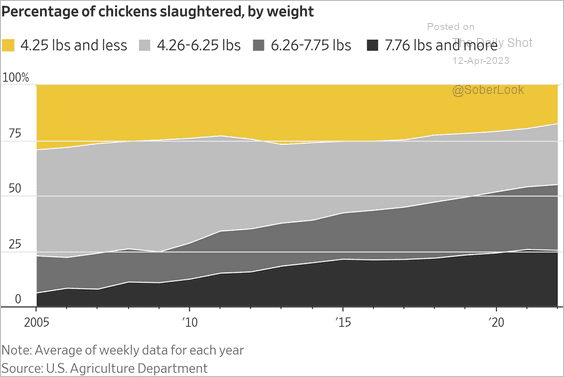 Source: @WSJ Read full article
——————–
Back to Index